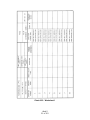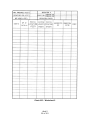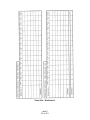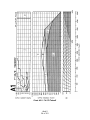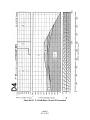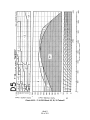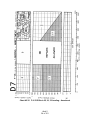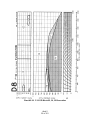
1
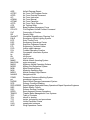
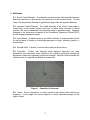
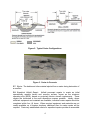
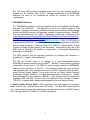
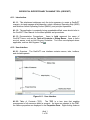
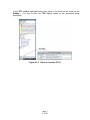
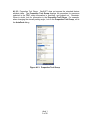
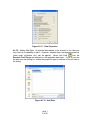
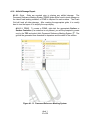
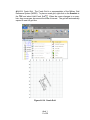
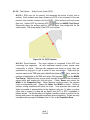
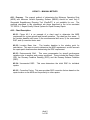
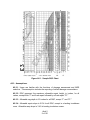
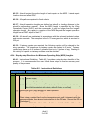
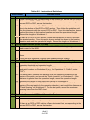
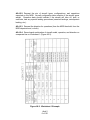
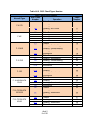
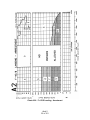
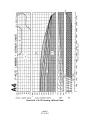
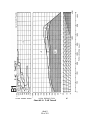
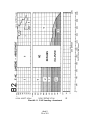
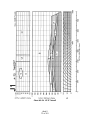
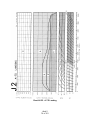
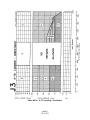
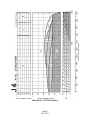
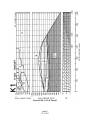
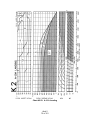
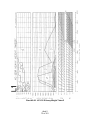
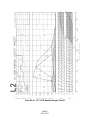
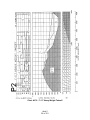
DEPARTMENT OF THE AIR FORCE AIR FORCE CIVIL ENGINEER CENTER TYNDALL AIR FORCE BASE FLORIDA 18 Jan 2013 FROM: AFCEC/DD 139 Barnes Drive Suite 1 Tyndall AFB FL 32403-5319 SUBJECT: Engineering Technical Letter (ETL) 13-3: Minimum Airfield Operating Surface Selection and Repair Quality Criteria 1. Purpose. Establish approved Air Force procedures for Minimum Airfield Operating Surface (MAOS) selection and determining Repair Quality Criteria (RQC). 2. Application. All Air Force organizations responsible for airfield recovery operations. 2.1. Authority. Air Force Policy Directive (AFPD) 32-10, Installations and Facilities. 2.2. Effective Date. Immediately. 2.3. Intended Users. Air Force Prime Base Engineer Emergency Force (Prime BEEF) and Rapid Engineer Deployable Heavy Operational Repair Squadron Engineers (RED HORSE) units. 2.4. Coordination. Major command (MAJCOM) A7s. 3. Referenced Publications. Insert URLs. 3.1. Air Force Instructions (AFI): 10-209, RED HORSE Program 10-210, Prime Base Engineer Emergency Force (BEEF) Program 3.2. Air Force Pamphlet (AFPAM) 10-219, Volume 4, Airfield Damage Repair Operations 3.3. Unified Facilities Criteria (UFC) 3-270-07, Airfield Damage Repair 4. Acronyms. Note: The acronyms and terms shown below may not always agree with Joint Publication 1-02, DoD Dictionary of Military and Associated Terms, or Air Force Doctrine Document (AFDD) 1-2, Air Force Glossary, but are common to the engineering community as a whole. APPROVED FOR PUBLIC RELEASE: DISTRIBUTION UNLIMITED ADR AFCEC AFDD AFI AFMAN AFPAM AFPD ATO BEEF CE-UCC CoP DR GeoExPT EALS ECP EOC EOD ETL FOD FOL GIS kg kip LoR MAAS MAJCOM MAOS MGRS MOB MOS MRES NAVAID PRMS psi RADAS RCR RED HORSE RQC RSC SPRO TBMCS TOC TOL TTP UFC UXO WOC Airfield Damage Repair Air Force Civil Engineer Center Air Force Doctrine Document Air Force Instruction Air Force Manual Air Force Pamphlet Air Force Policy Directive Air Tasking Order Base Engineer Emergency Force Civil Engineer-Unified Combat Command Community of Practice Density Ratio Geospatial Expeditionary Planning Tool Emergency Airfield Lighting System Entry Control Point Emergency Operations Center Explosive Ordnance Disposal Engineering Technical Letter foreign object damage Forward Operating Location Geographic Information System kilogram kilo-pound level of repair Mobile Aircraft Arresting System major command Minimum Airfield Operating Surface Military Grid Reference System Main Operating Base Minimum Operating Strip Mobile Runway Edge Sheave Navigational Aid Pavement Reference Marking System pounds per square inch Rapid Airfield Damage Assessment System Runway Condition Reading Rapid Engineer Deployable Heavy Operational Repair Squadron Engineers Repair Quality Criteria Runway Surface Condition Semi-prepared Runway Operations Theater Battle Management Core Systems Table of Contents takeoff or landing tactics, techniques, and procedures Unified Facilities Criteria unexploded ordnance Wing Operations Center 2 5. Definitions. 5.1. Actual Crater Diameter: The diameter across the crater after heaved pavement has been removed; in other words, the actual size of the required repair. In most cases, the actual crater diameter is significantly larger than the apparent diameter. 5.2. Apparent Crater Diameter: The visible diameter of the crater, inside edge to inside edge, at the original surface level prior to debris being removed. In actual practice, this can be measured from pavement edge to pavement edge. Apparent diameter is the information forwarded to the Emergency Operations Center (EOC) by the damage assessment teams. 5.3. Apron/Ramp: A defined area on an airfield intended to accommodate aircraft for the purposes of loading or unloading passengers or cargo, refueling, parking, or maintenance. 5.4. Bomblet Field: A cluster of sub-munitions within a defined area. 5.5. Camouflet: Craters with relatively small apparent diameters, but deep penetration and subsurface voids created by the munition puncturing through the pavement surface and exploding in the base material. Munitions that penetrate the surface but do not explode are treated as a camouflet. Figure 1. Camouflet in Concrete 5.6. Crater: The pit, depression, or cavity formed in the surface of the earth by an explosion. It may range from saucer-shaped to conical, depending largely on the depth of burst. 3 Figure 2. Typical Crater Configurations Figure 3. Crater in Concrete 5.7. Ejecta: The debris and other material ejected from a crater during detonation of a munition. 5.8. Expedient Airfield Repair: Airfield pavement repairs to create an initial operationally capable launch and recovery surface, known as the minimum operating strip (MOS), based on projected mission aircraft requirements. These repairs are conducted in the most expeditious manner possible. Ideally, where sufficient equipment and materials are available, individual crater repairs should be completed within four (4) hours. When required equipment and materials are not readily available, as in austere locations, additional time for crater repairs will be required. Previously established criteria for expedient repairs provide an accessible 4 and functional MOS that will sustain 100 passes of a C-17 aircraft with a gross weight of 227,707 kilograms (kg) (502 kilo-pounds [kip]); a C-130 aircraft with a gross weight of 79,380 kg (175 kip); or an F-15E aircraft with a gross aircraft weight of 36,741 kg (81 kip). Expedient repairs on the MAOS for mission aircraft requiring a foreign object damage (FOD) cover are not approved for most non-fighter aircraft. Refer to UFC 3-270-07, Airfield Damage Repair, Table 2-1, to determine repair suitability for specific aircraft. 5.9. Infield: Areas (paved or unpaved) on the airfield encompassed (or surrounded) by other operational surfaces. 5.10. Pavement Upheaval. The vertical displacement of the airfield pavement around the edge of an explosion-produced crater. The pavement upheaval is within the crater damage diameter, but is outside the apparent crater diameter. In other words, it is that part of the pavement out of “flush” tolerance that is elevated above the adjacent undamaged surface. 5.11. Permanent Airfield Repair: This repair increases the MAOS to sustain 50,000 or more C-17 passes with a gross weight of 263,008 kg (580,000 lb), or 50,000 C-130 passes with a gross weight of 79,380 kg (175 kip), or to support a Servicedefined airfield design type, depending upon mission aircraft, in accordance with UFC 3-260-02, Pavement Design for Airfields. 5.12. Runway: A defined rectangular area of an airfield, prepared for the landing and takeoff run of aircraft along its length. 5.13. Semi-Prepared Runway Operation (SPRO): A takeoff and landing (TOL) surface consisting of stabilized material, aggregate, or soil, as well as unimproved surfaces such as dry lake beds and grass strips. 5.14. Shoulders: Prepared (paved or unpaved) areas adjacent to the edge of an operational pavement. 5.15. Spall: Pavement damage that does not penetrate through the pavement surface to the underlying soil layers. A spall damage area could be up to 1.5 meters (5 feet) in diameter. 5.16. Spall Field: A cluster of spalls within a defined area. 5.17. Sustainment Airfield Repair: Repairs that upgrade expedient repairs for increased aircraft traffic. These repairs are conducted as soon as the operational tempo permits and are expected to support the operation of 5,000 passes of a C-17 aircraft with a gross weight of 227,707 kg (502 kip), a C-130 aircraft with a gross weight of 79,380 kg (175 kip), or an F-15E aircraft with a gross aircraft weight of 36,741 kg (81 kip). Repairs should support the expected number of passes with only routine maintenance. To minimize maintenance and maintain operational 5 tempo, quality control is more important than construction time for sustainment repairs. 5.18. Taxiway: A specially-prepared or designated path on an airfield or heliport, other than apron areas, on which aircraft move under their own power to and from landing, takeoff, service, and parking areas. 5.19. UXO: Explosive ordnance which has been primed, fused, armed, or otherwise prepared for action, and which has been fired, dropped, launched, projected, or placed in such a manner as to constitute a hazard to operations, installations, personnel, or material, and remains unexploded either by malfunction or design. Figure 4. Unexploded Ordnance 6. Background. 6.1. Airfield Damage Repair (ADR) encompasses all actions required to rapidly prepare airfield operating surfaces and infrastructure to establish or sustain operations at new Forward Operating Locations (FOLs) or recover operations at a Main Operating Base (MOB). Some key components of ADR are: Airfield damage assessment Locating, classifying, and measuring the damage (camouflet, crater, spall, and UXO) on the airfield operating surfaces. Minimum Operating Strip (MOS)/Minimum Airfield Operating Surface (MAOS) selection Analyzing damage and available airfield surfaces to locate the minimum pavement requirement for takeoff, landing, and evacuation operations, and the minimum taxiway and MOS combinations to most efficiently support aircraft operations. UXO clearance Performing render-safe operations on unexploded ordnance. Damage repair Rapidly repairing camouflets, craters, and spalls. Aircraft arresting systems Installing mobile aircraft arresting systems (MAAS) and Mobile Runway Edge Sheaves (MRES). Marking and striping the MAOS Restoration of airfield markings and pavement striping. Airfield lighting Installing emergency airfield lighting (EALS) for low visibility operations. 6 6.2. The entire ADR process is allocated eight hours from last munition impact to support the Air Tasking Order (ATO). Damage assessment and MOS/MAOS selection will need to be completed as quickly as possible to meet ATO requirements. 7. MOS/MAOS Selection. 7.1. MOS/MAOS selection can be accomplished using the Geospatial Expeditionary Planning Tool (GeoExPT). This application runs on an existing license of Esri software. It performs contingency beddown planning, aircraft parking, airfield damage plotting, and MAOS selection, and produces a variety of reports and maps. GeoExPT may be downloaded from the 3E5X1 Engineering Community of Practice (CoP) (https://wwwd.my.af.mil/afknprod/ASPs/docman/DOCMain.asp?Tab=0&FolderID=O O-EN-CE-48-22-5&Filter=OO-EN-CE-48). You can also request a copy from the AFCEC Reachback Center at [email protected], DSN 312-523-6995 or commercial 850-283-6995. The MAOS selection process and algorithms in GeoExPT are the same as those in Technical Order (TO) 35E2-4-1, Repair Quality Criteria System for Rapid Runway Repair (to be rescinded). Instructions for the use of the ADR tools in GeoExPT are detailed in Attachment 1, “Geospatial Expeditionary Planning Tool (GeoExPT).” 7.2. MOS selection can be manually performed by following the directions in Attachment 2, “Legacy –Manual Method.” 7.3. The Air Force’s intent is to migrate to a semi-automated/automated MOS/MAOS selection method using GeoExPT. GeoExPT should replace graphical interpolation of the charts in TO 35E2-4-1 as the primary method for MOS/MAOS selection upon publication of this ETL. The process is faster and more accurate, and integrates with other automated tools such as EOD’s Tarantula‐Hawk remotely‐ piloted aircraft (where fielded), future tools such as the Rapid Airfield Damage Assessment System (RADAS), and other business mission systems (e.g., Theater Battle Management Core Systems (TBMCS)). Units should posture to enable this capability within the EOC, linked to the Civil Engineer-Unified Combat Command (CE-UCC), to enable better planning and preparation for post-attack recovery. 8. Repair Quality Criteria (RQC). RQC calculations are only required for expedient repair methods (e.g., crushed stone with FOD cover). The new ADR repair methods (e.g., rapid-setting concrete) are considered a semi-permanent repair. GeoExPT makes use of the algorithms in TO 35E2-4-1 for RQC calculations. 7 9. Point of Contact. Recommendations for improvements to this ETL are encouraged and should be furnished to the Director, Readiness, AFCEC/CX, 139 Barnes Drive, Suite 1, Tyndall AFB, FL 32403-5319, DSN 523-6123, commercial (850)283-6123, or email: [email protected]. DAVID L. REYNOLDS, Colonel, USAF Deputy Director 3 Atch 1. Geospatial Expeditionary Planning Tool (GeoExPT) 2. Legacy – Manual Method 3. Distribution List 8 GEOSPATIAL EXPEDITIONARY PLANNING TOOL (GEOEXPT) A1.1. Introduction. A1.1.1. This attachment addresses only the tools necessary to create a GeoExPT scenario, plot and manage airfield damage, select a Minimum Operating Strip (MOS) and Minimum Airfield Operating Surface (MAOS), and print/plot operations. A1.1.2. The application is constantly being upgraded/modified; users should refer to the GeoExPT User Manual for the latest updates and procedures. A1.1.3. Documentation Conventions. Items in bold represent the name of GeoExPT items, such as the Table of Contents or Dialog Boxes. Items in italics are tool names, such as Add Runway Centerline. Tool icons are displayed where applicable, such as Add Segment Tool . A1.2. User Interface. A1.2.1. Overview. The GeoExPT user interface contains menus, tabs, toolbars, and dockable panels. Figure A1.1. User Interface A1.2.2. Table of Contents (TOC). The TOC is a tree view that enables management of all resources within a scenario. As items are selected in the TOC, the feature properties are displayed in the Properties Pane. Right-clicking features Atch 1 1 of 30 in the TOC enables applicable tools (only some of the tools can be found on the Ribbon). It is best to filter the TOC display based on the operations being performed. Figure A1.2. Table of Contents (TOC) Atch 1 2 of 30 A1.2.3. Properties Tool Group. GeoExPT does not expose the standard feature attribute table. The Properties Tool Group displays the properties for resources selected in the TOC; some information is read-only, and grayed out. Reminder: When in doubt, look for information in the Properties Tool Group. For example, when changing the aircraft parking angle, look in the Properties Tool Group, not in the AutoPark dialog. Figure A1.3. Properties Tool Group Atch 1 3 of 30 A1.2.4. Layer Manager. The Layer Manager displays currently loaded data. GeoExPT required layers are grayed out and cannot be removed. The standard Esri layer management tools are available by double-clicking the layer name. Figure A1.4. Layer Manager A1.3. Scenario Settings. A1.3.1. Airfield Damage Folder. This is a system folder containing airfield damage shapefiles. These files are generated from external sources such as RADAS. More details on using these files is in paragraph A1.6.3.3. Checking the Enable Airfield Damage Monitoring turns on a simple folder sniffer to notify the user when new files are added. A1.3.2. Airfield Damage Archive Folder. This is a system folder containing archived damage shapefiles. It copies the data in the Airfield Damage Folder (typically GeoExPT does not control this folder, so archiving the data ensures no data loss). Files are only archived if the Enable Airfield Damage Archiving is checked. A1.3.3. Route Weights. The Routing Weights is the criteria used when selecting the taxi routes as part of the Minimum Airfield Operating Surface (MAOS). High Distance looks for the shortest route, while high Damage avoids the maximum amount of damage. Atch 1 4 of 30 A1.3.4. Upheaval Factor. The Upheaval Factor is the multiplier applied to craters when imported into a GeoExPT scenario. It has no effect when manually plotting damage. Figure A1.5. Scenario Settings A1.4. Useful General Tools. A1.4.1. Navigation Tools. The standard navigation tools of Zoom In , Zoom Out , Pan , Zoom to Full Extents , and Zoom to Previous are available on the Navigation Tool Group as well as the Quick Assess Toolbar; which also includes a Flash Feature Tool A1.4.2. Zoom to Feature. Feature . Right-clicking features in the TOC enables Zoom to and Pan to Feature . Atch 1 5 of 30 Figure A1.6. Zoom to Feature A1.4.3. Finding a Feature. Right-clicking over a map feature, regardless of what tool is selected, and selecting Show Resources, will show a list of all features occupying that location. Selecting the feature of interest will highlight the feature in the TOC. Figure A1.7. Show Resources A1.4.4. Data Frame Rotation. As with all geographic information system (GIS) applications, map data is defaulted with North being up. While placing assets it may be easier to rotate the data frame than rotate each feature as it is placed. Selecting the Rotate Data Frame from the Edit Tool Group rotates the data frame. Atch 1 6 of 30 Holding down the A key enables the user to enter a rotation angle. Selecting Clear Map Rotation being up. on the Edit Tool Group returns the map orientation to North A1.4.5. Map Views. A1.4.5.1. Bookmarks are a method to save a current view extent to quickly return to. Selecting Bookmarks on the Map Views Tool Group allows you to add a New Bookmark and Manage Bookmarks. Figure A1.8. Bookmarks A1.4.5.2. Views are a method to quickly group layers for visualization. Selecting Views from the Map Views Tool Group launches the wizard to build the views. Figure A1.9. View Manager A1.4.6. Map Graphics. The tools on the Graphics Tool Group allow placement of annotation items on the map. These are essentially tools to help produce more user-friendly presentations. The tools include Text, Point, Line and Polygon tools, a Atch 1 7 of 30 Dimension Line, Feature Tags, a Feature Pallet (push-pin symbols), a Buffer (true shape), and a simple Cordon (simple arc). A1.5. Creating a Scenario. A1.5.1. New Scenario Dialog. A scenario is simply an ArcGIS file geodatabase. While it can be manipulated outside GeoExPT, it is not advisable due to the internal connections and implemented business logic. Typically, a single scenario is created per site (installation), not per operation (aircraft parking, force beddown, or airfield operation). Figure A1.10. New Scenario The most import item to remember when creating a scenario is to properly project it. This is critical, since so many operations require accurate measurements. As usual, it is best to import the projection data from data you will use within the scenario. Atch 1 8 of 30 Figure A1.11. Data Projection A1.5.2. Adding Map Data. All external data added to the scenario is for reference only; there is no capability to edit it. However, standard layer management practices (draw order, stylization, etc.) can be applied. Select Add Data from the Scenario Tool Group and navigate to the applicable data layer. If you do not see the data you are looking for, ensure the proper file type is selected on the left side of the dialog. Figure A1.12. Add Data Atch 1 9 of 30 A1.6. Airfield Damage Repair. A1.6.1. Grids. Grids are required prior to placing any airfield damage. The Pavement Reference Marking System (PRMS) grids will be used to track damage on the takeoff and landing surfaces; a PRMS is required for each surface. The Crash Grid will track all other damage. After creating the appropriate grids, it is usually best to turn the layers off to simplify the map display. A1.6.1.1. PRMS. To create a PRMS, right-click the appropriate Surface or Surface Centerline (if a centerline is not present, you will be prompted to create one) in the TOC and select Add> Pavement Reference Marking System . The grid will be generated from threshold to departure and the width of the surface. Figure A1.13. Pavement Reference Marking System Atch 1 10 of 30 A1.6.1.2. Crash Grid. The Crash Grid is a representation of the Military Grid Reference System (MGRS). To place a crash grid, right-click on the Scenario in the TOC and select Add>Crash Grid . When the cursor changes to a crosshair, drag a marquee box around the area of interest. The grid will automatically expand to next full grid line. Figure A1.14. Crash Grid Atch 1 11 of 30 A1.6.2. Taxi Routes Entry Control Points (ECP). A1.6.2.1. ECPs are not for security, but designate the points of entry onto a surface. Each surface must have at least one ECP to be connected to the taxi network; this includes runways (not the MOS). Most surfaces will have more than one. Add an ECP by selecting ECP from the MAOS Tool Group. Single-click along the surface edge for the first point, then single-click for the second point. The actual width of the ECP is not critical. Figure A1.15. ECP Creation A1.6.2.2. Route Network. The route network is comprised of the ECP and connecting line segments. As with traditional network routes, proper node connectivity is critical. Although the segments are drawn as lines, they are symbolized as polygons to get a sense of their functionality. Right-click the scenario name in the TOC and select Add>Route Network . Next, ensure the network is highlighted in the TOC and select Add Segment from the MAOS Tool Group. Digitize the line as you would normally; single-click the first and all vertex points and double-click the end point. Finally, Name and correct the Width in the Properties Pane. When digitizing crossing routes, the crossed route is automatically split. Ensure the Name and Width is correct. Within a surface, routing operations will follow two rules: 1) the proposed taxi routes will either be parallel or perpendicular to the digitized route line; 2) within a surface (other than a runway), routing will go directly from ECP to ECP, regardless of parked aircraft. The workaround is to digitize a smaller surface to account for the taxiway and remove the applicable segments when autoparking. Routes are only considered during analysis if Active is set to True in the Properties Pane. Atch 1 12 of 30 Figure A1.16. Adding Route Segments A1.6.2.3. Routing Quality Control. As stated earlier, the integrity of the routing network is critical to its performing correctly. The Route Analyzer Tool on the ADR Tool Group checks for crossing route segments without nodes, disconnected routes, and self-intersecting routes. Checking the box next to each error will zoom into the applicable segment. Figure A1.17. Route Analyzer A1.6.2.4. The Route Analyzer also has the ability to trace all the routes from a given ECP. Check the box next to the appropriate Surface ECP and select Trace. After the tool has run (be patient on large networks), select a Route: Atch 1 13 of 30 Surface ECP and GeoExPT will display that route (the symbology will be blue and difficult to see). Figure A1.18. Route Tracing A1.6.3. Airfield Damage. A1.6.3.1. Manually Plotting Damage by PRMS Code. Damage items can be plotted using the traditional PRMS coordinates. In the TOC, right-click the Crash Gird (areas off the runways) or the appropriate Runway to launch the Airfield Damage dialog box. It is then a matter of supplying the appropriate information. The Damage Code can be entered as a string, or in segments in the lower portion of the dialog. Atch 1 14 of 30 Figure A1.19. Damage Code A1.6.3.2. Manually Plotting Damage by Digitizing. Damage plotting tools are located on the Damage Tool Group. Damage items are automatically assigned to the appropriate grid when digitized; the Team Name defaults to Digitized. To digitize a bomblet field, select Add Bomblet . It is then a matter of drawing the polygon. Upon completion, a dialog pops up to select the Munitions Type. This then draws the appropriate safety cordon and prompts for the Number of Bomblets. To digitize a camouflet, select Add Camouflet . First, click for the center point of the penetration hole; then you are prompted to provide the Diameter of the penetration. Next, you are prompted to provide the Blast Radius (actually the expected resulting crater). This is a hanging tool, so unless the Add Camouflet tool is pushed again, you can digitize camouflets with the same characteristics. To digitize a crater, select Add Crater . First, click the center of the crater. Quickly releasing the mouse button will launch the Diameter dialog. If the mouse button is held, you can drag out the diameter of the crater. This is a hanging tool, so unless the Add Crater tool is pushed again, you can digitize craters with the same characteristics. To digitize a crater field, select Add Crater Field . It is then a matter of drawing the polygon and providing the Number of Craters. To digitize a spall field, select Add Spall . It is then a matter of drawing the polygon and providing the Number of Spalls. To digitize a UXO, select Add UXO . Click the location of the UXO and provide the Munitions Type. This is a hanging tool, so unless the Add UXO tool is pushed again, you can digitize UXOs with the same characteristics. Atch 1 15 of 30 To digitize an area of unknown damage, select Add Unclassified matter of drawing the polygon around the area of interest. . It is then a A1.6.3.3. Importing Damage (from RADAS). RADAS currently produces shapefiles of airfield damage. These can either be accessed by clicking on the balloon pop-up (if enabled in the Settings), or accessing Import Damage the Tools Tool Group. on Figure A1.20. Damage File Notification If you used the Notification Balloon, the files will be populated in the Shapefile area; you then can check the files you want to import. You can also manually navigate to the files by selecting the Browse button. The tool does several things behind the scenes. First, it ensures the damage items are converted to the appropriate shape (craters and camouflets to normalized circles and UXOs to points). It then parses the data to the appropriate GeoExPT feature classes. Lastly, it performs archiving (if selected in the Settings). Additional geoprocessing is done by selecting the appropriate criteria. changed in this dialog overrule default values. Items The Crater Upheaval is the amount of compensation added to the actual crater size for analysis. The UXO Operational Radius is the explosive safety cordon distance for an untyped UXO. The Spall Depth and Diameter provide default spall values. The Camouflet Operational Radius is the explosive safety cordon associated with the camouflet. The Crater Diameter is the expected damage size, and the Penetration Diameter is the size of the puncture hole. Atch 1 16 of 30 When the Estimate Damage box is checked, GeoExPT will build craterfields to estimate the additional damage. The Crater Buffer Distance Criteria is the edge-to-edge measurement for locating the craters to be included in a single craterfield. The Expected Munitions Dud Rate (%) is the expected UXO rate normally gleaned from intelligence reports. The Estimated vs. Surveyed Threshold (%) determines at what point the estimated UXO count is used or the actual UXO is used during MAOS placement. For example, a setting of 50 means that if GeoExPT estimates five (5) UXOs within a craterfield, it will report 5 (the calculated number) if it only finds two (2) UXOs. However, if it finds more than three (3) UXOs, it will report the actual number found. The Run Utility Wizard compares the airfield damage against available utility features. Intersecting items are noted in the Properties Pane, as well as the ADR Status Tool Group when the MOS is plotted. Figure A1.21. Damage Importing Damage can also be estimated by selecting Estimate Damage on the Tools Tool Group. This tool can be used either to analyze selected data, or reanalyze imported data without having to re-import damage items. Atch 1 17 of 30 Figure A1.22. Damage Estimating A1.6.3.4. GeoExPT has the capability to analyze airfield damage against loaded utility layers. The Utility Wizard Tool reports the utility layers available for analysis. Craters intersecting utilities will be annotated in the Properties Pane. Figure A1.23. Utility Wizard Atch 1 18 of 30 Figure A1.24. Intersecting Water Line A1.6.3.5. Damage Repair Actions. The Airfield Damage Repair dialog can be launched by right-clicking a damage item in the TOC and selecting Repair . Selecting either Permanent or Cleared will remove the item from the map, other selections change the features’ symbologies. Figure A1.25. Damage Repair Actions Atch 1 19 of 30 A1.6.4. Add Minimum Operating Surface (MOS)/Minimum Airfield Operating Surface (MAOS). A1.6.4.1. MAOS/MOS candidates are added to the scenario by either rightclicking the appropriate runway and selecting Add>MOS existing MOS in the TOC and selecting Duplicate , right-clicking an , or by highlighting the appropriate runway and selecting Add MOS from the Tools Tool Group. The wizard steps through the criteria to determine the MAOS/MOS requirement. A1.6.4.2. Add MOS – Aircraft Operations. The data captured in this panel is similar to the traditional Worksheet 1 found in Attachment 2. The Altitude and Temperature are entered and the Density Ratio is calculated. The RSC and RCR values are entered. Each aircraft operation is listed to determine the MOS length. Although the length is calculated from the most restrictive operation, a length and width can be manually entered. Additional aircraft can be added by selecting Add Aircraft . These aircraft do not have worksheets, so a 10,000′ x 50′ (fighters) or 150′ (heavies) MOS will be established. Selecting Recalculate Length will recalculate the measurements based on the chart data. The data from this form can be saved to an .XML file by selecting Save Configuration . Data can be imported by selecting Open Saved Configuration . Figure A1.26. Add MOS - Aircraft Operations A1.6.4.3. Add MOS – Options. This panel allows configuration of the Runway Operation, MOS Marking, Airfield Lighting, and MAAS requirements. The 2nd Barrier option is only available if the MOS is Bi-Directional. Making changes on this panel affects the repair time estimates (more on this to follow). Atch 1 20 of 30 Figure A1.27. Add MOS - Options A1.6.4.4. Add MOS – ADR. This tab has the greatest impact on the MAOS/MOS repair time calculations. Other than the Repair Methodology, the options that apply various time multipliers are fairly generic. Concurrent (time assessment and scheduling based on zones) method is based on a repair team (consisting of FOD Removal, Upheaval Removal, Saw Cutting, Excavation, Backfilling, and Capping teams) working in a single crater field before moving to the next. This method is commonly known as the “leap-frog” method. For example, if there were five repair teams and six crater fields, the first team finishing their repairs would leap-frog to the sixth area. At this time, GeoExPT assumes all repair teams will start repairs at the same time. Sequential (time assessment and scheduling based on linear repairs) method is based on individual sub-teams working from one end of the MOS to the other. For example, if there were five repair teams, then all five FOD removal teams would work together until all the FOD is removed from the MOS. At this time, GeoExPT assumes all repair teams will start repairs at the same time, with an additional assumption that they will start at different locations on the MOS. This method will provide the greatest flexibility in team scheduling (to be discussed further in paragraph A1.6.5.5). NOTE: The tactics, techniques, and procedures (TTP) for the aforementioned repair methods are being developed/modified by AFCEC/CX. The GeoExPT time accounting is, therefore, still a work in progress, and the reported time estimates are not 100% accurate. However, they are representative and adequate to support comparative decisions when selecting the MAOS/MOS candidates. Atch 1 21 of 30 The Damage Repair Teams designate the available repair teams. The Environment applies appropriate time multipliers to the repair time estimates. The Crater Repair Zone Size details the area where each repair team will concentrate their efforts (only applicable for the Concurrent method). The Silver Flag Training options apply time multipliers to the repair time estimates based on team training. The Default Repair Material is the default crater repair method for the MAOS and MOS. Figure A1.28. Add MOS – ADR A1.6.4.5. Add MOS – Routing. Routing determines the requirements for MAOS selection. Route Operation defines the requirement for threshold and departure taxi routes. The Minimum Aircraft Width is the width of the required taxiway. Checking the High Speed Taxiway box limits the amount of swerving the aircraft is allowed during taxiing. Parking Surface to Route To is the primary surface to taxi from (additional route selections are available after a MOS has been placed). The LoR Constraints sets the requirement for the taxiway location in relation to the existing surface threshold and departure. The LoR may or may not be constrained for this requirement during MOS placement (to be discussed further in paragraph A1.6.4.6). The Routing Weights can also be set to override the default values (as set in the Settings Dialog). Selecting Finish at anytime begins the MOS placement activities. Be patient; there is a lot of geoprocessing, so it is a bit slow the first time. If you are not ready to place a MOS, hitting ESC will end the MOS placement session and place the MOS in TOC for future placement. Atch 1 22 of 30 Figure A1.29. Add MOS – Routing A1.6.4.6. MOS/MAOS Placement. An ADR Status Tool Group reports the MAOS/MOS criteria and intersecting damage as the MOS template is moved around the surface. The Appr Light and MAAS will be Green if the criteria are applied or Red if not. Either Uni or Bi will be reported to reflect the applicable operation. Craters and spalls will be reported if the MOS physically intersects them. Camouflets and UXOs will be reported if the MOS intersects the safety cordons. All items will also be highlighted on the map as they are intersected. The Est. Spalls and Est. Camouflets will be calculated if the criteria were selected. POL Craters reports those craters intersecting POL lines (this count is not a duplicate of the Crater report). UXOs reports both Surveyed (actually identified) and Potential (calculated). The LoR Actual (%) is the actual calculation of the placed MAOS. The LoR Constraint (%) is the criterion selected during the Add MOS process. If the LoR is critical during placement, ensure the lock is “locked” . Finally the Repair Score Index is reported. This index rating is used when comparing candidates against another – typically the lower the score the better the solution. The MOS candidate, with the Repair Score Index and LoR Actual (%), is added to TOC. The tool hangs, so multiple MOS candidates can be added quickly. If MOS candidates in the TOC have different criteria, you can right-click the MOS you would like to duplicate, and select Duplicate Atch 1 23 of 30 . Figure A1.30. ADR Status and Score Holding the C Key during placement constrains the MOS candidate to the existing surface centerline. If the interface is jumpy during placement, hold the P Key to suspend the calculations/count so the template moves more smoothly. Instant feedback is provided if there is a problem with the placed candidate. Remember during placement only the actual MOS, not the approach lighting, must be on the existing surface. Figure A1.311. MOS Warnings Atch 1 24 of 30 After a MAOS is placed (as a candidate or as a finalized selection), additional taxi routes can be added by right-clicking the MOS candidate in the TOC and selecting Add > Secondary Routes . Although these additional routes are not included in the overall MOS scores, details are provided in the TOC and Properties Pane on the intersecting damage. Figure A1.32. Additional MAOS Routes A1.6.5. ADR Wizard. A1.6.5.1. Once multiple MAOS/MOS candidates are placed, on a single or multiple surfaces, it is time to select the final candidate. A wizard had been created to step through this process. If you know the candidate you would like as the final, right-click the item in the TOC and select Accept MOS . This will launch the ADR Wizard, but starts at panel 3 – Repair Materials per Zone (to be discussed in paragraph A1.6.5.2). Selecting the ADR Wizard Tab launches the wizard. on the ADR A1.6.5.2. ADR Wizard. The panel provides a summary of the MAOS/MOS candidates grouped by surface. Select which candidates you would like to include in the MAOS brief by checking the appropriate box. Typically, three candidates are presented for consideration. Atch 1 25 of 30 Figure A1.33. ADR Wizard - ADR Wizard A1.6.5.3. ADR Wizard – Select MOS Candidate. dashboard-style summation of the candidates. This panel presents a The first column, Estimated Repair Time, is the total time to repair the MAOS. It is color-coded based on an eight-hour repair requirement. If the time is less than eight hours, the box is highlighted GREEN; if it exceeds eight hours, it is RED. The Operation column summarizes the MAOS criteria. If the LoR is achieved, the box is highlighted GREEN; if not, it is RED. The Damage Summation column is just that -- a summation of the intersecting damage. At this point, there is no distinction between actual or estimated damage, since it would all be repaired and must be accounted for in the time estimations. The remaining information details the repair time estimates for each repair team. The Crater Repair (MOS) and Crater Repair (Apron/Taxi) is also color-coded based on an overall time of 4.5 hours. Select the radio button next to the final candidate. Atch 1 26 of 30 Figure A1.34. ADR Wizard - Choose the MOS Candidate for Finalization A1.6.5.4. ADR Wizard – Repair Materials per Zone. This panel enables you to tailor the repair materials per repair team. Because we used the Concurrent Repair Method, there is only one repair zone per surface. However, if the Sequential Repair Method was chosen, each could be tailored. Realize this does affect the total repair time estimate, but does not dynamically update the graphic on this panel. More about time estimations follows in paragraph A1.6.5.5. Figure A1.35. ADR Wizard - Repair Materials per Zone Atch 1 27 of 30 A1.6.5.5. ADR Wizard – Timeline. The panel is a work in progress. Ideally, it will replicate the capabilities in MS Project, providing the opportunity to realize as many time-saving opportunities as possible. Howeve,r the implement plug-in has limited capabilities. The data can be printed by selecting Print Export and exported to Excel by selecting . Selecting ADR Repair Options launches the Add MOS – ADR Tab. Changing criteria in this tab has an immediate effect on the timeline. Figure A1.36. ADR Wizard – Timeline A1.6.5.6. ADR Wizard – Summary. This final panel is again a summation of the MAOS/MOS candidate. Selecting Back allows going back to tweak any portion of the Wizard. Selecting Finish prompts that all other candidates (on that surface) will be erased and launches the Airfield Damage Repair (ADR) Report dialog. Atch 1 28 of 30 Figure A1.37. ADR Wizard – Summary A1.6.6. Repair Quality Criteria (RQC). RQC operations are not applicable to the new repair methods, but can still be accomplished by right-clicking the MOS in the TOC and selecting RQC . This area of the application has not been updated in some time, and presents issues. A1.6.7. Reports. The reports are a work in progress, and there are known issues. There are a variety of reports for ADR on the Reports Tab. Some reports may be more usable to save as a text file to be able to clip out features and coordinates. A1.7. Print/Plot. A1.7.1. Layout Manager. The Layout Manager is accessed by selecting Layout Manager on the View Tab. Five pre-configured layouts are available with GeoExPT. Currently, there is limited capability to create new layouts/configurations. A1.7.2. Printing. Printing is launched either from the Layout Manager or selecting Print on the File tab. The Print Properties dialog enables you to select the Layout, enter the Title, Description, and any Additional Comments. The standard Esri print/plot interface enables you to customize your map. Atch 1 29 of 30 Figure A1.38. Print Dialog Atch 1 30 of 30 LEGACY – MANUAL METHOD A2.1. Purpose. The manual method of determining the Minimum Operating Strip (MOS) and Minimum Airfield Operating Surface (MAOS) should be used only if Geospatial Expeditionary Planning Tool (GeoExPT) is not available for use. The methods described in this attachment are those described in the to-be rescinded TO 35E2-4-1, Repair Quality Criteria System for Rapid Runway Repair. A2.2. Chart Description. A2.2.1. Figure A2.1 is an example of a chart used to determine the MOS requirement for a given aircraft and aircraft operation. The chart has four areas: 1) the location baseline shift area; 2) the environmental shift area; 3) the uncorrected RQC; and 4) correction factor area. A2.2.2. Location Base Line. The location baseline is the starting point for calculations. This area is used to determine the MOS requirement, as well as mark the repair patch locations when determining the RQC requirement. A2.2.3. Environmental Shift. This area compensates for aircraft performance variations due to weather and runway conditions. These include the Density Ratio (DR), the Runway Condition Reading (RCR), and the Runway Surface Condition (RSC). A2.2.4. Uncorrected RQC. repairs. This area determines the initial RQC for individual A2.2.5. Correction Factor. This area provides RQC correction factors based on the repair location on the MOS and its proximity to other repairs. Atch 2 1 of 101 Figure A2.1. Sample RQC Chart A2.3. Assumptions. A2.3.1. Users are familiar with the functions of damage assessment and MOS selection. This assumption includes the reporting of airfield damage nomenclature. A2.3.2. RQC represent the maximum allowable repair height, in inches, for all values, except flush “F” and flush repair followed by a flush repair “FF.” A2.3.3. Allowable sag depth is 2.0 inches for all RQC, except “F” and “FF.” A2.3.4. Allowable repair slope is 5.0% for all RQC, except in a landing touchdown zone. Allowable ramp slope is 3.4% in landing touchdown zones. Atch 2 2 of 101 A2.3.5. Aircraft contact the entire length of each repair on the MOS. Lateral repair location does not affect RQC. A2.3.6. All spalls are repaired to flush criteria. A2.3.7. Aircraft operation lengths are defined as takeoff or landing distance in the aircraft’s performance manual. Since the MOS length is specified by the Wing Operations Center (WOC) and the commander, it may be longer than the longest operation length. Any repair in a section of the MOS beyond the longest operation length has an RQC equal to flush “F.” A2.3.8. All aircraft are maintained in accordance with the relevant technical orders and service manuals. The exception is the A-7D nose gear tire, which is serviced to 235 psi. A2.3.9. If taxiway repairs are required, the following caution will be relayed to the wing operation: “All operations on taxiway repairs are limited to 5 knots. Taxiway repairs may have up to 6 inches of upheaval and up to 2 inches of sag. Braking in the vicinity of repairs on taxiway surfaces must be avoided.” A2.4. Step-by-step Directions for Minimum Operating Strip (MOS) Lengths. A2.4.1. Instructional Guideline. Table A2.1 provides a step-by-step checklist of the process. It is recommended the user follow these steps to ensure accuracy and quality of the process. Table A2.1. Instructional Guidelines Step Number Process Action 1 Collect Aircraft and Environmental Data - Record on Worksheet 1 1.1 Record data for aircraft operation expected on the MOS. 1.1.1 Aircraft model 1.1.2 Gross weight (pounds) 1.1.3 Operation (takeoff, landing, or evacuation) 1.1.4 Special operation procedures for landing (aero braking; wheel braking; short field arrestment with chute, without chute, or normal) 1.2 Record the RQC chart number for each operation. 1.3 Record the Density Ratio (DR). 1.4 If DR is unavailable, record the temperature and pressure altitude. Using DR Chart, draw a vertical line from the temperature axis until it intersects with the pressure altitude, then draw a horizontal line to the DR axis. Record the DR on Worksheet 1. 1.5 Record the RSC (0.0 - 1.0 for C-5 or C-141 aircraft, 0.0 - 10.0 for 130 aircraft). 1.6 Record the RCR (dry, wet, or icy). Atch 2 3 of 101 Table A2.1. Instructional Guidelines Step Number Process Action 2 Determine Length for Each Operation 1.1 Draw a horizontal line, corresponding to the current DR, across the DR section. 1.2 If there is an RCR or RSC section, draw a horizontal line, corresponding to the current RCR or RSC, across that section. 1.3 From the intersection of the DR line and the shaded section, draw a vertical line to the bottom of the RCR or RSC section. Then follow the guideline until the line intersects with the correct RCR or RSC. From this intersection, draw a vertical line down to the location baseline and read the operational length. Record the length on Worksheet 1. 1.4 If there is no RCR or RSC section, locate the intersection of the DR line with the shaded section. From this point, draw a vertical line down to the location baseline and read the operational length. Record the length on Worksheet 1. 3 4 5 Define Repair Patches on the TOL Map 3.1 Draw lines, perpendicular to the sides of the MOS, at the beginning and end of each crater on the MOS. 3.2 Shade the area between the lines for each crater. 3.3 If two shaded areas are within 25 feet of each other, shade the area between them. 3.4 From the MOS threshold, number each shaded area as a patch. For each Operation, Determine Patch Locations, Lengths, and Spacings 4.1 Draw double lines, perpendicular to the sides of the MOS, marking the operation threshold and operation length. 4.2 For each patch within the two sets of double lines, record the operation number and patch number on Worksheet 2 (e.g., for Operations 2 - Patch 3, enter "2/3"). 4.3 For each patch, measure the distance from the operation threshold to the center of the patch, and record the "Patch Location" on Worksheet 2. If the distance is greater than the operation length, record the operation length. 4.4 Measure the length of each patch and record on Worksheet 2. 4.5 For each patch, measure the distance from the center of the patch to the center of the next patch (in the operation direction), and record this distance as "Patch Spacing" on Worksheet 2. For the last patch, record the maximum spacing value from the RQC chart. 4.6 Repeat all of step 4 for each operation using the MOS. Determine Uncorrected RQC and Correction Factor 5.1 Mark the location of each patch on the location baseline. 5.2 Mark the spacing and length for each patch on their respective axes. 5.3 Draw a horizontal line, corresponding to the current DR, across the DR section. If there is an RCR or RSC section, draw a horizontal line, corresponding to the current RCR or RSC, across that section. Atch 2 4 of 101 Table A2.1. Instructional Guidelines Step Number Process Action 5.4 For each patch, draw a vertical line from the location baseline to intersect with the current DR. Then follow the guidelines to the top of the DR section. From this point, draw a vertical line to intersect with the current RCR or RSC. Then follow the guidelines to the top of the section. From this point, draw a vertical line to the top of the RQC chart. If there is no RCR or RSC section, draw a vertical line from the top of the DR section to the top of the RQC chart. 5.5 For each patch, draw a horizontal line corresponding to the spacing for that patch until the line intersects with the vertical line from step 5.4. Determine the uncorrected RQC from the region of the intersection and record on Worksheet 2. If the intersection falls within a shaded region, a correction factor is not required. 5.6 For each patch, draw a horizontal line corresponding to the length of that patch until the line intersects with the vertical line from step 5.4. Determine the correction factor from the region of the intersection and record on Worksheet 2. 6 7 5.7 Perform all of step 5 for each operation. Determine RQC for Each Repair Patch 6.1 Add the correction factor to the uncorrected RQC and record on Worksheet 2. If the result is a negative number, record an "F." If the uncorrected RQC for a repair is "FF," record an "F" for both that patch and the patch immediately following it. 6.2 Calculate the RQC for each patch for each operation. Summarize the RQC for the Entire MOS 7.1 List each operation from the MOS threshold on the top half of Worksheet 3. 7.2 List each operation from the MOS departure end on the bottom half of Worksheet 3. 7.3 Mark each patch number from the MOS on both the top and bottom of Worksheet 3. 7.4 For each operation and patch number, record the RQC from Worksheet 2 onto Worksheet 3. For patches that are on the MOS but are not within the length of any operation, record an "F.” 7.5 For each repair patch and each operation direction, record the lowest RQC in the summary lines on Worksheet 3. 7.6 For each repair patch, record the lower summary value in the combined line on Worksheet 3. 7.7 Transfer the combined RQC to the TOL map, and brief the Base Civil Engineer and/or wing commander. A2.4.2. Collecting Operational Data. A2.4.2.1. Contact the WOC; usually collocated with the Emergency Operations Center (EOC). Atch 2 5 of 101 A2.4.2.2. Request the mix of aircraft types, configurations, and operations expected on the MOS. Aircraft configuration data consists of the aircraft gross weight. Operation data should indicate if the aircraft will take off, land, or evacuate, and any special landing procedures (arrested landings, aerodynamic braking, etc.). A2.4.2.3. Request the direction for operations (from the MOS threshold, from the MOS departure end, or both). A2.4.2.4. Record each combination of aircraft model, operation, and direction on a separate line on Worksheet 1 (Figure A2.2). Figure A2.2. Worksheet 1 Example Atch 2 6 of 101 A2.4.3. Collecting Environmental Data. A2.4.3.1. Contact the WOC. If the WOC does not have the environmental data, contact Base Weather. A2.4.3.2. Request the expected range of DRs for the day. Select the lowest DR expected, and record the value on Worksheet 1. A2.4.3.3. If the DR is unavailable, request the runway pressure altitude and the expected temperature range. Select the highest temperature, and record it and the pressure altitude on Worksheet 1. A2.4.3.4. Determine the DR from the temperature and pressure altitude using the DR chart (Figure A2.3). The example uses 59 degrees and sea level. A2.4.3.4.1. Enter the DR chart with the temperature value. A2.4.3.4.2. Draw a vertical line to the correct altitude line. A2.4.3.4.3. Draw a horizontal line to the DR axis, and read DR. A2.4.3.4.4. Record DR on Worksheet 1. Atch 2 7 of 101 Figure A2.3. Density Ratio Table Example A2.4.3.5. Request the ranges of the RSC and RCR expected for the day. Select the highest RSC or RCR (icy is higher than wet, wet is higher than dry). Record these values on Worksheet 1. A2.4.3.6. Using the RQC Chart/Figure Number summary (Table A2.2), find the RQC chart number for the aircraft and operation combinations recorded on Worksheet 1. Record these numbers on Worksheet 1. If there is some uncertainty as to the procedures used during aircraft operations, select charts for all possible variations. Atch 2 8 of 101 Table A2.2. RQC Chart/Figure Number Aircraft Type F-4 C/D F-4E F-15 A/B F-15 C/D F-15E F-16 A/B BLOCK 10/15 F-16 C/D BLOCK 25/30/32 F-16 C/D BLOCK 40/42 RQC Chart/Figure Number RQC Chart Number Operation A1 Takeoff A2 Landing - Arrestment A3 Landing - w/ Chute A4 Landing - w/o Chute A5 Evacuation B1 Takeoff B2 Landing - Arrestment B3 Landing - w/ Chute B4 Landing - w/o Chute B5 Evacuation C1 Takeoff C2 Landing - Aerobraking C3 Landing - Wheel Braking C4 Landing - Arrestment C5 Evacuation C6 Takeoff C7 Landing - Aerobraking C8 Landing - Wheel Braking C9 Landing - Arrestment C10 Evacuation C11 Takeoff C12 Landing C13 Landing - Arrestment C14 Evacuation D1 Takeoff D2 Landing D3 Landing - Arrestment D4 Evacuation D5 Takeoff D6 Landing D7 Landing - Arrestment D8 Evacuation D9 Takeoff D10 Landing D11 Landing - Arrestment D12 Evacuation Atch 2 9 of 101 Chart Number 5 6 7 8 9 10 11 12 13 14 15 16 17 18 19 20 21 22 23 24 25 26 27 28 29 30 31 32 33 34 35 36 37 38 39 40 Table A2.2. RQC Chart/Figure Number F-111 A/E C-5 B C-130 E/H C-141 A/B HEAVY C-141 A/B MEDIUM A-7 D A-10 A KC-135 R KC-10 C-9 C-17 RQC Chart/Figure Number E1 Takeoff E2 Landing E3 Landing - Short Field E4 Landing - Arrestment E5 Evacuation F1 Takeoff F2 Landing G1 Takeoff G2 Landing H1 Heavy Weight Takeoff H2 Heavy Weight Landing I1 Medium Weight Takeoff I2 Medium Weight Landing J1 Takeoff J2 Landing J3 Landing - Arrestment J4 Evacuation K1 Takeoff K2 Landing L1 Heavy Weight Takeoff L2 Normal Weight Takeoff L3 Landing M1 Heavy Weight Takeoff M2 Normal Weight Takeoff M3 Landing N1 Heavy Weight Takeoff N2 Normal Weight Takeoff N3 Landing O1 Disclaimer O2 Heavy Weight Takeoff O3 Normal Weight Takeoff Heavy Weight Landing Steep O4 Approach Heavy Weight Landing Normal O5 Approach Normal Weight Landing Normal O6 Approach Atch 2 10 of 101 41 42 43 44 45 46 47 48 49 50 51 52 53 54 55 56 57 58 59 60 61 62 63 64 65 66 67 68 69 70 71 72 73 74 Table A2.2. RQC Chart/Figure Number F-117 RQC Chart/Figure Number P1 RCR Information P2 Heavy Weight Takeoff P3 Normal Weight Takeoff P4 Light Weight Takeoff P5 Normal Weight Landing - No Chute P6 Normal Weight Landing - Chute P7 Heavy Weight Landing - No Chute P8 Heavy Weight Landing - Chute 75 76 77 78 79 80 81 82 A2.4.4. Finding Operational Lengths. A2.4.4.1. Once the proper charts are selected, determine the operation length for each combination of aircraft configuration and operation. Chart E3, F-111A/E Landing – Short Field (Figure A2.4) shows an example of operations length calculation for an F-111 landing operations with a DR = 1.0, RCR = WET, and RSC = 0.3. A2.4.4.2. RQC Charts with RCR or RSC. A2.4.4.2.1. Draw a horizontal line across the DR section corresponding to the DR recorded on Worksheet 1. A2.4.4.2.2. Draw a horizontal line across the RCR or RSC section corresponding to the RCR or RSC recorded on Worksheet 1. A2.4.4.2.3. From the intersection of the DR line with the shaded section, draw a vertical line up to the bottom of the RCR or RSC section. A2.4.4.3.4. Follow the guidelines until the line intersects with the current RCR or RSC. Stay between the guidelines in proportion to the starting location. A2.4.4.2.5. Draw a vertical line to the location baseline, and read the operation length. A2.4.4.2.6. Record the length in the space provided on Worksheet 1. A2.4.4.3. RQC Charts without RCR or RSC. A2.4.4.3.1. Draw a horizontal line across the DR section corresponding to the DR recorded on Worksheet 1. Atch 2 11 of 101 A2.4.4.3.2. From the intersection of the DR line and the shaded section, draw a vertical line down to the location baseline, and read the operation length. A2.4.4.3.3. Record this value on Worksheet 1. A2.4.4.4. The final operational length is the longest calculated length for the aircraft operations to be performed on the MOS. Figure A2.4. Chart E3, F111 A/E Landing - Short Field A2.5. Damage Plotting. Runway damage is plotted on a Takeoff and Landing (TOL) map at a 1:1200 scale (1 inch equals 100 feet). The TOL map should utilize the same Pavement Reference Marking System (PRMS) as the grid overlay. The MOS selection team uses the TOL map (located in the EOC) to select MOS candidates. Damage is Atch 2 12 of 101 initially plotted on the TOL map with estimated repair diameters (double the apparent diameter). All other damage items not located on the runway utilize the 1:4800 (1 inch equals 400 feet) Crash Grid Map. This map should utilize the Military Grid Reference System (MGRS) as the grid overlay. Following completion of runway repairs, RQC must be refigured using the actual repair lengths. A2.6. RQC Calculations. A2.6.1. Define Repair Patches. A2.6.1.1. For each repair at least partially on the MOS, draw lines perpendicular to the side of the MOS through the first and last point within the MOS width. A2.6.1.2. Shade the areas on the MOS between the lines for each repair. A2.6.1.3. If two or more shaded areas overlap or are within 25 feet of each other, shade the area or areas between them. A2.6.1.4. From the MOS threshold, number each shaded area as a repair patch. For operations on bidirectional MOSs, do not renumber the patches when the operation direction changes. Once a patch is numbered, it should not be changed. A2.6.2. Finding Repair Patch Location, Length, and Spacing. A2.6.2.1. Once the repair patches have been numbered, determine the location, length, and spacing for each. Figure A2.5, “TOL Map,” shows examples of patch locations, lengths and spacings. Figure A2.6, “Worksheet 2 Example,” shows examples of entering the data on Worksheet 2. A2.6.2.2. Draw double lines perpendicular to the sides of the MOS marking the operations threshold and operation length. A2.6.2.3. For each patch within the two sets of double lines, record the operation number and patch on Worksheet 2 (Figure A2.6, “Worksheet 2 Example”). A2.6.2.4. Find the center of each repair patch. Measure the distance (in feet) from this point back to the operation threshold. If the distance is greater than the operation length, use the operation length. If the patch center is in front of the operation threshold, use zero. Record these repair locations on Worksheet 2. A2.6.2.5. Measure each patch length parallel to the side of the MOS (in feet). Record these patch lengths on Worksheet 2. A2.6.2.6. Measure, in the direction of operation, the distance (in feet) from the center of each patch to the center of the next patch. If there is not a “next” patch Atch 2 13 of 101 (i.e., the patch is the last one), use the maximum value on the spacing axis of the RQC chart. Record these repair patch spacings on Worksheet 2. A2.6.2.7. Mark the repair patch locations, lengths, and spacings on the RQC charts. If the value for any length or spacing is greater than the maximum or less than the minimum shown on the RQC chart, mark the maximum or minimum. Figure A2.5. TOL Map Atch 2 14 of 101 Figure A2.6. Worksheet 2 Example A2.6.3. Finding Repair Quality Criteria (RQC). A2.6.3.1. Incorrect RQC can result in aircraft damage that may cause death. Uncertainty of any value (RQC, uncorrected RQC, or correction factor) shall be resolved by using the most conservative value (i.e., the lowest value). An intersection on a boundary line between two regions in the uncorrected RQC or correction factor areas must be treated as though it falls in the region with the lowest value. A2.6.3.2. Finding Uncorrected RQC. Atch 2 15 of 101 A2.6.3.2.1. Draw a horizontal line across the DR section corresponding to the DR recorded on Worksheet 1. If there is an RCR or RSC section, draw a horizontal line across that section corresponding to the RCR or RSC recorded on Worksheet 1. A2.6.3.2.2. Draw vertical lines from the patch locations on the location baseline until they intersect with the current DR. A2.6.3.2.3. From each intersection, follow the guidelines to the top of the DR section. Stay between the guidelines in proportion to the starting location. A2.6.2.3.4. From the top of the DR section, draw a vertical line until it intersects with the current RCR or RSC, then follow the guidelines to the top of that section. From this point, draw a vertical line to the top of the RQC chart. A2.6.2.3.5. If there is no RCR or RSC section, draw a vertical line from the top of the DR section to the top of the RQC chart. A2.6.2.3.6. Draw a horizontal line from each repair patch spacing on the vertical axis to the uncorrected RQC area. Continue each line until it intersects the vertical line for that patch. A2.6.2.3.7. The intersections are in the various regions of the uncorrected RQC area. The number in each region indicates the uncorrected RQC for intersections in that region. Record the uncorrected RQC values for each repair patch on Worksheet 2. A2.6.2.3.8. A value of “F” indicates a flush repair. A value of “FF” indicates a flush repair that must be followed by another flush repair. A2.6.3.3. Finding Correction Factor. A2.6.3.3.1. If the uncorrected RQC is in a region shaded with diagonal lines, a correction factor is not calculated, and RQC equals the uncorrected RQC. All “F” and “FF” regions are shaded with diagonal lines. “FF” regions are crosshatched to contract with “F” regions. A2.6.3.3.2. Draw a horizontal line from each patch length to intersect the appropriate vertical line. A2.6.3.3.3. The intersections of these lines are in the various regions of the correction factor. The number in each region indicates the correction factor for intersections in that region. Atch 2 16 of 101 A2.6.3.3.4. Record the values on Worksheet 2. These are the correction factors. A2.6.3.3.5. The correction factor is always negative or zero. A2.6.3.4. Calculating RQC. A2.6.3.4.1. A patch with an uncorrected RQC of “F” or “FF” has an RQC of “F.” The patch following a patch with an uncorrected RQC of “FF” also has an RQC of “F.” A2.6.3.4.2. Add the uncorrected RQC and correction factor. RQC is always less than or equal to the uncorrected RQC A2.6.3.4.3. If the uncorrected RQC plus the correction factor results in a negative number, the RQC for that repair patch is “F.” A2.6.3.4.4. Record the RQC values on Worksheet 2 and in the spaced proved on Worksheet 3, Figure A2.7. Atch 2 17 of 101 Figure A2.7. Worksheet 3 Example A2.6.3.5. Additional Operations. A2.6.3.5.1. Repair patch locations and spacing are a function of operating direction. RQC values must be found for each operation in each required direction. A2.6.3.5.2. Repeat the instruction for paragraph A2.6.2 for every operation in the same direction. Patch numbering and patch spacing remain constant. A2.6.3.5.3. If bidirectional operations are required, repeat the instructions for paragraph A2.6.2 for each operation in the opposite direction. Atch 2 18 of 101 A2.6.3.5.4. Patch numbering and patch lengths remain constant. Remember the operation threshold is now at the departure end. A2.6.3.5.5. The final RQC for each patch is the lowest calculated RQC for all the operations intersecting that patch. Atch 2 19 of 101 A2.7. Blank Charts (For Reproduction). Chart A2.1. Density Ratio Atch 2 20 of 101 Chart A2.2. Worksheet 1 Atch 2 21 of 101 Chart A2.3. Worksheet 2 Atch 2 22 of 101 Chart A2.4. Worksheet 3 Atch 2 23 of 101 Chart A2.5. F4 C/D Takeoff Atch 2 24 of 101 Chart A2.6. F-4 C/D Landing - Arrestment Atch 2 25 of 101 Chart A2.7. F-4 C/D Landing - With Chute Atch 2 26 of 101 Chart A2.8. F-4 C/D Landing - Without Chute Atch 2 27 of 101 Chart A2.9. F-4 C/D Evacuation Atch 2 28 of 101 Chart A2.10. F-4 E Takeoff Atch 2 29 of 101 Chart A2.11. F-4 E Landing - Arrestment Atch 2 30 of 101 Chart A2.12. F-4 E Landing - With Chute Atch 2 31 of 101 Chart A2.13. F-4 E Landing Without Chute Atch 2 32 of 101 Chart A2.14. F-4 E Evacuation Atch 2 33 of 101 Chart A2.15. F-15 A/B Takeoff Atch 2 34 of 101 Chart A2.16. F-15 A/B Landing - Aerobraking Atch 2 35 of 101 Chart A2.17. F-15 A/B Landing - Wheel Braking Atch 2 36 of 101 Chart A2.18. F-15 A/B Landing - Arrestment Atch 2 37 of 101 Chart A2.19. F-15 A/B Evacuation Atch 2 38 of 101 Chart A2.20. F-15 C/D Takeoff Atch 2 39 of 101 Chart A2.21. F-15 C/D Landing - Aerobraking Atch 2 40 of 101 Chart A2.22. F-15 C/D Landing - Wheel Braking Atch 2 41 of 101 Chart A2.23. F-15 C/D Landing - Arrestment Atch 2 42 of 101 Chart A2.24. F-15 C/D Evacuation Atch 2 43 of 101 Chart A2.25. F-15 E Takeoff Atch 2 44 of 101 Chart A2.26. F-15 E Landing Atch 2 45 of 101 Chart A2.27. F-15 E Landing - Arrestment Atch 2 46 of 101 Chart A2.28. F-15 E Evacuation Atch 2 47 of 101 Chart A2.29. F-16 A/B Block 10 and 15 Takeoff Atch 2 48 of 101 Chart A2.30. F-16 A/B Block 10 and 15 Landing Atch 2 49 of 101 Chart A2.31. F-16 A/B Block 10 and 15 Landing - Arrestment Atch 2 50 of 101 Chart A2.32. F-16 A/B Block 10 and 15 Evacuation Atch 2 51 of 101 Chart A2.33. F-16 C/D Block 25, 30, 32 Takeoff Atch 2 52 of 101 Chart A2.34. F-16 C/D Block 25, 30, 32 Landing Atch 2 53 of 101 Chart A2.35. F-16 C/D Block 25, 30, 32 Landing - Arrestment Atch 2 54 of 101 Chart A2.36. F-16 C/D Block 25, 30, 32 Evacuation Atch 2 55 of 101 Chart A2.37. F-16 C/D Block 40, 42 Takeoff Atch 2 56 of 101 Chart A2.38. F-16 C/D Block 40, 42 Landing Atch 2 57 of 101 Chart A2.39. F-16 C/D Block 40, 42 Landing - Arrestment Atch 2 58 of 101 Chart A2.40. F-16 C/D Block 40, 42 Evacuation Atch 2 59 of 101 Chart A2.41. F-111 A/E Takeoff Atch 2 60 of 101 Chart A2.42. F-111 A/E Landing - Wheel Braking Atch 2 61 of 101 Chart A2.43. F-111 A/E Landing - Short Field Atch 2 62 of 101 Chart A2.44. F-111 A/E Landing - Arrestment Atch 2 63 of 101 Chart A2.45. F-111 A/E Evacuation Atch 2 64 of 101 Chart A2.46. C-5 B Takeoff Atch 2 65 of 101 Chart A2.47. C-5 B Landing Atch 2 66 of 101 Chart A2.48. C-130 E/H Takeoff Atch 2 67 of 101 Chart A2.49. C-130 E/H Landing Atch 2 68 of 101 Chart A2.50. C-141 A/B Heavy Weight Takeoff Atch 2 69 of 101 Chart A2.51. C-141 A/B Heavy Weight Landing Atch 2 70 of 101 Chart A2.52. C-141 A/B Medium Weight Takeoff Atch 2 71 of 101 Chart A2.53. C-141 A/B Medium Weight Landing Atch 2 72 of 101 Chart A2.54. A7 D Takeoff Atch 2 73 of 101 Chart A2.55. A-7 D Landing Atch 2 74 of 101 Chart A2.56. A-7 D Landing - Arrestment Atch 2 75 of 101 Chart A2.57. A-7 D Evacuation Atch 2 76 of 101 Chart A2.58. A-10 A Takeoff Atch 2 77 of 101 Chart A2.59. A-10 A Landing Atch 2 78 of 101 Chart A2.60. KC-135 R Heavy Weight Takeoff Atch 2 79 of 101 Chart A2.61. KC-135 R Nominal Weight Takeoff Atch 2 80 of 101 Chart A2.62. KC-135 R Landing Atch 2 81 of 101 Chart A2.63. KC-10 Heavy Weight Takeoff Atch 2 82 of 101 Chart A2.64. KC-10 Nominal Weight Takeoff Atch 2 83 of 101 Chart A2.65. KC-10 Landing Atch 2 84 of 101 Chart A2.66. C-9 Heavy Weight Takeoff Atch 2 85 of 101 Chart A2.67. C-9 Nominal Weight Takeoff Atch 2 86 of 101 Chart A2.68. C-9 Landing Atch 2 87 of 101 Chart A2.69. Disclaimer Atch 2 88 of 101 Chart A2.70. C-17 Heavy Weight Takeoff Atch 2 89 of 101 Chart A2.71. C-17 Nominal Weight Takeoff Atch 2 90 of 101 Chart A2.72. C-17 Heavy Weight Landing - Steep Approach Atch 2 91 of 101 Chart A2.73. C-17 Heavy Weight Landing - Normal Approach Atch 2 92 of 101 Chart A2.74. C-17 Nominal Weight Landing - Normal Approach Atch 2 93 of 101 Chart A2.75. RCR Information Atch 2 94 of 101 Chart A2.76. F-117 Heavy Weight Takeoff Atch 2 95 of 101 Chart A2.77. F-117 Nominal Weight Takeoff Atch 2 96 of 101 Chart A2.78. F-117 Light Weight Takeoff Atch 2 97 of 101 Chart A2.79. F-117 Nominal Weight Landing - No Chute Atch 2 98 of 101 Chart A2.80. F-117 Nominal Weight Landing - Chute Atch 2 99 of 101 Chart A2.81. F-117 Heavy Weight Landing - No Chute Atch 2 100 of 101 Chart A2.82. F-117 Heavy Weight Landing - Chute Atch 2 101 of 101 DISTRIBUTION LIST Information Handling Services 15 Inverness Way East Englewood, CO 80150 (1) Construction Criteria Base National Institute of Bldg Sciences Washington, DC 20005 Atch 3 (1 of 1) (1)