1
Energy Measurements in PSM
PSM presents all commonly desired energy measurements.
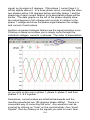
When displaying a data log containing power information, PSM
will graph the energy consumed over any interval. The user can
choose to graph real energy use (KWH) or reactive energy use
(KVARH).
Normally, a graph of energy usage will be a line that climbs up as
it moves to the right. This is because, as more and more power is
used, the cumulative energy used increases.
In addition our Report Generator software will calculate actual
energy used and the estimated energy used pr month during any
one or two intervals of time set by the user. If two time intervals
are chosen, it will report the percent change and the actual
change in energy use between the two intervals. For instance, if a
comparison report is chosen and 5 KWH is consumed during the
first interval of 10 minutes and 8 KWH is consumed during the
second interval of 20 minutes, then the report would show:
Energy, Total Elapsed
Energy, Estimated per
month
%
Before After Units Change Change
5
8
KWH
3
60.0%
21,900 17,520 KWH -4380
-20.0%
In this example, even though the actual energy increased
significantly, the actual rate of energy use declined significantly
because of the difference in time intervals between the before and
after tests.
Cost Measurements
The cost of energy consumed is defined as the product of the
energy consumed times the user-defined rate: $= KWH × rate .
PowerSight presently uses a simple single rate price system.
72