1
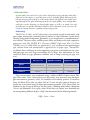
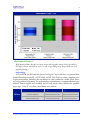
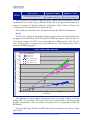
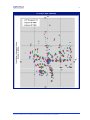
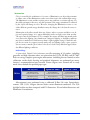
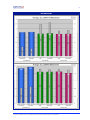
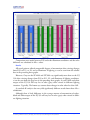
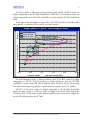
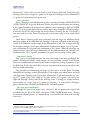
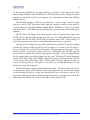
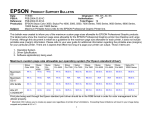
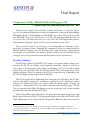
Final Report
Comparative Study: Hewlett-Packard Designjet 130
vs. Epson Stylus Pro 4000 and Epson Stylus Pro 7600
The SpencerLab Digital Color Laboratory, a division of Spencer & Associates Publishing, Ltd, has conducted independent testing and comparative evaluation of Print Quality,
Throughput Speed vs. Print Quality, and Ink Yield with resultant Cost-per-Print, of the
new dye-based1 HEWLETT-PACKARD D ESIGNJET 130 (DJ 130) and the pigment-based E PSON
STYLUS PRO 40002 (SP 4000) and EPSON STYLUS PRO 7600 (SP 7600) large-format printers.
These elements of Quality, Speed, and Cost are key essentials of users’ value.
The SpencerLab Digital Color Laboratory is an independent test laboratory with a
broad base of industry clients. Although this comparative study was commissioned by
Hewlett-Packard Company, SpencerLab believes these results maintain its reputation for
the integrity of its procedures and analyses. Results stated herein are based upon direct
testing by SpencerLab personnel of actual products believed to be representative.
Executive Summary
Overall, Print Quality of the HP DJ 130 output is of superior quality. Images produced on the DJ 130 are excellent, with exceptional smoothness, sharpness, and saturation; output is free from grain, print artifacts and banding. The DJ 130 renders higher
quality Tints and Color Lines than the SP 4000 and SP 7600, with output that is vivid,
smooth and sharp. Color Text output of the DJ 130 is sharp and crisp, comparable to the
SP 7600 and higher quality output than the SP 4000.
The DJ 130 displayed less Differential Gloss than either the SP 4000 or the SP 7600,
with less than half as much at 60° and almost as significant at 20°. Qualitative analysis
indicated less Differential Gloss was evident within the Black regions of image test
documents -- allowing the DJ 130 to produce smoother, more pleasing images. The DJ
130 also provided better Gloss Uniformity across the tested page, with a lower standard
deviation than either the SP 4000 or SP 7600.
The DJ 130's Black Optical Density/L* was better than the competitive printers, with
Black Optical Density of the DJ 130 substantially higher than either the SP 4000 or SP
7600. Additionally, the L* value of the DJ 130 produced Black was almost four times less
1
New HP 85 dye-based color ink cartridges were introduced with the launch of the DesignJet 130/30 series.
2
Testing was performed prior to US release of the Epson SP 4000, using an Epson PX6000 – the Japanese version
believed to be functionally equivalent.
spencerLAB DIGITAL COLOR LABORATORY
www.spencerlab.com
631-367-6655 Fax: 631-367-2878
Division of SPENCER & A SSOCIATES PUBLISHING, LTD.
Three Giffard Way, Melville, NY. 11747-2310
2
(less is better) than that of the Epson printers. Deep Blacks allow for crisp and sharp
printing, and more visible detail in the shadow areas of images.
Short-term color stability of the dye-based DJ 130 inks was greater than the pigmentbased inks of the SP 4000 and SP 7600 printers -- on average with color shifts at less
than half the Epson prints. Short-term color stability is important to users requiring critical color comparison for proofing over hours and days. Good short-term color stability
with minimal color shifts allows accurate color interpretation in an optimal proofing environment.
In the area of metamerism, comparisons were made between D50 and other illuminant conditions. All tested printers offered comparable degrees of metamerism, however
Grays on the DJ130 vary significantly less when changing illuminants than either the SP
4000 or SP 7600. This results in black and white output of the DJ 130 to vary less in
color (gray) viewed under different lighting. Low metamerism allows press operators or
photographers to match proofs, even when changing illumination.
Test results of Throughput Speed Performance at relatively similar Image Quality levels show that the DJ 130 was able to produce a print at speeds of up to 66% faster than
either the SP 4000 or SP 7600. When operating at similar speeds, the DJ 130 allows
higher image quality output.
Ink Yield testing and Cost-per-Print analysis show that the DJ 130 had a lower Costper-Print than that of the SP 4000 on the photographic image test document. The SP
4000 was 9% more expensive when including ink and user-replaceable components;
when comparing ink usage only, the SP 4000 was 23% more expensive than the DJ130.
Additionally, ink is used in Printhead Cleanings and upon Printer Initialization,
which translates to further ink costs. During these procedures, the DJ 130 was found to
use only neglible amounts of ink. The SP 4000 had higher ink usage amounts during
these processes, with significant ink usage during Power Cleanings and Initialization.
The DJ 130 printer offers an excellent interface, on the control panel and in the
printer software and drivers. Color calibrations and alignments are automatic, ensuring
print quality and color accuracy. Approved media offers a good variety of sizes and thicknesses and with a smaller footprint and weight than the SP 4000 and SP 7600, the
printer is sized to fit in well into the office environment.
(The full report may be downloaded at http://www.spencerlab.com)
October 2004
Copyright 2004 Spencer & Associates Publishing, Ltd. Results and analyses in this report are based upon testing procedures developed and implemented by SpencerLab in
our continuing commitment to accuracy and integrity, and are based upon our best knowledge at the time of publication.
3
General Methodology
Testing of the HP DJ 130, Epson SP 4000 and Epson SP 7600 printers were via
USB connectivity with a 1GHz G4 PowerPC iMac with a 75 GB hard drive and 256 MB
DDR SDRAM running Mac OS X (10.3.3). Driver and firmware versions of each printer
were as listed in the following table:
Driver
HP DJ 130
Epson SP 4000
Epson SP 7600
Driver
2.4.1
1.85
1.64
Firmware
D.03.03/.05
I02341 P
BN0434 P
Print Quality Methodology
A variety of test documents selected from the SpencerLab Printer Test Suite was
printed on each of the printers in a range of print modes, after printer setup and alignment. These test documents included current versions of the Color Spectrum RGB and
Graphic RGB files (originally developed as part of the Color Hardcopy Quality Factors
study series). Also included was the Enhanced Graphic PostScript file (originally developed as part of the Hardcopy Quality Enhancement study) and a variety of image test
documents from the suite, covering the expected printing requirements for this class of
printers. Print Quality was analyzed by element type (e.g., Images, Tints, Blends, Lines,
and Text) across these test documents. Print modes comparison included NORMAL,
BEST, and MAXIMUM DPI of the DJ 130 and SUPER F INE /F INE , PHOTO/SUPERFINE,
and SUPERPHOTO modes of the SP 4000 and SP 7600 printers. Media range included
Matte, Satin/Semigloss, Glossy, and Proofing papers. Additional analysis encompassed
Differential Gloss, Black Density, Short-term Color Stability, and Metamerism. A single
printer of each manufacturer was used in the analysis and assumed to be representative.
Enhanced Graphic
Color Spectrum RGB
Graphic RGB
Test Results and Analysis
HP DJ 130 print quality is generally more than comparable to that of the SP 4000
and SP 7600, particularly in the areas of Color Text and Lines, Tints, and overall Image
quality. Areas for improvement include Black Lines, Blends, and Image realism.
Copyright 2004 Spencer & Associates Publishing, Ltd. Results and analyses in this report are based upon testing procedures developed and implemented by SpencerLab in
our continuing commitment to accuracy and integrity, and are based upon our best knowledge at the time of publication.
4
Images
Unlike computer-generated graphics, images are the result of sampled raster data and
seamlessly combine the quality elements of graphics, tints, and blends. Because of the
wide range of potential subject matter in an image, a printer’s ability to produce realistic,
high-quality images is extremely difficult, but critical to the user’s quality perception;
even if only at the time of product selection; therefore, a printer must produce high
quality images.
Babies
Covered Bridge
Castle
Isle
La Boca
The use of photographic data sources for images leads to a high demand for color fidelity. This includes accurate reproduction of memory colors – those with which users are
heuristically familiar – without requiring an original for comparison. Natural greens, sky
blues, wood browns, and skin tones represent common memory colors that can tax a
printer’s color rendering ability due to color gamut restrictions, imprecise color balance,
or sub-optimal colorants. Another demand for image color fidelity is matching a colorcorrected photograph such as a calibrated image file with an associated profile or in a
standardized color space such as sRGB or SWOP. Although sometimes causing conflict,
both objectives are important.
High spatial frequency, high-contrast detail within an image reflects a printer’s ability to
provide high quality text and graphics. The device resolution is used to carry the high
level of fine detail. In areas of little variation (low spatial frequency), process noise and
screen artifacts (in the case of non-continuous-tone printers) can be readily apparent. Finally, smoothly varying regions require blend linearity in order to accurately capture the
realistic appearance and visual depth of the original.
The DJ 130 produces images that are very smooth, vivid and sharp. Images are clear
and crisp with excellent contrast, resulting in faithful reproduction of fine details. On
both HP satin and glossy media, the DJ 130 renders images that are free from grain,
Copyright 2004 Spencer & Associates Publishing, Ltd. Results and analyses in this report are based upon testing procedures developed and implemented by SpencerLab in
our continuing commitment to accuracy and integrity, and are based upon our best knowledge at the time of publication.
5
print artifacts and banding. Images have excellent saturation and richness resulting in extremely pleasing skin tones and skies, as seen in the Babies and Isle Files. The Woman's
Headshot, containing realistic color and good shadow detail, displays some contour artifacts. Though images look exceptionally bright and pleasing, a slight bluish colorcast is
visible, particularly in the sky and foliage of the Castle image, which detracts from the
overall realistic feel. The DJ 130 renders colors that are most realistic and true-to-life on
HP Proofing Semi-Gloss Paper in BEST mode.
Images on the SP 4000 lack richness and contrast, appearing soft in comparison to
those printed to DJ 130. Images are fairly smooth, with some minor grain visible in the
sky and clouds of the Castle and Isle images. Minor banding is also evident. Neutral colors are produced without any disturbing colorcasts; however, sky areas appear slightly too
purple. Green grass has a yellowish cast, making foliage appear artificial and aesthetically
unpleasing. Images also lack contrast, resulting in loss of highlight image details, as on
the LaBoca image. Skin tones appear a bit washed-out. Differential gloss of black regions
is noticeable on test images.
The SP 7600 produces images that are fairly smooth, sharp and rich. Images are more
realistic than those produced by the SP 4000, particularly in the skin tones and sky regions, though skins tones on the Babies file have a slight yellow cast. Although the
Woman's Headshot contains realistic color and good shadow detail, it displays artificial
contours. Neutrals have a slight cyan cast, noticeable on the mountain rock face and walls
of the Castle image. When compared to image prints from the SP 4000, SP7600 prints
are more saturated, resulting in slight loss of shadow details, as in the LaBoca image. On
Epson Professional Glossy Paper, with High Speed Printing OFF, the SP 7600 delivers
image quality comparable to DJ 130, as seen on the Castle image. The resulting image
has good saturation and richness, resulting in an overall pleasing image at the expense of
minor image detail loss in the shadow regions. Differential gloss is detectable in black regions on test images.
Tints and Blends
Reflecting their related print quality issues, Tints and Blends are discussed separately
below.
Tints
Unlike solid printing, tints introduce an increased sensitivity to resolution and mechanical issues. A tint is a large area of a single unsaturated color, such as pink, sky-blue, or
brown. Therefore, it is also sensitive to hue color errors.
Traditional screening creates a tradeoff between resolution and the number of available
intermediate colors that may be unfavorable. To enhance the number of colors a printer
can produce, vendors have often introduced super-pixel dithering over traditional
screening – even though this runs some risk of introducing pattern artifacts and moiré
effects that can be annoyingly visible. Stochastic screening modulates the placement between high-resolution dots (spatial frequency modulation), minimizing most artifacts;
however, this technique requires good color registration and may yield grainy pastels.
Copyright 2004 Spencer & Associates Publishing, Ltd. Results and analyses in this report are based upon testing procedures developed and implemented by SpencerLab in
our continuing commitment to accuracy and integrity, and are based upon our best knowledge at the time of publication.
6
Tints on the DJ 130 are extremely vivid and smooth with no disturbing graininess or
screening pattern visible. Tints are free from mottle, banding and print artifacts.
While tints on the SP 4000 and SP 7600 are also smooth and free from mottle and
visible screening, slight graininess is noticeable in light pastel Tints when using Epson
Enhanced Matte media.
Blends
Blends are smooth transitions between two or more colors, sometimes referred to as gradients or vignettes. While incorporating all the issues of tint generation, Blends additionally require an abundance of color levels, smooth transitions between these colors without obvious transitions and boundaries, and perceptual linearity of hue, saturation, and
lightness ramps.
Highlights and shadows often deteriorate blend quality. This is due to the difficulties involved in providing accurate differentiation of shades in heavily toned regions, and in
providing a sufficient number of pastel shades to smooth the transition to paper white
without annoying graininess.
Since a majority of print jobs will require a conversion from RGB to CMY, and since
user documents in this market segment are increasingly created in RGB, the ability to
produce high-quality RGB blends is more important than CMY blends.
Blends are vibrant on the DJ 130, but exhibit harsh transitions when moving from
highlight to shadow, with very short mid-tone ranges. Non-linearities are displayed in
Green, Blue, and Purple Blends. The Rainbow Blend, though overall smooth and free
from screening, displays harsh transitions in Yellow-to-Green and Blue-to-Magenta regions.
Blends on the SP 4000 and SP 7600 are less saturated than those of the DJ 130, but
are smoother – with a more even distribution between the highlight, mid-tone, and
shadow ranges. The SP 4000 displays harsh transitions in the Yellow and Purple regions,
whereas the SP 7600 does so in the Yellow, Purple, and Green regions. Rainbow Blends
are mostly smooth, with both Epson printers exhibiting a non-linearity in the Blue region, and an additional harsh transition from Blue to Magenta visible on the SP 4000
output.
Line Graphics
As a graphical element, lines are critical in representing data, forming the basis of schematic rendering and contributing to artistic graphics; in fact, the prevalence of lines in
printed material is overwhelming and nearly as common as text. Of these, the most
common are vertical and horizontal ruled lines – fortunately the simplest to render on a
rectilinear grid. Because of the geometry of such a grid, diagonal lines are subject to an
increase in minimum thickness; a printer’s ability to maintain line thickness between the
thinnest straight and diagonal lines is a tradeoff between offering thinner straight lines or
greater uniformity.
While this uniformity issue is often of minor importance for discrete lines of different
angles, curved lines require that they do not appear to vary in thickness unintentionally.
In transitioning along curved lines from vertical or horizontal orientations to the angles
Copyright 2004 Spencer & Associates Publishing, Ltd. Results and analyses in this report are based upon testing procedures developed and implemented by SpencerLab in
our continuing commitment to accuracy and integrity, and are based upon our best knowledge at the time of publication.
7
between, many rendering algorithms will create noticeable artifacts that emphasize the
jaggedness of the pixel grid.
In addition to width non-uniformity, lines often illustrate deficiencies such as drop out
and ghosting, halftoning issues (some halftone algorithms are designed for use over large
areas, but also employed in thin line situations), and color registration problems perpendicular to the orientation of the line.
Lines produced by the DJ 130 are smooth and sharp. Color Lines are correctly rendered with requested thicknesses, enhancing image depth. Fine line reproduction is excellent. On the test car drawing, the radiator grill and the word "Mazda" are sharp and
clear. Black Lines, though equally sharp, are not rendered as pure Black and some minor
misregistration reveals UCA.
Both the SP 4000 and SP 7600 produce Lines with disturbing stepping, visible without magnification. Thin lines are reproduced too thickly, resulting in fill-in on the letters
of the Mazda car and in the rendering of the smaller car components.
Text
Text represents the most common element of print. It is primarily comprised of thin,
filled solid regions. As the primary vehicle for communicating ideas, most text fonts are
intended to be very legible yet unobtrusive to the reader. Display fonts are intended to
bring artistic design as well. Quality limitations can cause distractions that subtract from
the effectiveness of the communication; in the worst case, they can render text illegible or
ugly.
Color is used to highlight and emphasize, as well as design – improper rendering of such
color can shift the emphasis from key idea to the lack of adequate or pleasing print quality. Because most colors (all but pure primaries and secondaries) require some halftoning
even at full saturation, text quality is often decreased further due to the halftone cell
structure.
Uniform character stroke weights and spacing provide uniform “typographic color”, the
perceived overall darkness of the text. This enhances effective communication when successful, but may detract significantly when distorted and uneven. Font details such as
fine serifs, thin strokes, and uniform kerning can easily be lost due to poor reproduction.
Overall, Text quality of the DJ 130 is comparable to the SP 7600, with excellent
clarity, sharpness and legibility.
Color Text quality of the DJ 130 is higher than the SP 4000 and comparable to the
SP 7600. Color Text is smooth, with even transitions and good saturation. Black Text
exhibits minor misregistration, with Under Color Addition (UCA) slightly visible. Overall, Text appears sharp and smooth.
Color Text quality of the SP 4000 is inferior, with less saturation and more jaggedness than either the DJ 130 or the SP 7600. On both Epson printers, some minor
screening is visible in the tertiary colors. Both Black Text and Color Text of the SP 4000
and the SP 7600 are less saturated than that of the DJ 130.
Copyright 2004 Spencer & Associates Publishing, Ltd. Results and analyses in this report are based upon testing procedures developed and implemented by SpencerLab in
our continuing commitment to accuracy and integrity, and are based upon our best knowledge at the time of publication.
8
Differential Gloss
A print surface has some level of gloss; this is changed in varying amounts when ink is
deposited on the surface to create the print’s colors, including black. Differential gloss
becomes annoying when the gloss of the media and the ink applied to the media is not
equal throughout the print, detracting from the color print quality. Areas of high differential gloss can be detracting on photographic images as well as on mixed color and
monochrome text and line drawing documents. Gloss uniformity often enters into the
customer’s buying decision for printing and proofing systems.
Methodology
The DJ 130, SP 4000, and SP 7600 printers were warmed up and in ready mode, with
print engine maintenance (including but not limited to color calibration, nozzle check,
cleaning and printhead alignment) performed as per manufacturer’s recommendations/
users manual. The most recent available printer driver and firmware for each competitive
printer was used. The INCITS W.1 Committee DRAFT Differential Gloss Test Chart
(CMYK version 1.0, 2002, PDF) was printed on 13 x 19 cut sheets of the specified paper
type selected from each manufacturer’s approved list of paper types. Factory/Preset/default driver conditions for each competitive test printer with defaults for the specified paper type were used. Page size modifiers (Fit To Page), font substitutions etc. were
turned off; however, page placement modifiers such as image centering on page were
used.
HP DJ 130
Epson SP 4000
Epson SP 7600
Media
HP PREMIUM PLUS
PHOTO PAPER GLOSSY
EPSON PREMIUM
GLOSSY PHOTO PAPER
EPSON PREMIUM
GLOSSY PHOTO PAPER
Driver
2.4.1
1.85
1.64
Firmware
D.03.03
I02341 P
BN0434 P
Gloss measurements were performed using a calibrated BYK Gardner micro-TRIgloss Gloss meter. Gloss values of forty test file patches were measured using 60-degree
gloss measurement geometry (G60). In accordance with industry practice, in situations
where the Mean Gloss value was above G60 of 75 units, the gloss value of the forty test
patches was re-measured using 20-degree measurement geometry (G20). Mean Gloss was
calculated as the average of the forty test file patches (including media white). Maximum
(Gmax) and Minimum (Gmin) gloss values of the forty test patches were identified and
the corresponding differential gloss (Gdiff) value determined by the following formula:
Gdiff = Gmax – Gmin
Copyright 2004 Spencer & Associates Publishing, Ltd. Results and analyses in this report are based upon testing procedures developed and implemented by SpencerLab in
our continuing commitment to accuracy and integrity, and are based upon our best knowledge at the time of publication.
9
Results
As can readily be seen in the following charts, the DJ 130 displayed significantly
lower Differential Gloss than either the SP 4000 or the SP 7600 at both 60° and 20°.
The Epson Glossy Photo Paper measured a substantially lower paper-white gloss
(shown as circles in the graph below) than the HP Premium Plus Photo Paper Glossy.
The ink used to create all other colors increased the gloss on both the SP 4000 and SP
7600, while it decreased the gloss on the DJ 130. Differential Gloss at 60° was less than
half as much on the DJ 130 as on either the SP 4000 or the SP 7600, while at 20° the
results were almost as significant.
The DJ 130 also provides better gloss uniformity across the test page, as can be seen
by the lower Standard Deviation:
Differential Gloss – 20°
Copyright 2004 Spencer & Associates Publishing, Ltd. Results and analyses in this report are based upon testing procedures developed and implemented by SpencerLab in
our continuing commitment to accuracy and integrity, and are based upon our best knowledge at the time of publication.
10
Differential Gloss – 60°
Black Optical Density/L*
High density blacks offer the user more intense photographic image detail, especially in
the high contrast and shadow areas, as well as providing crisp, sharp black text and
graphics printing.
Methodology
A B-size RGB test file from the SpencerLab Digital Color Laboratory was printed from
Adobe Photoshop on the DJ 130, SP 4000, and SP 7600. Prior to testing, complete print
engine maintenance (including but not limited to color calibration, nozzle check, cleaning and printhead alignment) was performed per manufacturer’s recommendations/users
manual. Printer engines were warmed and in ready mode; driver defaults for specified
paper type, 13 by 19" cut sheets, listed below were utilized:
MEDIA
HP DJ 130
Epson SP 4000
Epson SP 7600
HP PREMIUM PLUS
PHOTO PAPER SATIN
EPSON PREMIUM
SEMIGLOSS PHOTO PAPER
EPSON PREMIUM
SEMIGLOSS PHOTO PAPER
HP PREMIUM PLUS
PHOTO PAPER GLOSSY
EPSON PREMIUM
GLOSSY PHOTO PAPER
EPSON PREMIUM
GLOSSY PHOTO PAPER
Copyright 2004 Spencer & Associates Publishing, Ltd. Results and analyses in this report are based upon testing procedures developed and implemented by SpencerLab in
our continuing commitment to accuracy and integrity, and are based upon our best knowledge at the time of publication.
11
The test file consists of nine (9) 100% Black, one-inch test patches positioned on the
page to account for any print variations (four corners plus midpoints: top-left-corner
(TLC), center-top (CT), top-right-corner (TRC), center-left (CT), center (C), centerright (CR), bottom-left-corner (BLC), bottom-center (BC), and bottom-right-corner
(BRC)).
CIELab Lightness and Density measurements were taken using a calibrated X-Rite
938 series Spectrodensitometer, calibrated with CIE (1931) 2-degree observer. CIE D50
illuminant (D50-2) Lightness and Status T (DEN T) visual density values were measured. Average Lightness (L*) Value (mean of nine patch measurements) and Average Visual Density (v) (mean of nine patch measurements) were also calculated.
Results
Black Optical Density: Lightness
On both media, the L* value of the Black produced by the DJ 130 was almost four
times less (less is better) than that of the Epson printers, as is graphically illustrated on
the preceding graph. Deeper Blacks allow for increased detail within shadow (dark) areas
of images.
Copyright 2004 Spencer & Associates Publishing, Ltd. Results and analyses in this report are based upon testing procedures developed and implemented by SpencerLab in
our continuing commitment to accuracy and integrity, and are based upon our best knowledge at the time of publication.
12
Black Optical Density: Status T
As seen in the graph above, the DJ 130 measured substantially greater Black density
than either the SP 4000 or the SP 7600, on both glossy and satin (semi-gloss) finish media.
Whether thought of as Density or CIE Lightness, HP Blacks measured Blacker.
Color Stability
Inks require some minutes after printing to dry; thereafter, there may be continuing slow
color change. Long-term color stability has gained considerable interest of late; however,
short-term color stability is perhaps even more important to users who require critical
color comparison for proofing and other uses over hours and days. Improved print stability with minimal color shifting reduces the possibility of color misinterpretation and
provides an optimal proofing environment.
Methodology
A test file consisting of 108 RGB color patches3 was printed on the DJ 130, SP 4000,
and SP 7600. Prior to testing, complete print engine maintenance (including but not
limited to color calibration, nozzle check, cleaning and printhead alignment) was performed per manufacturer’s recommendations/user manual. Printer engines were warmed
and in ready mode; driver defaults for specified paper types4 were used:
3
The test file was supplied by HP.
The SP 7600 does not have a media setting specific to Epson Semimatte Proofing Paper. Epson technical support
recommended the use of the Photo Semigloss Paper driver setting.
4
Copyright 2004 Spencer & Associates Publishing, Ltd. Results and analyses in this report are based upon testing procedures developed and implemented by SpencerLab in
our continuing commitment to accuracy and integrity, and are based upon our best knowledge at the time of publication.
13
MEDIA
HP DJ 130
Epson SP 4000
Epson SP 7600
HP PROOFING SEMI-GLOSS
PROOFING PAPER
COMMERCIAL SEMIMATTE
PROOFING PAPER
COMMERCIAL SEMIMATTE
The test prints were stored in a light protected, ambient office environment. CIELab
measurements were made using a calibrated X-Rite 938 series Spectrodensitometer at 5
minutes, 10 minutes, 15 minutes (reference), 30 minutes, 1 hour, 6 hours, 24 hours, and
at 24-hour intervals thereafter for 13 additional days.
Color difference (∆E) values were calculated based on the CIELab measurements.
Results
The DJ 130, a dye-based ink printer, displayed greater short-term color stability than
the pigment-based SP 4000 and SP 7600 printers. While the Epsons’ initial dry time was
a few minutes shorter, the DJ 130 was noticeably more stable once dry (after 15 minutes), shifting colors on average at less than half the rate of the Epson prints. This is
shown in the following graph.
Short-Term Color Stability
1
HP Designjet 130
∆E (emperical, from 15-minute baseline)
0.9
0.8
Epson SP 7600
Epson SP 4000
Trend: HP Designjet 130
Trend: Epson SP 4000
Trend: Epson SP 7600
0.7
0.6
0.5
0.4
0.3
0.2
0.1
0
0.1
1
10
100
1000
Time in Hours
The difference in color stability after fourteen days (two weeks) is shown in the following CIE a*b* projection. The size of each circle is proportional to the change from
the first measurement, while its position corresponds to its interpretation of the 108
RGB colors.
The generally larger SP 4000 and SP 7600 circles correspond to the Epson’s larger
color errors.
Copyright 2004 Spencer & Associates Publishing, Ltd. Results and analyses in this report are based upon testing procedures developed and implemented by SpencerLab in
our continuing commitment to accuracy and integrity, and are based upon our best knowledge at the time of publication.
14
14-Day Color Stability
Copyright 2004 Spencer & Associates Publishing, Ltd. Results and analyses in this report are based upon testing procedures developed and implemented by SpencerLab in
our continuing commitment to accuracy and integrity, and are based upon our best knowledge at the time of publication.
15
Metamerism
Color is created by the combination of a source of illumination, an object that transmits
or reflects some of that illumination, and a sensor that receives the resultant light energy.
The illumination source and the receiving sensor may each have a constant response over
the visible spectrum; it that case, only the spectrum of the energy transmitted or reflected
by the object will change its color. However, changing the Illumination source to one
with a different spectral energy distribution may also change the color that the sensor receives.
Metamerism is the effect created when two objects, such as a sweater and skirt or an object and a printed image of it, appear differently under one light source than another.
The sensor may be the human eye. For example, the sweater and skirt may match under
store fluorescent lighting, but incandescent (tungsten) lighting or daylight conditions
may show a marked color shift between them. A photographer trying to match his subject does not want it to appear correctly under only one lighting source; a press operator
does not want to match a proof whose colors do not look as they did when approved under different lighting conditions.
Methodology
A SpencerLab Digital Color Laboratory test file consisting of 29 patches, including
grayscales and high saturation colors, was printed on the DJ 130, SP 4000, and SP 7600.
Prior to testing, complete print engine maintenance (including but not limited to color
calibration, nozzle check, cleaning and printhead alignment) was performed per manufacturer’s recommendations/users manual. Printer engines were warmed and in ready
mode; driver defaults for specified paper type:
MEDIA
HP DJ 130
Epson SP 4000
Epson SP 7600
HP PREMIUM PLUS
PHOTO PAPER GLOSSY
EPSON PREMIUM
GLOSSY PHOTO PAPER
EPSON PREMIUM
GLOSSY PHOTO PAPER
HP PREMIUM PLUS
PHOTO PAPER SATIN
EPSON PREMIUM
SEMIGLOSS PHOTO PAPER
EPSON PREMIUM
SEMIGLOSS PHOTO PAPER
Measurements were performed using a calibrated X-Rite 938 series Spectrodensitometer, CIE (1931) 2-degree observer under various illuminant conditions. The D50
daylight baseline was then compared with F11 fluorescent, F2 cool white fluorescent, and
Illuminant A incandescent.
Copyright 2004 Spencer & Associates Publishing, Ltd. Results and analyses in this report are based upon testing procedures developed and implemented by SpencerLab in
our continuing commitment to accuracy and integrity, and are based upon our best knowledge at the time of publication.
16
Metamerism
Copyright 2004 Spencer & Associates Publishing, Ltd. Results and analyses in this report are based upon testing procedures developed and implemented by SpencerLab in
our continuing commitment to accuracy and integrity, and are based upon our best knowledge at the time of publication.
17
Comparisons were made between D50 and other illuminant conditions and the color
difference was calculated in ∆E2000 values.
Results
All tested printers offered comparable degrees of metamerism when viewing changes
from D50 to F11, to F2, and to illuminant A lighting, as can be seen from the colored
bars in the preceding three graphs.
However, Grays on the SP 4000 and SP 7600 vary significantly more than on the DJ
130 when viewing changes from D50 to F11, F2, and illuminant A lighting conditions,
as can be seen from the gray bars in the preceding three graphs. As such, black and white
output of the DJ 130 will vary less in color (gray) when viewed in different lighting
situations. Typically, The human eye cannot detect changes in color when less than 1∆E.
A standard ∆E analysis does not yield significantly different results from these ∆E2000
calculations.
Although there is little difference in the average amount of metamerism of colors,
black and white output of the DJ 130 will vary less in color (gray) when viewed in different lighting situations
Copyright 2004 Spencer & Associates Publishing, Ltd. Results and analyses in this report are based upon testing procedures developed and implemented by SpencerLab in
our continuing commitment to accuracy and integrity, and are based upon our best knowledge at the time of publication.
18
Image Quality vs. Throughput Speed Performance
Each of the tested printers has multiple Print Quality modes. These do not necessarily
match each other, especially between manufacturers. Throughput Speed Performance is
generally slower in higher Print Quality modes. Therefore, direct comparison of
Throughput Speed Performance requires a better understanding and a basic comparison
of Print Quality in order to normalize the differences among the printers.
Methodology
An sRGB photographic image test file from the SpencerLab
Printer Test Suite, the Castle, was selected to represent an appropriate large-format user application. The image area was adjusted to
11 by 17 inches at 250 dpi, centered on 13 by 19 inch media.
Since different print modes are available on each printer, a focused print quality evaluation was performed on both Glossy and
Satin/Semigloss media to rate output quality levels among the
various modes.
All time measurements begin with the request-to-print and the
Total Print Time measurement is taken when the printed page drops into the output tray
or is ejected from the printer. All timings were recorded over several iterations to assure
accurate results.
Results
Image Quality vs. Speed – Glossy Media
Better-->
HP Designjet 130
Epson SP 4000
Epson SP 7600
Max DPI
Best
SuperPhoto
HP DJ 130 offers
better quality
at similar speed
Relative Print Quality
HP DJ 130 offers higher
speed at similar quality
Normal
SuperPhoto
SuperFine
Photo
SuperFine
Fine
Fine
00.0
Normal
05.0
<--Shorter is better
10.0
15.0
20.0
25.0
Total Print Time (minutes)
Copyright 2004 Spencer & Associates Publishing, Ltd. Results and analyses in this report are based upon testing procedures developed and implemented by SpencerLab in
our continuing commitment to accuracy and integrity, and are based upon our best knowledge at the time of publication.
19
On Glossy media, as illustrated in the preceding graph, the DJ 130 BEST mode was
judged comparable to the SP 7600 SUPERPHOTO mode; the DJ 130 NORMAL mode was
judged comparable to the SP 4000 SUPERPHOTO mode and the SP 7600 SUPERFINE
mode.
In the light of the throughput testing results, the DJ 130 provides essentially similar
image quality at significantly faster speeds, up to 66% quicker.
Image Quality vs. Speed – Satin/Semigloss Media
Better-->
HP Designjet 130
Epson SP 4000
Epson SP 7600
Best
HP DJ 130 offers higher
speed at similar quality
Max
SuperFine
SuperFine
HP DJ 130 offers
better quality
at similar speed
Relative Print Quality
SuperPhoto
Photo
SuperPhoto
Normal
Fine
Normal
Fine
00.0
05.0
<--Shorter is better
10.0
15.0
20.0
25.0
Total Print Time (minutes)
On Satin/Semigloss media, as illustrated above, the DJ 130 BEST mode was judged
comparable to the SP 7600 S UPER P H O T O mode and better than the SP 4000
SUPERPHOTO mode and the SP 7600 SUPERFINE mode. Therefore, the DJ 130 provides
essentially similar high image quality at significantly faster speeds, up to 57% quicker.
The DJ 130 NORMAL mode was judged comparable to the SP 4000 SUPERFINE
mode, not quite a high as its PHOTO mode, but higher than the SP 7600 FINE mode.
Therefore, the DJ 130 provides similar moderate-quality/speed performance, slightly below the SP 4000 and above the SP 7600.
Copyright 2004 Spencer & Associates Publishing, Ltd. Results and analyses in this report are based upon testing procedures developed and implemented by SpencerLab in
our continuing commitment to accuracy and integrity, and are based upon our best knowledge at the time of publication.
20
Ink Yield and Cost-per-Print
The cost of inkjet printing has been coming down from levels that many consumers feel
is excessive. Therefore, there is increasing customer interest in learning what those costs
will be, and in seriously considering those costs in the initial purchase decision. In fact,
significant reductions in Cost-per-Print may by itself justify the purchase of a new, replacement printer.
A significant portion of the Total Cost of Ownership (TCO), ink Cost-per-Print is determined by the cost of a print cartridge and the average number of prints it can make.
Other user-replaceable components may be included to improve TCO estimates.
Methodology
The determination of ink cost-per-print is based upon measuring the amount of ink
used to make the print, calculating the corresponding use of any user-replaceable components, and factoring that by the cost of each. This process is implemented over a number
of prints in order to reduce measurement errors and improve calculation accuracy.
The amount of ink used to make a print may be determined by measuring the difference between the amount of ink in each color cartridge at the start and at the conclusion
of the printing process. Taking the difference eliminates the weights of the ink cartridges
themselves, leaving only the difference in the weight of the ink. Since ink weighs very
close to one gram per milliliter (ink density = 1g/ml), this differential weight (in grams)
is also equivalent to the volume of ink used (in milliliters). This is then factored by the
cost of that amount of ink.
User-replaceable components include items that the manufacturer anticipates the user
will need to replace over the life of the printer. The DJ 130 user-replaceable components
include the individual ink printheads; the SP 4000 includes the maintenance tank and,
for roll feed printing, the cutter blade.
An sRGB photographic image test file from the SpencerLab
Printer Test Suite, the Castle, was selected to represent an appropriate large-format user application for the DJ 130 and the SP 4000
printers. The image area was adjusted to 11 by 17 inches at 250
dpi, centered on 13 by 19 inch media.
Using the vendor-published list prices, the component cost of
ink for each color and user-replaceable components are calculated.
One hundred copies of the Castle image, two 10-copy sets per day,
were sent to the printers for five days, and included a two-day
weekend break (i.e., file printed Wednesday, Thursday, Friday, Monday, Tuesday).
Printers were power cycled off and on before each ten-copy set. Ink cartridge weights
were measured using a calibrated AccuLab V4800 precision scale5.
Using the data the laboratory acquired regarding the volume of each color ink used
and the capacity of the ink cartridges6, Prints-per-Cartridge – the number of prints that
5
The AccuLab V4800 precision scale is rated at 0.1-gram readability and 0.3-gram repeatability.
Copyright 2004 Spencer & Associates Publishing, Ltd. Results and analyses in this report are based upon testing procedures developed and implemented by SpencerLab in
our continuing commitment to accuracy and integrity, and are based upon our best knowledge at the time of publication.
21
could be obtained from each color cartridge and the average over all colors were calculated. User-replaceable component use was also able to be calculated using data acquired.
Cost-per-Print tests were performed in modes as noted on the following chart; print
driver defaults for the specified media were utilized.
COST-PER-PRINT MODES
HP DJ 130
Epson SP 4000
Print Quality
NORMAL
SUPERFINE
Media
HP PREMIUM PLUS
PHOTO PAPER GLOSSY
EPSON PREMIUM
GLOSSY PHOTO PAPER (250)
Cartridge Costs
Manufacturer list prices of cartridges in US$, as of June 2004:
CARTRIDGE COSTS
HP DJ 130
Epson SP 4000
Color Cartridges
$34.99
$69.95
Black Cartridges
$43.99
$69.95
Color Printheads
$35.99
—
Black Printheads
$39.99
—
Maintenance Tank
—
$39.00
Cutter Blade
—
$95.00
Test Results and Analysis
The DJ 130 had a lower Cost-per-Print than that of the SP 4000 on the Castle image
test document. The SP 4000 was 9% more expensive when including ink and userreplaceable components. When comparing ink usage only, the SP 4000 was 23% more
expensive than the DJ130.
The DJ130 produced this photographic print for a total estimated cost of $1.13 per
print inclusive of printhead amortization, its only User-Replaceable component. The SP
4000 produced this print for a total estimated cost of $1.23, including maintenance tank
amortization – the SP 4000 prints were 9% more expensive than those of the DJ 130.
When comparing solely incremental ink usage, the DJ 130 Cost-per-Print advantage
is more significant. The DJ 130 produced this 11 by 17 inch image area photographic
print for a total estimated cost of $0.98; the SP 4000 was 23% more expensive, with a
total estimated cost-per-print of $1.20.
6
Ink capacity based upon manufacturer's published cartridge volume figures.
Copyright 2004 Spencer & Associates Publishing, Ltd. Results and analyses in this report are based upon testing procedures developed and implemented by SpencerLab in
our continuing commitment to accuracy and integrity, and are based upon our best knowledge at the time of publication.
22
Cost-per-Print and Ink Usage
Additionally, for the user who needs to maintain a spare set of inks in-house, the cost
of an Epson SP 4000 ink set is more than 2.5 times higher than the cost of a DJ 130 ink
set.
COST-PER-PRINT
Ink only
Printheads
HP DJ 130
$0.98
$0.14
Maintenance Tank
Ink and User-Replaceables
Cutter†
Ink and User-Replaceables
—
$1.13
—
$1.13
Epson SP 4000
$1.20
—
$0.03
$1.23
$0.10
$1.33
The components of SpencerLab's Cost-per-Print analysis are shown in the graphs
above, and summarized in the following table. Media cost was not included.
†
The cutter cost of the Epson SP 4000 was not factored into the final Cost-per-Print
calculations discussed and graphed above, since testing was performed with cut-sheet
media. However, based upon laboratory testing, an additional cost of up to 10 cents per
tested print could be expected with roll media, increasing the SP 4000 Cost-per-Print to
$1.33, some 18% more expensive than the DJ 130.
Copyright 2004 Spencer & Associates Publishing, Ltd. Results and analyses in this report are based upon testing procedures developed and implemented by SpencerLab in
our continuing commitment to accuracy and integrity, and are based upon our best knowledge at the time of publication.
23
Additional Notes
Printhead Cleaning and Initialization: HP DJ 130 & Epson SP 4000
The HP DJ 130 offers a user-friendly utility to perform printhead cleanings. The Epson SP 4000 offers three printhead cleaning modes, of which two – the Printhead
Cleaning and Power Cleaning – are easily accessible to the average user. The third cleaning option is the Supersonic Cleaning, which is not as user-friendly.
Ink Wastage in Cleaning Cycles
HP DJ 130
On the HP DJ 130, a user is able to run regular maintenance cycles using the printer
software utility. The DJ 130 uses a negligible amount of ink (up to a maximum of 2
grams per cartridge set) for each maintenance cycle, which includes printhead cleaning.
No additional special maintenance or printhead cleaning procedures are suggested. Upon
original installation of the ink cartridges, ink used for alignment and checks are also negligible.
Epson SP 4000
Printhead Cleaning
This cleaning option, recommended if print quality degrades, is accessed by choosing
the CLEANING THE PRINTHEAD selection in the printer software utility. In order to
calculate how much ink was used during the Printhead Cleaning cycle, the printer was
subjected to eight printhead cleaning cycles (nozzle check excluded). Ink used/waste was
calculated for the individual printhead cleaning cycles based upon the weight of the
Copyright 2004 Spencer & Associates Publishing, Ltd. Results and analyses in this report are based upon testing procedures developed and implemented by SpencerLab in
our continuing commitment to accuracy and integrity, and are based upon our best knowledge at the time of publication.
24
Maintenance Tank at the start and finish of each cleaning. Ink used during the eight
cleaning itinerations averaged 4.1 grams for all eight ink cartridges, with a maximum of
4.5 grams and a minimum of 4.0 grams used.
Power Cleaning
Power Cleaning is accessible from the printer's control panel under MAINTENANCE
/ PWR CLEANING. As per the Reference Guide, the printer would require this cleaning
if the regular Printhead Cleaning was not sufficient, when switching to the Dual CMYK
ink set7, or if the printer had not been used for more than six months. All ink cartridges
need to be at least 50% full in order the run this Power Cleaning. Per the User Guide, a
user may need to run the Power Cleaning cycle several times to get a clean nozzle check
pattern.
Three Power Cleaning cycles were performed and ink usage was calculated based
upon the weights of the individual ink cartridges at the start and finish of the cleanings,
as well as the difference in the weight of the Maintenance Tank. The average ink usage
for all eight cartridges, based upon Maintenance Tank measurements, was 82.8 grams –
with a maximum of 84.8 grams and a minimum of 81.1 grams. When the ink usage was
computed based upon the weight differentials of the eight individual ink cartridges, the
maximum value was 87.1 grams, minimum 83.0 grams, and an average of 84.3 grams.
Supersonic Cleaning
This is not a user-friendly function. To access this feature a user must go through the
printer's Maintenance Mode, which requires the user to follow a unique set of instructions and a combination of control panel buttons and power cycling to perform. As per
the Reference Guide, this mode allows the user to perform maintenance procedures that
may be needed occasionally.
The procedure for determining ink usage was the same as used for Power Cleaning.
Individual ink cartridges and the Maintenance Tank weights were taken before and after
each Supersonic Cleaning cycle. Based upon Maintenance Tank measurements, an average of 7.3 grams of ink, with a high of 7.4 grams and low of 7.2 grams, was used by the
eight ink cartridges during each of the cleaning cycles. Cartridge set weight measurements display an average usage of 7.6 grams per cleaning – as in the Power Cleaning a
greater amount than recorded with Maintenance Tank measurement.
Ink Usage upon Initialization
Although the SpencerLab Digital Color Laboratory did not perform the original ink
installation on the Epson SP 40008, the Epson START HERE Manual states, “During
the initial installation process, it is normal for up to one-third of the ink in each cartridge
to be used.”
7
Currently there is no dual CMYK printer model for the U.S. market, nor is there a conversion supported or parts
available for a dual CMYK printer in the U.S. market
8
Testing was performed prior to US release of the SP 4000, using an Epson PX6000 – the Japanese version believed
to be functionally equivalent.
Copyright 2004 Spencer & Associates Publishing, Ltd. Results and analyses in this report are based upon testing procedures developed and implemented by SpencerLab in
our continuing commitment to accuracy and integrity, and are based upon our best knowledge at the time of publication.
25
Miscellaneous
HP DJ 130
The DJ 130 offers a user-friendly interface, both on the printer control panel and in
the printer driver and utility software. Most printer functions, both basic and advanced,
can be assessed from the computer workstation, using the remote Jet Administration
utility.
The DJ 130 is a versatile printer, accepting media from envelope-size up to 24"
wide9, while having at least a 50% smaller footprint and weight than either the SP 4000
(17"max) or SP 7600 (24"max). A stand is optional, but the printer is sized to sit atop a
work area and is easily movable. Media can be as thick as 300 gsm and the printhead
performs automatic head alignments and calibrations to ensure print quality and color
accuracy. As fore mentioned, the new dye-based HP 84/85 inkset offers greater shortterm stability than the pigment-based inks of the Epson SP 4000 and 7600 printers. Additionally, a published research report10 cites the print permanence ratings of the inkset
and points to the inkset's long-term stability.
Running maintenance cycles are a simple process using the Jet Admin utility; a shortcut is even created on the user's desktop. Once the user clicks on the shortcut they are
guided through the process – a few keystrokes and the printer performs the maintenance,
the user is not required to physically handle the printer. HP support is available through
phone support or through the Jet Admin utility. Using Jet Admin the user is able to establish contact with live HP support and information about the printer can be transmitted automatically to the support personnel.
Paper feed issues did arise during testing. The front tray feed was inconsistent in
pulling paper into the printer. Also, when feeding sheet paper through the rear path, with
the roll paper feed attachment installed, there is no edge guide for the user to reference.
Upon completion of printing, output is ejected from the printer forcefully, requiring the
paper stop to be in place. Additionally, it appears that in order to make certain that paper
is aligned prior to printing the printer performs an abundance of alignment tests. These
alignments are time-consuming (performed after the job is sent from the workstation)
and noisy. The automated paper cutter, located on the front edge of the printer, does not
offer any safety feature, such as a covering. Inadvertently, a user could have their hand in
the cutter path. The modular nature of the printer configurations offers the user a costeffective and personalized purchase option.
Epson SP 4000/7600
Multiple Mac OS X drivers are provided for the same model printer, based upon paper usage (i.e. roll, sheet, borderless printing, etc.). Up to nine different "printers" were
created for the Epson SP 4000. Epson documentation and phone support are enigmatic
9
24" media is roll fed paper; roll feed attachment optional for the DJ 130. The DJ 130nr model includes the
Automatic Roll Feed & cutter, along with the JetDirect network card.
10
"Hewlett-Packard Designjet 130 – Print Permanence Ratings" by Wilhelm Research, Inc., August 30, 2004.
Provided for informational purposes; accuracy of the study and reporting not independently verified by SpencerLab.
Copyright 2004 Spencer & Associates Publishing, Ltd. Results and analyses in this report are based upon testing procedures developed and implemented by SpencerLab in
our continuing commitment to accuracy and integrity, and are based upon our best knowledge at the time of publication.
26
on the reasoning behind listing paper choices as "printers" rather than such media
choices being available within one SP 4000 or SP 7600 printer driver. The Epson drivers
lack finesse and require a level of user expertise that is discordant in these times of Plugand-Play devices.
The SP 4000, though it will fit on a workstation, is twice as large – both in weight
and area, as the DJ 130. The printer holds eight ink cartridges, however it only prints in
7 colors (choice of either Photo Black or Matte Black). Full-bleed 17" prints are possible
and the SP 4000 is self-calibrating and self-aligning. A printer stand and networking are
optional.
The SP 7600 is the largest of the three printers, both in footprint and weight. Like
the DJ 130 it is able to handle printing on media up to 24", although borderless pritning
is available. Like the SP 4000, the SP 7600 can perform either 6-or 7-color printing. As
with all the printers tested, printer stand and network connectivity is optional.
The Epson ink cartridge housing, while optimized for standard 110 ml ink cartridges
provides the option of high capacity 220 ml cartridge use. In order to use the high capacity cartridges, the user must leave the printer's ink compartment cover open, as they
extend outward – beyond the printers' real estate. Additionally, the SP 7600 operator
manual cautions against the use of the high capacity cartridges – their use might destabilize the printer when used with the printer on the stand. The Epson PX 6000 (European
version of SP 4000) offers dual CMYK capabilities for faster printing and the SP 7600
(7-ink system) offers either Photo Black or Matte Black ink usage options. In both instances, switching from one ink option to the other uses considerable amounts of ink,
thereby increasing ink usage costs.
The SP 4000 offers multiple printhead cleaning modes. The driver offers only the basic maintenance utility, while the Power Cleaning requires that the user become actively
involved during the process, raising and lowering ink levers at the printer on cue. The
Supersonic Cleaning can only be performed from the printer's control panel. Overall, the
Epson driver and utilities are not as user-friendly as those of the DJ 130.
Copyright 2004 Spencer & Associates Publishing, Ltd. Results and analyses in this report are based upon testing procedures developed and implemented by SpencerLab in
our continuing commitment to accuracy and integrity, and are based upon our best knowledge at the time of publication.
27
About spencerLAB
The SpencerLab Digital Color Laboratory is an independent printer evaluation facility
that provides services to vendors and corporations for whom color printing is missioncritical. The Laboratory follows strict guidelines in the integrity of both methodology
and reporting; vendor-sponsored studies do not guarantee favorable results. SpencerLab
has developed industry-standard test software, and performs print quality, throughput
speed, ink and toner cartridge yield and cost-per-page/TCO, and ease-of-use analyses for
color and monochrome printers in all technology classes, from inkjet and laser printers to
digital color presses.
SpencerLab is operated by Spencer & Associates Publishing, Ltd., a premier IT con-
sulting boutique specializing in the application of Digital Color Technology to all aspects
of color imaging. For over a dozen years Spencer & Associates has been providing strategic support to manufacturers in product planning, development, and launch. Color
printing workflow analysis, print system selection, and usage optimization services are
provided to corporate users.
For more information, please contact SpencerLab by email at [email protected],
on the web at www.spencer.com and www.spencerlab.com, by telephone at 1-631-3676655, or by fax at 1-631-367-2878.
October 2004
Copyright 2004 Spencer & Associates Publishing, Ltd. Results and analyses in this report are based upon testing procedures developed and implemented by SpencerLab in
our continuing commitment to accuracy and integrity, and are based upon our best knowledge at the time of publication.