1
6TH INTERNATIONAL BLAISE USER’S CONFERENCE
MAY 2000
KINSALE, IREAND
List of Sessions and Paper Presentations
Session 1. Case Management and CATI
Using Blaise to Automate the Clerical edit and Telephone follow-up component of the American
Community Survey
Barbara Diskin, US Census Bureau
Central and Local survey administration through communicating data systems
Thomas Hoel, Statistics Norway
Survey Management for the United Enterprise Statistics Program at Statistics Canada
Armin Braslins, Statistics Canada
Monitoring CATI Enumerators
Asa Manning, Leonard Hart, NASS
Session 2. Surveys using Blaise
Use of CAPI instrument in a blind test of the UK 2001 Census form
Lucy Haselden, ONS
Developing a Blaise instrument for the Spanish Bladder Cancer Survey
Richard Frey, Westat
Using Blaise in a nationwide Food Consumption Survey
Lois Steinfeldt, US Department of Agriculture
Challenges in developing a longitudinal survey on income dynamics
Brett Martin, Statistics New Zealand
Data Collection in Two Phase and multi centre Health Survey
Vesa Kuusela, Statistics Finland
Session 3. Blaise and the Internet
Internet assisted coding
Sylvia von Wrisberg, Bavarian State Bureau
Blaise Internet Services put to the test: Websurfing the Construction Industry
Hans Wings and Marko Roos, CBS
The use XML in a Blaise environment
Jelke Bethlehem, Lon Hofman, CBS
The Internet, Blaise and a representative sample
Dirk Sikkel, Adriaan Hoogendoorn, Bas Weerman
List of Sessions and Paper Presentations (continued)
Session 4. Special Applications in Blaise
Audit Trails or How to Display Arabic Text in Blaise
Leif Bochis, Statistics Denmark
Blaise generator for High speed data entry applications
Pavle Kozjek, Statistics Slovenia
ManiTabs: Making tabulations in Ms-EXCEL with Manipula
Tjeerd Jellema
Blaise and API
Steve Anderson, ONS
Session 5. How Survey Organisations use Blaise
Around Blaise Surveys at Statistics Netherlands
Marien Lina, CBS
Blaise in European Community Household Panel of Statistics Italy
Alessandra Sorrentino, ISTA
The process of Making a new CAI operation in Statistics Norway
Hilde Degerdal, Statistics Norway
Five years experience with CAI and Blaise
Fred Wensing, ABS
Session 6. Design issues in using Blaise
Configuration Management and Advanced testing methods for large, complex Blaise instruments
Steven Newman & Peter Steghuis, Westat
Whatever Happened to our data model?
Sven Sjodin, National Centre for Social Research
What users want from a tool for Analysing and documenting electronic Questionnaires: The user
requirement for the TADEQ Project
Maureen Kelly, ONS
Converting Blaise 2.5 to Blaise4Windows
John O’Connor, Jacqueline Hunt, CSO
NASS Conversion to Blaise4Windows with a Visual Basic Interface
Tony Dorn, Roger Schou
List of Sessions and Paper Presentations (continued)
Session 7. Authoring and metadata in Blaise
Helping non-programmers to specify a Blaise Questionnaire
Mark Pierzchala, Graham Farrant, National Centre for Social Research & Westat
Development and evaluation of screen design standards for Blaise for Windows
Mick Cooper – Paper Not Available
From DOS to Windows
Diane Bushnell, ONS
The TADEQ Project, state of affairs
Jelke Bethlehem, CBS
Papers Submitted but not Presented
Displaying a Complete Call History to Interviewers
Linda Anderson, Iowa State University
Central and Local Survey Administration through communicating data systems
Philippe Meunier, Insee
Session 1
Case Management and CATI
Using Blaise to Automate the Clerical edit and Telephone follow-up component
of the American Community Survey
Barbara Diskin, US Census Bureau
Central and Local survey administration through communicating data systems
Thomas Hoel, Statistics Norway
Survey Management for the United Enterprise Statistics Program at Statistics Canada
Armin Braslins, Statistics Canada
Monitoring CATI Enumerators
Asa Manning, Leonard Hart, NASS
Using Blaise to Automate the Clerical Edit and Telephone Follow-up Component of the
American Community Survey
by Barbara N. Diskin and Kenneth P. Stulik, United States Bureau of the Census
Summary
The American Community Survey (ACS) conducted by the U.S. Bureau of the Census will ultimately be the largest ongoing
survey in the U.S. By 2003 we will sample 3 million households a year to collect housing and population data every month.
The ACS is a mail out-mail back survey. Since roughly one-third of all mail returns lack enough critical data, a telephone
follow-up (TFU) operation exists to collect this data. The increasing size of the ACS made it imperative to automate the
formerly manual TFU step. When we evaluated software that could support the automation effort, Blaise from Statistics
Netherlands was the obvious choice due to its features and flexibility.
ACS Basics
The goal of the ACS is to provide current demographic and housing data for small geographic areas. The questionnaire
content is almost identical to that of the Decennial Census long form, with a few additional questions on items such as food
stamps. The ACS went into production in 1996 in four counties. The initial sampling rate was 15 percent the first year with a
decrease in subsequent years.
The Data Collection Cycle
The ACS follows a 3-month cycle. During the first month the sampled addresses receive an initial questionnaire by mail. If
they fail to respond, they receive a second questionnaire by mail. If they fail to return the mailed questionnaires, during the
second month an interviewer attempts to contact them by telephone. If that too is unsuccessful, an interviewer actually visits a
sample of the non-respondents and collects the data on a laptop computer.
Initial Approach to Clerical Edit and Telephone Follow-up
The returned paper questionnaires are often missing data or contain inconsistent data because some of the concepts are difficult
for respondents to understand and they make mistakes in completing the forms. For the first 3 years of the survey, clerks
manually reviewed each returned paper form to detect deficient forms for telephone follow-up. This was a labor-intensive
operation that was itself error-prone because of the difficulty humans have in following algorithms in exactly the same way.
Rationale for Automating TFU
The survey, which started out with 80,000 households in 4 counties the first year, expanded greatly for 2000. It now
encompasses 1,239 counties with a sample of 864,000 households. By 1999 it had become apparent that the clerical edit of the
mail questionnaires with the accompanying telephone follow-up needed automation to make the operation more consistent and
to increase efficiency.
Determining Cases that Go to TFU
We began the automation process by translating the clerical checking into a series of algorithms that would result in either a
pass or fail status. If the respondent provides sufficiently consistent data and answers key questions, such as age, for all
persons in the household, the questionnaire passes the edit. If not, the questionnaire fails the edit. If there is at least one
telephone number for an address with a failed questionnaire, the questionnaire moves to telephone follow-up.
Software Choice and Implementation Strategy
The software for the telephone follow-up operation required the ability to start with reported data and build upon those data.
Only Blaise from Statistics Netherlands could do this. With a 9-month window for development and testing, the Census
Bureau enlisted the help of Westat for training and consultation. Everyone realized that this was an enormous undertaking for
such a short time. The resulting partnership provided the necessary support during these labor-intensive months. Westat had
the added advantage of being the U.S. representative for the Blaise software package.
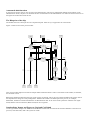
TFU Processing Environment
The TFU processing environment covers several different platforms in two different geographic locations across a wide-area
network. Return mail forms are checked into our document control system at Jeffersonville, Indiana, then immediately keyed
on a VAX system. Raw keyed data are transferred daily to a Sun server in Suitland, Maryland, where they are processed using
SAS to determine the pass/fail cases for TFU. ASCII data representing the failed cases are then daily transferred to a Windows
NT server back in Jeffersonville, where they are loaded by automated routines into Blaise format with the
ASCIIRELATIONAL method. Case data are then handled by the TFU interviewers using Blaise on NT client stations until the
data are resolved in some fashion. Data are output from Blaise daily and ported back to the Sun server in Suitland, where they
are further processed and analyzed.
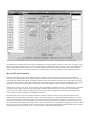
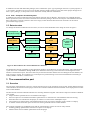
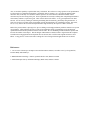
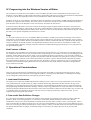
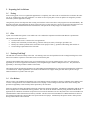
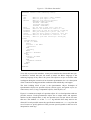
The Blaise instrument
Although not large in scope compared to some CATI instruments, the Data Entry Program (DEP) instrument for ACS TFU is
complicated because of a number of non-standard features we felt necessary to build into it. First and foremost, the instrument
accepts existing data from the keyed mail forms, a feature that not every CATI software system has. We had to write
complicated routines in Manipula for the read-in and read-out of the questionnaire and case header data.
The existence of pre-loaded data in the cases gave us another interesting challenge. It would not do to simply plug through
screen after screen in search of an error or omission. We called upon Blaise’s navigational flexibility to jump from error to
error, often bypassing large sections of the instrument. Interviewers have a choice of “Interview” mode or “Edit” mode to
accomplish this. In Interview Mode, an interviewer can efficiently maneuver through sections of the instrument, which may be
all or mostly blank. In Edit Mode, the interviewer can use the Show All Errors feature to jump from field to field, often
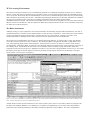
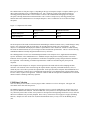
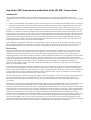
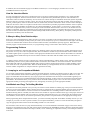
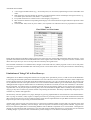
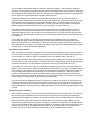
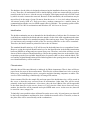
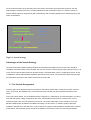
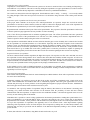
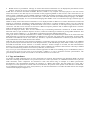
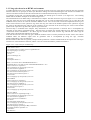
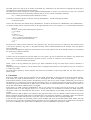
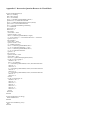
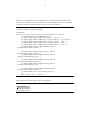
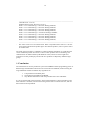
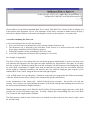
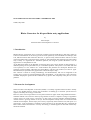
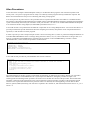
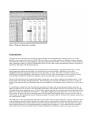
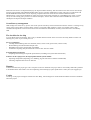
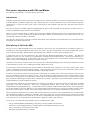
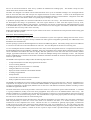
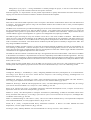
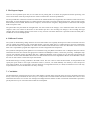
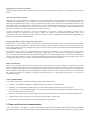
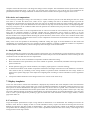
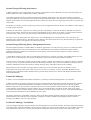
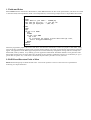
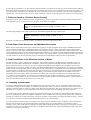
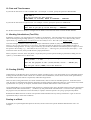
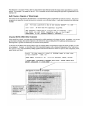
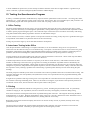
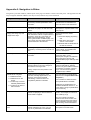
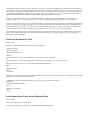
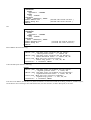
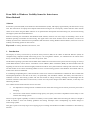
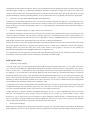
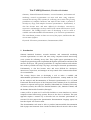
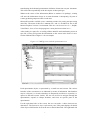
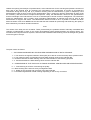
bypassing several screens in the process. Regardless of mode, we were also able to program Blaise in such a way so as to make
the majority of the person sections display in a matrix-style format, thus giving our interviewers the flexibility to navigate
across persons or across topics (see Figure 1).
Figure 1: Screen shot of ACS Blaise instrument showing matrix-style format, parallel block tabs, interview (CATI) mode, Show All Errors dialogue, and
more. All names depicted are fictitious for confidentiality purposes.
Another feature we built into the instrument was our custom control system, which we were able to effectively integrate with
the Blaise call scheduler (BtMana). The challenge was to build in our supplementary CATI control codes into the Blaise
framework while still taking advantage of the simple and efficient daybatch concept of Blaise. This was accomplished in
large part by using a series of external lookup files that allowed us to designate our own control codes (primarily case outcome
codes and future action queues). There are literally hundreds of combinations of codes and subsequent outcomes based on 6
different case characteristics. The lookup table takes into account these characteristics and assigns our own set of four codes
plus the requisite Blaise treatment and routeback. In addition to enjoying all of the features of Blaise CATI management, this
approach allowed us to capture all of the internal codes we needed for our own traditional operations analysis while having a
coding system that could readily translate to other CATI operations in the Census Bureau.
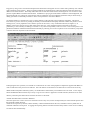
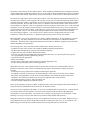
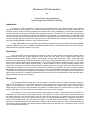
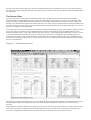
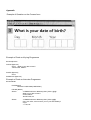
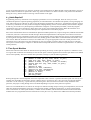
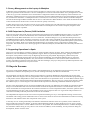
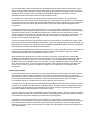
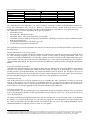
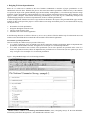
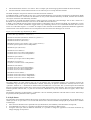
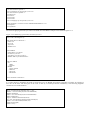
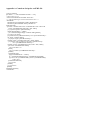
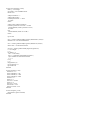
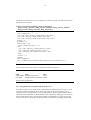
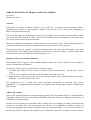
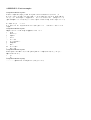
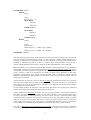
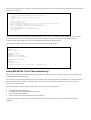
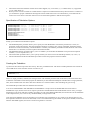
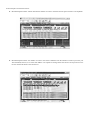
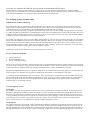
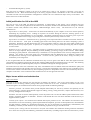
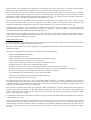
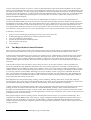
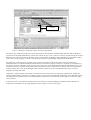
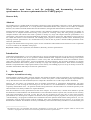
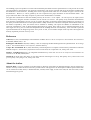
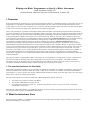
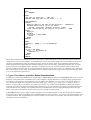
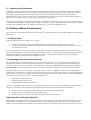
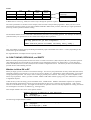
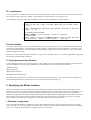
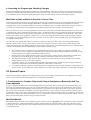
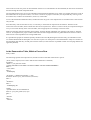
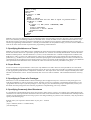
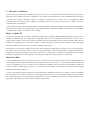
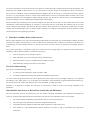
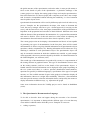
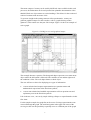
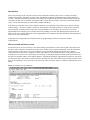
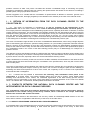
Yet another feature we wanted to have was a current summary of the pass/fail criteria within the instrument. This allows
interviewers to preview the case by looking at summary-level information and rapidly determine whether they need to correct
housing errors, correct population errors, add new persons to the rosters, or any combination thereof (see Figure 2). In
addition, interviewers can get an up-to-date status of the interview. This could allow them to terminate an interview
prematurely, in the event they are talking to a hostile or very reluctant respondent, if the error score is low but not perfect. The
parallel block feature of Blaise facilitated this functionality by allowing us to create a separate screen accessible by a keystroke
or mouse click from anywhere in the instrument.
Figure 2: Screen shot of ACS Blaise instrument Current Status parallel block, showing case-level summary of error counts and types.
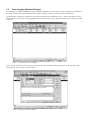
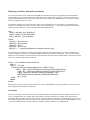
In designing the TFU operation, we realized we would need to use some of the peripheral components supplied with Blaise in
order to make the whole process more efficient. One such feature involved the use of audit trails to track case-level activity
default audit trail dynamic link library (DLL), we decided that its functionality was insufficient for our needs. At our request,
Westat modified the DLL such that any activity to a given case creates or appends to an audit trail file (which has as its name
directory and call up the audit trail file with the case ID as its file name.
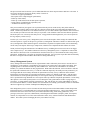
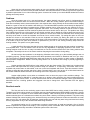
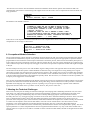
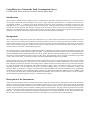
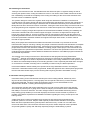
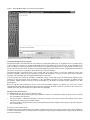
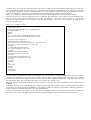
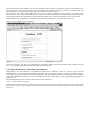
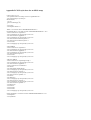
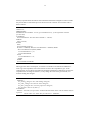
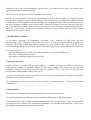
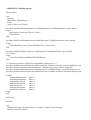
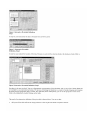
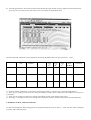
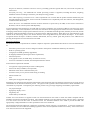
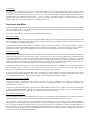
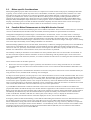
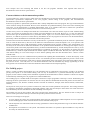
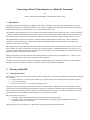
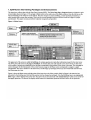
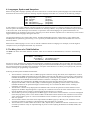
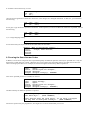
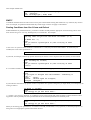
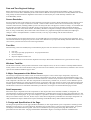
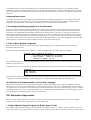
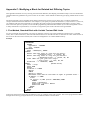
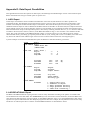
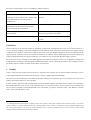
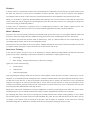
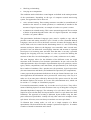
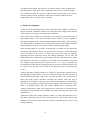
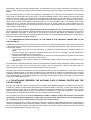
Another desirable feature external to DEP and
allow the supervisors to have control over the future action of any case, but this would primarily be used to handle special cases
that required a human decision.
which call for supervisory decision, obtain summary or detail information about the case, and affect a few key fields such as
routeback and future action queue. A logging and reporting feature associated with this utility makes it easier for us to identify
account for these automatically.
Figure 3: Screen shot of the Maniplus “Supervisory Hold” utility, allowing supervisors case-level control over disposition of individual forms.
One final feature we needed which was not part of the Blaise suite was the ability to monitor an interviewer’s computer screen
remotely for quality assurance purposes. We chose Stac Software’s Reach Out Enterprise because of a recommendation from
National Agricultural Statistics Service that it provided excellent functionality as well as peaceful coexistence with Blaise.
Today, our supervisors use it continually and it has never been known to cause any problems with the ACS Blaise system.
Moving TFU into Production
Due to the challenges presented by the tight time frame from March 1998 to December 1998, deployment of the Blaise
instrument was a harried effort. But a number of things worked in our favor, and the end result was a success. First, the ease
of programming in Blaise allowed for the rapid development of the initial instrument, resulting in more time than expected to
work out the major problems. While the instrument that was initially deployed in production in December had a host of minor
problems, none of them was major and they tended only to affect the navigation of the instrument or handling of cases.
Another factor working in our favor was the support of experienced Blaise consultants at Westat. With their help, we designed
a sound instrument, taking advantage of the many features of Blaise described in the previous section. Westat provided
professional on-site Blaise training, in addition to periodic classes at their training facility, and this helped to prepare the
Census employees that programmed the ACS Blaise instrument.
The deployment of the server and workstations hardware and their integration with the existing network infrastructure in
Jeffersonville went off on time and with little trouble. From the first day that we deployed the instrument there, we received
excellent technical support and did not need to divert a significant amount of attention to hardware or network issues. There
was, however, a learning curve regarding Blaise’s interaction with NT with respect to file permissions and user profiles. We
also experienced some problems with profiles which at times caused the interviewers difficulty in logging into the correct DEP
session (or any session at all for that matter). But in due time we learned the configuration that Blaise needed, and we tracked
down the problems with the profiles, so we now enjoy smooth operations from that standpoint.
Of course, our interviewers needed to be trained for their role in the automated TFU. But since they were already familiar with
interviewing techniques and were also familiar with the questionnaire, they primarily needed to be trained in using Blaise.
While some of the interviewers had little computer experience, others had experience with CATI software in general. And
since they were all very motivated individuals, training and ramp-up took less time than we expected.
Problems We Encountered and their Resolution
In deploying an instrument of this magnitude, it is not unusual to encounter technical or software problems, especially when the
software is new and non-traditional. So it came as no surprise to us that there were some glitches to iron out during and after
the project’s initial deployment.
There were a number of bugs in DEP build 269 with which we needed to contend. Some of these bugs, such as the various
Access Violations and Sharing Violations that our interviewers received, were easily solvable by changing our NT
configuration and allowing read/write (instead of read only) access to key meta-data files. There were also many instances of
DEP sessions simply hanging indefinitely, and those likewise were cured by setting the Opportunistic Locking NT setting to
OFF. Another DEP bug we encountered was the creation of an invalid key and a null record when routinely entering a form.
The problem was, amazingly, found to be triggered by entering the form using the <Enter> key as opposed to clicking ‘OK’
with the mouse. Statistics Netherlands was able to quickly track down the problem and issue a new DEP build.
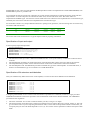
We encountered other problems while perfecting our daily routines to load and unload data. The nature of the input data
required a complex read-in routine designed to import multiple hierarchical flat files into a Blaise database containing arrayed
records of sub-blocks and embedded blocks. It also required us to convert Don’t Know/Refused responses into Blaise DK/RF
values, and handle field-level comments. While the Blaise ASCIIRELATIONAL read-in method would facilitate this, the need
to constantly recompile data models and Manipula routines, coupled with difficulty in handling slight changes to file layouts
and handling field-level comments, made the initial development of the read-in/read-out routines cumbersome.
Another minor problem in the daily routine involved a Manipula RUN command occasionally not executing properly, which
would bring the whole routine to a stop. Simply resetting and resubmitting the job would usually fix the problem for that day.
Eventually, we thought to alter the routine to have the calling batch job execute the DOS command, which fixed the problem.
While it was theorized this problem was a result of multiple RUN commands executing simultaneously, causing file locks
which prevented multiple simultaneous operations, it was never conclusively determined to be either a Blaise bug or an OS
bug.
A more serious failure related to these morning routines occurred when Hospital, designed to detect and repair data corruption
(primarily involving secondary keys), began to drop large numbers of cases from the database wholesale. It did not take us
long to figure out that this was happening to every case that had been touched the previous day. We were then quickly able to
deduce that the handling of an inherent Blaise field left over from a previous build of Blaise was confusing Hospital and
causing the cases to be dropped. The immediate solution was to stop using Hospital until the bug could be isolated and fixed.
We also were able to reinsert the cases dropped by using a simple Manipula program such that no permanent data loss was
suffered. Within a week or so, Statistics Netherlands found the problem and issued a new Hospital program which corrected
the bug, and we resumed using Hospital.
Our TFU supervisors did not take long to begin using BtMana to dynamically track daybatch progress, view shift workloads,
and reassign cases to specific groups or interviewers as needed. But in so doing, a bug was uncovered that had a serious
impact on our database. Soon after the adaptation of BtMana into the daily procedure, we noticed that some cases lost entire
blocks of data for no apparent reason. As BtMana was the only new variable introduced at that time, we quickly determined
that using it to assign a case to an interviewer was causing the data loss. Again, the bug was quickly located by Statistics
Netherlands and a new build of Blaise was released. Upon deployment, that bug did not recur.
At one point, we encountered one of our most severe bugs in a very unusual way. Due to the heavy amount of post-datacollection editing and imputation that is done by the Continuous Measurement Office, another atypical requirement of this
instrument is to keep all data, whether on-path or off-path. This, of course, is not a problem for Blaise, as the KEEP statement
at the field or block level allows for just that. Our instrument was programmed to maintain all data (including off-path data)
from session to session and to future processing operations. But somehow, part of our instrument code was replaced with a
version of similar code that lacked only the KEEP statements. This went undetected because, as it turns out, a bug in Blaise
build 4.1.0.269 kept the off-path data anyway in those sections of the instrument that had had their KEEP statements removed
(imagine, for once, a bug that works in your favor). But when we upgraded to Blaise v. 4.1.1.322, the lack of KEEP statements
became apparent. We slowly became aware of the problem of dropping the off-path data, and hundreds of cases became
afflicted with this data loss. Luckily, we were able to fix the problem quickly by simply restoring the KEEP statements.
The last major problem involved cases reappearing to interviewers even after they had been resolved or scheduled for an
appointment at a different time. When the problem first occurred, it appeared to be epidemic in proportion, but as we began to
research it, we discovered that it had probably been happening all along, just at a very low and infrequent level. It turned out
that any case outcome was subject to this problem, and that the problem was not isolated to one interviewer, or one computer,
or one network, or one instrument, or even one version of Blaise. Once in a great while, in the first year of production
deployment, we would get the occasional complaint from the call unit that a closed case would appear again to an interviewer.
Tracking of the audit trail would confirm this, but at first we attributed it to a minor glitch in the instrument based on a certain
series of responses to the front-end questions. When the problem began occurring dozens of times per day (roughly 5% to 7%
of all cases), we soon noticed that there was an inordinate number of “hanging” phone numbers. These occur when there is not
a complete set of write operations performed on the dayfile and call history files. As a temporary fix, we were able to stop the
problem by simply not clearing hanging phone numbers with BtMana. But this did not address the root of the problem, which
Statistics Finland coincidentally discovered to be linked to the Autosave feature. When leaving a case immediately after
Autosave was invoked, the case would hang in BtMana. We fixed the problem permanently by turning off Autosave in the
modelib.~ml, recompiling the instrument, and reconfiguring our shortcuts to not refer to any dep.diw. A re-issue of version
4.1.2, build 371, was to have allowed for Autosave with no hanging numbers.
We discovered a number of Blaise bugs within the production environment throughout the course of the first year. But this is
not unusual when dealing with relatively new software being used in ways which stretch the boundaries of its functionality.
One common thread which runs through every problem is that as soon as a bug was identified and found to be replicable in
similar environments, Statistics Netherlands was consistently able to identify the source of the bug and issue a new Blaise build
within a very short time period. Furthermore, as a result of our close work with Statistics Netherlands in identifying and
replicating bugs, we received a number of new Blaise builds containing features that were either never planned or released well
ahead of schedule.
The Future
For the ACS, the future of the TFU operation features Blaise. There is still no competing CATI software which has the
features and functionality that Blaise for Windows offers. Daily processing of cases through Blaise continues at planned levels,
and while there are occasional problems that crop up, the overall effort is a success. The benefits of the system will pay off
even more when the ACS reaches planned levels of 3 million mail surveys in 2003. The Blaise TFU operation will at that time
process over 1 million cases per year. Because of the functionality of Blaise, our staff will be able to do so in a very efficient
manner, allowing us to reach those target levels with a relatively small staff, and thereby greatly improve the ACS data.
Central and local survey administration through communicating data
systems
Thomas Hoel
Statistics Norway
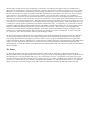
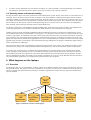
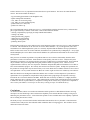
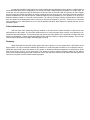
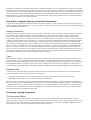
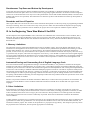
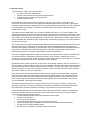
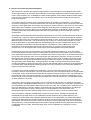
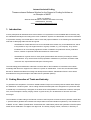
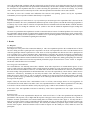
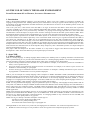
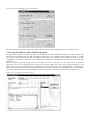
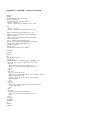
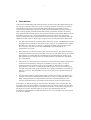
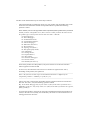
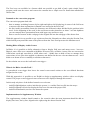
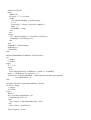
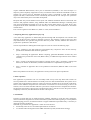
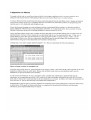
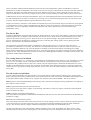
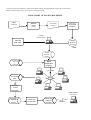
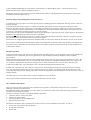
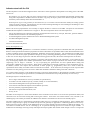
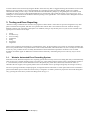
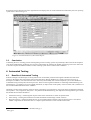
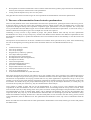
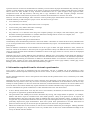
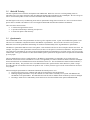
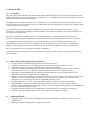
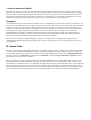
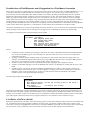
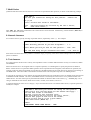
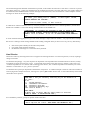
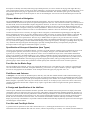
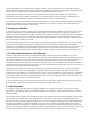
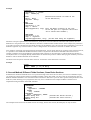
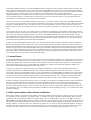
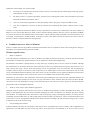
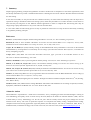
1 Overview of the system
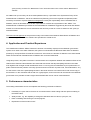
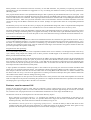
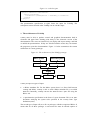
Figure 1 shows the three main parts of the new CAI system of Statistics Norway:
• The central administrative database
• The communication system
• The interviewer laptops and their databases
The three main parts of the CAI system
In t e rvie w e r
laptop
Com m unication system
In t e rvie w e r
laptop
Data
Ce n t ral
adm inistrative
database
Data
In t e rvie w e r
laptop
Figure 1: The three main parts of the CAI system
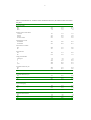
Because of differences in their work area, the three parts are based on different tools. Yet they fit tightly together, through
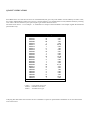
defined interfaces. Table 1 below sums up work scopes, tools and data formats.
Part name
Central administrative database
Communication
system
Laptop databases
Work scope
Manages the interviewers, the questionnaires, the respondents, administrative data and questionnaire data.
Maintains the connection between the
laptops and the central database.
Produces a number of status reports.
Manages the questionnaires, the
respondents, administrative data and
questionnaire data.
Tools
Oracle and Blaise
(Manipula)
Data formats
Administrative data: Oracle
Questionnaire data: Blaise
Internet Explorer
5.0 and Java
Administrative data: ANSI
Questionnaire data: Blaise
Communication packets: XML
Administrative data: Blaise
Questionnaire data: Blaise
Blaise (Manipula)
Table 1: Work scopes, tools and data formats.
The term “communication system” may be a bit narrow, since the Java part of the system in addition to the communication
performs a number of administrative tasks. There are, in fact, no sharp boundaries between the Java part of the system and the
1
Oracle part. As will become evident later in this document, the two parts overlap to some extent.
The rest of this document will examine each of the three parts in more detail.
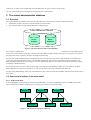
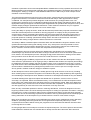
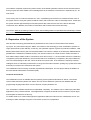
2 The central administrative database
2.1 Overview
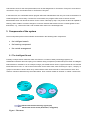
The central database is divided in an Oracle part and a Blaise part. The division is based on functional criteria:
• Administrative data is stored in an Oracle database in Oracle format.
• Questionnaire data is stored in Blaise databases in Blaise format.
Central administrative database
Oracle
database
Blaisedatabases
Figure 2: The main division of the central database
The reason for dividing the central database like this was tests that showed us that any conversion from or to the Blaise format
led to a loss of some aspects of the data. Consistent use of the Blaise format seemed to be the only way to preserve all parts of
the interviewer input: responses, comments and suppressed warnings.
The two parts of the central database is managed from the Oracle part. All events in the central database are initiated in the
Oracle part. The Oracle database “knows” about the Blaise databases, knows where to find them and have methods to use
them. The Blaise databases are there simply to store the questionnaire data in a convenient format and are absolutely ignorant
of anything outside themselves.
From a technical point of view, it may be interesting to note that the Oracle database resides on a Unix machine, while the
Blaise databases are stored on an NT file server. The user interfaces to the Oracle database runs under NT.
To get a better understanding of how the central database works, it may be useful to be familiar with some of the basic terms of
the system.
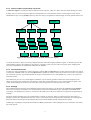
2.2 Some central notions in the data model
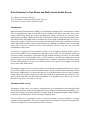
2.2.1 Project and form
A survey project is an entity from the viewpoint of bookkeeping – accounts are rendered per project. A form, on the other
hand, corresponds to a Blaise questionnaire. A survey project consists of one or more forms.
Project A
Form A-1
Project B
Project C
Form B-2
Form C-1
Form B-1
Form B-3
Figure 3: The hierarchy of projects and forms
2
Form C-2
2.2.2 Interview object (respondent) and period
An interview object is an entity that delivers data for a form (a person, a firm etc). Every interview object belongs to a form.
In many cases we want our interview objects to be dispersed over several stretches of time. For this purpose every form is
subdivided into one or more periods, and every interview object is assigned to its form through one of the periods of the form.
Form B-1
Form B-2
Period B-1-1
Period B-1-2
Period B-1-3
Period B-2-1
IO B-1-1-1
IO B-1-2-1
IO B-1-3-1
IO B-2-1-1
IO B-1-1-2
IO B-1-1-2
.
.
.
IO B-1-1-n
IO B-1-2-2
IO B-1-2-2
.
.
.
IO B-1-2-n
IO B-1-3-2
IO B-1-3-2
.
.
.
IO B-2-1-2
IO B-2-1-2
.
.
.
IO B-1-3-n
IO B-2-1-n
Figure 4: The hierarchy of forms, periods and interview objects
As earlier the interview objects are mostly sampled from the central Norwegian population register, or alternatively from the
central industry register. The sampling is carried out in a separate system, not part of the CAI system. After sampling and
necessary customization, the samples are loaded into the database.
2.2.3 Task and interviewer
An interview object prepared for a contact approach is called a task. An interviewer is an entity that accepts interview objects
as work tasks. Defined in this way the notion interviewer resembles an address, and in fact an interviewer in the CAI system is
not necessarily a person. Any mechanism that can accept a task and return it in a well-defined way, can act as an interviewer
within the system.
This abstraction gives us a very useful degree of freedom. It is for instance possible to define one of the computers in our
offices as an interviewer and then use it for interview work after regular office hours. Or we could establish a regular CATI
system based on Blaise as an interviewer and let this system accept interview tasks from the CAI system.
2.2.4 Package
The communication between the central database and the interviewer laptops is for the most part handled through packages.
There are several types of packages. The communication system knows the different types of packages and handles them
accordingly. The packages are, however, not objects in the OOP sense of the word. They have no properties and generally no
methods.
The most common package type is the communication container for one task. Tasks are transferred to the interviewers as
packages, and they are returned in the same way. There is one Oracle table for outgoing tasks, and another for incoming ones.
These two tables constitute part of the interface between the central database and the communication system.
Another type of packages contains the data model for a Blaise questionnaire. These packages are never returned to the central
part of the system.
3
In addition to the task and data model packages, there is defined an “open” type of packages which serve system purposes. It
is, for instance, possible to get an overview of the data situation (folders and files) on the interviewer laptops through one of
these “open” packages, or corrupt files can be returned for remedy and later reinstallation.
2.2.5 CAP – Computer Assisted Payment
In addition to the interview data the interviewers deliver their time lists as data files. The time lists are compiled through a
Blaise questionnaire, then converted to ANSI files and returned as packages. When received by the central database the CAP
data is directed to a separate system for interviewer wages, which checks the data and in turn forwards it to the central
governmental wages system.
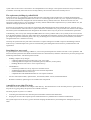
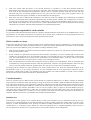
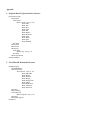
2.3 Data structure
To manage the entities introduced in the text above, we use an Oracle datamodel with a design as shown in figure 5.
Participates in
Interviewer Group
Interviewers
Interviewer Groups
Projects
Participates
ParticipatesininScheme
Form
Schemes
Forms
CAP
CAPDemands
Claims
Blaisedatabases
Sampling Areas
Participates in Period
Periods
Adhoc Areas
Interview Objects
Returned Tasks
Tasks
All returned tasks
Figure 5: Data model for the central administrative database
The datamodel is mainly operated by screen applications made by Oracle Designer or Oracle Developer. The communication
system has access to the database through JDBC (Java Database Connectivity), and contributes to the management with a
number of useful status reports. The Oracle tools may be the safest and most flexible ones for editing the Oracle database, but
when it comes to reports, Java competes very well. Reports are produced using a Java Servlet based framework resulting in
ordinary HTML viewable in a web browser.
3 The communication part
3.1 Overview
The role of the communication system is to connect the interviewers to the central part of the system, transfer data between the
central database and the interviewer laptops, and execute a number of defined "business methods" on the laptops based on data
in the central database.
The data transfer is based on defined interfaces for collecting and delivering data. The transfer comprises a number of different
types of data:
• Setups for Blaise questionnaires to be installed on the laptops
• Interview objects to be installed in the Blaise questionnaires or returned to the central database after interviewing.
• Other data files to be installed on the laptops, for instance revised versions of Manipula scripts.
• Various data to be returned to the central administration system, for instance snapshots of the contents of a laptop.
• A number of tables and status reports for the interviewers generated from the central database.
The "business methods" are predefined actions that the communication system can execute. They include:
• Installing pending questionnaires and interview objects on the laptops
• Finalize and/or remove a Blaise questionnaire from the laptops
4
•
So called "system commands" to be executed on the laptops. A system command is a command package with a defined
start method. In principle there are few limits to what you can achieve with a system command.
3.2 Security issues and internal working
Security has been a major issue in the construction of the communication system. For the same reason we cannot describe it in
all details, but we can disclose that the security in relation to the central database is maintained through an internal structure
containing a number of communication zones and firewalls. From the outside it is not possible to log on directly to the core of
the system. All connection to the central database is initiated from the inside of the system. This mechanism slows the system
down a little bit, but the capacity is still more than high enough for our 150 interviewers. The interviewers are identified by
their username, password and by dial back from the central ISDN-router.
The laptops connect to the central database through an ISDN-router at their home at a speed of 64 Kb/s. The communication
system is programmed in Java, and data is transferred as XML-documents. All communication is encrypted.
Ordinary internet protocols like HTTP and RMI (Java Remote Method Invocation) are used for the communication system.
The communication module is implemented as a Java applet. As a consequence, the interviewers use Internet Explorer as their
interface to the system. An advantage of this choice is that many interviewers know the user interface from earlier experience
with computers. Also, the internet approach makes the communication system easy to maintain in the future. By using a Java
applet, the communication module can be upgraded on the server, and immediately be available to all the interviewers, without
upgrades being necessary on the laptops. The usual trouble with long loading times of applets is amended by applet caching, a
feature of the Sun Java VM Plugin.
The interviewers all have their own homepage, presenting the status of their active projects. The homepage has links to static
information like postage rates, training material and laws and regulations, as well as more dynamic reports on CAP claims.
At an early stage of the project we considered using Internet Explorer as a general interface to all programs on the laptops,
which would give us the possibility to more or less hide the operating system from the interviewers. It turned out, however,
that the Blaise-programs on the laptops for some reason did not function well when started from Internet Explorer, and this
idea was abandoned. The main user interface on the laptops is Windows NT version 4.0. From Windows NT the interviewers
may start the Blaise-applications, the communication system and some other programs.
4 What happens on the laptops
4.1 Overview
On the laptops there is a two level database structure. The top-level database contains one record for each interview object on
that particular laptop. The purpose of the top-level database is to present to the interviewer a combined list of all the interview
objects, no matter what questionnaire they belong to. In addition appointments with the interview objects are handled in the
top-level database.
Main
database
CAP
questionnaire
Questionnaire
(form) A
Questionnaire
(form) B
Figure 6: Database structure on the laptops
5
Questionnaire
(form) C
Questionnaire
(form) D
The databases on the second level are the Blaise questionnaires. Several questionnaires can exist at the same time at the second
level. The relationship between the top-level database and the questionnaires on the second level is purely logical - there are no
constraints or other formal structures connecting the two levels.
4.2 Management of the databases
Both the main database at the top level and the questionnaire databases at the second level are managed by a Manipulaapplication. For running the application we use Manipula version 4.3. The Manipula-application starts by showing the user a
list of all the interviewable objects from all the accessible questionnaires. From this list an interview object can be selected for
a contact approach. A contact approach can terminate with one of three statuses: Interview, non response or unfinished. After
an interview or a non response the interview object is removed from the list. Unfinished interview objects remain on the list.
An interview object is transferred from the central database to the laptops in a data package, one interview object in each
package. When a package is delivered to a laptop, its contents are appended both to the main database and the questionnaire
database. This act of appending is done in a transaction-like way: Either both appends succeed or both are rejected and rolled
back.
4.3 Packages – interface and carrier
Packages are a central part of the CAI system, and there are even two levels of packages. On the lowest level are the packages
that the central database and the laptops use to communicate with each other. These packages are common zip-files, and their
contents are the entities that need to be transferred between the laptops and the central database. On a higher level are the
XML-packages (XML-documents) which the communication system uses to perform its part. The XML-packages resemble
objects, in the OOP sense of the term, and one XML-package may contain one or more of the lower-level packages. Four types
of XML-packages are defined.
At the present time five types of lower-level (zip-file) packages are known by the system. The communication system recognizes the difference between these package types, but has no knowledge of their internal structure. The role of the communication system is to collect packages at certain points in the system, deliver them at other points, and for some packages at some
of the delivery points start a predefined action. The five types of packages contain:
• Setups for Blaise questionnaires to be installed on the laptops
• Interview objects to be installed in the Blaise questionnaires or returned to the central database after interviewing.
• CAP data (the interviewers' time lists) to be returned to the central database
• System commands to be executed on the laptops (program and necessities in one package)
• Various data to be returned to the central administration system, for instance snapshots of the contents of a laptop.
A short discussion of two of the package types will illustrate how the system works.
A questionnaire is installed on a laptop through a package that contains the datamodel for the questionnaire, three files in the
simplest cases, plus three Manipula-scripts to handle the questionnaire. The communiaction system collects the package in the
central database and transfers it to the laptop. Some folders are created for the questionnaire, and the compressed files are unzipped from the package. Now the datamodel is ready for receiving interview objects.
Blais e
Admin.
Data
Blais e
p a rt
-------ANS I
p a rt
Admin.
Data
Blais e
Data package
Ce n t ral m a n a g e m e n t
Interview
Data
Com m unication
Interview
Data
Laptops
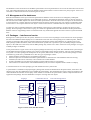
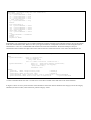
Figure 7: Work areas and data formats
6
Blais e
Orac le
The packages containing interview objects are a bit more sophisticated, as you may see from figure 7. Firstly they contain an
initialized Blaise-record for the interview object. In addition they contain a file with a record of administrative data in ANSIformat for the top-level database. A new interview object is to be installed both in the top-level database and in its Blaise
questionnaire. This double installation is handled by the communication system through a Manipula-script. The communication system transfers the package to the interviewer laptop, saves the package on the hard disk as a zip-file, unzips it and then
lets Manipula execute the installation script.
5 A summary of a typical interview project
In the new CAI system a typical interview project will be conducted like this:
1) The Division for Sample Surveys decides to run a survey project. A project instance is created.
2) A form instance is created and a Blaise questionnaire is written.
3) An installation package is made for the form.
4) The total contact period for the form is divided into one or more periods.
5) A sample of interview objects is selected (outside the CAI system)
6) The interview objects are distributed over the periods of the form, and the sample is loaded into the database.
7) Interviewers are selected for each period of the form.
8) The interview objects for a period are assigned to the interviewers selected for the period (by a program).
9) Installation packages for the interview objects are generated.
10) The form is "opened" for use by the interviewers.
11) The interviewers collect their installation packages and install the form and their interview objects on their laptops.
12) Completed interviews and non responses are returned to the central database when the interviewers log on through the
communication system. The updated status in relation to the forms in which the interviewers participate, is accessible to
each interviewer on his or her homepage.
13) In the central offices the situation of the survey project can be continuously monitored through status reports from the
central database.
14) When the contact period of the questionnaire is expired, the data from uncompleted interviews is returned. Then the
questionnaire is removed from the interviewer laptops.
15) The questionnaire data is extracted from the Blaise database and delivered to the users.
7
Survey Management for the United Enterprise Statistics Programme at
Statistics Canada
Armin Braslins, Operations and Research Development Division, Statistics Canada
March 2000
Background
In October 1996, Statistics Canada was presented with one of its largest and most complex initiatives of the decade.
It was a direct result of the decision taken by the Federal government and the Provincial governments of Nova
Scotia, New Brunswick and Newfoundland and Labrador. These four governments decided to consolidate the
Federal Sales Tax and the Provincial Sales Tax into a new combined Harmonized Sales Tax. The main objective of
this initiative was to reduce the administrative burden (and costs) of administering four separate tax collection
systems. They agreed on a complex formula to distribute the tax revenues among the four governments. Statistics
Canada was asked, indeed challenged, to provide the detailed economic data needed for the formula. The result of
this challenge was the creation of a new programme to improve the statistics gathered for the business sector. This
new programme became known as the AProject to Improve Provincial Economic Statistics@ (PIPES).
The PIPES programme has many goals and objectives affecting all aspects of the survey collection process. In
general terms, the main objective of PIPES is to supply the data needed to support the agreed revenue distribution
formula. Gathering the necessary raw data meant a very substantial increase in the amount of available provincial
economic statistics. The data had to measure the final sales of goods and services, on an annual, calendar year basis,
by province and industry, by commodity and class of respondent. The end result being a transformation of these data
into a set of Provincial Economic Accounts.
The Provincial Economic Accounts would collect additional data on both the expenditures and the incomes of
households and businesses. To increase the data for the expenditure side, improvements would include larger and
more frequent surveys to a number of personal surveys such as the Household Spending Survey and the Repairs and
Renovations Survey.
But, the large majority of the changes were needed on the income side. The major changes to these surveys would
occur with the development of a new integrated programme that would eventually replace all the existing programme
of annual business surveys. This new programme within the PIPES initiative is known as the United Enterprise
Statistics Programme (UESP).
United Enterprise Statistics Programme
The UESP would reform all the processes associated with conducting any business survey. This includes such basic
components as sample selection, questionnaire development, data collection, data editing, imputation, analysis and
dissemination. The UESP as a departmental programme has many goals and some of the basic principles that are
guiding its evolution include:
- business surveys would be enterprise based;
- all data for an enterprise and its establishments will be collected and analysed together;
- special attention would be placed on the complex enterprises, which, although small in number, have a large impact
on all economic production;
- reduce the response burden, particularly for the small business, by making use of administrative (Tax) data
wherever possible; and,
- harmonize the concepts, definitions and questionnaires used in business surveys.
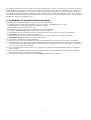
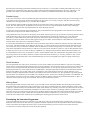
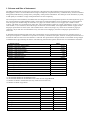
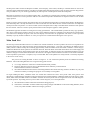
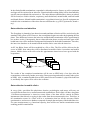
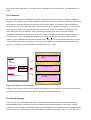
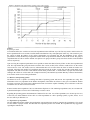
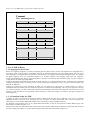
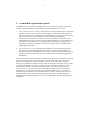
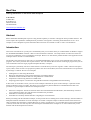
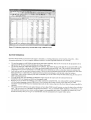
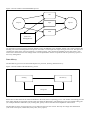
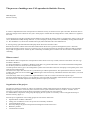
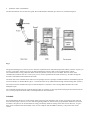
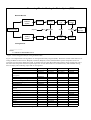
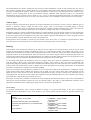
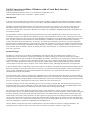
The UESP consists of four parts (figure 1) depending on the type of enterprise (simple or complex) and the type of
data required (enterprise-level or establishment-level). Part 1 would be a census of the complex enterprises
collecting primarily financial data. Part 2 would be a census of the establishments belonging to the complex
enterprise collecting financial and non-financial data. Part 3 will be a sample survey collecting primarily nonfinancial data at the establishment level for simple enterprises. Part 4 would be the use of Tax data for simple
enterprises.
Figure 1. Components of the UESP
Enterprise Data
Establishment Data
Complex Enterprises
Part 1
Part 2
Simple Enterprises
Tax
Part 3
The development of the UESP would mean that the methodologies related to business surveys would change in many
aspects. One of the biggest and one of the first to be encountered involved the survey questionnaire. A major
objective is to harmonize and simplify the number of questionnaires sent to businesses. Statistics Canada currently
has about 100 annual business surveys involving more than 700 different questionnaires. This is a result of the long
established traditional vertically integrated method of survey collection.
The UESP approach is to have one consolidated questionnaire at the enterprise level, supplemented with industry
specific ASchedules@ at the establishment level. Standard concepts and question wording would be used across
industries wherever possible. The questionnaires would also be simplified by using concepts and terms familiar to
the respondent. And eventually, personalized questionnaires would be created showing only their previous
responses.
The emphasis on the enterprise or enterprise-centric approach to the UESP will also affect sampling and data
collection. The foremost of the concerns being the response burden, especially with small businesses, some, of
which may not even be able to provide the requested data. In the past, data at the enterprise and establishment level
have been collected by separate surveys with different sample designs. The UESP approach, which combines them
into one vehicle, requires a new approach. Collection of data for both the enterprise and establishments in a coherent
manner would be a challenge with many questions.
UESP Data Collection
Now in its third year, the UESP is a work in progress and it continues to evolve in all aspects. This paper will
concentrate on the data collection process.
The PIPES programme developed a plan for the integration of surveys into the UESP process. For the first year, 14
surveys were identified for inclusion. This meant that these surveys had to be developed and the data collected in a
very short time period. Most of these surveys had to be developed from the beginning because the surveys collected
data for new industries not previously sampled. These surveys varied in size from 9 pages to 30 pages (including
annexes). Sample sizes also varied from 12,000 for the Wholesale Survey to only a few for the Banking Survey
(90).
The primary collection tool was the CASES software. The development methods and survey management processes
of the existing annual and monthly collection cycles were used. This software and management system was not built
with the UESP model in mind. While the first year proved workable, it would not serve as the model for the future.
The search for a replacement collection tool began in earnest. New data collection software had been the subject of
much discussion within our collection groups for some time. There were several factors influencing which software
would meet Statistics Canada’s requirements. We did not want to build it; the implementation time frame of PIPES
would not permit this. We knew that we had to move to a Windows environment in order to make efficient use of
our existing base of computers. DOS, as an operating system was nearing the end of its life cycle. It was not flexible
enough nor was it stable enough to keep up with the ever increasing demands of the surveys. Survey requirements
were becoming more and more complex. At the same time, our capi surveys were experiencing growing pains and
limitations as well. They too were interested in finding a Windows based collection tool for use on the field
interviewers laptop computers. Unix was not seen as a viable tool for use on laptops and seen only as a tool
available to a central collection facility. A Windows based collection software was the only solution.
Blaise happened to arrive on the scene with its new release of Blaise for Windows. At first appearances, it looked
very promising. The timing could not have been more fortunate from the perspective of Westat and Statistics
Netherlands. The timely release and initial demonstration of the Blaise for Window=s capability clearly started the
department thinking of its possibilities.
From our perspective, some of the main features of Blaise that worked in its favour were:
- a production version of the software was available in Windows including documentation;
- the data model could present the questions in more than one language;
- program code was easily reusable in different data models;
- it was easy to switch between multiple data collection modes (data entry, cati, capi) using the same program;
- ease of programming (modern programming concepts);
- speed of the collection application;
- built in cati scheduler;
- the appearance of being able to quickly develop a collection application; and,
- access to training and support from a reliable organization.
While Blaise has many of the essential elements of an ideal data collection tool, it did and still does have its
limitations. At that time, some of the more important missing features, from Statistics Canada=s perspective,
included:
- no data capture keying verification for a high speed data capture operations;
- no capability to directly read and write to an external database, a beta version of read only is now available;
- data editing, since upgraded in a recent release with the addition of user defined edit types and edit masks;
- capability to easily change the default screen layout, since upgraded with a release of Emily;
- edit tracking (keeping a record of which edit failed); and ,
- a facility to produce management information reports.
But, it was the opportune emergence of Blaise for Windows and its many other desirable features that resulted in it
being selected as the standard data collection software for Statistics Canada.
Year two was a new beginning for the UESP. It was a year of transition from the old to the new. Conversion from
one software collection tool to another is never an easy task. But, the UESP had a distinct advantage; their
requirements were new requirements. New software, new concepts, new approaches, new development. A huge
advantage over trying to fit a new data collection system into existing methods and operations.
During the second year, the original 14 surveys were rewritten and 18 new surveys were added. With new surveys
being introduced each year into the UESP model, being able to quickly add a new survey is very important. The
PIPES strategy has all of Statistics Canada=s business surveys being folded into this same model.
The process model used for the first year of UESP identified areas where improvements would have to be made. A
new process model was developed. Briefly stated, it consists of:
- a mail out of a paper questionnaire;
- data capture of the completed paper questionnaire;
- follow-up of late returns;
- follow-up of edit failures from the data capture operation;
- on-line capture of identified cati respondents; and,
- feedback to the business register.
This process model may not appear to be any different then the process model used by many other statistical
organizations but what is different is the data, the collection entities and the inter-relationships demanded by the
UESP. Another major difference is the annual collection cycle for UESP. PIPES requires that the data be collected
for a calendar year and as near the end of the year as possible. This meant that a mail out and collection operation
had to take place over a relatively short time period. A staggered mail-out throughout the year is not an option for
the large majority of these surveys.
For this cycle, a new survey (case) management system was also developed to better manage the centralized data
collection operation. Again, for this process, good survey management at Statistics Canada is no different then good
survey management at other statistical agencies. Information is required on completion status, who is outstanding,
ensure timely non-response follow-up; in simple terms, what has been completed and what remains to be done.
UESP year three brings the introduction of 20 additional surveys, including the conversion of some of our bigger,
more complex surveys. And, further refinements to the survey management system. Components to control what
data editors are allowed to work on, information on the status of the survey=s environment and who is using which
application. Included also, is an option to report data electronically. For surveys that report their data electronically,
the data is re-integrated into the Blaise data model for editing and follow-up.
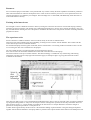
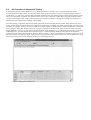
Survey Management System
Survey management starts with the mail out of questionnaires and is followed by their return, in various states of
completeness, to the mailroom. Questionnaires are logged as received and sent to data capture and editing. Nonresponding units are identified for follow-up and reminders sent. Other units are scheduled for cati collection.
Probably very similar and familiar to many organizations. What makes this different, is the tools that are used and
the operational constraints of the surveys. Under the constraints imposed by the UESP previously mentioned, you
can imagine that the return of many thousands of questionnaires for many surveys could mean total confusion.
Knowing the processing status of a particular questionnaire could be very difficult to determine. And, this status
must be known as soon as possible particularly if a non-response follow-up is scheduled. One would not want to
have a questionnaire being identified for a non-response follow-up when that completed questionnaire is in fact being
data captured. One central repository had to exist to manage the many questionnaires in their varying stages of
processing. A central database would be a natural choice. But, with the lack of a facility within Blaise to directly
access an external database, a Blaise database was used instead. The resulting system actually consists of four Blaise
data bases supported by a number of Maniplus and Manipula programs.
This management system is a series of menus and sub-menus presented in the familiar Blaise format that provides
information relative to each individual survey and each respondent within the survey. Data is stored that records
information such as the status of the survey environment (internal testing, client testing, production), access
privileges (interviewer, supervisor, administrator), and management information (complete, partial, non-response,
refusals, etc) and permits access to the central document control, survey collection functions and administrative
utilities. This whole system of managing the surveys uses Blaise tools only.
In these menus are two very important functions that deserve special mention. The first is the central document
control. This menu includes the ability to:
- log-in incoming questionnaires sent through the mail;
- update mailing label information;
- view, add to or create mail groups;
- view, add to or create combined reports;
- produce labels for re-mail; and,
- produce Fax follow -up.
The second important menu is called active surveys. It is through this menu that the actual survey collection takes
place; again assisted by a number of sub-menus. Some of these functions include:
- selecting a respondent by specifying its unique identification number;
- creating a day batch;
- starting the data entry program;
- starting the cati call scheduler;
- starting cati management; and,
- producing status reports.
Each time that an interviewer enters and leaves the central document control or the active surveys, status information
is collected. This information can be stored on one of four Blaise databases. As you can appreciate, since these
four databases are used throughout the system, it is extremely important that the databases are kept synchronized.
Before an interviewer enters one of these functions, the databases are synchronized by a Manipula job. Every night,
another Manipula job is run to further ensure that the databases are synchronized and readied for the creation of the
next day batch.
This process is not without its problems. The problems that arise are not from its functionality but rather in the
performance of some of its functions. Most functions execute quickly, but some are slow. Analysis and system
monitoring is being done to try and pin point the exact cause, but that has not yet been determined. Some problems
may be related to our system design and solving this problem remains a top priority for us. However, for an
organization that is relatively new in its experience with Blaise and particularly Blaise for Windows we feel that we
have made considerable progress. We certainly have not discovered all of its quirks. Perhaps our expectations for
the product are too high and it may become necessary to use tools outside the set of Blaise software to meet some of
our requirements. We very much wanted to use Blaise as it comes Aright out of the box@ without any extra software.
What lies ahead for case management within the UESP is more evolution. The development of a personalized
questionnaire for a respondent has completed the analysis phase and is progressing to development. Its design
includes the use of an Oracle database and XML. While this does not directly use Blaise, it is a highly desirable
feature within our survey collection process. Other enhancements currently under construction include a component
to handle the mail out of questionnaires, a component to manage all the various survey outputs and a component to
move a survey unit which is Aout of scope@ for one survey to being Ain scope@ for a different survey.
Conclusions
As mentioned earlier, Blaise is not without its limitations and the good news is that additional features are being
developed. We feel that having a direct read and write capability to an external data base would go a long way to
addressing our performance issues. A beta release that permits a read is available and a write capability is planned.
We are looking forward to its release.
The ability to keep a record of which edit has failed within a data model is also very desirable. This information
would be used to analyse how often and under which conditions edits are being triggered. This would be used to
define better edits in the future.
Also, we need the capability to perform data entry verification. We still receive a large portion of our questionnaires
by return mail. If a completed questionnaire is returned by mail, it remains a very cost efficient method of data
collection. But, in this day of e-commerce and the explosive use of the Internet, traditional methods of data
collection may become a thing of the past. Some respondents are currently returning their completed questionnaires
electronically and this is expected to grow. How will it be done in the future? A very good question but no final
answers. We are actively working on collecting and editing data electronically, particularly using the Internet. A
proto-type for use in our 2001 census of population is being developed but a lot of challenges remain. That work,
for us, is very much at the research and experimentation stage and clearly the topic for a future conference.
Back to the present, Blaise is proving to live up to its billing even though production problems continue to creep into
our operations. These problems are more a result of our application design, programming errors and improper
operational instructions then problems with the software itself. We are continuing to build our Blaise expertise and
increase the number of developers. Recent changes within Statistics Canada, which re-organized all the computer
assisted interviewing applications development into one division, has re-enforced the original decision to select
Blaise. A long process of conversion and re-writing all of our existing collection applications now lies ahead.
References:
1. An Overview of the Project to Improve Provincial Economic Statistics, November 1997, by George Beelen,
Francine Hardy and Don Royce
2. PIPES Information Package - Outline, Updated October 1998, Statistics Canada
3. Unified Enterprise Survey Information Package, March 1999, Statistics Canada
Monitoring CATI Enumerators
by
Leonard Hart and Asa Manning
National Agricultural Statistics Services
Introduction
In the fall of 1997 the Census of Agricultural was transferred from the Census Bureau to the National
Agricultural Statistics Service (NASS). To meet the new demands for this survey NASS had to revamp all aspects of its
computer systems. With 46 locations throughout the USA this was a major undertaking. All servers were upgraded to
Dell muti-processors and the server software was upgraded to Novell 4.1 from Novell 3.12. The major client operating
system at the time on the desktop computers was upgraded from Windows 3.1 to Windows 95. In Headquarters and
our 45 field offices this meant all 386 and 486 machines were replaced with Pentium base machines. Almost all 16 bit
software packages had to be replaced since they did not work in the Windows 95 environment or functioned improperly.
One of the packages NASS lost was our video monitoring system.
In early 1998 NASS took on a special survey for National Institute for Occupational Safety and Health (NIOSH)
called the Childhood Injury Survey. NIOSH demanded that NASS monitor a certain percentage of the CATI interviews.
NASS needed an inexpensive solution very quickly.
Past History
In the past NASS has had problems with both the audio and video parts of its monitoring system. Phone
systems differed across the 43 state statistical offices where CATI was used. For the majority of the offices the
telephone supervisor had the ability to select a certain phone line and could tell who was using it. Other offices had
rolling phone numbers and this meant the supervisor had no way of telling who was talking on the phone. These office
phone systems were upgraded when budget permitted. The major problem with the monitoring system was the video
system. In the past the video system was very faulty. It caused machines to lock up during interviews resulting in the
loss of data. At times it also slowed down the delivery of Blaise forms to the machine. The major contribution to this
problem was the limitation of one meg of base memory under Windows 3.1 and DOS. The video monitoring package
that NASS was using had to be loaded into base memory. Over time NASS Blaise applications were getting larger. It
reached the point where these two systems were fighting for conventional memory. We loaded as much software into
upper memory as possible. Loading these applications to upper memory only bought NASS time. We eventually had to
totally unload the video monitoring system.
New system
Any replacement product would have to be very flexible. It needed to work on a variety of personal computers.
With the client software in our field offices being converted at various times from late fall of 1997 through spring of
1998, the new system had to work under Windows 3.1 and Windows 95. Another major concern was cost. Since
NASS had just gone through a major hardware and software conversion there was a limited amount of money left to
spend on new items. Also, man hours were not available to develop an in house system.
As we started to look at other criteria, security was another main issue. All field offices are connected to a
WAN which connects all field offices together with HQ. We needed to be able to restrict and/or control access across
the WAN environment. We also had the concerns of outside forces hacking into our system. We had to have control
over the system since many of our machines during the day are used by the office staff and at night the machines or
used by the enumerator staff. Since the offices were setup as an LAN, which was connected to a WAN, we wanted to
make sure unauthorized people inside and outside of NASS could not view any machines. Data confidentiality takes an
extremely high priority in NASS. We needed a system that was easy to use with little or no maintenance once it was set
up, and required minimal training.
About this time telecommuters were starting to use a new package call Reachout. This allowed them to log in
from remote locations and work on their personal machines. After some discussion we decide to pursue this system as
a possible replacement for our video monitoring system. It seemed to fit most up our criteria NASS needed and it was a
package we already owned.
Problems
Once the system was up in a test environment, the system basically met all our goals. In implementing the
package we did however have to overcome several hurdles. When the viewing machine (this is the machine setup to
view other machines) called a host machine (this is the machine that is being viewed) the host machine screen display
slowed to a crawl. It was as if the machine was locking up. The individual Blaise questions would slowly be displayed on
the screen. The screen problem increased as the viewing machine tried to view more then one machine at a time.
Another problem was the viewing machine keyboard and mouse. If the viewing machine moved the mouse or typed
something on the keyboard the host machine keyboard and mouse would react to the input. This problem was easily
fixed. NASS discovered one of the options for the viewing machine was to disable the local keyboard and mouse. We
could set this option on the host machine too. We opted not to do this since most host machines were used by Stats
and they would need to control the keyboard and mouse from a remote location. By setting this option on the host
machine all viewers to this machine could not use the keyboard and mouse. By setting the option on the viewer
machine we could control who had command of the input on the host machines. The down side to this option was it had
to be made to each icon (each host machine is represented by an icon on the viewing machine) setup under the
viewing machine. This option is not a global setting.
A major benefit of this option was that the screen display speed on the viewing and host machine increased to
an acceptable level. The host machine user did not see any degradation in displaying questions to the screen. The
viewing machine could view one or many host machines at one time and the refresh rate of the viewing machine was
acceptable. This totally took care of the viewer machine disrupting the host machine during calling.
We had various other problems in the beginning. Machines were locking up or the installed package was not
completing properly. Through testing we discovered these problems were inherent to Reachout and not in our setup.
The initial version of Reachout that NASS was using was version 8.0. As we moved to a newer version of Reachout,
these problems disappeared. NASS is currently using version 8.41 of Reachout and looking to possibly upgrading to
version 8.42.
Another problem that NASS still has is the inability to hide the viewer toolbar. This toolbar has a keyboard and
mouse button that supercede the viewing machine setup icon defaults. If a supervisory enumerator clicks on the
keyboard and mouse button on this toolbar, it can turn on the local keyboard and mouse. Then this causes the viewer
machine to affect the host machine and slows it down. Currently there is not a way to turn off or hide these buttons on
the toolbar. NASS has determined this to be a training issue for the supervisory enumerator.
Another slight problem occurs when a workstation does not have the proper video resolution settings. The
current NASS standard is 800x600. If a machine gets set to another video resolution, the viewer machine has more
difficulty viewing the host=s screen. It can still see the screen but the text resolution changes a little. Again NASS has
determined this as a training problem and suggests users don=t change their video resolution from the agency
standard.
Excellent results
The first real test for the monitoring system came when NASS had a training school for the NIOSH survey.
Toward the end of the training school as everybody was busy inputting data with the Blaise NIOSH instrument a viewing
machine called all 15 computers at once without them knowing it. After monitoring them for about thirty minutes their
attention was bought to an overhead screen where they were shown that they were being monitored. They were totally
amazed. Nobody had noticed anything in the audience as they were being monitored. Another test was done at a later
date at one of our call centers with 25 machines. Again people were not told they were being monitored and nobody
saw any degradation in any of the machines that were being monitored.
As mentioned earlier one of our goals was to make the system easy to install and maintain. One of the first
states to implement the system was setup by a non-computer person in that state office. With the simple instructions
provide by Headquarters they were able to install the system within a few hours.
A great side benefit from this system once it was installed was the debugging tools it allows us. Using Reachout
across the NASS WAN, staff in headquarters can visually see what is happening on a workstation on another LAN. Of
course this can only take place with the permission of the end user on the other LAN. This greatly cut down support
time for fixing bugs in Blaise applications or getting a wayward end user back on track. One of the tools that makes this
possible is Reachout=s own built in Explorer. Reachout Explorer has the capability for us to upload a fix on the spot or
download data as needed to or from the remote location. The old way of fixing a problem normally had the field office
send the directories to headquarters and we would try to recreate the problem on our LAN. This took a lot of time and
it did not always work. With Reachout, we can see the problem first hand, which allows us to spend less time and yet
with better results.
Future enhancements
With the basic video monitoring package installed in the field offices, NASS still wants to add several new
enhancements to the system. The first major enhancement is to convert all paper forms used by our supervisors to an
interactive supervisor interface. This system would wrap around the video system so the supervisor can input their data
directly into a database. Another feature that NASS wants to add is the ability to capture screen displays. This could be
used to capture Aproblem screens@ to aid debugging or training.
Summary
NASS developed an extremely useful system that met our goals of a secure system with no side affects to the
host machine. It is easy to install and maintain and allows us to view enumerator machines in an unobtrusive manner.
NASS also discovered a great side benefit to this system. It allowed the Blaise programmers to see problems in the
field offices as they occur in a live environment. This allows for quicker problem resolution. NASS did this without
buying a new software package and with limited man hours. With the future enhancements NASS feels this system will
meet all of ours goals of a well rounded monitoring system.
Session 2
Surveys using Blaise
Use of CAPI instrument in a blind test of the UK 2001 Census form
Lucy Haselden, ONS
Developing a Blaise instrument for the Spanish Bladder Cancer Survey
Richard Frey, Westat
Using Blaise in a nationwide Food Consumption Survey
Lois Steinfeldt, US Department of Agriculture
Challenges in developing a longitudinal survey on income dynamics
Brett Martin, Statistics New Zealand
Data Collection in Two Phase and multi centre Health Survey
Vesa Kuusela, Statistics Finland
Use of the CAPI instrument in a blind test of the UK 2001 Census form
Introduction
This paper describes how Blaise III was used in the Census Quality Survey (CQS). The Census Quality Survey was
commissioned by the Census Division of the Office for National Statistics in England and Wales. The survey had two principal
aims:
•
Firstly, to provide details of any questions on the Census form that were not working well and might need to be re-thought;
•
Secondly, to provide end users of Census data with some information about the accuracy of the answers given to each of
the Census questions so that they could gauge the level of error involved with any analysis that they were to carry out.
In order, to achieve these aims, we needed to compare the answers given on the Census form by respondents filling in the form
themselves, in conditions as similar as possible to those they would experience when filling in the real Census form, with the
answers they gave in an interview, where details given can be fully probed and checked by the interviewers. We felt this could
most effectively be achieved by carrying out a “blind test” where respondents were re-asked the questions on the Census form
without access to their original answers. However, it was also important that where the answers differed between the Census
form and the interview, that the interviewer would be able to ask which answer was the better answer, given the situation on
Census night and also be able to ask why the answers differed.
We decided that using the Blaise instrument we would be able to achieve all these aims. By storing the original Census form
data in the Blaise instrument in a particular way, neither the respondent or the interviewer would have access to the original
form data until they had given an answer in the interview. This paper gives details of how this process was carried out.
Methodology
The first part of the survey involved delivering test Census forms to 4640 addresses. 58 addresses in each of 80 areas were
randomly selected. Interviewers called at each of these addresses and acted as far as possible as Census enumerators. They
established how many households there were living at each address and ensured that at least one form was delivered per
household. The interviewers then explained to a member of the household that the form was to be completed on the test Census
night, 16th May, and then posted back to the office, using a pre-paid envelope. This was the same routine that enumerators
would have to follow on the real Census night. Interviewers were asked not to give detailed instructions or advice on how to fill
in the form. This aimed to ensure that there were no inequalities in the level of help given to different households. If
interviewers were unable to make contact with a particular household, they were asked to simply deliver a form through the
letter box, as enumerators would.
Once the Census forms had been delivered, respondents were left to complete them on their own. A help desk telephone line
was provided, but it dealt mainly with practical issues such as lost forms. Where respondents were unsure of what a question
meant or where they had difficulty answering a question, they were generally told to fill the form in as best they could and then
to send it back, leaving out those questions which they felt they could not answer. A week or so after the test Census night, a
reminder letter was sent to all those who had yet to return a form.
The forms that had been returned were keyed into a Blaise data entry programme. In the real Census it is hoped that the forms
will be scanned. However, this was not possible for the survey and so all forms were double keyed. Where there was a
discrepancy between the first and second key of a form, this was referred to supervisor who would resolve which was the
correct entry.
Once the forms had been keyed, the data from them could be read into the CAPI instrument and sent to the relevant interviewer.
The interviewers received cases which had all the keyed data read into them, but they did not have direct access to this
information. When the interviews were carried out, respondents were asked the answers to a variety of questions which related
to the Census form. In some cases, they were simply re-asked the Census form question. In other cases, where the question had
a higher priority or where the Census question seemed complicated, a variety of questions were asked which would ultimately
seek the same information as on the Census forms. Where discrepancies occurred between Census and Survey answers,
respondents were told what their Census answer had been and were asked which was the better answer and this was taken to be
the “true” answer. This final answer is referred to as the reconciled answer. Respondents were then generally asked for any
reasons for discrepancies. They were also given an opportunity to give their opinions on the Census form and answer some
general questions about the look and layout of the form. Throughout the interview, interviewers were encouraged to make notes
if there were circumstances where the question did not seem appropriate to the individual’s circumstances.
The aim of the analysis of this data was to provide a comparison between the original answers given on the Census form and
the final answers given during the interviews. The analysis also gave details of why particular questions had caused difficulties
for respondents.
The Census Form
The Census form was a twenty page document that asked a variety of questions about the individuals who formed the
household and the accommodation they lived in. Instructions about how to fill in the form were given on the first page along
with the household’s address details and the signature of the householder. Respondents were asked to fill in the names of all
members of the household on a table on the inside of the front cover. They were also asked to fill in the names and addresses of
any visitors present on Census night. A household questionnaire asked nine questions about accommodation and cars. This was
meant to be completed by the householder.
For the first time in any Census, respondents were asked to complete a relationship grid. The grid spanned two pages and asked
for the first name and surname for each household member as well as the relationship of each household member to other
household members. Person 1 was simply asked for their name; person 2 was asked about their relationship to person 1; person
3 was asked about their relationships to persons 1 and 2 and so on. This is shown in diagram 1. The relationship grid was
thought to be an ambitious idea because although it was thought from earlier studies, that some 10% of the population would
have trouble completing a grid in this way, it would provide a rich source of data about household composition that had simply
not been collected before.
Diagram 1 – The Relationship Grid
The form also contained questionnaires for up to five individuals. Each individual questionnaire contained thirty five questions
and spanned three pages but routing instructions on the form meant that respondents would not have to answer all these
questions.
Respondents answered these questions by ticking one or more of the answer categories provided or by writing in their answers
in the spaces provided, according to the question. Respondents were given instructions as to whether they could tick one or
more box at each question and where they were expected to write in an answer they were instructed to do so.
Although it was hoped that each adult member of the household would fill in their own individual forms, there was no explicit
instruction to do this. It was known from earlier testing that in some households, there would be one form filler who would fill
in the details for all other household members. This main form filler may or may not ask the relevant individuals for details they
were not sure about. In other households, each individual concerned would fill in their own form (with obvious exceptions for
small children or very frail household members). In other households, some people would fill in their own individual sections
whilst others would leave it to the main form filler.
Planning for Integrated Keying and Interview Programmes
In order for the details filled in on the Census forms to be used in the survey it was important to develop a Blaise programme
which would hold all this information in a way that would be accessible to the interview programme. This involved planning for
both programmes at the same time.
Naming Conventions
In order to facilitate programming and for ease of reference at the analysis stage, we decided to apply a naming convention to
the variables in both the keying and the interview programmes. The naming convention had to be able to quickly identify
whether the variable related to individual, household or relationship grid data and also whether it related to form data or
interview data. To this end, a five character code was devised. The first character was either a C, an S or an R which denoted
whether the variable related to the Census form (C) or the Interview (S for all questions asked and R for calculated reconciled
variables which would be used in the final analysis) . The Second digit indicated whether the data was from the household
section (H), the relationship grid (R) or the individual section (P). The third and fourth digits related to the question number on
the form. Finally, a fifth digit was reserved for denoting parts of questions. In the keying programme this could indicate that
there was an “other – write in” part of the question. During the interview, respondents were generally asked more than one
question in order to get the final reconcile answer. These questions were referred to by a letter. Thus SP02b would refer to the
second question about question 2 on the individual section of the interview programme. By keeping the naming convention to
five characters, there was room to allow for multiple responses and arrays.
Types
The interview programme would compare the answers given on the Census form with those given during the interview. This
involved using a “Types” paragraph for enumerated type questions and this paragraph had to be consistent across both the
Census form keying programme and the interview programme. All enumerated type questions where the answers were going to
be compared had the answer categories listed in the “Types” paragraph. Since the interview programme was developed in
parallel with the keying programme, it was important that any changes to these sets of answer categories were changed in both.
Reading in Data
In order to carry out the blind testing required, the data from the keyed Census forms would have to be read into the Blaise
interview programme. Two ways of doing this were considered:
•
Reading in the data at the top level of the data model and putting all the external data into locals at this level;
•
Reading the external data at the lowest level, into each individual block.
Because we had to read nearly all the keyed data into the Blaise interview programme, we had to consider the implications of
the size of what we were reading in. Reading everything in at the top level of the data model was simply too slow and meant it
would take interviewers too long to load up each programme. We therefore decided to read the data in at the lowest possible
block level. It was felt that this would speed up the programme considerably. Although this was the best solution at the time,
the interview programme remained slow but usable.
Developing a Keying Programme
The Programme Design
However well designed a self completion questionnaire is, there will inevitably be times when respondents do not follow
instructions and as a result, tick two or more categories when they should only tick one, do not follow routing instructions and
answer questions when they should not or do not answer questions when they should. Some respondents might decide that a
question they were not routed to applied to them and then answer it anyway.
The keying programme had to reflect the way people might actually respond to the Census form, rather than the way they
should have. Therefore, multiple responses were allowed for all enumerated type questions. The exception to this rule was for
yes/no type responses. It was anticipated that respondents would rarely answer both yes and no for a particular question. In
addition, it was thought that in the unlikely event of someone answering that way, it would be same as if they had not given an
answer at all. Blanks were allowed for all questions, as there was always a possibility that the a respondent elected not to
answer a question. Finally, there was very little routing between questions in the keying questionnaire. This meant that the
programme could cope even with someone who had just answered a random selection of questions and paid no heed at all to
the routing instructions on the form.
It was possible, therefore, to keep the keying programme relatively simple, with separate blocks for each of the sections of the
form namely:
•
A block indicating whether or not the front of the form had been signed by the primary form filler and if so, who had
provide the signature (this was captured in order to give interviewers some information about who they should interview);
•
A block which allowed all the names given in the table for the list of household members, to be entered;
•
A block which allowed all the names given in the table for the list of visitors, to be entered;
•
A block allowing all the information in the household section of the Census form to be entered;
•
A block which allowed all the information in the relationship grid to be entered;
•
An array of blocks which allowed all the information in all the individual forms to be entered.
The blocks the household members and visitors and the household information section, were relatively simple to devise. The
naming conventions and rules about types were followed throughout and very little routing was used.
The relationship grid proved to be the most complicated part of the keying programme. As well as having to write some fairly
complicated code so that the keying programme followed as closely as possible the paper Census form, additional code had to
be written to record “consistent errors”.
It was known that some people could not fill in forms presented in this grid-like fashion and such people, if they attempted the
question at all, would make a large number of mistakes. Testing had shown that these mistakes fell into three broad types:
•
Reverse logic mistakes – here the respondent gets the relationship the wrong way round and instead of recording the
relationship of John to Ann, the respondent would record the relationship of Ann to John.
•
Relationship to person one only – it was known that some respondents would be able to cope with working out the
relationships of each person to person 1 but the grid layout of the form would mean they have difficulty working out what
to put in the columns for the relationships of person 3 to person 2.
•
Not entering a person 1 – Tests had showed that some people would not fill in any details for person 1 because there were
no boxes to tick for this person. However, not filling in these details would make the rest of the grid difficult to complete.
We decided that if a respondent had made anyone of these mistakes, it was likely that the whole of the relationship grid would
be incorrectly filled in and rather than asking the respondent why they had made an error every single time there was a
discrepancy between the Census form and the interview data, we would just ask these respondents why they had made the
overall error.
In order to do this, we would have to be able to spot these types of errors at the keying stage. This could be done by asking
keyers to spot these types of mistake while keying in the form and indicating if any of them had occurred at an appropriate
question in the Blaise programme. This was done for the pilot but at the main stage, we decided to let the Blaise programme
double check. If there was no information at person 1 but details had been filled in for all other people then we could calculate
that one of the consistent errors had been made. Similarly, if the only boxes ticked were for the relationship to person 1, another
of these errors had been made. Finding out if the respondent had got the relationships the wrong way round was more
complicated. However, in the individual sections of the form, respondents were asked to fill in details of their date of birth and
so if these two sections could be linked it would be possible to use signals to alert keyers to situations where fathers where
older than their children or other unfeasible situations.
It was possible to link the data in each individual form to the relevant part of the relationship grid by having a screen which
appeared every time a keyer wanted to enter data for a new individual which asked which person from the relationship grid you
wanted to enter individual data for. The answer categories used text substitution to give all the names of the people mentioned
on the relationship grid and a further category which said “Person not mentioned category” which would then require you to
enter the name of the person. This had to be an option as people were frequently left off the relationship grid but included in the
individual questionnaires.
By linking the relationship grid and the individual sections in this way, it was possible to identify individuals who were not
included on the relationship grid so that they could be asked why that had happened during the interview. Similarly, it was
possible to tell if there was no individual information for someone who had been mentioned on the relationship grid.
Double Keying
In the real census, forms will be scanned and the data will be double checked as part of the scanning process. Scanning was not
a possibility for the CQS, partly because the apparatus for the Census scan was not yet in place and partly because keying
seemed to be a more appropriate way to enter the data into Blaise.
It was extremely important that all the data entered was accurate and in order to achieve this, the data needed to be double
keyed. This was done using one programme to key the form twice into two separate datafiles and then using a Manipula
programme to verify that each key had resulted in the same data being entered.
Ten keyers worked on entering all this information. They worked from the same programme on the same file server and each
Census form was keyed by two different interviewers.
One problem that arose out of this was the keying of text fields. All the keyers were given instructions ensuring that they always
used capital letters, always left one space between each word and always typed exactly what they saw, even when spelt
incorrectly or when abbreviations were used. Despite the instructions, many second keys were failing because of tiny
differences at these text fields. This was delaying the keying process and it was felt that these small differences would have no
material effect on the interviews or subsequent analyses.
It was therefore decided that it would be best if the second keyer simply had to confirm that what the first keyer had entered
was correct. This meant reading in the data from the first key. As soon as the first keyer had entered all the information from
one Census form, they saved it all as a datafile which would then be accessible straight away to a second keyer. This would
mean all the information from the first key would have to be read into the second key. However, with so many different keyers
working from one file server, which was kept on a different site, reading in large chunks of data became unacceptably slow.
It was decided that the best way around this to create a separate datafile which only contained the string fields. This was the
only thing read into the second key. Because we had to extract data from the first key, it was only possible to carry out the
second key after this had been done. This small disadvantage was easily outweighed by the improved speed of the keying
process.
Serial Numbers
We anticipated that some interviewers would enter incorrect serial numbers for particular addresses. This was an extremely
serious issue as it meant that the data from the form would be scattered to the wrong interviewers or interviewers would try and
interview at the wrong households. Beyond the practical implications for us, such as time wasted interviewing at the wrong
household, this had very serious implications for confidentiality. Although respondents would not see the data keyed from the
form for their address, they would, under certain circumstances, hear what had been written for certain questions. It was
therefore extremely important that no mistakes were made because of serial number error. This problem was generally picked
up when forms were booked in but we needed to be completely certain. To this end, a checking procedure was established. The
serial numbers were based on the area number (2 digits) the address number (2 digits) and the household number (2 digits). A
check was used so that for any given area number, the correct postcode had to be used.
Making Notes
Some respondents dealt with the Census form in ways that had not been anticipated. Rather than answering some questions,
they had written a full explanation of their circumstances in the space around the tick boxes. Others had simply written “same
as person 1” beside on the top of individual forms. Many other unusual ways of filling in the form were discovered as the forms
were keyed. Guidelines were established, and added to in order to ensure consistency in dealing with these problems. At the
same time, keyers were asked to use the notes facility in Blaise whenever they had to deal with unusual situations. This allowed
the keyers to describe the types of difficulties they experienced and this information was in turn passed on to the client in
Census division and has been useful for them in planning the scanning operation for the actual Census.
Developing the Interview Programme
Once all the data had been keyed it would have to be read into an interview programme which would be used to carry out a
blind trial of the Census form. The interview programme would be required to re-ask the respondents about all the information
on the Census form and compare the answers given on the form with those given in the interview and, where necessary
reconcile the two answers and probe out reasons for discrepancies.
Structure of Programme
Gathering all this information would require a significant amount of routing within the programme. This problem was
exacerbated by the routing on the Census form. We decided that all routing in the interview should be based on final reconciled
answers.
The structure of the programme could be broken down as follows:
Household level. One “include” file was used for the household level information. That “include” file called on four further
“include” files – one relating to the members of the household and; a second include file contained all the information in the
household questionnaire; two other include files were used to time how long it took interviewers to complete this part of the
questionnaire.
Relationship Grid This consisted of one “include” file.
Individual level. It is possible to think of the individual level questionnaire in a number of sections. These sections were based
on routing breaks so that wherever there was a routing instruction, a new section would start. Each of these sections was
represented by one block. One “include” file was called at the datamodel level and this “include” file called a number of other
include files and each file contained one block. Routing at the highest person level meant that these blocks were called only for
the appropriate groups of people, as indicated by the Census form. This system simplified what would have been very
complicated routing.
The household questionnaire, the relationship grid and each of the individual questionnaires were stored as parallel blocks.
Format of questions
For each Census question on the form a basic pattern was formed:
•
One or more questions were asked in order to gather the information required at each question on the Census form. This
had to take into account all the definitions that Census wanted to apply.
•
The answers from these questions were then calculated into a hidden variable which was designed to be in exactly the same
format as the question and answer categories on the Census form.
•
This interview answer was then compared with the answer or answers given on the Census form. If the answer was the
same in the interview as on the form, respondents were asked about the next question on the form.
•
If the answers differed from each other, they were then asked “On the Census form, you told me that _________________,
but you have also said ___________________. Which would you say was the better answer?” Generally they would be
expected to say the interview answer was the better answer but sometimes they would think the Census form answer was
more correct for the circumstances on Census night. The way the keyed data was read in meant that the text substitution
could be simply achieved by typing ^CENSUS.Qperson.Bperson[Lper1].CP01 or whatever was appropriate for
the Block or Question names.
•
A final, reconcile variable was calculated but not shown to the interviewer. This recorded the final answer given by the
respondent in a form which could be easily compared with the answers given on the Census form. Calculating derived
variables within the Blaise programme saved large amounts of time at the analysis stage.
•
If the interview answer was the better answer, respondents were asked why they had given the answer they did on the
Census form.
In addition, if respondents had not followed the routing on the Census form correctly, we wanted to know why that was.
This basic pattern was used for the household section, the relationship grid and the individual section. However there was an
added level of complexity in the individual section that related to who filled in the form for that person.
For all adults, we were only interested in interviewing the actual person to whom the individual data related but for children
under sixteen, we wanted to ask parents for that information. Initially we thought that information about the respondent’s age
would be available from the form, but past testing had revealed that date of birth is often filled in incorrectly, with respondents
frequently putting the current year rather than their birth year on the form. Proxy interviews would have slightly different
routing to adult interviews and so if a respondent entered a date of birth that suggested they were under sixteen, interviewers
were asked to check if this really was so. Where the respondent really was under sixteen, interviewers were provided with an
on-screen instruction to only take a proxy interview.
In the interview, we always wanted to asked the individual questions to the person to whom they related. This was not always
the same as the person who actually filled in that section of the form as many individual sections were completed by proxy. It
was important to establish whether the respondent had filled in the form themselves or if had been filled in by proxy at the
beginning of the individual interview as this would determine to what extent it was relevant to examine the motivations behind
the answers given on the form. All adults were therefore asked if this section of the form was:
•
filled in by you
•
filled in mainly by you but with someone else's help
•
filled by someone else who asked you about some or all of the questions
•
filled in entirely by someone else?
Whether they filled in the section themselves would also determine later routing. If a question had been filled in by proxy on
the Census form we would assume that the answer given during the interview was always the better answer. Similarly there
would be no point asking the respondent why there was a different answer on the form. If the form had been filled in entirely by
the respondent or entirely by someone else, we could extend that to any particular question. Where forms were partially filled in
by someone else and a discrepancy occurred, we would have to check who actually filled in that question on the Census form.
The answer to this would then determine what further questions needed to be asked in order to gain a fully reconciled answer.
Thus for each question in the individual section, rules had to be written which would take count of whether:
•
The respondent was aged over sixteen or not;
•
The routing on the Census form;
•
The answer on the Census form was the same or different to that given in the interview;
•
The question on the Census form had been completed by the respondent
Conclusions
The fieldwork for this survey was carried out relatively smoothly and a good response rate was achieved.
Preliminary analysis has already been carried out and showed that respondents were answering most
questions with few problems. There were, however, one or two questions that were slightly redesigned to
take account of the problems highlighted by the survey. Census Division now hope to scan and edit the
original forms. We will then compare those answers with those given in the interview to see how well
these processes work.
Appendix
Example of Question on the Census form
Example of Code on Keying Programme
BLOCK Bperson
FIELDS {Bperson}
CP03 “What is your date of birth?”
:DATETYPE, EMPTY
RULES {Bperson}
CP03
ENDBLOCK {Bperson}
Example of Code on Interview Programme
BLOCK Bindiv
EXTERNALS
CENSUS: CQSFORM(‘CQSFORM’)
FIELDS {Bindiv}
SP03a
"^CENSUS.QPerson.BPerson[LPer1].CP01 @/@/
What is your date of birth?"
/"Date of Birth"
:DATETYPE, RF
SP03b
"^CENSUS.QPerson.BPerson[LPer1].CP01 @/@/
Can I just check, how old were you on your last birthday?"
/"Age"
: 0..120, RF
SP03c
"^CENSUS.QPerson.BPerson[LPer1].CP01 @/@/
On the Census form you don't seem to have filled in the question about date of birth.
Do you remember why that was? @/@/
INTERVIEWER: SHOW BLANK CENSUS FORM"
/ "DOB - Reason for not answering"
: STRING[150], RF
SP03d
"^CENSUS.QPerson.BPerson[LPer1].CP01 @/@/
On the Census form, did you write in or give an answer to this question or did someone
else answer this question for you?"
/ "DOB - who answered question"
:(Self "gave an answer to this question myself",
other "someone else answered it on my behalf"), DK
SP03e
"^CENSUS.QPerson.BPerson[LPer1].CP01 @/@/
INTERVIEWER ASK OR CODE@/@/
On the Census form you said your date of birth was
^CENSUS.QPerson.BPerson[LPer1].CP03.
Can you remember why you put that?" / "DOB - reason for discrepancy"
:(thisyear "put this year rather than year born",
forget
"can't remember why I put that",
notme
"someone else wrote in the answer to this question",
other
"other - specify")
SP03f
"^CENSUS.QPerson.BPerson[LPer1].CP01 @/@/
Write in other reason"
/ "DOB - other reason for discrepancy"
:STRING[150]
RP03
"^CENSUS.QPerson.BPerson[LPer1].CP01 @/@/
What is your date of birth?"
/"DOB - Reconcile"
:DATETYPE
RULES {Bindiv}
SP03a
SP03b
LIndiv1:= SP03a.AGE
CHECK
SP03b = LIndiv1 OR SP03a = RF
OR SP03b = RF INVOLVING (SP03a)
"The computer calculated your age as ^LIndiv1 from your date of birth. This does not seem to be the same
as the age you have given me"
IF QintroInd.Under16 = yes THEN SP03b < 16
"You have entered that this person is aged Under 16. You must make sure of this person's age and make
the necessary changes to the questionnaire"
ELSEIF QIntroINd.Under16 = no THEN SP03b > 16
"You have entered that this person is aged over 16. You must make sure of this person's age
and make the necessary changes to the questionnaire
ENDIF
RP03:= SP03a
IF (RP03 <> CENSUS.QPerson.BPerson[LPer1].CP03) AND (SP03a <> RF) THEN
IF (QIntroInd.SPa = consult AND QIntroInd.Under16 <> Yes) THEN
SP03d
ENDIF
IF ((QIntroInd.SPa = Self OR SP03d = Self) AND QINtroInd.UNder16 <> Yes) THEN
SP03e
SIGNAL
IF (QIntroInd.Spa = self or SP03d = self) THEN SP03e <> notme
"You have said that you filled in this question yourself"
ENDIF
IF SP03e = other THEN
SP03f
ENDIF
ENDIF
ENDBLOCK {Bindiv}
Developing a Blaise Instrument for the Spanish Bladder Cancer Study
Richard Frey, Westat, U.S.
I. Introduction
The Spanish Bladder Cancer Study (SBC) is an occupational health epidemiologic study that has involved development and
programming of an innovative Blaise computer assisted personal interviewing (CAPI) system for administering, in Spanish,
seven core health study sections and sixty-three occupational module questionnaires. There are other study components that
involve hospital case ascertainment and control selection in multiple hospital locations throughout Spain, along with a selfadministered dietary history questionnaire and blood, urine and toenails specimen collection and shipment. The study is,
however, mainly characterized by a large Blaise CAPI system with technically complex programming requirements, an
extremely tight design and development schedule, and international study implementation challenges.
It was the development and implementation of the programming requirements that presented the Blaise development staff with
the technical challenges this paper addresses. Challenges include instrument size and complexity, moving from a DOS
environment to Windows, the design of a many-to-many data relationship, some bugs, instrument change restrictions, and data
export.
Finally, this paper will address some of the major keys to the success of the Spanish Bladder Cancer Study CAPI system and
how the staff organization, the development process, and the working relationship with Statistics Netherlands contributed to its
successful implementation.
1. Study Background
Westat is assisting the Occupational Epidemiology Branch of the Epidemiology and Biostatistics Program, Division of Cancer
Epidemiology and Genetics of the National Cancer Institute (NCI) in conducting this interdisciplinary case-control study of
bladder cancer in Spain. Westat has established a subcontract with investigators from the Institut Municipal d'Investigacio
Medica (IMIM) in Barcelona, Spain, who are conducting the study to evaluate the etiology of bladder cancer, particularly in
relation to external risk factors such as occupational and environmental exposures.
The case respondents are patients who have been diagnosed with bladder cancer in Spain, and control respondents are those
who have been diagnosed with other specified diseases and conditions The personal interview typically takes place in a
hospital room in several collaborating hospital study centers in Spain.
2. Topic of this Paper
This paper is limited to the technical challenges and the solutions of implementing this survey instrument in Blaise. It does not
address the research, methodology, or other aspects of the project.
II. Challenges in Developing the SBC Instrument
There were several technical challenges that had to be met to put the Spanish Bladder Cancer (SBC) survey instrument into
Blaise. These challenges included the size of the instrument, many-to-many data mappings, enforced backward movement to
jump from a work history table to a selected occupational module, English speaking programmers developing for Spanishspeaking interviewers, efficient implementation of so-called time spent blocks, and programming a custom occupational
coding procedure.
In addition, three other factors added complexity to the design of the instrument. First, the initial development and statistical
production use of the instrument were to be in Blaise III, the last DOS version of Blaise. While this version has very large
capacity, we did not feel we could not execute some potential solutions that might work much better in a purely Windows
environment. Secondly, while we knew the basic structure of the instrument, it was designed while many of the sections and
most of the occupational modules were still being specified. Thus at the time of instrument design we did not have a good idea
of eventual size. Third, we were aware that the interviewers would not be using the most powerful laptops available. An
alternative architecture, for example, could be to tie together a main instrument with 63 separate instruments, one for each
occupational module. But then we would have had the overhead of 64 different instruments in computer memory and in a
management system. If we were to start from scratch today, given the wealth of project experience and the much more
powerful Windows version of Blaise, and the advanced state of computer laptops today, we may well do some things described
here differently
1. Scheme and Size of Instrument
The SBC instrument has two main parts. The first part is the main part of the instrument with a succession of sections for
demographics, tobacco use and coffee/other beverage consumption, occupational history, residential history and environmental
background, medical history, family history and quality of life/personal information. This main part of the instrument, by itself,
would qualify as a medium- to large-sized questionnaire of some complexity.
The second part of the instrument, 63 modules that were designed to assess occupational exposures for selected job titles, gives
the overall instrument a totally different quality. Each of the occupational modules can be considered to be a questionnaire in
itself. On paper, the modules range in size from 2 or 3 pages (for a street vendor) to over 70 pages (for a welder or farm
worker), with about 8 to 10 questions per paper page. The overall number of pages for a paper questionnaire, of only 1 copy of
each module, is 1,675. However, there can be up to 10 instances of each module, so the approximate number of pages for the
full paper questionnaire is about 16,075. This would be about 1 meter tall (using a very conservative estimate of pages per
centimeter). If you take into account that the survey was done in two languages, then the overall paper questionnaire is 2
meters tall.
It should be mentioned that the bulk of the paper questionnaire involves measuring the time spent on a particular activity or
time spent in exposure to a substance. Every time it is necessary to measure 'time spent,' there are several questions that have to
be asked to make sure that an accurate measure is achieved. The questionnaire's design resulted in a reasonable average length
of administration, approximately 90 minutes. The following technical descriptions illustrate the size of this Blaise instrument.
1. Overall counts
Value
Number of uniquely defined fields*
Number of elementary fields*
1
22,314
2
Number of defined data fields*
18,941
3
Number of defined block fields*
119,896
4
3,373
Number of defined blocks
224
Number of embedded blocks
108
Number of block instances
20,877
Number of key fields
4
Number of defined answer categories
2,476
Total length of string fields
1,677,270
Total length of open fields
0
Total length of field texts
1,128,212
Total length of value texts
52,292
Number of stored signals and checks
161,511
Total number of signals and checks
161,511
*1) All the fields defined in the FIELDS section
*2) All the fields defined in the FIELDS section which are not of type BLOCK
*3) Number of fields in the data files (an array counts for more than one)
*4) Number of fields of type block
2. Data fields, number fields in data file
Number
Length
Integer
30,729
102,482
Real
14,156
85,099
Enumerated
45,931
46,788
443
611
Set
Classification
Datetype
Timetype
String
Open
Total in data model
0
0
1,397
11,176
1,408
112,264
25,832
1,677,270
0
0
119,896
1,934,690
In addition, there are thousands of pages in the Blaise instrument, it is in two languages, and there are over 100
ASCIIRELATIONAL output files.
How the Interview Works
For each respondent, the interviewer completes the first two sections on demographics and tobacco use, coffee and other
beverage consumption. The third section consists of the occupational history and module questions. This information is
collected in a table of about 40 columns by 20 rows. Each row collects descriptive information about each job the respondent
held in his life for a period of 6 months or more. For each job the instrument collects start date, end date, name of employer,
job title, job description, names of chemicals and tools worked with, and other information. From several of these descriptive
fields, the interviewer codes an occupation with the aid of a classification procedure programmed in Blaise. If the occupation
matches any of the 63 modules, the module is to be collected immediately. In other words, it is necessary to jump from the
table in the occupational history section to another part of the instrument and then back to the next row in the table once the
module is completed. After the occupational section (and all appropriate modules) is completed, the interviewer proceeds to
the next sections (residential history/environmental background, medical history, family history, and quality of life/personal
information) and finally exits the instrument.
2. Many-to-Many Data Relationships
Each row in the occupational history table can map to any of the 63 modules in the instrument and this mapping can occur
more than once. For example, the first job may be welder, the second fork lift operator, and the third welder again. This model
is more of a relational data structure than a hierarchical data structure (which Blaise explicitly supports). Blaise does not
naturally support a relational data structure, so a programming strategy was devised to deal with this problem.
Programming Pointers
The essence of handling a relational data structure is in defining pointers from one data block to another and keeping track of
the pointers. In every row of the occupational table, there are fields for module acronym and module instance number. These
two fields together point to a specific instance of the appropriate module block where the data for that module are collected. In
the module itself are fields that keep track of the instance number of the block and the number of the row of the table it is
connected to.
A summary of these pointers is kept at a high level in a block called BookKeep with the fields Counter, Module, and Number.
The BookKeep block is an array that tracks the number of instances that a module is used in the instrument. The rules of the
data model both within the occupational module and a higher level keep straight which instances of which modules connect
with which line in the occupational table. While the block BookKeep is simply defined, the rules to make the module and
instance number assignments are complex and took a great deal of testing.
3. Jumping to an Occupational Module
As we began constructing the instrument, it became apparent that there would be two limitations that we had to overcome. The
first is a hard limitation of the number of Blaise pages (or FormPanes). The maximum page limitation of Blaise is 16,000
pages. We found this limit the hard way by trying to prepare the instrument with all instances of all modules appearing in a
Blaise page. In the process of troubleshooting the page limitation problem, we discovered a second problem with instrument
performance. We found that when you try to move across thousands of Blaise pages to arrive at the correct instance of the
appropriate module, processing time might be slow, taking many seconds to get to the appropriate module.
Ask Module and Copy To Holding Modules
The solution to the these problems was to put only one instance of each module in a Blaise page. This process became known
as the Ask version of the module. When it became necessary to jump from the occupational module, the interviewer traveled to
the Ask instance of the module. For each Ask instance of a module there are 10 holding instances. When the interviewer is
finished collecting data for a module, the data from the Ask module are copied via a Blaise block copy to the proper instance of
a holding block for that module. This solved the two problems mentioned above. First, we could prepare the instrument with
all 63 modules, and second, we increased the speed of the jump from the occupational table to the appropriate asking block.
When programming these complicated movements, you need to manually adapt that which Blaise normally does for you. For
example, if you want to re-enter a specific instance of an occupational module, you have to cause the Data Entry Program to
copy the appropriate block instance from the holding module to its Ask instance.
We also had to cause the cursor to jump back automatically over several hundreds of thousands of pages. This task is done by
bringing an Ask module onto the route and with an empty field that has the NOEMPTY attribute. While this backward jumping
technique is introduced in the Blaise Developer's Guide, it is not something you implement casually. This technique itself was
well tested.
A bug was found in the block copy from the Ask block to the holding blocks. In Blaise III and in the first Windows versions of
Blaise, remarks would not be copied with a block copy from one instance of a block to another. This problem was identified
during the survey, and the solution to this bug is discussed later in the paper.
4. ¿Habla Español?
Programming the survey instrument in two languages presented its own set of challenges. Since the survey was to be
conducted in Spain for a Spanish-speaking population, the instrument had to be translated into Spanish, a foreign language for
most staff on the project at Westat. In order to meet the language requirements of the survey, specifications and paper versions
of the survey instrument were first produced in English, and programming of these sections similarly followed first in English.
In this way, the overall survey development proceeded first in English. As development proceeded, concurrently English
specifications were sent to translators in Spain where each section was translated into Spanish. When the translation for a
section was completed, it was returned to developers for implementation in the Blaise program.
Parts of the instrument that had to be translated into Spanish included question text, response categories, hundreds of thousands
of text fills, interviewer instructions and edit messages. While the implementation of the Spanish version had to wait for the
translations (which were completed in a timely way), the programming strategy allowed for the copying in of the Spanish text
by leaving hooks throughout the instrument source code, making great use of the Blaise ACTIVELANGUAGE feature in the
rules section. When the translations arrived, it was another task to copy the appropriate texts from a word processor to the
application source code. There were other challenges as well. For example, we had to make sure that the proper 'code page'
was in place on the developers' computers so that the diacritical Spanish characters would be recognized in the U.S. (This was
a DOS problem.)
5. Time Spent Modules
Much of the instrument asks about the amount of time spent doing an activity or time spent in exposure to a substance. There
was a great deal of sameness and similarity in how all 'time spent' constructs appeared. Several time-spent blocks were defined
and re-used repeatedly. The most common time spent block, TimeSpent1, has the following elements:
P1
P1A
P1b
P2a
P2b
P2c
P3
P4a
P4b
P5a
P5b
P6
P7
{Entry cell, gives chance to change mind.}
{Number of times per day, week, month, or year}
{Time unit (day, week, month, or year)}
{Number of hours, or days, or weeks, or months}
{Second time unit (day, week, month, or year)}
{Time unit}
{Percent of time}
{Fraction of time, numerator}
{Fraction of time, denominator}
{Number of minutes or hours}
{Minutes or hours}
{Yes no question}
{How many times}
Routing through this construct depends on how the respondent wants to answer a question about time spent in an activity. For
example, the respondent was allowed to answer "I did this activity 10 times per day, 5 days per week, for about 20 minutes
each time." Or she could say, "I spent half of my time doing that." The interviewers were able to easily administer these
questions, with proper routing through the several fields depending at any time on the pattern of responses.
There are several hundred lines of code for the TimeSpent1 module including complex routing, text manipulations, and several
edits that checked reasonableness of answers. This particular module, considering all instancing, is used several thousand
times. Overall there are 6 time spent modules, 3 number of times modules, and an assortment of other similar measurement
modules that were programmed one time and used all over the place in a very efficient use of Blaise blocks and procedures.
The extreme re-use of these time and number measurement modules meant that the question text and fill text had to be
customized for each instance. The following code snippets show how this works. First we imported text before the block call
using parameters.
PARAMETERS
IMPORT
Phrase1, Phrase2, Topic : STRING
The field text was defined as follows:
P1a "^Phrase1 ^Phrase1a
@/NUMBER OF TIMES PER DAY OR WEEK OR MONTH OR YEAR.
@/@/@Y[INTERVIEWER] PRESS <ENTER> TO ANSWER IN TERMS
OF TIME UNITS, PERCENT OF TIME, OR FRACTION OF TIME."
"^Phrase1 ^Phrase1a
@/NUMERO DE VECES POR DIAS O SEMANAS O MESES O AÑOS.
@/@/@Y[ENCUESTADOR] PRESIONE <ENTER> PARA RESPONDER EN
TERMINOS DE UNIDADES DE TIEMPO, PORCENTAJE DE TIEMPO, O
FRACCION DE TIEMPO." : 1..9990, EMPTY
where Phrase1 was imported into the block and Phrase1a was computed in the block if necessary. A few within-block
computations of text strings are shown next.
IF ACTIVELANGUAGE = ENG
Fraction := 'FRACTION
ELSEIF ACTIVELANGUAGE =
Fraction := 'FRACCION
ENDIF
THEN
OF TIME'
ESP THEN
DE TIEMPO'
6. Occupational Module Selection
The occupational table collects descriptive information about the kind of job that was actually being performed. This method
of collection also identified key aspects of the job that could be used for selecting the most appropriate occupational module
programmed into the instrument. The descriptive information consisted of job title, main activities and industry description, as
well as other items such as 'chemicals exposed to' and 'tools used on the job.' For each job, the instrument was required to first
collect and then inspect these descriptions, and suggest to the interviewer possible occupational modules that might be mapped
to the job.
The first attempt to do this process was with the Blaise trigram coding scheme. This approach did not work mainly because the
concatenation of all the descriptions could be hundreds of characters long. This length of text string feeding into a trigram
search does not work well (the trigram was not meant for this purpose). The solution was to create a procedure that could take
the concatenated descriptions, and inspect them for exact matches to a list of hundreds of keywords. A score is kept internally
to the procedure and it then displays the modules that possibly match. The interviewer, in consultation with the respondent, can
accept any of the suggestions or override them.
This was first programmed and debugged with English. Then the keywords were translated into Spanish and that version of the
procedure was used in the instrument. We found out, among other things, that the effectiveness of the procedure is somewhat
dependent on the language. For example, precision in spelling is key to the process. Spelling a Spanish word without the
appropriate diacritical mark causes a problem. Overall, however, this process works well.
7. Meeting the Technical Challenges
There were several aspects to meeting the technical challenges of developing such a demanding instrument. First, the clients
(both in the U.S. and in Spain) and the project personnel at Westat did an excellent job of communicating the needs of the
survey and in specifying it. Additionally, they were able to identify challenging aspects of the instrument in advance.
Secondly, there was very strong prototyping of solutions for all of the above mentioned challenges and more. These were done
with so-called mini data models. These mini data models allowed the programmers and the project people to focus on
particular issues and specific parts of the instrument, and facilitated iterative development to a solution. Thirdly, the instrument
as a whole was developed in terms of mini data models, with well over 80 of them that are used. Given the size of the
instrument, it was inconceivable that it could have been developed any other way. Using mini data models allowed
programmers to work on different sections simultaneously, and allowed their sections to be compiled more quickly. The use of
explicit parameters to connect completed blocks into an integrated instrument made it very easy to link these modules into a
coherent whole. If a repair has to be made to a module it is done with the mini data model, and then re-integrated into the main
instrument.
Simultaneous Top-Down and Bottom-Up Development
At the same time the prototyping and the module development were undertaken, a parallel development with the overall
instrument structure took place. There were several issues in tying things together that had to be worked out. Most integration
issues were resolved when there were only a few of the questionnaire sections and modules finished (indeed, even before most
modules and sections were specified). This meant there was effective top-down and simultaneous bottom-up development of
the instrument.
Standards and Use of Expertise
Other aspects that were critical for the success of the instrument development were the early setting of programming standards
and ways of working. There were code reviews early in the process to make sure that methods developed in the prototyping
were applied correctly to production code. In addition, the project drew on the experience of Blaise experts at Westat.
III. In the Beginning There Was Blaise III for DOS
The development of the Spanish Bladder Cancer instrument was undertaken first in the final DOS version of Blaise, that is,
Blaise III. This was because the Windows version was not yet even in beta mode. In fact, the beginning of the survey was
conducted in Blaise III. Blaise III has some limitations that affected the survey, and those limitations and their solutions are
discussed here.
1. Memory Limitations
The instrument was first prepared and fielded with 48 of the 63 modules in place, but in both English and Spanish. As the
instrument was tied together in full for the first time, we found a memory limitation that prohibited it from running in a DOS
window under Windows (any version). As discussed above, the instrument had already been as efficiently designed as
possible, so there wasn't very much inefficient code to optimize, and we wouldn't have had the time anyway. Since the survey
is operational only in Spain, and in that sense English is not necessary, it was decided to comment out all the English language
text to see if that would allow the instrument to run in a DOS window. However, as described above, the language statements
and manipulations appear all over the source code. It would have been impossible to comment out all the English text and
computations by hand.
Automated Parsing and Commenting Out of English-Language Code
Since the instrument authors programmed according to well-defined standards, it was possible to comment out the English
language text and code by automated means. In a few days time, a senior Blaise engineer programmed a Manipula setup that
was able to parse all the source code files and comment out English text and manipulations. The virtual perfect implementation
of the source code according to standards enabled the Manipula program to search for a do-able set of patterns and keywords
and comment out the English code wherever it found it. For example, it could search for the phrase IF ACTIVELANGUAGE
= ENG and figure out where to put the beginning comment brace and where to put the ending comment brace. In actual fact,
this parsing and automated commenting out of the English proceeded with few problems and the first operational version of the
instrument was fielded on schedule.
While it was possible to field the 48-module instrument in Blaise III, it would not have been possible for all 63 modules. The
timely arrival of the Windows version of Blaise enabled the instrument to handle all 63 modules and work again in both
languages.
2. Other Limitations
Some limitations in the DOS version of Blaise affected the project, including overall block size and the size of the rules
section. We found, for example, that the absolute limit on size of a rules section, including programmers' comments, is 64Kb.
And we found that some blocks were too big to parse. The solution to these problems was to break big blocks into smaller
blocks and to program some rules sections as efficiently as possible. Some of these limitations extend into the Windows
version of Blaise.
Another limitation is with the size of a TYPE section that can be compiled with other instrument code. There are almost 2,500
type definitions. When the type definitions were incorporated into the Blaise source code with an INCLUDE statement, the
instrument would not prepare. The solution to this problem is to pre-prepare the type library. This simple step not only allows
the preparation of the instrument, but also speeds up preparation considerably.
IV. Progressing into the Windows Version of Blaise
The eventual arrival of the successive Windows versions of Blaise provided a more robust platform for this project. The
Windows version of Blaise provides much better memory management and 32-bit processing, both of which are indispensable
to the project. With these capabilities, Blaise can now handle all 63 modules and both languages.
Windows 95 has its own large memory requirements and so each machine was upgraded to 48 MB of RAM. Though Blaise in
Windows has a graphical user interface, the system operates in much the same way as it does in DOS and thus the transition
from the DOS version to the Windows version was relatively smooth for the interviewers.
Even before the first Windows version was released, the developers began using the Windows developer's environment to
produce the DOS instruments. They found, as have others, that the Windows Control Centre is much more powerful than its
DOS counterpart and could prepare the modules faster. When it was time to produce Windows instruments, the project verified
that there is true upward compatibility between the two versions.
Bugs
As one of the world's first surveys to be fielded in Blaise for Windows, the SBC project found several bugs in the software.
One of these is worth mentioning here. When copying a block of data from an Ask block to a holding block, the copy did not
include the copying of remarks. Westat reported this problem to Statistics Netherlands and they corrected this bug. During the
interim, a manual work-around procedure was implemented in Spain where the interviewers recorded their remarks in any
occupational module separately. This quick response of Statistics Netherlands fixing important bugs was very important for
this groundbreaking effort.
New Features in Blaise
The Windows version of Blaise also came with new features that were found to be very useful. First was the audit trail that is
not available for the DOS version. This provided a means of data backup for lost remarks (see above) and for debugging some
problems. Another feature that is the new ability to tie an executable program to a function key. This was used to enable an
interviewer to invoke another data entry program and instrument when the respondent was getting tired or starting to refuse the
questionnaire. This is called the Critical Items questionnaire. The idea is to get key data from these respondents if possible.
Since this situation could arise at any point in the interview, the ability to tie this to a function key was very important. This
could have been executed through a parallel block as well, but then the data model definition would have changed and the
project wanted to avoid that.
V. Operational Considerations
There are some operational issues with Blaise that were important for the SBC to anticipate and manage correctly. These
include performance of the instrument on the supplied hardware, versioning of the data models, use of Maniplus for laptop
survey management, SAS limitations, and supporting operations in Spain.
1. Instrument Performance
The laptop in use in Spain has 48 MB of RAM and 133 Mhz processors. These were not top-end machines even when they
were purchased and are considered slow by today's standards, but the huge data model runs fast and well. The key to this
performance was the advanced appreciation of the challenge, expert knowledge of the Blaise selective checking mechanism,
and programming standards that met this challenge. The key to improving performance in a large data model is to reduce the
amount of parameter administration between blocks, and to reduce the number of blocks that are checked at any one time. This
is an advanced topic not suitable for this paper, but if the selective checking mechanism is taken into account, you can
implement large and complex data models.
2. Data model Data Definition Changes
It is a fact of life in the Blaise world that even relatively minor changes in an instrument can result in a change in data file
definition. When such a change happens, it is necessary to translate the database definition from the old to the new
manifestation. This process can be automated on a laptop and in the home office, but there is still a versioning issue. That is,
with several data files in different locations, how can you be sure which database is in which version? This challenge was met
with strict versioning procedures and planning for version changes. Changes to the data model were allowed more frequently if
the data file definition did not change. If a data file change was necessary, the change had to be strictly executed and
scheduled.
3. Survey Management on the Laptop in Maniplus
A Maniplus survey management system was used on the laptop to control access to the cases, data transmission, and other
aspects of operations for the interviewer. The use of Maniplus to execute the instrument and the survey management is crucial
to this survey given the combination of low-end hardware configuration and the size and complexity of the instrument. The
advantages of Maniplus for this are several fold: the Data Entry Program and the Manipula are part of the Maniplus executable
file, and when the instrument or a Manipula function is executed, it is not necessary to invoke another executable. Maniplus
also has full knowledge of Blaise metadata and can write to and read from a Blaise database. It also loads the instrument ahead
of time and this allows the interviewer to start the interview quickly if necessary.
Another decision was to put each data record in its own zip file. This decision was made because of the tremendous size of
each record. We did not want to have to try to rebuild a data set with Hospital in case of data corruption, though this latter
possibility has not been a problem.
4. SAS Output and a (Former) SAS Limitation
Due to the size of the data model, data are exported from the instrument with ASCIIRELATIONAL output. Over 100 output
tables are produced. A former SAS limitation, that of 8 maximum characters for SAS VAR names, had to be overcome
because some of the Blaise field names were over 8 characters. Another challenge was to get SAS data descriptions for the
ASCIIRELATIONAL output. The Blaise system does not come with a totally automated way of getting the data description
for each output table. With over 100 tables to take into account, even a one-time effort to produce descriptions by hand would
have been very tedious. When you consider data model changes, the potential to have to redo these by hand becomes
impossible. The solution here was to develop programs in Cameleon, Manipula, and DOS BAT files that totally automate this
process.
5. Supporting Operations in Spain
There were several challenges in Westat's support of operational data collection in Spain. These problems included language
differences, time zone differences, and long distance support. When an operational problem occurs, getting an accurate
description of the problem is the first step at diagnosing and resolving the problem. Reporting the problem clearly and
succinctly in two different languages does not always happen immediately, and sometimes additional time is required in
iterations just to understand the problem. Also, the issue of a six-hour difference in time zones becomes another factor to
weigh in responding to problems in the field. Even with these challenges, the project has proactively addressed problems with
the cooperation and good will of everyone involved.
VI. Keys to Success
The success of the Spanish Bladder Cancer Study CAPI implementation can be summed up into these three key areas: the
organization of staff; the development process, and the working relationship with Statistics Netherlands.
The organization of staff was simple in design but powerful in its operation. Heading the development side was the senior
integrator. Below the integrator were five programmers each assigned to the section and occupational module programming. In
a staff position was the independent test team, which also filled the role of specification writer. A senior Blaise technical expert
gave strategic advice on design and instrument development methodology. The key, however, was the senior integrator. While
not a Blaise expert, it was the integrator who understood the importance of following established standards and processes.
The key in the development process was that all standards and processes were defined up front. Based on requirements and the
design it was decided that each section and each module would be developed and tested as its own data model. Later, each
section and module was incorporated into the instrument 'mainline.' For each occupational module, 90% of the questions asked
involved measuring how long it took to do something or how long an exposure there was. Type blocks and procedures were
created and eventually used many thousands of times in the instrument.
The independent development of the sections and occupational modules gave way to the independent testing of each section
and module. This testing process enabled the testers to focus on the results of each section and module test without concerning
themselves with influences from other components of the system.
A final key was our working relationship with Statistics Netherlands. Whenever there was a problem, such as remarks not
being copied from one block to another, or the Don’t Know/Refused symbols not being displayed, we were given a prompt
response and in many times a version of Blaise with a fix to the problem. This relationship allowed us to continue developing
the instrument without having to worry about 'a work around.' In addition, it built credibility, not only with those doing the
development, but also with our client.
Using Blaise in a Nationwide Food Consumption Survey
Lois Steinfeldt, Ellen Anderson, Jaswinder Anand, Nancy Raper
Introduction
The Food Surveys Research Group (FSRG) at the U.S. Department of Agriculture, working with Westat, Inc., is in the process of
converting the nationwide food consumption survey from a paper and pencil questionnaire to a computer-assisted interview
programmed in Blaise 4. Collecting and coding information about the foods consumed by individuals in large-scale food
consumption surveys requires asking specific questions for each food. There are numerous factors affecting the nutrient content
of foods that must be captured. The questions required across all foods can easily reach into the thousands and the number of
responses to an individual question can reach into the hundreds. The large number of questions and responses has presented many
challenges in developing and managing questionnaire specifications and testing the instruments.
Background
The U.S. Department of Agriculture (USDA) has conducted surveys to collect national information on food consumption since the
1930’s. These surveys monitor food use and food consumption patterns in the U.S. and provide data used to address economic,
nutrition and food safety issues. For example, the data are used to evaluate the nutritional adequacy of the American diet and the
impact of food assistance programs. The data are also used to estimate exposure to pesticide residues and to study the impact of
food fortification, enrichment, and food labeling policies.
The Continuing Survey of Food Intakes by Individuals (CSFII) is a nationally representative sample of individuals of all ages. The
screener questionnaire is used to identify eligible households. A household questionnaire is administered to the household member
most knowledgeable about household characteristics such as income, education and food shopping practices. Selected individuals
are asked to provide food intakes for 2 days, spaced 3-10 days apart. One respondent over age 19 within a household, who provided
at least 1 day of food intake, is selected to complete the Diet and Health Knowledge Survey (DHKS).
During the intake interview, individuals recall the foods and beverages that were consumed the day before the interview. Details
about each food and beverage are collected as well as an estimate of the amount consumed. Information is also collected on the
time of day the food was eaten, the name of the eating occasion, whether the food was eaten at home or away from home, and where
the food was obtained. Each food reported is then linked to nutritive values in order to calculate how much of each nutrient the
individual consumed. Fifty-two different nutrients are calculated including calories, fat, protein, carbohydrate, vitamins, and
minerals. Plans are underway to integrate the CSFII with the National Health and Nutrition Examination Survey (NHANES)
conducted by the National Center for Health Statistics (NCHS), U.S. Department of Health and Human Services (DHHS). Both
surveys will use the USDA dietary collection method and nutrient database. Each of the surveys will produce a core set of variables
for estimating and interpreting dietary intakes in a combined yearly sample.
Description of the Instruments
Table 1 shows the number of questions, enumerated responses, lookup files and responses in lookup files for each of the instruments
after the conversion from paper and pencil to the computer-assisted interview version. The table clearly shows that the food intake
instrument is the largest of the instruments in terms of the numbers of questions and responses. Most of the food intake instrument
consists of questions about specific food details, including the amount of food eaten. The large number of questions and responses
produce an even larger number of skip patterns because the questions asked about a food depends on the responses to the previous
questions. The number of possible paths through the food detail questions is roughly estimated to be over four hundred thousand.
The size and complexity of the food intake instrument is what makes this application unusual and challenging.
Table 1
Pilot Study I CATI
Instrument
Questions
Enumerated
Responses
52
74
Household
112
248
Food Detail Section
Total Food Intake
2389
2515
11932
12414
137
429
Screener
Diet and Health
Knowledge Survey
Lookup Files
Responses in
Lookup Files
93
96
9352
9959
Food Detail Specifications
Creating the food detail specifications began with the Food Instruction Booklet (FIB). The FIB was an 80-page booklet used as
an interviewer aid in earlier food intake surveys. It was designed to assist interviewers in collecting detailed descriptions of foods
and amounts for the paper and pencil version of the food intake questionnaire. Foods had been grouped into 16 broad categories.
Since the questions and responses within these categories were very different, a decision was made to further divide them into 132
categories for the computerized version. Each of the food categories was assigned a unique code. The categories made it possible
to ask more specific questions and made writing, programming, and testing the specifications a more manageable task.
Early in the planning stages, the decision was made to use a database approach to writing the specifications. From years of
experience maintaining a large and diverse food coding database in a constantly changing food market, it was clear that the food
intake specifications would be large and complex and would need to be updated periodically. This approach produced many
advantages in the writing, reviewing, and editing of the specifications. When changes were made that affected more than one
category, it was easy to review and apply the changes uniformly.
Figure 1 shows the form used to enter and edit the specifications. The specification database has two main tables: Items and Responses.
The Item Number uniquely identifies each item and links the Items and Responses tables. Included in the Items table are questions, boxes,
and edits. Question types include enumerated, open ended, lookup file, and continuous. The responses for enumerated questions are stored
in the Responses table. Enumerated questions are used when the responses fit on one screen. Lookup files are used when the number of
responses would exceed one screen (approximately 40). Some of the largest lookup files include candy, cake, cereals, and frozen meals,
all of which have more than 300 responses. Questions with continuous responses are used for the amounts of food eaten. Open-ended
questions are used for “Other, specify” responses.
Figure 1
Specifications database data entry and edit form
When there is a lookup file for a question, the name of the file is stored in the Items table. Lookup files allow the interviewer to
search for a response using the trigram search rather than having to page through multiple screens. Lookup files can be used with
more than one question. Table 2 shows examples from the “CheeseKind” lookup file. This lookup file provides response options
for the “What kind of cheese was it?” question for the Cheese and Grilled cheese sandwich categories. Each category that uses the
question has a column in the lookup file for the Skip to Variable Name field. In this example, when cheddar cheese is chosen in
the cheese category, the instrument skips to item CHE010. When cheddar cheese is chosen in the Grilled cheese sandwich category,
the instrument skips to item GCS440.
Table 2
CheeseKind Lookup File
Food Name
Cheddar cheese
Cheese spread
Provolone cheese
Cheese Category
Skip to Variable Name
Grilled Cheese Sandwich
Category Skip to Variable Name
CHE010
GCS440
CHE017
GCS335
CHE020
GCS345
Most questions allow only one response. Questions that allow more than one response are flagged as Code All That Apply. There
are 188 Code All That Apply questions in the food detail instrument. DK flag, RF flag, and OS flag fields are checked when “Don’t
know”, “Refused to answer” and “Other, specify” are allowed responses. DK Skip to Variable, RF Skip to Variable, and OS Skip
to Variable fields contain the Item Number that identifies the question to skip to for those responses. “Don’t know” and “Refused
to answer” responses are allowed for every food detail question. “Other, specify” is also allowed for every question with a few
exceptions such as questions with only “yes” and “no” as response options. Edit ranges are stored in the Lower Range and Upper
Range fields, and Edit Type specifies whether the edit is hard or soft.
The Responses table contains the Response Number, Screen Display, Value Label, and Skip to Variable Name for each of the
responses for the enumerated questions. The Skip to Variable Name indicates the question to skip to for that response. Skip patterns
were provided for every one of the approximately 21,000 responses in the Responses table and lookup files.
Edit items use the Item Text box to explain complex edits. An example of a complex edit is checking for impossible combinations
of answers between two or more questions. Edits are also used for impossible combinations of responses within a Code All That
Apply question.
Boxes are used to explain complex skip patterns that can not be defined using the Skip to Variable Name fields in the Responses
table and lookup files. The skip instructions are written in the Item Text box. Boxes are also used for instructions on lookup files
used by more than one question. As shown in Table 2, these lookup files have a Skip to Variable Name column for each question
that uses the file. The box is used to specify which column in the lookup file applies to which question.
The database approach saved time in writing and reviewing specifications. This method made it possible to easily copy questions,
edits, boxes, and responses within a category as well as across different categories. Templates were developed for questions that
were asked across multiple categories. Text areas that display instructions for the programmer and issues to resolve provided
flexibility to specify unusual conditions. A variety of reports were created and used during the review process.
Main Food List
The first step in the food intake interview is to obtain a list of foods consumed. In order to produce the correct set of questions for
each food, there must be a link between the reported food and the food category. This link is provided by the Main Food List
(MFL), which is a Blaise lookup file containing approximately 2500 food names. Each food name is linked to a food category
number that determines which questions are asked for that food. The food names on the MFL must reflect current food supply and
food consumption patterns. General descriptions such as lunch, buffet, or unknown food are also included and linked to a special
unknown category to collect further detail later in the interview. The trigram search mechanism is used to locate foods on the MFL
as the respondent reports them. A complete, easy-to-search MFL that can be updated in a timely manner is extremely important
to the success of the survey.
The process of creating the MFL is shown in Figure 2. It was constructed primarily from the CSFII Food Coding
Database. The Food Coding Database was a logical starting point because:
1) it is a large and diverse collection of foods and brand name products;
2) frequency data from previous surveys identified the most commonly consumed foods
and ensured their inclusion on the MFL;
3) the relational database format of the Food Coding Database files made extracting foods for the MFL very easy and
enhanced our ability to manage the progress of a constantly-evolving MFL.
To begin building the MFL, a database table was created that contained all 7300+ survey food codes, their generic food
descriptions, and brand name information extracted from the Food Coding Database. Additional fields for Food category, MFL
name1, MFL name2, and MFL name3 were added to the table. Each survey food code was assigned one of the 132 food categories
by a food specialist. By linking the survey food codes to food categories, it was anticipated that:
1) this information could be utilized for automated coding purposes;
2) maintenance of the MFL would be enhanced by tracking changes and additions to the Food Coding database, which
in turn, may affect the MFL and the food category questions.
Figure 2
Creating the Main Food List from the Food Coding Database
Create table from Food
Coding Database
Assign Food Category
to survey food codes
Designate MFL food
items to 3 levels of detail
Make changes
to MFL table
Insert approved
abbreviations
Yes
Run automated tasks
Error report?
No
Make changes
to MFL table
Check for invalid characters
and missing food categories
Yes
Error report?
No
Generate a “Final” MFL
table
Export “Final” MFL
table as ASCII text
Test Trigram search
Changes necessary?
No
Yes
MFL Done!
As shown in Table 3, three separate fields for MFL name were used to record different levels of detail for MFL food items. For
example, “oatmeal” was assigned to MFL name1 representing the least amount of detail, whereas the more specific “instant
oatmeal” and “Quaker instant oatmeal” would be found under MFL name2 and MFL name3, respectively. Having these three fields
made it possible to generate three different MFLs based on the level of detail desired. A team of food specialists reviewed the
survey food codes category by category, assigned food items to a level of detail, and decided what food items would be included
on the MFL. In some cases, MFL food items were added to the table but were too general to link to a specific survey food.
Table 3
Food Coding Database table used for constructing the Main Food List
Automated tasks included:
1) A list of approved abbreviations (e.g., “bf” for baby food; “lf” for low fat) replaced longer words in some MFL food
items;
2) MFL food items were checked for the presence of invalid characters which could hamper the trigram search (e.g.,
extra blank spaces between words; dashes “-“ and slashes “/”);
3) Every MFL food item was verified to have a food category assigned to it;
4) MFL food items and their corresponding food category were extracted from the original table and copied into a final
MFL table;
5) The final MFL table, shown in part in Table 4, was exported as an ASCII text file to be prepared for use in Blaise.
Table 4
Final Main Food List format
During the development of the MFL, a Blaise program was used to test how well the MFL would work during the interview. Food
specialists entered food names and evaluated the results of the trigram search of the MFL. The goal was to have common food
names show up at the top or close to the top of the list returned by the trigram search.
Since the MFL information is in a database table, changes can be made with ease, and the programs can be re-run as many times
as necessary to generate the final MFL table. This entire process was executed 9 times over a time period of about 6 months during
development.
Limitations of Using CAI in Food Surveys
Although the use of database management software was a big help in the specification process, it could not solve all the difficulties
in converting the food intake questionnaire from PAPI to CAI. One of the issues is how to balance the need to collect complete and
accurate intakes with the size of the data model. When thousands of people, every year, are asked what they eat, their answers will
be very different and some will be quite unusual. This occurs in both the numbers and the types of foods and beverages consumed.
Although national averages of nutrient intake are not affected by the data for a few foods, for some uses of the data, it is the outliers
that are important. An example of this is estimating pesticide exposure from dietary intakes. For this purpose, the tenth fruit or
vegetable eaten in a day may be important. Setting array sizes to accommodate the highest intakes of foods per day and foods per
category per day does not seem to be possible without compromising the instrument. The ability to dynamically change array sizes
would be very useful in this application.
The fixed array sizes also produce a very large, although very sparsely populated data set when the data are extracted from Blaise.
This very large set of files (> 900) requires a complex post-interview processing system to extract and condense the food intake
data reported in the interview. We are looking forward to seeing how the implementation of Open Blaise Architecture (OBA) can
improve the post-interview processing on the food intake data.
Another major concern in using CAI in food surveys is the need to continually update responses and even questions as the food
supply, eating patterns, and dietary concerns change. Since the responses are the basis of skip patterns and edits, it appears that
the kind of continual update done on Food Coding databases will be difficult to implement on a CAI instrument. Although some
changes can wait until for the end of each survey year, some will need to be made while the survey is in the field. We are interested
in finding designs or processes which would be able to produce changes in a cost-effective and timely manner.
Summary
The features of Blaise and the extensive use of database management applications made it possible to create a very detailed food
intake questionnaire. The database management system made it easy to search for specific questions across all categories, compare
questions and responses between categories, and copy specifications from one category to another. The database format also made
it easy to find and make changes to the specifications. Utilization of Blaise’s trigram search for the Main Food List linking food
names to food categories provided a quick way to select the appropriate set of food-specific questions. Creating the Main Food
List from a database table proved to be useful for organizing and maintaining different versions of this lookup file and for
automating processing tasks. The extensive use of lookup files for long lists of possible responses made it possible to ask more
specific questions and will also be easier to maintain as foods change over time.
Challenges in developing a Longitudinal Survey on Income Dynamics
Brett Martin, Statistics New Zealand
1. Introduction
The development of a longitudinal panel survey is a very complex and challenging process. Statistics New
Zealand is currently running a project to evaluate the feasibility of a Longitudinal Survey on Income
Dynamics. This paper discusses some of the challenges involved in building the Blaise instruments for the
two field tests involved.
For the first time in Statistics New Zealand a large Computer Assisted Interviewing (CAI) instrument has
been constructed without creating an associated paper form. New ways of working together to specify and
develop the Blaise programs have evolved as the project progressed.
Checking large instruments takes a considerable amount of time and effort. In a longitudinal survey the
need to refer to data collected in earlier waves increases the complexity of routing and editing and the
amount of validation required. Ongoing changes to questions and edits further increase the workload.
Data obtained from the Longitudinal Survey on Income Dynamics (LSID) field testing programme is being
investigated by the project team to see whether the required analysis and outputs are feasible. The results
will be reported in September 2000.
The experiences gained in developing the instruments for these field tests have highlighted many areas
where improvements can be made in future projects.
2. The LSID project background
The objective of the LSID project is to determine an appropriate methodology for a longitudinal panel
survey on income dynamics. This is an ambitious task with many different facets including:
• reaching agreement on the survey content with the clients
• developing a sample design
• developing CAI instruments and associated field collection systems
• field testing
• specifying systems for estimation, imputation and sample error calculation
• creating and testing an output database
There is little information currently available in New Zealand on income, labour market and family
dynamics. Some of the benefits of obtaining this information are seen as:
• understanding what prevents people reaching desirable social and economic outcomes
• assessing the role of policy interventions in creating or alleviating any blocks
• improving the targeting of Government services to those most in need
Achieving these benefits requires information, allowing comparison of the positions of individuals and their
families over time and also in relation to particular social and economic benchmarks. The outputs from a
survey of income dynamics would be used for developing policies on:
• taxation
• retirement provisions
• assisting people move from income support to paid work
• assisting people improve their income levels
• support for families and children
• education
Statistics New Zealand has obtained additional funding to do this research. Not all of the systems required
for a production survey are being fully developed. Instead some aspects are only being investigated and
documented to a stage where they are ready to be specified. This provides more opportunity to evaluate
alternative approaches rather than just focusing on the construction of production systems.
The project commenced in July 1997 and the first of two waves of field test interviewing took place in July
1999. The respondents were re-interviewed, along with any new household members, in a second field test
held in March 2000.
A final report recommending a methodology for a longitudinal survey of income dynamics is due in
September 2000. Following the completion of the project, it is hoped that a full survey will be approved.
There is a great deal of interest in the research community in such a longitudinal survey as well as wide
support across the public sector.
3. The LSID project team
The LSID Project Manager co-ordinated a team of up to 15 people. They have consulted with clients,
developed the topic specifications, evaluated hardware, put together training manuals, organised the field
work and managed the budgets. The sample design, questionnaire design and instrument programming
was undertaken by specialist sections within Statistics New Zealand.
The Questionnaire Design Consultancy section develops questionnaires used for most of Statistics New
Zealand 's surveys. The LSID survey instruments are the first they have developed without an associated
paper form. Previously paper forms have been created along with new Blaise instruments. The
questionnaire design staff involved had no prior experience with Blaise.
Developing Blaise systems is the responsibility of the Technology Application Services division. Over the
past three years they have built up considerable Blaise expertise. A full time programmer was assigned to
the instrument development. A part time analyst / team leader and several part time programmers worked
on other aspects such as derivations and the output database.
4. The LSID design
The LSID aims to collect information on:
• the level of earnings from employment, government support and other income sources over time
• the length of time spent at different income levels
• changes in family status and the length of time spent in different family situations
• the length of time spent in employment, unemployment, part-time work, out of the workforce
• the factors that may be associated with these changes such as education qualifications, health
status, age of children, occupation, hours worked, ethnic group and age.
These objectives were developed from the information needs of the clients. Topic specifications were
written to cover all the objectives. The topic specifications, detail the different types of data required and
were the starting point for the design of the survey questions. In the final report all the topics will be
assessed for their feasibility and cost effectiveness.
For longitudinal data the unit of analysis is the individual. Information about each person's family and
household is also required. For example, individuals will have a family type, a family income, a household
income etc. All LSID data has one of three time-based attributes:
• spell data
• annual data
• point in time data
Spell data relates to a period of time. For example the receipt of government income support payments
from start date to end date. Annual data comprises of one value for a 12 month period, such as the income
from interest in the 12 months prior to the interview month. Point in time data relates to situations as at the
interview date. For example a persons educational qualifications at the interview date.
The LSID is an interviewer administered survey. The large number of detailed questions involved, make it
unsuitable for other collection methods. CAI was chosen over pen and paper interviewing because it
automates the complex routing, and it allows information from previous interviews to be more easily used.
The field test sample comprised 436 households. Every eligible person, 15 years and over, in a sampled
household is asked a personal questionnaire and those under 15, a child questionnaire. The sample size of
a full longitudinal survey is proposed to be around 10,000 households.
Other considerations in the design of the survey included:
• how to achieve better estimates for the Maori population through over sampling
• obtaining background information on the respondent's current situation
• calculation of derived variables such as annual income and family income spells
• cross sectional outputs from each survey wave
• treatment of non response, proxy and partial responses
• continuous or windowed interviewing
• the reference period used for data collection
• interviewer training requirements
• strategies for approaching respondents
• incentives to retain respondents
• tracking methods to reduce attrition
• privacy implications
• respondent burden
Longitudinal surveys run by other Statistical Agencies were investigated and the information obtained has
helped improve our designs. The Australian Bureau of Statistics carried out two formal peer reviews of the
project as it has progressed. Inevitably though there are many aspects that can only be learnt from
experience.
5. Development challenges
5.1 Specifying the questions
The questions for the two field tests were developed from the detailed topic specifications. The LSID
instruments are far more complicated than any conventional paper based questionnaire and cannot easily
be described in traditional ways. Building a Blaise instrument without a corresponding paper form meant a
new approach to specifying the questionnaire was needed.
Flowcharts were agreed as the best means of specifying the questions and routing. A very basic
flowcharting package, 'Easyflow' was obtained. The designers found this package easy to use and really
helpful. It enabled them to concentrate on the job of designing and specifying the questions.
Flowcharts visually depict the flow of the questions involved and document the question texts. They convey
the very complicated routing involved in a way that is easily comprehended by everyone involved.
Flowcharts were also used as simple paper questionnaires for early cognitive testing. However some
things such as table structures are more difficult to show on a flowchart. Over 100 pages of flow charts
were produced.
The programmers took full responsibility for writing the Blaise code. The division of labour was simply
accepted at the start. By the end of the development of the instruments for the first test this approach was
beginning to be questioned. However the pressure to meet deadlines left little scope for changing roles.
Originally it was envisaged that the questionnaire designers would be able to access and edit the Blaise
scripts but this was never implemented. Only now after the completion of the LSID instrument development
is the idea of the question designers working directly with Blaise being re-addressed.
5.2 The development process
When development of the questionnaire started the detailed topic specifications were not ready. The
designers began by trying to second guess what was needed. Unfortunately this initial work was not
correct but it helped the designers understand the differences between Blaise and paper questionnaires.
For example they learnt that it is not possible to ask a question in Blaise with both numeric and written
response categories.
The development staff worked together to figure out what was possible. In some places the designers
thought it would be better to leave the flowcharts vague so the Blaise programmer could work out the best
approach. The programmer suggested alternatives where he thought things could be improved. Most times
this worked really well and helped to make the instrument more straightforward. Other times the designers
had to make lots of changes because the questions didn't flow well.
Initially the programmer's role was more like a questionnaire designer. He reviewed early drafts of
questions made suggestions and comments on how things could be done. When both parties were happy
with the flowcharts the programmer would develop the Blaise code. The designers did not really have
much idea of how their questions would look like on screen at the start. Once a module was working in
Blaise, the designers would review and check it. Then the whole cycle would start over.
The question designers found it a real plus that the programmer was very approachable and good at
seeing issues from the questionnaire design point of view as well as a programming point of view. The
relationship between the two groups worked well and hopefully this can continue in future developments.
There were a few difficulties when staff moved on. New relationships had to be fostered and the protocols
re-established.
A lot of work was involved in generating and keeping flowcharts and Blaise scripts up to date and
synchronised. Because all the information had to be manually transferred from the flowcharts into the
Blaise scripts there was a lot of duplication of effort. And when the inevitable changes were required, the
work had to be done over again. In hindsight more training, better procedures and scheduling would have
avoided much ‘on the job’ learning and duplication.
5.3 Establishing the timeline
Each set of spell data questions is dependent on the respondent's activities during the reference period. To
find out what the respondent was doing they are asked questions about their activities along with the start
and finish dates. For example: 'Were you in paid work at any time between date x and date y?'
In Blaise these questions were implemented as a simple table with activity type, start date, end date fields.
The activities were then organised into to a timeline. This can be visualised as a sequence showing what a
respondent was doing on any given date during the reference period, usually the previous year.
The challenge is not so much recording a respondent's activities but with the many edits that need to be
applied. These checks involve finding overlaps and gaps in the timeline. They can only be applied after all
the activities are recorded and sorted, otherwise error messages would appear straight away. Getting this
to work in Blaise was harder than it might seem. To see whether the interviewer is ready to check the
timeline a (Auxfield) question is asked. The field is used to trigger the timeline sorting and edit checks.
When all the checks are resolved the field is reset. This means an interviewer can go back and change the
timeline without invoking the edit checks until they are needed again.
In the second interview additional activities may need to be included in the timeline. The interviewer first
confirms the activities recorded in the first interview then enters any new activities since the first interview
into another table. These two timelines are combined using a temporary table and then moved back into
the standard timeline. Once the time line is established it determines the relevant spell data questions to be
covered.
5.4 Structuring the instrument
The household instrument for the first test had over 700 fields and the personal instrument over 6000. For
the second test the household instrument was the same size but the personal instrument expanded to
7800 fields with the addition of questions on the value and type of assets and debt held by the respondent.
When the total size of the LSID instrument became evident it was decided to split the Blaise code into
separate household and personal programs. This was a straightforward change as there was little need to
share or edit data between the different household members. A separate personal instrument helps ensure
that response times do not deteriorate when the number of questions increases. The household and
person instruments are linked together for the interviewers with a simple Maniplus interface.
The only performance issue mentioned by the interviewers was the time it takes for the program to open.
Some resorted to starting the questionnaire before entering the respondent's house. Once the interview is
started, moving between questions is nearly instantaneous. Interviewers were equipped with new Toshiba
Portege 3010CT computers running Windows NT Workstation and Blaise 4 Windows. These are
lightweight 226 MHz Intel Pentium machines with 64 MB of memory.
The detailed topic specifications were drip feed to the questionnaire designers. The questionnaire
specifications were then delivered to the programmer in a similar manner. This meant the over all structure
of the instrument was not evident and there was little opportunity to plan or optimise it. Having all the topic
specifications to start with would have allowed a better overview and more logical arrangement of the
components.
The Blaise data structures for large questionnaires end up being extremely complicated. In some places
the programmer tried to simplify the data structure by combining questions asking for the same information.
Appropriate question texts for the different situations were computed and one field used to store the
answers. While this sounds attractive it makes the route logic much more complicated. This approach will
not be used again, as it became too difficult to maintain. Instead data, from separate fields for each
question, will be combined with Manipula.
It took a lot of time and effort to get meaningful data from the first pilot test. Cameleon was used to create
the scripts to define the Sybase database output tables. Apart from splitting large arrays with Manipula, the
Blaise data was exported in its original structure and loaded to the database tables. SAS was used against
the database to transform data and derive new variables.
For the second test Manipula was used to export the data in a 'record per question' structure. The data was
read directly by the SAS derivation programs and then loaded into the database. While this method
required more Manipula code, it simplified the overall process.
Data collected in the first interview is used in the follow-up interview. If the paths to the external files
containing the data from the first interview are not specified correctly, Blaise cannot find the data. During
development the instrument was run on our internal network. This required different external file path
definitions than were eventually used on the interviewers’ laptops. Mapping the path to a drive letter, such
as E: did not always work. To fix the problem the full path to each external file had to be specified in all
cases. This of course is not ideal, as the Blaise scripts have to be altered and re-prepared for each
environment.
5.5 Managing changes
In any large development it is inevitable the requirements will evolve and be refined. How these changes
are managed is often the difference between a successful or a stressful development. As milestones
approach, and it becomes obvious that there is more work than can be done in the timeframe left, priorities
have to be determined and the hard decisions made about what will be left out. Often the need to
accommodate change is not allowed for in the project planning and scheduling.
Late delivery of topic specifications meant questionnaire development also ran behind schedule. Frequent
changes to the question texts also became a significant issue. The large number of variables used as fills
in the question text along with the poor methods used to identify changes in the flowcharts and transfer
them into the Blaise scripts all helped to compound the delays.
Given the designers inexperience with Blaise and the complexities involved it was not considered viable for
them to manage changes to the question texts in Blaise. With appropriate training and systems it would be
more efficient for the question designers to maintain the texts themselves.
The delays with the topic specifications worked against an orderly sequence of development and also
impacted on the time available for specifying, testing and programming the questions. Modules developed
in the earlier phases needed to be revised in light of later topic specifications. All the changes required
stacked up to the point where they impacted on the ability of the programmer to effectively deal with them
in the time available.
5.6 Validating the instrument
Testing a CAI instrument is vital. Considerable time and effort was spent in cognitive testing as well as
ensuring the question texts, routing and edits were correct. The need to refer to data collected in the first
test considerably increased the complexity of the routing and editing for the second test instrument and
thus the amount of validation required.
The question designers carried out cognitive tests using their flowcharts. Feedback on the flow and
comprehension was used to shape and refine the questionnaire specifications. However the opportunity to
'desk check' the questionnaire using the flowchart was not utilised as extensively as it could have been.
Mostly this was due to time and resource constraints. Testing the route did not really commence until much
of the programming was completed. This meant a lot of effort was required over a relatively short period.
The number of ongoing changes also impacted on the timeframes available for testing and validating the
instruments. Modules had to be rechecked again and again. The lists of changes became longer and
longer as the project went on. As there is always room for improvement it was not until the pressure of
impending deadlines became obvious that the issues were prioritised and the modules finalised. It would
have been preferable if individual modules were signed off and put aside earlier, so efforts could be
focused on higher priorities.
Many of the people who tested the first field test instrument had moved on by the time the second
instrument was ready for checking. Training new people in what the instrument was intended to accomplish
and helping them distinguish genuine errors, took almost as much effort as the testing itself. A variety of
people were involved in the instrument validation, including people outside project. The instruments were
checked against the questionnaire specification flowcharts. The fact these specifications were in an easily
understood format helped the testers determine whether the behaviour of the Blaise program matched the
documented requirements.
The majority of the routing involved in the LSID instruments was programmed using 'State Rules'
technique(1). Although this method requires a lot more lines of code than the usual Blaise rules section, it
makes the route logic much easier to implement and validate. The routing conditions for each question can
be written and verified independently of surrounding questions. This is especially beneficial when changes
or corrections are needed, as testing can be confidently focused on only the altered questions.
Incremental validation would certainly have spread out the huge workload involved in checking the
instrument. If individual modules were programmed, tested and signed off as the development progressed
then the final 'build' would simply involve checking that everything had been assembled correctly.
6. Interviewer training and support
Interviewer training for the first field test included pre-course reading material, followed by a five
day face to face training session, covering laptop use and specific LSID survey content. Nineteen
interviewers attended. The project team developed the training course with assistance from
Statistics New Zealand 's Training and Development section.
The interviewer manuals and support materials were very well received. After the five day training,
and a week of practice prior to going into the field, the majority of interviewers were confident about
their ability to conduct an interview. The main changes made for second field test training were to
keep training groups smaller (no more than 8 people) and to have as much hands on practice as
possible. Interviewers requested more detailed information regarding the survey content prior to the
training course.
A 0800 (free phone) number provided first line support for interviewers and respondents with
problems, queries or concerns. Subject matter experts provided further assistance as required.
Most calls from respondents were general queries about the survey. In total over 100 calls were
received for both tests. The interviewers found the free phone number helped to resolve problems
and provide guidance quickly and effectively especially during the initial settling in period.
7. Field test results
The first field test, held in July 1999, aimed to:
• provide an indicative response rate
• trial the CAI instrument and proposed field procedures
• trial performance of laptops and accessories
• assess respondent load
Overall the Blaise instrument worked successfully. Only a couple of minor routing errors were
discovered. Interviewer reaction to the laptops and the Blaise system was very positive, with almost
unanimous agreement at the debriefings that more questionnaires should be done this way. Feedback
from interviewers and analysis of results so far indicate respondents had few difficulties with the
questionnaire content.
The laptops proved reliable with only a couple of problems very early on. The screen quality of the
laptops was excellent. However there were the usual problems when interviewing in strong light. Some
interviewers accidentally hit the F2 key (which exits the questionnaire), while using the numeric 2 key.
This problem was resolved by reassigning the F2 key function. Two batteries provided ample power for
a day’s workload and respondents had no objections to interviewers plugging in on the odd occasions
when it was necessary.
The average interview length for the personal questionnaire was around 30 minutes. This is well within
the upper limit target of 45 minutes on average. Interviewers indicated the length of the personal
interview varied greatly, depending on the complexity of the household and each individual's situation.
Interviewers commented that respondent fatigue was a problem with the longer interviews and
stressed the importance of preparing respondents to help avoid difficulties.
Over 70% of eligible individuals provided a full response. Item refusals were very low overall with only
very small numbers of respondents refusing to answer income questions. Offering the choice of
answering to the nearest $100, $1000, and finally income ranges seems to have been very successful
in minimising refusals and don't know responses to these questions.
Respondents were asked to provide a contact person to assist with follow-up and 21% answered "no"
to this question. While this appears high, interviewer feedback indicated that some of these people felt
that the information was not required, as they had no intention of moving, while others may have had
difficulty providing a contact. The real impact of this non-response will not be known until we analyse
the contact results from the second field test.
Each interviewer's work was pre-loaded onto their laptop. Interviewers transferred their completed
cases onto floppy disks and mailed them to Statistics New Zealand each week. This eliminated the
need to develop a full-scale case management system. Wrapping disks in plastic bubble wrap and
using courier bags provided ample protection at an acceptable cost. Of the 80 disks returned only
one was damaged, most likely before posting.
The data was amalgamated for in-house processing such as coding of occupation, industry and
education qualifications. Analysis of the first field test cases helped identify potential problems with
the questionnaire and will contribute to developing cost estimates for the full-scale survey.
The second field test was conducted in March 2000. This test involved the adults who responded to
the first test, together with anyone else living in the household at the time of the second interview.
The main aims of the second test were to:
• provide indicative overall panel and longitudinal response rates
• trial the asset questions
• assess the respondent load
• trial interviewing using data from the first wave of interviews
• further trial performance of laptops and accessories and proposed field procedures
• provide data for testing database design
• provide more information to estimate costs for a full survey
8. Lessons learnt from the LSID development
The experiences gained in developing the instruments for these field tests have highlighted many areas
where improvements can be made. Some changes can be easily implemented others will take longer and
require more research. Key considerations include fostering better communication between all the parties
involved in the development more effective and more disciplined development methods and improved
project management.
The question designers clearly need to understand what it is possible to do with Blaise. The challenge
involved in creating such a complex questionnaire was more than enough for them to deal with at the start.
Learning to write Blaise code at that stage may have been counter productive. Now there is a much keener
appreciation of the benefits of questionnaire designers developing their own Blaise programs. A recent
Blaise training course for the designers was enthusiastically received. Understanding what is involved in
converting flowcharts into a Blaise program will at the very least improve the communication with the
programmers.
The programmers and questionnaire designers could benefit from a working environment more conducive
to project work. There is a need for places where all the developers can meet to discuss issues, and also
quiet areas where they can concentrate on writing flowcharts or code. Another idea is to have at least two
Blaise developers in the team. This would allow one to be the main contact and be available to consult,
propose alternatives, to understand the topic specifications and learn about questionnaire design. The
other programmer would also be involved but able to concentrate on writing code as well. The main
developer could be shared amongst several projects and act as a 'mentor' for less experienced
programmers. This arrangement also ensures there are knowledgeable backup staff available.
Flowcharts have proved to be an excellent communication and documentation tool. They successfully
moved the designers out of the mode of creating paper questionnaires and provided a common reference
point understood by both technical and non-technical staff. There is scope now to work towards refining the
way in which flowcharts are used. Current flowcharts only represent the interview, and do not include all
the programming elements. Ways to represent some design aspects, such as tables, need to be worked
out. Other items, such as the field identifiers and types need to be included. This information would help
with generating code, testing edits, creating derivations and with resolving interviewer problems. Spell
checking and editing to get the question texts accurate and finalised earlier is another area where attention
is required. More sophisticated flowcharting packages are being evaluated. These may allow additional
fields to be specified and extracted.
For large projects formal methods of documentation, change control and program version control are
necessary. Informal communication can mean systematic and or documented outcomes are not generated.
For example, written amendments are preferable to asking for changes via phone calls. The challenges for
those who will have to maintain the instrument in the future need to be considered. Implementing a more
formal change control process to keep track of questionnaire amendments and any consequential impacts
on other questions is a priority.
A repository, where question specifications can be documented and re-used, is an attractive proposition.
Initially a simple Lotus Notes database was set-up. This was not used due to the overheads of capturing all
the specifications and a perception that it did not provide any utility. For a repository to be useful has to be
kept up to date with any changes. Ideally it would be linked to the flowchart specifications and allow the
extraction of information for use by other programs. Providing different users with views of the
specifications tailored to their needs is likely to be an incentive for them to put in the required effort.
Using a repository could also facilitate better change control processes. If designers specified and
maintained their question texts in such a database it would hopefully lead to greater efficiency and
consistency. Various staff could contribute different aspects of the specification. For example the Blaise
programmer might determine the field identifiers, while the question designers define the texts and field
types. Better procedures for program version control and for carrying out testing could also be supported
with a repository. Linking flowcharts with a specification repository would eliminate duplication and save a
considerable amount of work. How flowcharting tools can be integrated with a repository is being
investigated.
Cameleon's potential to access and manipulate Blaise metadata was not fully exploited. New uses for the
Blaise metadata could be developed especially when the Blaise language is understood and used by all
the designers. Setting up scripts to create database tables for the LSID is only a small example of how
Cameleon could be employed.
The instrument development sequence used in this project, where flowcharts were prepared and then
programmed in Blaise, is somewhat cumbersome and caused delays. Other approaches are being
considered. For example the question designers could write their own prototype Blaise code. The
programmers could then focus on integrating modules and look after quality management issues. With
appropriate training and support it should be quite straightforward for questionnaire designers to set-up and
maintain simple prototype questionnaires themselves. Team members could then carry out cognitive
testing using Blaise and review questions at a much earlier stage.
Having the ability to quickly document, build and demonstrate questionnaire proposals would have helped
make the LSID development more effective. Running programs on a laptop as early as possible also
ensures there is time to understand and address any issues associated with the laptop environment. It
could be useful to include some fields in these prototype questionnaires to document feedback on the
proposed questions. Finalising questionnaire design earlier will reduce rework and the overheads
associated with making changes after the whole instrument is constructed.
The facility in Blaise to add descriptive information within the field definition caught the attention of the
questionnaire developers during their training course. They were quick to see the potential to record
information relating to the question development process, such as when changes were made and by
whom. Cameleon could be used to extract and manipulate these descriptions.
The development process involves refining the detailed topic specifications into a questionnaire.
Establishing a high level flowchart at the start would give all the team a sense of the whole questionnaire
much earlier in the development process. Clarifying the big picture first and then working into the detail
later provides a sense of direction and ensures the overall structure is considered.
A corresponding high level Blaise program structure is also needed. Now that the development of largescale electronic questionnaires is an ongoing activity in Statistics New Zealand, the impetus (and funding)
to standardise and reuse existing code has increased. Many of our household surveys have a common
high level structure and a standard Blaise 'template' is planned to formalise this. The template instrument
would include the standard survey management questions such as the scope and coverage rules etc.
Survey specific modules could then simply be added as required.
All the developers need to work together to initially plan the high level structure of the survey. Deciding
which related groups of questions fit together into modules a fairly early stage would help with organising
and scheduling the development work. Modules could then be developed and tested as they are detailed.
A modular building block approach implies that related sets of questions, such as income or house
ownership, are specified, written and tested discretely. This contrasts with the LSID development where
large parts of the questionnaire were specified, before any programming started. Edits were added even
later and testing only commenced once the whole instrument was completed. This process meant there
was less opportunity to revise and correct the instruments once they were built.
Edits, and any associated questions to assist in resolving edit failures, need to be designed in from the
beginning instead of at the end of the development sequence. Adding new questions and edits or changing
the sequence or routing of questions often involves consequential changes. All of these things naturally
increase the amount of rechecking required and contribute to the long development times. Developing and
testing edits earlier in the development cycle would reduce the number of last minute changes.
Many of the scheduling and change control difficulties are typical project management issues. Managing
deadlines, prioritising and making trade-offs were tough decisions especially when they involved
compromises that made it difficult to bring the programs into line with what was wanted. Decisions often
took a long time to be made.
Ensuring target dates are met helps to minimise consequential impacts. The lack of previous benchmarks
made it difficult to estimate the time it would take to develop and test the instruments. More time and
resources were needed especially for the cognitive and usability testing. It would also be beneficial to have
cognitive testing completed before serious programming is undertaken. Quicker turnaround of changes
along with a formal confirmation of programming interpretation before module testing will reduce some of
the larger development iterations. Given the benefit of our experiences more realistic timeframes to
complete validation can be scheduled in future. Combined with better planning and training, more
systematic overall validation will be possible as well.
9 Conclusions
Overall this project has been a success. The skills of the LSID team members along with their ability to
work together and deal with the stresses involved has contributed greatly to the positive outcome.
Everyone focused on what they could improve, rather than looking at what others might do better.
Blaise 4 Windows performed superbly. It met all of the challenges that come with such a large and complex
interview. Very few Blaise programming issues arose during the development and the instruments worked
flawlessly in the field.
The two field tests involved in the LSID research have been extremely valuable in helping build our
capacity to develop Blaise instruments. Managers have come to understand and appreciate the
requirements and benefits of CAPI in a very tangible way, without having to deal with the risks usually
associated with implementing production CAI surveys. These experiences have favourably influenced the
direction of CAI within Statistics New Zealand. Funding and resources have recently been allocated to
implement two production CAI surveys during the 2000/2001 financial year.
In any development, complexity initially arises through the tendency to make use of all the available
options. This seems to be an inevitable part of learning. With experience it becomes easier to recognise
what can be left out and over time adopt simpler approaches. New systems and better processes will also
assist.
Everybody involved has learnt a lot. While some have commented this project 'has taken years off their life'
generally there has been a high level of personal satisfaction with what has been achieved. A number of
staff who worked on this project, have now rotated into other CAI developments where their experience will
be of much benefit. The knowledge gained over the past couple of years will prove to be very valuable for
future developments.
(1) IBUG Newsletter March 1995 'Blaising the Paper Route - A method for converting paper questionnaires to
Blaise ' describes the 'State Rules' technique.
Data Collection in Two Phase and Multi Centre Health Survey
Vesa Kuusela, Statistics Finland
Vesa Tanskanen, National Public Health Institute
Esa Virtala, National Public Health Institute
Introduction
National Public Health Institute (NPHI), Social Insurance Institute (SII), and Statistics Finland
(SF) are undertaking a large-scale health survey in Finland. The major aim of the survey is to
collect information about the health and functional ability, and about the need for care,
rehabilitation and help. Additional aims are to find out the change of populations health status,
functional ability and health needs; to estimate the future trends of health and need for services
and social security; to find out cross-sectional associations between living conditions and living
habits and health; and also to develop the health survey methods. An ultimate goal is to estimate
what will be the use of health services and medicines, and the need for care, help and
rehabilitation in the future.
The survey is composed of two consecutive phases. The first phase (autumn, 2000) will be a
face-to-face health interview carried out by the interviewers of SF. The second phase will be an
extensive health examination. Specialists having medical training will carry out the health
examination in five similar mobile clinics. Clinics will move several times during the second
phase in order to keep the distances reasonable for the examinees. Altogether, the clinics stop at
80 sites and the duration of a stay varies from two days to two weeks. Accordingly, each clinic
moves more than fifteen times.
The primary reason to have two separate phases was to split the respondent burden in two smaller
pieces. The health interview takes 60 minutes in the average and the health examination about
three hours. Additionally, it is hoped that the use of professional interviewers in the first phase
would reduce non-response. Interviewers also agree with the respondent the time when he or she
goes to the mobile clinic for the health examination. It is important part of the survey, because
the clinics stay only a few days on one site.
Contents of the survey
The purpose of the survey is to collect a comprehensive set of information concerning the health
and living conditions of the adult population living in Finland. Individual based stratified twostage cluster sample of 10 000 people will be drawn from the Population Registry. Municipalities
or clusters of municipalities are the first stage sampling units.
The first interview at respondent’s home is focussed mainly on living conditions, working
conditions and living habits. Also, some general aspects of health, like experienced symptoms,
and use of health services and medicines will be covered.
In the clinical health examinations, respondent’s risk and protective factors, as well as symptoms
and signs will be explored in an interview. Functional and working ability will be determined by
specific tests accompanied by an interview. The major diseases and disorders, whose prevalence
will be found, are cardio-vascular, respiratory, musculoskeletal, mental health, and oral health
and dental diseases. Mental health examination is a psychiatric interview. Specific equipment are
needed in the examinations of the other diseases and disorders (e.g. EKG, spirometer, dental xray).
Data collection and data flow
The first phase is planned to last about six months and data collection will be carried out by the
standard CAPI system of SF. However, the second phase begins soon after the beginning the first
phase. Time difference between the interview and the health examination will be approximately
two or three weeks. Consequently, the two data collection phases overlap and some parts of the
health interview will be needed as background information in the health examination. Therefore,
the interview data have to be transferred the mobile clinics soon after the interview.
At SF, the Blaise forms will be assembled in a file or files. The files will be delivered to the
server at NPHI, from where they will be distributed to mobile clinics via modems and mobile
phones. Mobile clinics will receive also the appointments interviewers have agreed with the
respondents.
Statistics
Finland
National
Health
Institute
5
4
3
2
Clinic 1
The results of the completed examinations will be sent to NPHI only a few days after the
examinations, without any further processing. Data processing and analysis mainly takes place
at NPHI. Also, a standard health report will be printed for each examinee, a physician looks into
it, and finally the report will be sent to the examinee.
Data collection in mobile clinics
In every clinic, specialists like physicians, dentists, psychologists, and nurses will carry out
several different interviews, measurements and examinations. Each clinic will have altogether
12 different measurement or interview rooms. Most of the data will be entered by Blaise
instruments either directly or typing in the results from the measurement devices. Therefore, in
all examination rooms at a clinic will be a workstation that has all the necessary Blaise
questionnaires, and access to database composed of sample data and parts of the health interview.
For some measurements, e.g. functional capacity, there will be two similar examination rooms
enabling parallel examinations.
The hardware for the clinics is designed so that moving the installation from one place to another
is easy. Therefore, all workstations will be similar laptops, which are connected with a wireless
network to the local server. Also the servers are laptops. Each laptop needs only a PCIMCI card
by which it can be connected to network. Because of this installation, the workstations may be
moved freely in the range of some 50 meters from the server, i.e. in a circle whose diameter is
100 meters (nearly 8000 m2). Each server has a modem connected to a mobile phone for
communication with the server at NPHI central office in Helsinki. The operating system will be
Windows NT 4.0 WS in workstations and Windows NT 4.0 Server in servers.
Identification
The health examination sets new demands for the identification of subject data. For instance, bar
code labels are needed for the blood and urine samples. In the clinic each respondent needs some
30 identification labels to be attached on sample tubes and on paper forms. The problem is that
it is not known early enough in which of the five moving clinics he or she will be examined.
Therefore, the labels cannot be printed for him or her in advance.
The standard identification key of SF will be used in the health interview at respondent’s home.
However, using the original identification keys for the identification in the health examination
had been difficult to arrange and error prone in any case. Therefore, each clinic will have several
sheets of labels with new identification keys. Before the opening interview at the mobile clinic,
respondent gets the first available identification. In practice that is a sheet with the labels. The
new and the original identifications will be linked together in the opening interview, and only the
new identification key will be used later.
Files structure
Most the data will be stored directly or indirectly by Blaise instruments. That is, there will be no
paper forms for most of the measurements. Therefore the collected data have to be secured in
many ways, including backup copies, encryption and also fastening computers on tables. The
servers will be backed up (continuously) in Iomega ZIP stations.
Some common files like the sample file and some part of the health interview, will be stored in
the server so that they may accessed from all workstations. Other data files will be stored
primarily in the local workstations. A few times a day, the local (Blaise) files will be appended
to the main data files in the servers, however. Every time the clinic moves from one site to
another, the data files will be renamed and copied NPHI main server. At the next site, data will
be stored in a new (empty) file.
Technically it was possible to have all data files on the server only. It is not known yet what will
be the local circumstances and therefore, how reliable the network will be. Therefore, at least in
the pilots files will be stored locally on the workstations.
Conclusions
Computer assisted data collection is commonplace in professional survey organizations but the
possibilities computers bring in the data collection are new for specialists in many areas. For
instance, health surveys have a very long history using PAPI. However, health surveys are not
repeated very often and therefore, the recent development in data collection methods is not well
known among the health survey professionals. Methodologically SF’s impact, apart from the
sampling expertise, has been to introduce computer assisted data collection methods in a health
survey. Partly the ease of authoring made it possible to use Blaise (and CAI) for the data
collection.
CAI introduces some new features, like the checking mechanism and the possibility to apply
computer assisted coding, which reduce substantially the need of data editing. Previously, data
editing after the actual data collection has been a very time consuming task in health surveys.
Now, data files are ready for analysis much faster. However, it has been difficult to convince the
researchers of how much in advance the data entry instruments should be ready.
In theory, data entry had been possible also with other types of software, e.g. database systems,
but probably the designing process of data entry forms had become much more laborious.
Though the other system may had made easier the design of the other parts of the information
system. A clinical health examination involves several other aspects than only interviews, which
should be incorporated in the data collection plan, which are more difficult to accomplish by
Blaise system.
Only the first, fairly small pilot (without telecommunications) has been undertaken up to this
point. The second, more comprehensive pilot study will take place in May, 2000. As the first
experience, the computer assisted data collection was considered successful. The specialists who
did the data entry found it very convenient, and at least as good a method as using paper forms,
in any case. Some of the comments were praising.
Session 3
Blaise and the Internet
Internet assisted coding
Sylvia von Wrisberg, Bavarian State Bureau
Blaise Internet Services put to the test: Websurfing the Construction Industry
Hans Wings and Marko Roos, CBS
The use XML in a Blaise environment
Jelke Bethlehem, Lon Hofman, CBS
The Internet, Blaise and a representative sample
Dirk Sikkel, Adriaan Hoogendoorn, Bas Weerman
Internet Assisted Coding
Thesaurus-based Software Solution for the Support of Coding Acitivities as
an Example of NACE
Sylvia von Wrisberg
Bavarian State Bureau for Statistics and Data Processing
80288 Munich, Germany
email:[email protected]
1. Introduction
A basic prerequisite for statistical work is the existence of a systematic to order available data so that they may
be evaluated and analyzed according to the rules of statistics. Systems for classification serve as the foundation
of systematic ordering of recorded data in order to raise and prepare statistics. In the following we shall deal with
methods of classifying trade branches and goods.
-
Classifications of trade branches serve to order data which relates only to the statistical unit, that is
to say relates to only one single business or a group of trades, e.g. one company. They are the
foundation for an economically significant creation of statistics for production values, production
factors, creation of capital and financial transactions of these units.
-
Classifications of goods serve to order goods (merchandise and services) according to uniform
characteristics. They are the basis for the preparation of statistics on production, domestic trade,
consumer use, export trade and transport of these goods.
The methodology described below codes the economic data on the foundation of a thesaurus and a basic
knowledge with electronic support on the basis of a system of classification. To this end, the Bavarian State
Bureau for Statistics and Data Processing has developed the software “Classification Server” which will be
described here using the example of the trade branch systematic (NACE).
2. Coding Branches of Trade and Industry
To guarantee the comparison of economic statistics within Europe it is necessary that the trades within Europe
be classified in a uniform system. When coding industrial activities (that is the assignment of a particular class
to a data set) a numerical key is assigned on the basis of the interpretation of a verbal text in natural, colloquial
form, as an example the activity “Buying of wine” is given the key “51.34 Wholesale of alcoholic and other
beverages”.
The foundation of trade coding is the German version of the European economic branch systematic “NACE Rev.
1” (Nomenclature générale des activités économique dans les Communautés européennes). The German form
of NACE in brief “WZ93” (Classification of trade branches 1993 Edition) refines the systematic of the European
NACE from a subdivision of 4-digits to a 5-digit code. The activity “Buying of wine”, therefore, in Germany is
given the code “51.34.3 Wholesale of wine” as a further detailing of the codes 51.34 according to the European
systematic.
On decentralized Coding in the Federal Republic of Germany
At this point we must draw attention to the federal state and administrative structure in the Federal Republic of
Germany. Throughout the Federation official statistics (“federal statistics”) are carried out in cooperation
between the Federal Bureau of Statistics and the Offices of Statistics in the sixteen federal states (lands). The
federal statistic is therefore to a large extent decentrally organized. In the framework of this division of labor, the
Federal Bureau of Statistics primarily has a coordinating function. Accordingly, it is responsible for issuing and
maintaining the classification systematic such as is represented for example by the “WZ93”. The collection of
data and its preparation by means of the classification systems up to the findings of the individual lands, are the
purview of the offices of statistics of the lands.
In this manner, the offices of statistics obtain information on registered trades (officially registered trades) from
cities and communities for the preparation of national industrial and trade statistics. According to the economic
and trade code, the establishment of a business (new registrations), the change of the place of business, any
change or expansion of a practised activity and of course the report on the closure of a business is subject to
registration. The form for business registration is at present one original and twelf carbon copies, which are
forwarded to various offices such as the Board of Trade and Industry, the Internal Revenue Service or the
officies of statistics.
Organization of Coding in the State of Bavaria
Between the years 1997 and 1999, the Bavarian Bureau of Statistics and Data Processing developed and put
into operation a system for network-supported processing of business registrations (filings for new businesses,
closures of businesses and changes in business activities) for cities and communities.
The goals of this pilot project are
•
the media-free electronic transmission of trade data to the twelf authorized offices (Board of Trade and
Industry, Chamber of Manual Trades, Internal Revenue Service, Bureau of Standards, etc.)
•
Uniform, coded data collected at its point of origin
In the frame of this project, the classification software “WZ93 Thesaurus” described here was developed which
as an independent component is of use to the statistical offices of the lands, the Federal Bureau of Statistics and
other interested administrative departments such as the Board of Trade and Industry. It supports softwaretechnically the coding activities of administrative clerks in the communities, in the offices of statistics and other
administrative offices concerned such as the Board of Trade and Industry. The previous manual codification,
which required the application in book form, is considerably reduced by the use of the software solution. The
media reference work book and CDROM are completely replaced. Another advantage in its use is that different
code results can be for the most part avoided, such as the assignment of “Production of tricycles” at one time to
“Production of toys” and another time to “Production of bicycles”.
In the ideal case, the comfortable search program offers the administrative clerk only one code on the basis of a
verbal description of an activity. If a search is unsuccessful, the program offers a list of choices and the
administrative clerk can narrow the search for the correct code step-by-step. The product is above all capable of
learning, that it is able to consider changes in economic activities which arise from the constant growth of new
businesses, e.g., “Internet Provider” and consider them online in the knowledge base.
3. Components of the system
The most important points of the software can be listed in the following main components:
•
the intelligent search
•
the learning component
•
the central arrangement
3.1 The Intelligent Search
Contrary to simple search machines which are found in a number of word processing programs, our
classification software does not employ pure character string comparison (model search) but rather an intelligent
search based on semantics. As an example, using a pure model search various, regional names for one and the
same business as "taxi" or "cab" would not be found. On the other hand, when searching for “rape”, “”drapery” or
“grapes” would also be shown which is by content absurd. Also various female or male forms like "actor" and
"actress" cannot be determined by the model search. Such common trades as “butcher” or “baker” could not be
actress
player
grey
actor
gray
sale
selling
sell
sells
motor vehicle
car
cars
car
Words with identical meanings (synonyms)
Words with various forms (declination, conjugation)
Figure 1 Thesaurus
found using a pure model search. The “baker” has for example be found under the key “15.81 Manufacture of
bread”.
The Thesaurus
The classification software described here employs a thesaurus supported technology. The basic underlying
thesaurus is an ordered and structured collection of words based on the printed edition of the WZ93 cited above.
The thesaurus recognizes synonyms and generic and semantic classes. This permits a search according to
terms which do not occur in the book version of the systematic. As an example, the words “car”, “motor vehicle”,
“auto” and “automobile” were combined into one synonym group. “Trade” are headers for “wholesale” and
“sale”. When searching for trade with “Trade of textiles” the system shows among others the possible
combinations “Wholesale of textiles” and “Retail sale of textiles”. Besides the synonyms, different spellings of
one term (“gray”, “grey”), convenient abbreviations (“ws” for “wholesale”), male and female forms (“waiter”,
“waitress”), regional differences in dialects or speech (“taxi”, “cab”) and so on are depicted. Moreover, because
of the ordering of word stems, the system is to a large extent indifferent to conjugation and declination forms
(“produce”, “production”) as well as singular and plural forms (“car”, “cars”).
Wortdatei - Thesaurus
WZ 93 - Signaturen
50.20
50.20
Synonyms
Generic term/
Basic form
VEHICLE
::
1
VEHICLE
CAR
AUTO
AUTOMOBILE
Original Word
vehicles
vehicles
50.10
50.10
1,2,3
Maintenance
Maintenanceand
andrepair
repairof
ofmotor
motor
vehicles
vehicles
2
Sale
Saleof
ofmotor
motorvehicles
vehicles
::
::
Category
SALE
SALE OF MOTOR VEHICLES
33
50.30
50.30
Sale
Saleof
ofmotor
motorvehicle
vehicleparts
partsand
and
accessories
accessories
::
::
Figure 2 Structure of the Thesaurus
A feature of the system is the word stem analysis of the search term. The words in a search term are formed by
an automatic basic analysis of the form, which is based on a morpheme dictionary.
The Search Strategy
How is the search process constructed, which scans the above illustrated thesaurus? The search strategy
employed deals with the combined process of a semantic search and the significance of a match. Thus the
software searches through the verbal text string entered, searching first for so-called stop words (“killing” words)
and eliminates them. Stop words are words which have no meaning such as “the”, “with”, “of”, “still”, etc. Then
for each word remaining in the text string, the basic word is recovered. Using this basic word form, the real
search begins, whereby the terms in a mathematical sense are combined by AND. If no match is found, an
internal search begins for single words (OR-combinations) with a resulting significance of match frequency and
match combinations.
Stop word analysis
sale of cars
basic form analysis
sale cars
text enquiry (Syn
(Syn,, Root)
Root)
sale car
weighting method
hit relationship
sale (100) car (10)
hit combination
Figure 3 Search Strategy
Advantages of the Search Strategy
The method described allows ordering colloquial and irrelevant formulations to the correct code. Should an
immediate successful search not be possible, the user can achieve a match using a step-by-step process. To do
so he can use various search methods: phonetic search, truncated search (“web*”), significance search, and-or
combinations, search within definite segments and search for key words. The system also allows entry through
the hierachical structions of the “WZ93” with which the user is led.
3.2 The Central Arrangement
From the start, the arrangement was conceived as a client/server sytem with a central server and a universal
client. To this end, the software has a convenient web surface for the user and a powerful thesaurus in the
server.
At the user’s work station, only a standard browser is requried, e.g. Netscape or an Internet Explorer, in order to
work with the system. Using a mask which the client downloads from the server, the search query can be
entered and then sent via HTTP protocol to the server. The search takes place on the central server in the
Bavarian State Bureau of Statistics and Data Processing. For this reason, no software must be delivered,
installed or maintained on the user’s PC. For this reason, the system is well qualified for employment in Internet
and Intranets, which already exist in the offices of statistics in the lands or which are now being developed.
Advantages of a Central Arrangement
In the last years we have experienced a dynamic boom in the economy. New trades and businesses are
constantly appearing, such as “Tattoo Studios”, Web-Hosting”, “Call-Center”, etc. The book form of the WZ93
cannot react quickly enough to these changes. Of course no match can be obtained with a first query using
classification software, but because of its ability to learn, the next query will result in a positive response. Using a
common central and learning data base via internet technology, the quality and the consistancy of the
classification for evaluation is quaranteed. Using a central arrangement, different orderings can for the most part
be avoided. The problems in ordering described above- the activity “production of tricycles” to “toys” or to
“bicycles” is solved by entering the key work “tricycle” into the common, central data base (please refer to the
next section).
3.1 The Learning Component
The learning component of the system comprise on the one hand the analysis of the search strategy of the
user’s query and on the other hand a maintenance component with which new terms can be added online to the
data base.
Here the advantage of a central arrangement, which is an essential characteristic of the system, is particularly
obvious. Maintenance takes place at one point, namely at the central server in the Bavarian State Bureau of
Statistics and Data Processing. Changes in the knowledge base are immediately available to all users.
If the system does not find a term, this is recorded in the database. A specialised coder authorized for this
purpose in the Bureau of Statistics can give the term a code and add it to the thesaurus of the data base. This
can also take place online via the web interface.
Example:
A search is made for the trade “Internet Provider”. The term cannot be found in either the printed version
or the data base. The specialist determines that the trade can be ordered under 72.60.2 “Other
computer related activities”. The specialist can enter the new term as an addition to the commentary of
the code. With a new search for “Internet Provider” an immediate match is shown with 72.60.2.
Just as additions are made, so can synonyms be entered into the knowledge base.
Example:
A search is made for “Retail sale of cars”. The term cannot be found. The term doesn't have to be found
neither in the printed version nor in the data base. The specialised coder determines that the trade can
be found under “Retail sale of vehicles”. The specialist can now add “car” as a synonym to “vehicles”. A
new search for “Retail sale of cars” will now lead to a correct match “Retail sale of vehicles”. With the
synonym entry a search for “Wholesale of cars” would also lead to the correct match “Wholesale of
vehicles”.
An addition set up in this way can be checked parallel online by a specialist of the Systematics Group of the
Federal Bureau of Statistics - that is the national level (Germany) and not the regional level (Bavaria) and if
necessary corrected or rejected. Editorial management is solely the responsibility of the Federal Bureau of
Statistics, which as described above is also responsible for contents and systematics of the “WZ93”. The
Federal Bureau of Statistics processes the recommendations of additions suggested by the lands and decides
whether a recommended term can be entered into the list of key words as a code or whether a new synonym
should be added.
The technical management of the process is solely in the hands of the Bavarian State Bureau of Statistics and
Data Processing. It maintains the software and operates the central server.
4. Application and Practical Experience
The classification software “WZ93-Thesaurus” has been successfully employed in the Bavarian government
system since 1998. In the state of Bavaria, the system is used besides the Bavarian State Office of Statistics
primarily by municipal offices for trade and commerce. Via Internet, the bureaus of statistics in the other federal
states and the German Federal Bureau of Statistics are connected nationwide.
Using this process, new paths in electronic communication and cooperation between the statistical offices of the
lands and the German Federal Bureau have been laid with the aim that all participating bureaus in the lands
work together with a single central classification server. For a long time, this failed due to poor performance of
public networks and the problem of security (access and secure servers via public nets, user authorization, etc.).
For this reason a few of the participating bureaus in the lands use their own intranet server with a local copy of
the thesaurus. In the meantime with the aid of a cryptoprogram, a secure access via the internet to the Bavarian
government net is possible so that a single central classification server can be used nationwide.
5. Performance characteristics
The existing classification server accomplishes the following performance features:
•
Possibility of a quick search for terms in connection with the trade coding and their precise ordering to
the WZ93 codes;
•
Ability to learn, e.g. the capability to enlarge the data base with new terms, synonyms, etc;
•
Ease in installing and learning to use the program;
•
Replacement of the medium “book”.
The software completely replaces the printed version ot the WZ93 systematic. More than two thousend entries
and synonyms have been added to the knowledge base in the meantime. Each week it is expanded by 40 - 50
new entries.
The accuracy rate of a match is between 80 - 90%. A qualitative good result if one considers that the users of
the system resort to using the system for difficult cases, that is when the code is not already known. At this time,
the system handles approximately two hundred queries daily. With the wide use of the above described
commercial use in Bavaria, the number of subscribers and accesses will increase obviously.
This means: With the increasing number of users, the knowledge base is expanded and automatically increases
the performance of the entire system.
6. Expansion of the System
After the basic technology described above (web-based access, search in the thesaurus with headers,
synonyms, etc.) was tested using the “WZ93”, the transfer of the technology to other classification systems no
longer presented any basic difficulty. In this way, the systematic register of goods for production statistics, 1995
Edition (abbreviated “GP95”) was conceived and added. The “GP95” is based on the European PRODCOM list
(PRODCOM = PRODuction COMmunau taire). For obvious reasons, the “GP95” and the “WZ93” because of
their related subject matter could be connected to each other so that, i.e., the successful search for a GP95 key
is supplied by the proper WZ93 key, the successful search for a WZ93 key is supplied by the proper GP95 key.
This is a real advantage for the user, which the book form cannot offer. In the meantime, frequently used key
catalogues such as nationality characteristics, local government index numbers, spelling keys, postal area codes
and many more have been entered into the system.
The classification server is being continually expanded and developed. The next project will be the addition of
the International Classification of Diseases (ICD).
Technical Environment
The classification server is available with the operating system platforms Windows NT Server 4.0 and with
various UNIX derivatives (SINIX, Sun-Solaris, HP-UX). As the database system serves ADABAS with the
programming language NATURAL from the German company Software AG.
The classification software described is encapsulated completely. The software can be called up by NATURAL
applications using a native interface. JAVA applications recognise the interface as an instance of a java object
and integrate the thesaurus in this way.
To enable entrance for various heterogeneous applications within the internet to the “classification server”, the
exchange of XML messages using the “HTTP-POST” protocol is in preparation
.
Blaise Internet Services put to the test:
Web-surveying the construction industry
MARKO ROOS, HANS WINGS
STATISTICS NETHERLANDS1
1. Introduction
The rapid growth of the Internet offers great possibilities in the field of data-collection, as it is easier, faster, and cheaper to
send questionnaires to respondents, and to communicate with respondents via the Internet than using ‘conventional’ methods.
Statistics Netherlands began experimenting with data-collection via the Internet on a small scale. One experiment, for example,
used a mixed-mode design comprising both an ASCII-questionnaire sent by e-mail and a paper version. Despite the fact that a
lot of respondents commented on the rather antiquated layout of the ASCII-questionnaire, the results of this experiment were
very promising.
Meanwhile the Blaise developers had been working on Blaise Internet Services (Blaise IS), a set of tools to carry out web
surveys. The Statistical Department of the Construction Industry was prepared to participate in an experiment with Blaise IS
and transformed their survey for the construction industry (sent each month to a panel of companies) into an electronic
questionnaire. The method used was ‘mixed mode’ because respondents could choose between either continuing receiving the
paper questionnaire or receiving the electronic version of the questionnaire.
The first part of this paper describes the methodology and the results of the experiment. The second part of the paper will be a
more general discussion concerning Web-based interviewing and the use of Blaise IS.
2. Method
All respondents are approached by e-mail. The advantage of e-mail is that it is fast, cheap and that e-mails can be personalised.
One can send the respondent information and requests anytime it is thought to be necessary and the respondent can react to the
e-mail whenever he wants. E-mail offers a pro-active way of communication with the respondent.
In the experiment respondents could choose between two ways to complete the questionnaire: the off-line mode or the on-line
mode. Respondents who indicated they were not able to ‘surf’ the Internet were sent an e-mail with an ASCII-questionnaire.
In off-line (or scroll-based) mode the respondent opens an HTML-file which comes as an attachment to the e-mail, completes
the questionnaire, and presses the submit button. When the submit button is pressed, the browser connects to the Internet
address of the Blaise IS server and, after having asked for a username and a password, transmits the data to the database at the
Blaise IS server. In off-line mode the respondent can complete the questionnaire without worrying about the cost of being
connected to the Internet, but this mode has the disadvantage that the respondent can only see one single HTML-page in his
browser. It is not possible, for example, to route through questions or to perform consistency checks (although range checks
can be done). Therefore, in off-line mode, the questionnaire must be simple, short, and straightforward.
In on-line (or screen-based) mode the respondent establishes a continuous connection with the Blaise IS server via the Internet.
In the content of the e-mail the respondent has received an Internet address (URL) with the location of the questionnaire. The
respondent clicks on the hyperlink representing the URL, fills in a username and password, and subsequently the questions are
presented on the screen.
In on-line mode questionnaires can be more elaborate than in off-line mode, because it is possible to build in checks and
routings.
The third way is to send the respondent an e-mail with an ASCII-questionnaire enclosed in the body text of the e-mail. The
respondent answers the questions in the e-mail by filling in ‘x’ between the brackets of the answer-alternatives. When the email is sent back, the answers to the questions are filtered out automatically using a Manipula-setup. This mode can be used by
anyone who has access to e-mail-facilities. No sophisticated programs are required, and the cost of being connected to the
Internet is low. The questionnaire is also very easy to design.
1
The views expressed in this paper are those of the authors and do not necessarily reflect the policies of Statistics Netherlands.
Table 1. Advantages and disadvantages of the used methods
Costs Respondents
Routing
Checks
Layout
‘Surfing’ obligatory?
Off-line
++
+
+/Yes
On-line
-++
++
+
Yes
ASCII
++
---No
The e-mail-addresses of the respondents2 were collected and those were used to send the respondents their individualised emails. The e-mail-addresses were entered in a database by data-typists and were visually checked for errors by project
members. In case of doubt the respondents were called to check whether their e-mail-addresses were registered correctly.
The e-mails that were sent to the respondents who could surf consisted of:
• An introductory note,
• The respondent’s identification-number,
• The Internet address of the on-line questionnaire as a hyperlink,
• An attachment with the HTML file for the off-line questionnaire, containing four questions, and some additional questions
about the experiment itself,
• An attachment with the results of the latest survey, and
• A section discussing problems with both modes.
The e-mails that were sent to the respondents who could not surf consisted only of the ASCII-questionnaire as part of the body
text of the e-mail.
Sending individualised e-mails in large numbers.
It would be very time-consuming (and therefore inefficient) to manually write and send all e-mails to the respondents. There
are some mail merge programs (e.g. Word), but none off them is really capable of making individualised e-mails with
attachments. At Statistics Netherlands we came up with a system to do just that. With this system multiple attachments can be
enclosed and the body text of the e-mail itself can be individualised (i.e. a unique identification-number). It is even possible to
send individualised attachments. This last feature can be ideal for HTML-files containing a hidden field with the identificationnumber.
Registration and handling of problems
One of the goals of the experiment was to investigate problems that arise with this mode of surveying. Both the respondent and
researchers can experience problems with sending, receiving, reading and filling in the questionnaires. To keep count of
possible problems a special problem-database was created. This database served two purposes. The first purpose was to record
all problems encountered so that in a next phase those problems could be anticipated. The second purpose was to keep track of
the respondents that had not been able to send in their data because of the problems they encountered.
Confirmation of receipt
Once all the questions were received by the Blaise IS-server, an HTML-page with a confirmation of receipt was sent to the
browser of the respondent. It is also possible to automatically generate a web page with an outline of the answers of the
respondent. In this phase we chose to only send the confirmation of receipt and to thank the respondent for his co-operation. In
the near future we will include respondent-specific information with the receipt-confirmation.
Processing incoming data
As mentioned before, once the respondent presses the submit button, the data is transmitted to the Blaise IS server and stored
in the corresponding Blaise-database. For this experiment there were two databases on the server: one for the on-line-mode and
one for the off-line-mode.
The identification-number that respondents had to fill in was used as primary key. At a specific point in time (e.g. at midnight)
the databases were emptied and the content was sent to the project group by e-mail. The databases were then extracted from
the e-mail and transformed into the desired format. The statistical data were sent to the Statistical Department and the
administration-database (receipt-date, off-line or on-line etc.) was updated.
2
All respondents were participants in an already existing panel. The respondents were invited to take part in the experiment using a form which was enclosed
in the paper questionnaire. Questions asked were for willingness to participate, their e-mail address, and their ability to surf the Internet. The respondents were
then excluded from the normal (paper) process. The responsibility for the response behaviour of those respondents was passed on to the project group.
One of the problems that can happen with the on-line-mode was that if an error occurs during the answering of the questions
(for example if the respondent closes the questionnaire unintentionally), the field in the database with the primary key already
has been filled. If the respondent then tries to resume answering the questionnaire, he receives the message ‘key already
exists’. In the problem section in the body text of the e-mail the respondent was told what to do in such a situation.
The Blaise IS server also recorded extra information like browsers and operating systems used by the respondents.
Unfortunately it was not possible to link this data directly to a respondent.
Reminder
One of the advantages of e-mail is that it is very easy and cheap to send messages to the respondents. This is also true for the
dispatch of reminders. The survey administration-database kept track of the responses, and with the mail merge programme it
is relatively easy to send e-mails to selections of respondents based on information stored in that database. With the statistical
department a date for sending the reminders was set (similar to the date the Statistical Department began sending their
reminders).
Of course it is possible that the respondent is not able to return his answers because of technical problems. We can not expect
the respondent to take the trouble of reporting those problems himself. The project group decided not to send a second e-mailreminder, but to actually call the respondent to see whether he was experiencing problems with sending the data. In this way
we had an extra source of information regarding the used method.
3. Results
3.1. Response
Response to recruitment
The sample-size of the panel of the construction-industry is 1500. 642 respondents replied to the recruitment letter of which
188 were willing and able to participate in the experiment. 149 of the 188 respondents were able to surf the Internet and 39
could only participate with the experiment via e-mail. Some 3% of the respondents who did react were able to participate but
were not willing to do so. Those respondents and a small number of companies who did not send back the recruitment letter
were called back and asked for the reasons why they did not want to participate. Reasons for not participating were mainly
unfamiliarity with the Internet and the fact that the internet-PC was not the workplace-PC (making participating more laborious
for the respondent). Other reasons were that respondents preferred the paper version because it is more ‘visible’ or ‘tangible’
and because e-mail-facilities were not available.
Processing of the e-mail-addresses
The e-mail-addresses were manually entered into a database. From earlier experiences we learned that this process is error
prone. For this reason all e-mail-addresses where visually checked for mistakes by some experienced people. This resulted in
some 40 corrected e-mail-addresses. However, one cannot make sure that all e-mail addresses are correct. Two weeks before
the actual sending of the questionnaire an announcement letter was sent to all respondents by e-mail. Of those e-mails 24 were
returned as a ‘bad delivery’. Fortunately one can tell by the nature of the ‘bad delivery’ what part of the address is wrong.
Either the person in front of the ‘@’-sign is not known (resulting in an error-message from the mail-provider) or the mailprovider is spelled wrong (e.g. hotmal.com), resulting in an error-message from the mail server from which you sent the e-mail
messages in the first place.
Despite of that, the correction of the e-mail-addresses took a lot of time; error-messages had to be read, suggestions for
corrections had to be made and tried out and in some cases respondents had to be called. When respondents were called, they
were asked to send an e-mail to the mailbox used by the project group, so that no more mistakes were possible.
In the end 2 of the 188 respondents could not be reached by e-mail. Those respondents were sent a paper version of the
questionnaire.
Response in time
The e-mails were sent to the respondents the May the 3rd. At the end of June 137 of the 186 respondents had completed the
questionnaire. This response (74%) is higher than the response to the paper version at the same point in time (70%). The rate at
which the electronic questionnaires were returned during those two months varied over time (figure 1). Ten days after the emails were sent, the response came to a standstill. After the reminder was sent (15 days after the first e-mail) the response rate
climbed, but again came to a standstill after 20 days. The 25th day the reminders by telephone began, which caused a slight
increase in the response. The third event that caused a climb in response was the ‘thank-you’ e-mail, which was sent to all
participants.
EMBED
Response per mode
As mentioned before, the e-mails were sent to the respondents in three different ways. The first way was the ASCII-version for
those respondents who were not able to surf the Internet and therefore only could participate in this way. The second way was
the e-mail in which the address of the on-line questionnaire was presented first and the attachment for the off-line
questionnaire second, the third way being that the off-line-mode was presented first and the on-line-mode second. The group of
respondents that was able to surf the Internet was split into two groups and those groups were then sent the second and third
version, respectively.
Upon receiving the completed questionnaire it was possible to detect what kind of mode (off-line/ on-line) the respondent had
used. We expected that the group who had received the first version (on-line before off-line) would tend to use the on-line
version and vice versa. The results, however, indicated that there was no effect from the order in which the modes were
presented. About the same number of respondents who had received the on-line version first used the on-line-mode as the
respondents who had received the e-mail with the off-line-mode presented first. A small number of people who had trouble
sending in the off-line or on-line-mode (for example because they had indicated by mistake that they could surf the Internet)
were sent the ASCII-version of the questionnaire.
3.2. Browsers and operating systems.
The Blaise IS server is capable of recording what kind of operating system and browser the respondents are using. This
information can be very important for the further development of the Blaise IS software. It also gives an indication whether
developers can aim at users with a more sophisticated browser (for instance capable of handling Java) or still have to take into
account the users of older versions of browsers.
It turned out that most respondents (70%) use MS Internet Explorer 4.0. The remaining respondents (30%) are accounted for
by the Internet Explorer versions 3 and 5 and Netscape versions 3 and 4.
Regarding the operating systems the domination of Microsoft is also clear. 93% of the respondents (or to be more precise 93%
of the ‘hits’) use either Windows 95/98 or NT. 6% of the respondents use ‘other’ operating systems (e.g. Mac, Linux). 1% of
the users still rely on Windows 3.x.
3.3. Experiences of respondents
The first additional question asked in the questionnaire concerned the time needed to complete the questionnaire. The second
was the number of people needed. The third and most important question was whether the respondent had any suggestions
regarding the method used.
The time needed to complete the questionnaire turned out not to differ from the time needed to complete the paper version. The
average time needed for answering the four questions was nine minutes for both the paper and the electronic version. It is
possible however that it takes some time for the respondents to get used to this new electronic mode (there were even some
respondents who indicated this) and that in the future this mode will be faster compared to the paper mode.
There was also not much difference in the time needed to complete the questionnaire between the three electronic modes used.
People who used the on-line version were the fastest (8.8 minutes) and those who used the off-line-mode were slowest (9.1
minutes). Whether this had to do with the fact that being off-line is cheaper compared to being on-line is unknown.
The average number of people needed to fill in the electronic questionnaire was 1,32. This does not differ much from the
number of staff needed for the ‘paper’ mode (1,30).
3.4. Suggestions from respondents
The question for suggestions resulted in highly usable suggestions from the respondents. The suggestions differed between the
modes used.
The ASCII-questionnaire
The ASCII-form resulted, as expected, in reactions concerning the layout of the questionnaire. Respondents were somewhat
concerned that they could easily ‘edit’ the body text of the questionnaire. Also people first had to press the ‘reply’ button
before they could enter their answers which led to some confusion.
The on-line questionnaire
The on-line questionnaire also led to several suggestions. First of all respondents expected a ‘form-like’ layout of the
questionnaire. The on-line version presents one question on each HTML-page that is sent by the Blaise IS server. Respondents
expected that the electronic questionnaires would resemble the well-known order-forms that can be found throughout the
Internet or some imitation of the paper questionnaire. Respondents also indicated that it took more time to complete a
questionnaire in this mode compared to the paper mode. The average time needed to complete the on-line questionnaire did not
support this reaction, but it is conceivable that pressing the ‘submit’ button and waiting for the next screen with the next
question may appear to be very time-consuming.
Another remark concerned the lack of an option to make a hard copy of the questions and the answers that were filled in by the
respondents. Because of the one-question-a-page approach the respondents do not have an overview of the answers given and
apparently that is what they want.
Finally respondents complained about the fact that they did not know what the relevant period was for the questionnaire.
The off-line questionnaire
The suggestions regarding the off-line questionnaire mainly concerned some operational problems. Similar to the on-line
questionnaire respondents could not see the month they had to report about. A very small number of respondents (3) had
problems connecting to the Blaise IS server, and one respondent reported that his browser had security problems while
connecting to the Blaise IS server.
Finally some people wanted to save their answers, which is not possible with the current browsers.
3.5. Problems of and with respondents
Not only the questionnaires resulted in reactions of respondents. Respondents with questions or reactions regarding the method
used, sometimes contacted members of the project group by telephone.
During the phase in which respondents were called to remind them they had to return their answers they were also asked
whether the respondent had experienced problems with the use of the electronic questionnaires. Those remarks were
systematically registered and assessed by the members of the project group and were very useful.
The first day after sending the e-mails, respondents contacted us saying that they could not log on to the Blaise IS-server for
both the off-line as well as the on-line-mode. Respondents received an ‘authorisation failure’ on their screen and did not get
access to the Blaise IS server. Respondents were also pretty sure they had used the correct password. It became apparent that
the username and password on the Blaise IS server are case-sensitive. The respondents had received their username and
password in capitals and the server only accepted lowercase letters. In the reminder we informed the respondents who had not
sent in the answers yet, that the username and password had to be typed in lowercase.
A small number (8) of respondents did send their off-line (HTML-) questionnaire back to us via e-mail. A problem that can
occur is that when people send in an HTML-file containing fields by e-mail, they think that the fields that they send are filled
with their answers. Unfortunately this is not the case. Anything a respondent enters in a field of an HTML-file is lost when it
is saved or when it is sent by e-mail. So an e-mail is received from a respondent with an empty HTML-questionnaire.
It is not exactly known why HTML-files are sent in by e-mail. Basically, when a respondent hits the ‘submit’ button, the
browser looks for the Blaise IS server and when it is found the answers are put into the database of the server. There is no
intervention of or interference with any e-mail facilities. The reason of the problem might be that respondents who indicated
they could ‘surf the Internet’ in reality were only able to send or receive e-mails. When the (Internet) browser fails to connect
to the Internet the respondent may decide to send in the HTML-file using e-mail. However, the respondents we called indicated
that they had not done such a thing. So the reason for this problem is not exactly known.
The name of the contact person of the company was not mentioned in the e-mail. The reason for this was that the name was not
mentioned in the paper questionnaire either and not all names in the database were in a very usable format. Not mentioning the
name of the contact person resulted in problems. Some e-mail-addresses are very general (although not more general as a ‘reallife address’). Addresses like info@kocakola are probably read by more than one person and not all of them are qualified or
willing to fill in a CBS-questionnaire. Some e-mails were returned with the question for which person this e-mail was intended.
When respondents were called to remind them of the questionnaire some of them with a more general e-mail address (like
info@… or sales@…) even indicated that they had never seen the e-mail.
Some respondents indicated that they had had some technical problems. Those problems mainly concerned either their Internet
service provider or their own internet-infrastructure. It is obvious that a growing number of people is actively switching its
uses of Internet (from a passive to a more active role) and one can not escape the fact that sending the e-mails can take place
during such a transition period.
One of the main reasons why people were late in sending the answers to the questions was that the data that were asked were
not yet known. The questions concerned the month of April and were of a specific nature. The questionnaires were sent May
3rd and the reminder May 17th. Respondents indicated that they did not have not the relevant data available on such a short
notice. In the future it may be possible to send respondents a reminder on the date they have the requested information
available (which can be based for example on response-dates from the last two months).
Telephone contact with non-respondents showed that a small number of people considered the method to be too laborious.
They indicated that they wanted to receive the paper version again and that they had no interest in this way of electronic datacollection. Another reason for respondents to switch back to the paper version was that their computer-infrastructure was not
ready for this way of completing questionnaires yet. In total some 13 respondents indicated that they wanted to receive a paper
version of the questionnaire again instead of an electronic one.
Electronic non-response vs. paper non-response
As mentioned earlier the response of the electronic questionnaire was slightly higher compared to the paper version. There was
some concern, however, that this group consisted of respondents that had a lower percentage of non-response anyway because
they were intrinsically more motivated. After all, they had signed up for the experiment. Fortunately the response-percentages
from the past did not indicate this. In the past this group had a response-rate after two months of 73%. This is even slightly
lower than the 74% the electronic method yielded.
Operational problems
It turned out that there were very few operational problems at Statistics Netherlands. Most of the work concerned the
correction of the e-mail-addresses. The processing of the incoming data also took some time, but there were no real problems
while processing the data. The whole process can easily be automated after which the magical ‘one press on the button’ will do
the job.
4. Conclusions and recommendations
This experiment aimed at four aspects of electronic data-collection with the use of Blaise IS and e-mail. Those four aspects
were getting the survey to the respondent, experiences of the respondents with the web survey, response-behaviour and the
handling of the incoming electronic data.
Generally speaking one can say that electronic data-collection with the use of e-mail and Blaise IS works very well. With email the respondent can receive the questionnaire in a pro-active way. Respondents do not have many or serious problems with
the electronic questionnaires, the response is somewhat higher and faster and the data can easily be processed (with ‘one click
on a button’) into the database of the Statistical Department.
Nevertheless some problems became apparent and some aspects of the methodology used certainly could be improved. These
aspects and problems will be assessed here and some recommendations will be made.
Getting the survey to the respondent
Originally the e-mail-addresses as entered into the system were incorrect in one-third of the cases. Entering and improving email-addresses is very laborious. This can be averted by asking the respondents (on a paper questionnaire) to send an e-mail to
the researchers, who then directly import this e-mail-address into the survey administration database.
The e-mail is not always delivered to the right person. E-mail-addresses such as ‘info@… or sales@…’ are not really suitable
for getting the right e-mail to the correct person. In such cases it is advisable to merge the name of the contact person into the
e-mail.
Experiences of the respondents with the electronic questionnaires
Some people made comments on the layout of the ASCII-questionnaire (as expected). People who received the ASCIIquestionnaire are not able to surf the Internet, so there are limits to what can be displayed on the screen of the respondent. In
the future those respondents may be sent a more sophisticated questionnaire via e-mail.
Respondents made comments on the layout of the on-line questionnaire. They expected a form-like questionnaire and because
of the one-question-a-page approach it also may look like it is time-consuming.
Users of the off-line questionnaire had no comments regarding the layout. The off-line questionnaire had some operational
problems however. Some of the questionnaires were sent back via e-mail, resulting in lost answers. Respondents had to be
called to request for another attempt (using the on-line or ASCII-mode).
Some respondents considered the method used more laborious than the paper version. Probably this is related to the fact that
not all respondents are accustomed with the use of the Internet. Especially with the smaller companies in the construction
industry it is not very likely that the respondent spends a complete day behind a computer-screen. Those respondents have to
get more used to the use of electronic questionnaires. Some respondents do not have an ‘internet-PC’ readily available on their
desk and will have to go to another desk in the office, probably have to locate the person that is capable of operating the
internet-PC and subsequently look for the relevant data. In such cases remarks regarding the time used are not surprising.
Response behaviour of respondents
The more contact-moments with the respondent, the higher the response. The response rose after each e-mail that was sent to
the respondent. Even the message that the server would be shut down (after three months) resulted in response. Of course one
does not want to saturate the respondent with e-mails, but a well-planned reminder strategy can result in higher response rates.
Frequent reminders are advisable because e-mails have a tendency to ‘sink down’ from the screen (because more e-mails are
received by the respondent and the e-mail-program can only display a limited number of e-mails).
In the reminder sent via e-mail no HTML-questionnaire or on-line-address was included. If the respondent has accidentally
deleted his e-mail, he is not able to send in the answers to the questionnaire. Sending a reminder with questionnaire offers one
opportunity less for non-response.
Processing the incoming data
Data from the ASCII-questionnaires had to be entered manually into a Blaise-database. From earlier experiments we know that
this can be done automatically.
Technically speaking it is possible to process the data of the on-line- and off-line questionnaire with ‘a single click on the
button’. Both administrative and statistical data can be automatically updated. This offers great opportunities for fast and
efficient data processing. No serious problems occurred regarding the integration of paper and electronic data. Administrative
data for the paper and electronic mode could also be tuned very well.
To summarise, with a growing number of respondents using the Internet, data-collection via the Internet is becoming more
interesting every month. Electronic data collection via the Internet offers the possibility of faster and more efficient
communication with the respondent, as compared to the more traditional methods. A mixed-mode approach seems to be the
best way to start collecting data via the Internet.
With Blaise IS it is possible to convert existing questionnaires into Internet questionnaires. Sending those questionnaires via email as an attachment or as an internet-address offers a pro-active and relatively easy way to collect data via the Internet.
Respondents do not encounter serious problems with the method used, although the on-line- and ASCII-questionnaire do not
live up to the expectations of respondents, who apparently want a ‘real electronic form’. Some improvements regarding
addressing of the respondents can also be made. Response can be improved by sending more or better-timed reminders. The
incoming data can easily be processed into the database of the Statistical Department, making a more efficient statistical
process feasible.
In short, data-collection via the Internet, using Blaise IS and e-mail works very well.
5. Designing Web-based questionnaires
Blaise IS is a useful tool to contribute to the aim of Statistics Netherlands: a transition of paper questionnaires to selfadministered electronic forms. With this first pilot we have tested the technical possibilities of Blaise IS only. Little attention
was paid to the layout of the generated HTML pages and the usability. Although there is a lot of knowledge about the design
principles of paper questionnaires and questionnaires for CASI (Computer Assisted Self Interviewing), these principles do not
apply to CAWI (Computer Assisted Web Interviewing) automatically. In fact, there are few scientifically developed and
validated design principles for Web-based questionnaires (Tedesco, Zukerberg and Nichols)3.
In future developments of Blaise IS we have to pay much more attention to the layout of the generated HTML pages and the
usability. In this second part of the paper we want to address some design and usability issues we encountered while carrying
out the pilot survey:
•
•
•
•
Presentation of a Web questionnaire.
Navigation through the electronic form.
The logic of the electronic form.
Electronic form versus Internet application.
In the following discussion we define a Web survey to be a survey which is filled in with the help of an Internet browser and
which uses the World Wide Web to transmit the collected data to the statistical organisation.
Presentation of a Web questionnaire
There are basically two different ways to present a Web survey:
• A so called ‘scroll-based’ form: one (HTML) page which contains the complete questionnaire; Blaise IS implements this
presentation with the HTML Generator. See figure 2 for an example of a scroll-based presentation.
• A so called ‘screen-based’ form: sections of the questionnaire (one or more questions) are presented on the screen in a
number of sequential windows; Blaise IS implements this presentation in its on-line mode (but one question per screen
only). See figure 3 for an example of a screen-based presentation.
Figure 2. SEQARABICExample of a scroll-based presentation.
3
Heather Tedesco, Andrew L. Zuckerberg and Elizabeth Nichols (1999), “Designing Surveys for the Next Millenium:
Web-based Questionnaire Design Issues”, ASC International Conference 1999
Figure 3. SEQARABICExample of screen-based presentation.
Navigation through the electronic form
Navigation through a scroll-based form is only possible by scrolling through the page. A respondent can use a pointing device
or the TAB-key to navigate to a question. Respondents should not be advised to use the TAB key, because handling of the
TAB- key differs for each browser and the cursor will move to hyperlinks and images also. If a questionnaire becomes large,
not all of the questions are visible. In that case a respondent might get lost in the form. However, we think that if the number of
questions is not too large a respondent is able to find his way in the questionnaire.
Navigation through a screen-based form is only possible with some kind of menu to access the subsequent screens with
questions. Navigation within the screen should be no problem, but navigation to a next or previous screen can be a problem,
especially if the respondent does not understand the function of the menu.
If we do not take into account the possibility of automatic routing it seems that using a scroll-based form should be given
preference to the screen-based form. Nevertheless, if the questionnaire becomes too large navigation is difficult in both
presentations. Further research is necessary to find a measurement (e.g. the number of questions) for the optimal size of a Web
questionnaire.
Blaise IS supports both presentations, but the screen-based presentation supports one question per screen only. Several
respondents in the pilot addressed this lack of more questions per page in the online version. It is obvious we have to pay more
attention to this fact. We will return to this subject in the next paragraph.
The logic of the electronic form
We distinguish three levels of logic in an electronic form:
• The form tests the validity of the response type (alphabetic, numeric, etc) and checks whether the given answers are inside
the valid domain of the questions.
• The form includes a validation mechanism to check the consistency of the form and reject inconsistent answers and it
incorporates auto-filled and auto-calculated fields.
• The form contains a skip pattern where progress through the questionnaire depends on the response to previous questions,
the so-called routing.
Response type and domain checks.
We think every electronic form should at least contain a domain check of the given answers. Because of the chosen technology
to realise a Web questionnaire it is always possible to implement a response type and domain check using Javascript. Blaise IS
meets this requirement.
Consistency checks and routing.
Applying consistency checks is highly desirable and a skip and branching pattern is an essential part of a CASI system. Strictly
speaking we want the full functionality of ordinary CAI tools. But, implementing a checking and routing mechanism is very
complex and the result can be a large piece of software. To use it in Web-based questionnaires it must be transparent for all
computer platforms. With the current state of the technology, Java seems to be the only programming environment that meets
this requirement. Whether the checking and routing mechanism resides on the server or will be transmitted to the respondent as
a Java applet will in this case not be a topic for discussion anymore.
The checking and routing mechanism of Blaise IS is based on the Wintel implementation of the Blaise Data Entry Program
(DEP). Consequently, it can only be executed at the server side or by installing an ordinary Blaise DEP that is enhanced with a
World Wide Web transmission module at the respondent’s computer when this computer is running at least Microsoft
Windows 95.
Utilising routing in a scroll-based form has to be discussed. We think it is not preferable because a respondent might get lost in
the form if the focus on the form changes frequently and the leaps are large. This problem can be avoided in a screen-based
presentation by choosing an intelligent layout, which corresponds to the skip and branching pattern. Further usability testing
must make out our proposition.
To discuss the usage of consistency checks we have to distinguish between static and dynamic checking. In our opinion
dynamic checking should not be used with scroll-based forms. Again a respondent might get confused or annoyed if error
messages pop up frequently while filling out the form. Furthermore a respondent might get lost in the form if correcting the
errors results in jumping to a lot of fields to correct the inconsistencies. Before finishing the form the static check should be
invoked automatically. However, the designer of the questionnaire should take into account that very complex consistency
checks might confuse the respondent. Dynamic checking should be no problem in the screen-based presentation because this
resembles almost an ordinary data entry program, which has proven its usability in practice.
Electronic form versus Internet application
When we introduce Web-based questionnaires we have to think about the backgrounds of the respondents we have in view.
Are they familiar with CASI applications or did they use paper forms until now? In the latter case we think introducing Webbased questionnaires by electronic forms is preferable. Presenting a scroll-based form resembles the paper form as much as
possible. When introducing Web-based applications we should proceed with caution. The presentation of a Web-based CASI
application will be screen-based. A well-designed menu is necessary and the application should respond instantaneously to
user actions with for example dialogs. In other words the Web-based application should not differ from an ordinary CASI
application.
The Blaise IS HTML Generator generates HTML files which are electronic forms. Apart from the layout that leaves room for
improvements, we think the nature of the HTML forms is sufficient to present short, not too complex, questionnaires. The online mode of the current Blaise IS version is only the first step in the evolution to the final goal: A Web-based application,
which is a fully-fledged CASI tool.
Recapitulation
When designing Web-based questionnaires we have to consider that they can be navigated easily by end-users. Especially in
the case of end-users that are survey respondents with little or no experience with computers or the Internet, a selfadministered Web-based questionnaire should be designed to be both easily understood and easily completed. The above
mentioned issues should be taken into account. The first version of Blaise IS mainly focused on the functionality and less
focused on the usability. Besides the enhancement of the functionality, the usability of the Web-based questionnaires has to be
one of the guiding principles for future developments of Blaise IS. We should not fall into the trap of utilising a new
technology simply because it is new or because we want to stay at the ‘cutting edge’.
ON THE USE OF XML IN THE BLAISE ENVIRONMENT
JELKE BETHLEHEM & LON HOFMAN, STATISTICS NETHERLANDS
1. Introduction
XML is the Extensible Markup Language. It was developed in 1998 to cope with a number of restrictions of HTML, the
language to design Internet sites. Initially, XML may have seemed like it was all just typical software industry hype. It would
be the future of all data manipulation and data transmission, and therefore be the answer to the ultimate question of life, the
universe and everything.
After a few years now, it has become clear that XML is no hype. It turned out that XML is much more than a potential
successor of HTML. It is used as a tool for platform independent data exchange. Moreover, XML has turned out to be very
useful for describing data in a very structured way. Therefore, it is playing an increasingly important role in the world of data
and meta data. Various developers in all parts of the world are working on statistical meta data systems based on XML. These
developments hold as promise of more standardisation of, or at least easier interaction between these meta data systems.
This paper explores a potential role for XML in the Blaise System. It concentrates on the meta data aspects by showing how
the current Cameleon tool could be replaced by a new one based on XML. Section 2 gives a general introduction into XML. It
also shows how information in an XML file can be manipulated using tools like XSL (Extended Style sheet Language).
Section 3 describes how XML could play a role in the Blaise environment. It describes how Cameleon can generate XML files
containing question meta data. Once such an XML file is available, there are several approaches of manipulating the meta data.
Examples show how XSL can be used to generate an SPSS setup and questionnaire documentation in HTML format. It is also
made clear that new meta data tools can be developed in fairly simple way. This is illustrated by means of a simple example of
question documentation browser.
This paper is not the blueprint for the future of Blaise. It is only meant to trigger some discussion about possible future
developments. And it shows that XML may be an important player in this field.
2. About XML
2.1. What is XML?
XML is a markup language. A markup language defines markup rules. Markup refers to anything included in a document that
adds a special meaning to it or provides extra information about it. A markup language defines a set of rules that declare what
markup constitutes, and exactly what the markup means. Three types of markup can be distinguished:
• Stylistic markup indicates how the document is to be presented. For example, it can instruct to present text in boldface or
Italics, to use a specific font, etc.
• Structural markup gives information about the structure of a document. For example, it can instruct a piece of text to be
handled as a section heading, or a paragraph.
• Semantic markup gives information about the content of the data. An example is a markup that declares a piece of text to
be programmer’s comment that is not to be printed or displayed.
XML is just one example of a markup language. Other examples are SGML and HTML. SGML (Standardized Generalized
Markup Language) was developed in the late 1960's. Its purpose was to describe markup languages, by allowing the author to
provide formal definitions for each of the elements and attributes of his markup language. Therefore, SGML is a metalanguage. It is a language for describing languages. At the time, SGML was one of the competing meta-languages. However, it
was its offspring HTML, which caused it to become more popular than the others.
SGML is a very powerful meta-language. The price paid for this power is complexity. The language has many features that are
rarely used. It is difficult to interpret a SGML document without the definition of the markup language used. This definition is
kept in a Document Type Definition (DTD). The DTD contains all language rules. The DTD has to be sent with, or included
in, the SGML document so that custom created elements can be understood. Markup languages created by SGML are called
SGML applications.
HTML is the language used for making web sites. It was originally an SGML application. It describes how information is to be
prepared for the World Wide Web. HTML is just a set of SGML rules. In the case of HTML, the DTD is stored somewhere in
the browser (e.g. Netscape Navigator or Internet Explorer). As a language, HTML is only a fraction of the size of SGML, and
it is easy to learn. This quickly made it very popular.
HTML uses tags to markup a document. Examples of these tags are:
<B>This text will be displayed in boldface</B>
<H1>This text is a primary heading</H1>
<P>Treat the text between these tags as a paragraph</P>
Although HTML is now used at a very wide scale, the language has its limitations. Two of the most important ones are:
• HTML has a fixed set of tags. It is not possible to create new tags that can be interpreted properly by others.
•
HTML focuses on presentation. The tags are used to describe how information is to be displayed by the Internet browser
software. The tags do not carry any information about the meaning the text they enclose.
SGML does not have the drawbacks of HTML. However, SGML is very complex. The major players in the web browser
market have made it clear that they have no intention of fully supporting SGML in their browsers. This caused moves to be
made to create a simplified version of SGML capable of marking up documents according to their content. This development
was supported by the World Wide Web Consortium (W3C). The result was XML (Extensible Markup Language). Like SGML,
XML is also a meta-language. It is not a fixed format language like HTML. Users can create their own tags, and these tags can
describe content.
HTML is mainly used to describe how information is to be displayed. XML is different. It is used to describe the structure and
meaning of a document. Formatting of XML documents is described in a separate document, called a style sheet. Because
XML describes structure and meaning, an XML document can be seen as a data file, on which processing instructions can be
carried out. The data can be used and re-used across different computer platforms and in different applications. Therefore
XML is gaining popularity as a data storage format.
Instead of using style sheets, there are also different ways of formatting information contained in an XML document.
Microsoft offers (as part of Internet Explorer version 5) a DLL file containing an interface for parsing XML documents. This
DLL can be used in a Delphi, C++, or Visual Basic environment to develop dedicated applications.
Using style sheets to format the information has a number of advantages. First, different style sheets can be used on the same
XML document to present the same information in different ways. Second, style sheets offer the possibility to format XML
documents from different sources in the same way. Therefore, it promotes standardisation. And third, style sheets allow for
easy transformation of one XML document into another.
XML has also raised interest in the statistical community, in particular in the area of meta-data. An example is the ADDSIA
project, financed by the Fourth Framework of the European Union, see Bi and Murtagh (1998). XML is used in this project to
described the meta-data for the statistics on economic indicators. Another example is the DDI, the Data Documentation
Initiative. This is an initiative of the international social science community of researchers and archivists to develop a standard
for a code book describing variables in social survey data files, see the web site
http://www.icpsr.umich.edu/DDI/codebook.html. Another application of XML as the TADEQ project, see Bethlehem (1999) or
visit the project web site http://neon.vb.cbs.nl/rsm/tadeq. TADEQ is a tool to document electronic questionnaires, like
generated by the Blaise System. It uses XML to store the execution tree of an interview.
2.2. Tags and attributes
To develop an XML application, three or more components are required: The Document Type definition (DTD), the actual
XML file containing the information to be processed, and one or more style sheets (or a dedicated software tool to parse an
XML document). These components are described in some more detail using an example of a Blaise questionnaire
documentation. The documentation describes the questions in a Blaise data model. The data model has a name and a
descriptive text. Each question has a name and a text. Furthermore, the position of the question in the data file is documented.
For each different question type (open, closed, numeric), the relevant information is recorded. The XML file for this example
could look like displayed in figure 2.2.1.
Figure 2.2.1. An example of an XML file
<?xml version="1.0"?>
<!DOCTYPE DataModel SYSTEM "blaise.dtd">
<!-- ?xml-stylesheet type="text/xsl" href="blaise1.xsl" ?-->
<DataModel>
<ModelName>Commut</ModelName>
<ModelText>The Commuting Survey</ModelText>
<Question Qname="Name">
<Qtext>What is your name?</Qtext>
<FilePos First="1" Last="20"/>
<Open Length="20"/>
</Question>
<Question Qname="Sex">
<Qtext>What is your sex?</Qtext>
<FilePos First="21" Last="21"/>
<Closed Max="1">
<Item Code="1" Name="Male" Label="Male"/>
<Item Code="2" Name="Female" Label="Female"/>
</Closed>
</Question>
<Question Qname="Age">
<Qtext>What is your age (in years)?</Qtext>
<FilePos First="22" Last="24"/>
<Numeric Min="0" Max="120" Dec="0"/>
</Question>
<Question Qname="MarStat">
<Qtext>What is your marital status?</Qtext>
<FilePos First="25" Last="25"/>
<Closed Max="1">
<Item Code="1" Name="NeverMar" Label="Never married"/>
<Item Code="2" Name="Married" Label="Married"/>
<Item Code="3" Name="Divorced" Label="Divorced"/>
<Item Code="4" Name="Widowed" Label="Widowed"/>
</Closed>
</Question>
</DataModel>
Information is enclosed in tags. Tags always come in pairs in XML. There is an opening tag and a closing tag. The name of the
closing tag is equal to the opening tag, but with a slash added to it. See for example the tags <ModelName> and
</ModelName> in the example above. There is an exception to this rule. If a tag pair never encloses any text, one tag may be
used, and the tag name should end with a slash. Examples are <Open> and <Numeric> in the example above.
Tags can have so-called attributes. These are parameter values included in the opening tag. In the example above, the
<Question> tag has one attribute Qname, and <FilePos> tag has two attributes First and Last.
Attributes are a different way of attaching specific values to an element. There is no simple rule about whether information
should be specified as the value of an attribute or as text between an opening and closing tag. It is up to the developer of the
XML application whether to use tags or attributes for defining structure. For short parameter values, attributes might be
preferred. It improves readability of the XML document. Attributes also allow for defining default values of parameters. And if
the data consists of nested elements, there is no other way than to used nested tags with information.
The tags <DataModel> and </Datamodel> mark the begin and end of the data model definition. The data model description
can be found between the tags <ModelText> and </Modeltext>. This example contains the documentation of four questions. A
question definition starts with <Question> and ends with </Question>. The first question is a closed question. The name of the
question (LastWeek) can be found as the value of the attribute Qname of the <Question> tag. The <FilePos> tag contains the
position of the values of this question in the data file. For closed questions, there is a <Closed> tag, and it contains a arbitrary
number of <Item> tags. Each <Item> tag describes a possible answer.
The second question in the example is an open question. Its definition contains an <open> tag with the attribute Length to
indicate the maximum length of the answer.
The fourth question is a numeric question. The <numeric> tag contains attributes for the lower and upper bound, and for the
number of decimals.
2.3. Document Type Definitions
XML can be used to define two types of documents. They are called well-formed documents and valid documents. A
document is called well- formed if it satisfies three conditions:
• The document contains at least one element. An element is a pair of tags (open and closing tag) enclosing some
information;
•
•
The document must contain a root element. This is a unique open and closing tag that surrounds the whole document;
All other elements in the document must be nested. There may be no overlap between elements.
The XML-example in the previous subsection satisfies these three conditions.
An XML document is called valid if it not only is a well-formed document, but it also has a Document Type Definition (DTD)
the document conforms to. This means the document can only contain elements defined by the DTD, and also these elements
can only be used in the order defined by the DTD.
It is possible to use XML documents without a DTD, but having a DTD has some advantages. One is that it allows for a
document to be parsed and checked, so that errors in the XML file can be detected.
A DTD is a pre-defined structure against which instances of documents can be checked. The DTD was introduced in version
1.0 of XML. Later versions of XML also suggest other ways of defining structure. On is called XML Schema. Here we focus
on the use of the DTD. Figure 2.3.1 contains an example of how the DTD for the Blaise question documentation application
could look like. Note that this DTD is far from complete because not all the basic field types are covered.
Figure 2.3.1. The Data Type Definition for Blaise
<!-- Blaise Data Type Definition - version 1.0 -->
<!ELEMENT DataModel (ModelName, ModelText?, Question+) >
<!ELEMENT ModelName (#PCDATA) >
<!ELEMENT ModelText (#PCDATA) >
<!ELEMENT Question (Qtext, FilePos, (Open | Closed | Numeric)) >
<!ATTLIST Question Qname CDATA #REQUIRED >
<!ELEMENT Qtext (#PCDATA) >
<!ELEMENT FilePos EMPTY >
<!ATTLIST FilePos First CDATA #REQUIRED >
<!ATTLIST FilePos Last CDATA #REQUIRED >
<!ELEMENT Open EMPTY >
<!ATTLIST Open Length CDATA #REQUIRED >
<!ELEMENT Closed (Item+) >
<!ATTLIST Closed Max CDATA #REQUIRED >
<!ELEMENT Item EMPTY >
<!ATTLIST Item Code CDATA #REQUIRED >
<!ATTLIST Item Name CDATA #REQUIRED >
<!ATTLIST Item Label CDATA #IMPLIED >
<!ELEMENT Numeric EMPTY >
<!ATTLIST Numeric Min CDATA #REQUIRED >
<!ATTLIST Numeric Max CDATA #REQUIRED >
<!ATTLIST Numeric Dec CDATA #REQUIRED >
The DTD defines for each element what can be put between the corresponding brackets. For example, between the
<DataModel> tags one must put one <ModelName> element, followed by an optional <ModelText> element, and one or more
<Question> elements. A "+" means that an element must be included one or more times. The "|" between open and closed and
between closed and numeric means that a choice must be made between these three elements. The reserved word #PCDATA
indicates parseble character data, i.e. plain text. So between <ModelText> tags only character data can appear, and no other
elements.
The attribute parameters are described by <!ATTLIST>. The two attribute parameters code and name of <Item> must always
be specified, and the parameter Label is optional.
2.4. Style sheets
The Document Type Definition defines the structure of the data, but not how they are to be displayed. This is handled by socalled style sheets. A style sheet is a set of rules that declare how a document should be displayed. Style sheets have a number
of advantages:
• Since structure declarations are separated from style declarations, the readability of the documents is improved;
• Using different style sheets, it is possible to the display the same document in different ways;
• Using the same style sheet for different documents, it is possible to change the appearance of all these documents by
simply changing one style sheet.
Currently, there are several style sheet approaches with respect to XML, the two most important being CSS (Cascading Style
Sheets) and XSL (Extensible Style sheet Language). The specifications of these two languages are by no means fixed yet. They
are still under development. CSS has limited possibilities. It is only possible to affect the layout of the document text (font,
bold, italic, underline, etc). XSL has more possibilities for influencing layout and adding other text elements.
Figure 2.4.1 contains an example of an XSL style sheet that works with the Blaise question documentation example.
Note that the XSL style sheet is an XML application in itself. The XSL instructions in the example generate an HTML page.
All tags starting with xsl: denote special XSL instructions. For example, <xsl:for-each select="//Question" > searches the
XML file for each occurence of the <Question> tag. And the instruction <xsl:value-of select="Qtext"/> displays the text
between the <Qtext> tags.
Figure 2.4.1. An XSL style sheet
<?xml version="1.0"?>
<xsl:stylesheet xmlns:xsl="http://www.w3.org/TR/WD-xsl">
<xsl:template match="/">
<HTML>
<BODY>
<H1><xsl:value-of select="DataModel/ModelName"/></H1>
<H2><xsl:value-of select="DataModel/ModelText"/></H2>
<xsl:for-each select="//Question" >
<TABLE BORDER="1" WIDTH="80%">
<TR><TD><B><xsl:value-of select="@Qname" /></B></TD></TR>
<TR><TD><xsl:value-of select="Qtext" /></TD></TR>
<xsl:choose>
<xsl:when match="Question[Closed]">
<TR><TD>Closed question</TD></TR>
</xsl:when>
<xsl:when match="Question[Open]">
<TR><TD>Open question</TD></TR>
</xsl:when>
<xsl:when match="Question[Numeric]">
<TR><TD>Numeric question</TD></TR>
</xsl:when>
</xsl:choose>
</TABLE>
<P/>
</xsl:for-each>
</BODY>
</HTML>
</xsl:template>
</xsl:stylesheet>
The file contains a combination of XML tags and HTML tags, and this makes it a proper XML document. However, note that
HTML is somewhat sloppy in the use of tags, and XML is stricter. XML requires a closing tag to be present for each opening
tag. Therefore, for each <TD> tag there must be a </TD> tag, which is not required in HTML. Also, empty tags, like <P> must
have terminating slash. This is the reason why figure 2.4.1 contains <P/> instead of <P>.
When the XML file is loaded in the browser (Internet Explorer 5) using this style sheet, an HTML page like in figure 2.4.2 is
displayed.
Note that this is only a very simple HTML page. Much more useful and effective HTML output could be generated by making
use of all the interesting functions that HTML has. One example could be the inclusion of hyperlinks to offer the possibility to
jump to other parts of the documentation, or the other documentation.
There are many books on the market, on more and more are published each day. For this paper, Morrison et al. (2000) and
Boumphrey et al. (1998). The XML support implemented in Internet Explorer 5 is well documented in Homer (1999).
Figure 2.4.2. An HTML page generated by an XSL style sheet
Commut
The Commuting Survey
Name
What is your name?
Open question
FirstPos: 1
Sex
What is your sex?
Closed question
1
2
FirstPos: 21
LastPos: 20
Len: 20
Male
Female
LastPos: 21
Male
Female
Age
What is your age (in years)?
Numeric question
Min: 0
FirstPos: 22
LastPos: 24
Max: 120
Dec: 0
MarStat
What is your marital status?
Closed question
1
NeverMar
2
Married
3
Divorced
4
Widowed
FirstPos: 25
LastPos: 25
Never married
Married
Divorced
Widowed
3. Use of XML in Blaise
3.1. Languages for meta-data
Blaise was originally designed as a system for capturing interview data. In later versions it developed into an integrated survey
processing system. Vital for Blaise is the Blaise language to document meta data in the data model. Blaise also uses a few
other languages to manipulate data and meta data. One example is the language used to define Manipula setups. It resembles
the Blaise language, but is not completely identical to it. Another example is the language used in the tool Cameleon.
Cameleon takes Blaise meta data as input, and produces a description of this meta data in another format. A typical example is
a setup file for the statistical package SPSS.
Cameleon meta data transformations are based on instruction files, or so-called Cameleon Scripts. Cameleon uses a dedicated
language for defining scripts. An example of such a script can be found in appendix A. This is a script to transform Blaise meta
data into an XML file.
Taking into account the growing popularity of XML, one can think of two approaches to consider XML as a means to
manipulate Blaise meta data. One is to completely replace the Cameleon Script Language. This may be an option for the long
run. Another approach is to offer a Cameleon Script that translates Blaise meta data into an XML file. Then the user has at his
disposal all new possibilities for using XML without losing the current functionality of Cameleon. This paper explores the
second approach.
3.2. A Cameleon Script for XML
Appendix A contains a Cameleon Script that translates a Blaise meta data file into an XML file. This script is somewhat
simplified because it does not cover everything one may encounter in a Blaise data model. Still, it serves its purpose by
showing how not too complex Blaise data models can be translated in a fairly straightforward way.
We illustrate our approach by using a very simple Blaise data model. It only has four questions of three different types. The
data model is presented in figure 3.2.1.
When the meta data file of this data model is processed by the Cameleon XML Script an XML file is generated. The content of
this file is displayed in figure 3.2.2. Note that this figure contains the same information as figure 2.2.1.
Once an XML file is available, it can be used to transform Blaise meta data into a format which can be read by other software.
In the following subsections we describe various approaches. Only two transformations are considered: From Blaise into
HTML question documentation, and from Blaise into an SPSS setup. Subsection 3.3 shows how to use XSL style sheets from
within an HTML environment, and subsection 3.4 describes how the same thing can be accomplished using a simple Visual
Basic tool. Subsection 3.5 shows how the XML parser available in Internet Explorer 5 can be included in a dedicated software
tool for processing XML information without using style sheets.
Figure 3.2.1. The Blaise data model
DATAMODEL Commut "The Commuting Survey"
FIELDS
Name "What is your name?": STRING[20]
Sex
"What is your sex?": (Male, Female)
Age
"What is your age (in years)?": 0..120
MarStat "What is your marital status?":
(NeverMar "Never married",
Married "Married",
Divorced "Divorced",
Widowed "Widowed")
RULES
Name Sex Age MarStat
ENDMODEL
Figure 3.2.2. The XML file
<?xml version="1.0"?>
<!DOCTYPE DataModel SYSTEM "blaise.dtd">
<!-- ?xml-stylesheet type="text/xsl" href="blaise1.xsl" ?-->
<DataModel>
<ModelName>Commut</ModelName>
<ModelText>The Commuting Survey</ModelText>
<Question Qname="Name">
<Qtext>What is your name?</Qtext>
<FilePos First="1" Last="20"/>
<Open Length="20"/>
</Question>
<Question Qname="Sex">
<Qtext>What is your sex?</Qtext>
<FilePos First="21" Last="21"/>
<Closed Max="1">
<Item Code="1" Name="Male" Label="Male"/>
<Item Code="2" Name="Female" Label="Female"/>
</Closed>
</Question>
<Question Qname="Age">
<Qtext>What is your age (in years)?</Qtext>
<FilePos First="22" Last="24"/>
<Numeric Min="0" Max="120" Dec="0"/>
</Question>
<Question Qname="MarStat">
<Qtext>What is your marital status?</Qtext>
<FilePos First="25" Last="25"/>
<Closed Max="1">
<Item Code="1" Name="NeverMar" Label="Never married"/>
<Item Code="2" Name="Married" Label="Married"/>
<Item Code="3" Name="Divorced" Label="Divorced"/>
<Item Code="4" Name="Widowed" Label="Widowed"/>
</Closed>
</Question>
</DataModel>
3.3. Using style sheets in an HTML environment
An XML application has a tree structure. The tags represent the nodes of the tree. Tags that are nested in other tags represent
branches of the tree. In principle, an XSL style sheet does nothing more than transforming this tree structure into another tree
structure. The XSL instructions describe which nodes are transformed and how they are transformed.
An example of how XSL can transform XML into HTML was already given in section 2, see figure 2.4.1. The resulting
HTML file for the Blaise example can be found in figure 2.4.2.
The transformation into an SPSS setup is somewhat more complex. The XSL file for this is given in figure 3.3.1. To create the
setup file, three runs have to be made through the XML file: one to create the DATALIST section, one to create the VAR
LABELS section, and one to create the VALUE LABELS section. The <xsl:for-each> instruction implements these loops. It
locates each occurrence of the <Question> tag. In the first loop, the values of the attribute Qname of the <Question> tag and
the values of the attributes First and Last of the <FilePos> tag are retrieved. In the second loop, the values of the attribute
Qname of the <Question> tag and of the <Qtext> tag are retrieved.
The third loop is somewhat more complex. Only information on closed questions is retrieved. This is accomplished by
searching for the pattern '//Question[Closed]' . Note that there is another loop nested within the loop. With the instruction
<xsl:for-each select="Closed/Item" > all <Item> tags are located within each <Closed> tag, and from the <Item> tags the
values of the Code and Label attributes are retrieved.
Note that the last item in the item loop gets a different treatment. This is necessary because for the last value in the VALUE
LABELS labels list different output must be generated. This is accomplished by using the tags <xsl:when
match="Item[end()]"> and <xsl:otherwise>.
Because blanks in XSL files are ignored, a simple JavaScript function is used to include blanks in the output. The <xsl:script>
instruction is used to define this function, and the <xsl:eval> instruction makes it possible to execute it.
Figure 3.3.1. A style sheet for an SPSS setup
<?xml version="1.0"?>
<xsl:stylesheet xmlns:xsl="http://www.w3.org/TR/WD-xsl">
<xsl:script language="javascript">
function B(N)
{ var T="
"
return T.substring(0, N)
}
</xsl:script>
<xsl:template match="/">
TITLE '<xsl:value-of select="DataModel/ModelText"/>'.
DATALIST FILE='<xsl:value-of select="DataModel/ModelName"/>.asc' /
<xsl:for-each select="//Question" >
<xsl:eval language="javascript">B(3)</xsl:eval>
<xsl:value-of select="@Qname" />
<xsl:eval language="javascript">B(1)</xsl:eval>
<xsl:value-of select="FilePos/@First" /><xsl:value-of select="FilePos/@Last" />
</xsl:for-each>
<xsl:eval language="javascript">B(3)</xsl:eval>.
VAR LABELS
<xsl:for-each select="//Question" >
<xsl:eval language="javascript">B(3)</xsl:eval>
<xsl:value-of select="@Qname" />
<xsl:eval language="javascript">B(1)</xsl:eval>'
<xsl:value-of select="Qtext" />'
</xsl:for-each>
<xsl:eval language="javascript">B(3)</xsl:eval>.
VALUE LABELS
<xsl:for-each select="//Question[Closed]" >
<xsl:eval language="javascript">B(3)</xsl:eval>
<xsl:value-of select="@Qname" />
<xsl:for-each select="Closed/Item" >
<xsl:choose>
<xsl:when match="Item[end()]">
<xsl:eval language="javascript">B(6)</xsl:eval>
<xsl:value-of select="@Code" />
<xsl:eval language="javascript">B(1)</xsl:eval>'
<xsl:value-of select="@Label" />'/
</xsl:when>
<xsl:otherwise>
<xsl:eval language="javascript">B(6)</xsl:eval>
<xsl:value-of select="@Code" />
<xsl:eval language="javascript">B(1)</xsl:eval>'
<xsl:value-of select="@Label" />'
</xsl:otherwise>
</xsl:choose>
</xsl:for-each>
</xsl:for-each>
<xsl:eval language="javascript">B(3)</xsl:eval>.
SAVE /OUTFILE '<xsl:value-of select="DataModel/ModelName"/>.sav'.
</xsl:template>
</xsl:stylesheet>
The result of applying the XSL style sheet to the XML file of the Blaise example can be found in figure 3.3.2.
Figure 3.3.2. SPSS setup generated by the XSL style sheet
TITLE 'The Commuting Survey'.
DATALIST FILE='Commut.asc' /
Name 1-20
Sex 21-21
Age 22-24
MarStat 25-25
.
VAR LABELS
Name 'What is your name?'
Sex 'What is your sex?'
Age 'What is your age (in years)?'
MarStat 'What is your marital status?'
.
VALUE LABELS
Sex
1 'Male'
2 'Female'/
MarStat
1 'Never married'
2 'Married'
3 'Divorced'
4 'Widowed'/
.
SAVE /OUTFILE 'Commut.sav'.
It is rather simple to implement this kind of conversion tool in an HTML environment. Appendix E contains an example of
how this can be done. The main part of the work is done by a JavaScript function Transform(). The following fragment
contains the core of this function.
InFile = document.Form1.InputFile.value + ".xml"
XmlFile = new ActiveXObject('microsoft.XMLDOM')
XmlFile.load(InFile)
XslFile = new ActiveXObject('microsoft.XMLDOM')
XslFile.load(ScrFile)
Output = xmlFile.transformNode(xslFile)
Fso = new ActiveXObject("Scripting.FileSystemObject")
OutFile = fso.CreateTextFile(OutFile, true)
OutFile.Write(output)
OutFile.Close()
The first three lines read the XML file. The first line assigns the name of the file as specified by the user on the HTML page to
the variable inFile. The second line creates an new XML object. Note that this only works in a browser supporting XML, like
Internet Explorer 5. And in the third line the XML file is loaded into the XML object.
The second two lines create another XML object. This time it is used to load the XSL style sheet file as specified in the
variable ScrFile. Line six does the transformation. It creates a new XML object Output by transforming the original object and
using the XSL instructions. The final lines of this JavaScript fragment see to it that the transformed object is written to file.
When the HTML file of appendix E is loaded into the browser Internet Explorer 5, it will look like in figure 3.3.
Figure 3.3.3. The HTML version of Cameleon
This simple prototype only offers two transformation possibilities: HTML question documentation and an SPSS setup. Of
course, it can easily be expanded to include more types of transformations.
3.4. Using style sheets in a Visual Basic Environment
Implementing a tool like Cameleon in an HTML environment has its limitations. If this is a concern, one can consider
implementing it in a real programming language environment. This is illustrated by means of a simple Visual Basic program.
The complete code of this program can be found in appendix F. The XML support offered by Internet Explorer 5 is available in
a DLL file (MSXML.DLL). This file can be referenced to from within Visual Basic (or other programming languages, like
Delphi or C++).
The statement that does most of the work of the VB version of Cameleon is:
outDoc = xmlDoc.transformNode(xslDoc)
It transforms the XML object in the variable xmlDoc into a new XML object outDoc using the XSL instructions in the XML
object xslDoc. The rest of the program code is concerned with the user interface. When this program is run, it looks like in
figure 3.4.1.
Figure 3.4.1. The Visual Basic version of Cameleon
Also here it should be noted this is just a very simple example of a Visual Basic application. It can be extended at wish.
3.5. Parsing the XML tree with a dedicated program
The previous two sections used XSL style sheets to transform the meta data in the Blaise XML into a different format. This
approach has the advantage that only XSL knowledge is required for a user to modify existing Cameleon Scripts or to create
new ones. The XSL instruction language is reasonably powerful but has its limitations. For example, the result of an XSL
transformation is always an XML tree. This prohibits, for example, the implementation of more interactive meta data
applications.
There is a different approach possible that does not make use of XSL style sheets. As was mentioned in the previous
subsection, it is easy in a programming environment to get access the XML parser that is part of Internet Explorer 5. This
parser contains a lot of functions that allow a programmer to process the XML tree in a self-defined way. This approach is
illustrated by describing a Visual Basic application that offers an interactive question documentation browser. The complete
could of this application can be found in appendix G. When executed this Visual Basic program looks like in figure 3.5.1.
Figure 3.5.1. An interactive question browser
The XML parser sees each tag as an element of the XML tree. Furthermore, the text between an opening and closing tag is
considered to be a child element of the tag element.
The XML parser makes available the routine getElementsByTagName to create a list of references to tags with a specified
name. The elements in the list are denoted by Item(0), Item(1), etc. So, with the Visual Basic statement
Set e = xmlDoc.getElementByTagName("ModelName").Item(0)
a reference is obtained to the first occurence of the tag <ModelName>. And the subsequent statement
e.firstChild.nodeValue
retrieves the value of the first child of the tag <ModelName>, and this is the text between <ModelName> and </ModelName>.
As another example, the list of question names on the right-hand side of the screen in figure 3.5.1 is created with the statements
Qlist.Clear
Set eList = xmldoc.getElementsByTagName("Question")
n = eList.length
I=0
Do While I < n
Set e = eList.Item(I)
Set ec = e.attributes.getNamedItem("Qname")
QList.AddItem ec.firstChild.nodeValue
I=I+1
Loop
The object eList contains a list of references to all <Question> tags. This list is processes in a while-loop. The variable e points
to the current <Question> tag, and ec to the Qname attribute. With ec.firstChild.nodeValue the attribute value (the question
name is obtained).
The subroutine DispQuestion displays the characteristics of the current question. Note the somewhat complex way of obtaining
the question type. With the statement
Set e = eList.Item(I)
e points to the current question tag. The first child of e is the <Qtext> tag, the second child is the <FilePos> tag, and the third
child refers to the tag indicating the question type (either <Open>, <Closed> or <Numeric>. So, the statement
Set e = e.firstChild.nextSibling.nextSibling
makes e point to the tag indicating the question type. With e.nodeName the tag text (either Open, Closed or Numeric) is
obtained.
Depending on the type of question, certain characteristics are displayed. Note that for a closed question, first a list of references
to <Item> tags is built.
The XML parser offered by Internet Explorer has much more possibilities of processing XML file. For more details, see
Homer (1999).
4. Conclusion
Support for XML is rapidly growing and more and more XML applications are developed, both inside and outside statistics.
Even within the world of Official Statistics we see interesting new XML developments. A good example is the Data
Documentation Initiative, which promotes documentation of survey data sets by means of XML. Traditionally, survey data set
documentation is a cumbersome, boring and time-consuming activity. If computer assisted interviewing systems are able to
automatically generate documentation in XML format, and data archives need documentation in XML format, then future for
survey data documentation suddenly looks a lot brighter.
Some experts say XML promotes standardisation. This is only partly true, because everyone can develop its own XML
application based on its own language. However, it is certainly true that it is not difficult to transform one XML application
into another. XSL is the instrument that does just that. So one could definitely say that XML is the glue that ties everything
together.
Is there a future for XML in Blaise? The examples in this paper show that it is not very difficult to add a Cameleon script to the
Blaise system that generates XML based on a defined DTD. One step further would be to completely replace the Cameleon
Script Language by XML combined with a set of XSL scripts or some other tool able of parsing the XML file.
A little bit more speculative is considering a future version of Blaise that stores its meta data itself in XML format. This may
be not such a very wild idea, considering rumours that future versions of MS Word will store text in XML format, and that the
next version of Mathtype, the equation editor of MS Word, will store mathematical expressions in XML.
References
Bethlehem, J.G. (1999): The Routing Structure of Questionnaires. Proceedings of the Third ASC International Conference,
Association of Survey Computing, Chesham, United Kingdom, pp. 405-418.
Bi, Y. and Murtagh, F. (1998), The Roles of Statistical Metadata and XML in Structuring and Retrieving Statistical
Information. Pre-proceedings of the International Seminar on New Techniques and Technologies for Statistics,
Sorrento, Italy, pp. 73-78.
Boumphrey, F., Direnzo, O., Duckett, J, Graf, J., Hollander, D., Houle, P., Jenkins, T., Jones, P., Kingsley-Hughes, A.,
Kingsley-Hughes, K., McQueen, C., and Mohr, S. (1998): XML Applications. Wrox Press, Birmingham, UK.
Homer, A. (1999): XML IE5, Programmer's Reference. Wrox Press Ltd, Birmingham, UK.
Morrison, M., Boumphrey, F. and Brownell, D. (2000): XML Unleashed. Sams Publishing, Indianapolis, USA.
Appendix A. Cameleon Script for an XML file
[VAR T: STRING]
[OUTFILE:= '.\' + METAINFOFILENAME + '.xml']
<?xml version="1.0"?>
<!DOCTYPE DataModel SYSTEM "blaise.dtd">
<!-- ?xml-stylesheet type="text/xsl" href="blaise1.xsl" ?-->
<DataModel>
<ModelName>[DATAMODELNAME]</ModelName>
<ModelText>[DATAMODELTITLE]</ModelText>
[FIELDSLOOP]
[IF TYPE = STRING OR TYPE = INTEGER OR TYPE = REAL OR
TYPE = ENUMERATED OR TYPE = SET THEN]
[:2]<Question Qname="[FIELDNAME]">
[&][IF FIELDLABEL = '' THEN]
[T:= FIELDNAME][ELSE][T:= FIELDLABEL][ENDIF]
[:4]<Qtext>[T]</Qtext>
[:4]<FilePos First="[FIRSTPOSITION]" Last="[LASTPOSITION]"/>
[IF TYPE = STRING THEN]
[:4]<Open Length="[FIELDLENGTH]"/>
[ELSEIF TYPE = INTEGER OR TYPE = REAL THEN]
[:4]<Numeric Min="[LOWVALUE]" Max="[HIGHVALUE]"
Dec="[NUMBEROFDECIMALS]"/>
[ELSEIF (TYPE = ENUMERATED) OR (TYPE = SET) THEN]
[IF TYPE = ENUMERATED THEN]
[:4]<Closed Max="1">
[ELSE]
[:4]<Closed Max="[NUMBEROFCHOICES]">
[ENDIF]
[ANSWERLOOP]
[&][IF ANSWERTEXT = '' THEN]
[T:= ANSWERNAME][ELSE][T:= ANSWERTEXT][ENDIF]
[:6]<Item Code="[ANSWERCODE]" Name="[ANSWERNAME]"
Label="[T]"/>
[ENDANSWERLOOP]
[:4]</Closed>
[ENDIF]
[:2]</Question>
[ENDIF]
[ENDFIELDSLOOP]
</DataModel>
Appendix B. The XML Data Type Definition for Blaise
<!-- Blaise Data Type Definition - version 1.0 -->
<!ELEMENT DataModel (ModelName, ModelText?, Question+) >
<!ELEMENT ModelName (#PCDATA) >
<!ELEMENT ModelText (#PCDATA) >
<!ELEMENT Question (Qtext, FilePos, (Open | Closed | Numeric)) >
<!ATTLIST Question Qname CDATA #REQUIRED >
<!ELEMENT Qtext (#PCDATA) >
<!ELEMENT FilePos EMPTY >
<!ATTLIST FilePos First CDATA #REQUIRED >
<!ATTLIST FilePos Last CDATA #REQUIRED >
<!ELEMENT Open EMPTY >
<!ATTLIST Open Length CDATA #REQUIRED >
<!ELEMENT Closed (Item+) >
<!ATTLIST Closed Max CDATA #REQUIRED >
<!ELEMENT Item EMPTY >
<!ATTLIST Item Code CDATA #REQUIRED >
<!ATTLIST Item Name CDATA #REQUIRED >
<!ATTLIST Item Label CDATA #IMPLIED >
<!ELEMENT Numeric EMPTY >
<!ATTLIST Numeric Min CDATA #REQUIRED >
<!ATTLIST Numeric Max CDATA #REQUIRED >
<!ATTLIST Numeric Dec CDATA #REQUIRED >
Appendix C. XSL style sheet for HTML question documentation
<?xml version="1.0"?>
<xsl:stylesheet xmlns:xsl="http://www.w3.org/TR/WD-xsl">
<xsl:template match="/">
<HTML>
<BODY>
<H1><xsl:value-of select="DataModel/ModelName"/></H1>
<H2><xsl:value-of select="DataModel/ModelText"/></H2>
<xsl:for-each select="//Question" >
<TABLE BORDER="1" WIDTH="80%">
<TR><TD><B><xsl:value-of select="@Qname" /></B></TD></TR>
<TR><TD><xsl:value-of select="Qtext" /></TD></TR>
<xsl:choose>
<xsl:when match="Question[Closed]">
<TR><TD>Closed question</TD></TR>
</xsl:when>
<xsl:when match="Question[Open]">
<TR><TD>Open question</TD></TR>
</xsl:when>
<xsl:when match="Question[Numeric]">
<TR><TD>Numeric question</TD></TR>
</xsl:when>
</xsl:choose>
</TABLE>
<P/>
</xsl:for-each>
</BODY>
</HTML>
</xsl:template>
</xsl:stylesheet>
Appendix D. XSL style sheet for an SPSS setup
<?xml version="1.0"?>
<xsl:stylesheet xmlns:xsl="http://www.w3.org/TR/WD-xsl">
<xsl:script language="javascript">
function B(N)
{ var T="
"
return T.substring(0, N)
}
</xsl:script>
<xsl:template match="/">
TITLE '<xsl:value-of select="DataModel/ModelText"/>'.
DATALIST FILE='<xsl:value-of select="DataModel/ModelName"/>.asc' /
<xsl:for-each select="//Question" >
<xsl:eval language="javascript">B(3)</xsl:eval>
<xsl:value-of select="@Qname" />
<xsl:eval language="javascript">B(1)</xsl:eval>
<xsl:value-of select="FilePos/@First" /><xsl:value-of select="FilePos/@Last" />
</xsl:for-each>
<xsl:eval language="javascript">B(3)</xsl:eval>.
VAR LABELS
<xsl:for-each select="//Question" >
<xsl:eval language="javascript">B(3)</xsl:eval>
<xsl:value-of select="@Qname" />
<xsl:eval language="javascript">B(1)</xsl:eval>'
<xsl:value-of select="Qtext" />'
</xsl:for-each>
<xsl:eval language="javascript">B(3)</xsl:eval>.
VALUE LABELS
<xsl:for-each select="//Question[Closed]" >
<xsl:eval language="javascript">B(3)</xsl:eval>
<xsl:value-of select="@Qname" />
<xsl:for-each select="Closed/Item" >
<xsl:choose>
<xsl:when match="Item[end()]">
<xsl:eval language="javascript">B(6)</xsl:eval>
<xsl:value-of select="@Code" />
<xsl:eval language="javascript">B(1)</xsl:eval>'
<xsl:value-of select="@Label" />'/
</xsl:when>
<xsl:otherwise>
<xsl:eval language="javascript">B(6)</xsl:eval>
<xsl:value-of select="@Code" />
<xsl:eval language="javascript">B(1)</xsl:eval>'
<xsl:value-of select="@Label" />'
</xsl:otherwise>
</xsl:choose>
</xsl:for-each>
</xsl:for-each>
<xsl:eval language="javascript">B(3)</xsl:eval>.
SAVE /OUTFILE '<xsl:value-of select="DataModel/ModelName"/>.sav'.
</xsl:template>
</xsl:stylesheet>
Appendix E. An HTML version of Cameleon
<HTML>
<HEAD>
<SCRIPT LANGUAGE="Javascript">
function Transform()
{ if (document.Form1.Script[0].checked)
{ ScrFile = "html.xsl"
OutFile = document.Form1.InputFile.value + ".htm"
}
else
{ ScrFile = "spss.xsl"
OutFile = document.Form1.InputFile.value + ".sps"
}
InFile = document.Form1.InputFile.value + ".xml"
xmlFile = new ActiveXObject('microsoft.XMLDOM')
xmlFile.load(InFile)
xslFile = new ActiveXObject('microsoft.XMLDOM')
xslFile.load(ScrFile)
output = xmlFile.transformNode(xslFile)
fso = new ActiveXObject("Scripting.FileSystemObject")
outFile = fso.CreateTextFile(OutFile, true)
outFile.Write(output)
outFile.Close()
document.Form1.Result.value = OutFile
}
</SCRIPT>
</HEAD>
<BODY>
<P>
<FORM Name="Form1">
<CENTER>
<TABLE BORDER="1" WIDTH="50%" Cellpadding="10">
<TR><TD><H1>Cameleon - XML</H1></TD></TR>
<TR><TD>
Specify XML Input File (without extension):<P>
<INPUT Type="text" Name="InputFile" Size="40">
</TD>
</TR>
<TR><TD>
Specify Cameleon Script:<P>
<INPUT Type="radio" Name="Script" Value="HTML" Checked>
HTML Documentation<BR>
<INPUT Type="radio" Name="Script" Value="SPSS">
SPSS Setup<BR>
</TD>
</TR>
<TR><TD>
<INPUT Type="button" Name="Execute" Value="Execute"
onClick="Transform()">
</TD>
</TR>
<TR><TD>
The following file has been created:<P>
<INPUT Type="text" Name="Result" Size="40">
</TD>
</TR>
</TABLE>
</CENTER>
</FORM>
<P>
</BODY>
</HTML>
Appendix F. Visual Basic version of Cameleon
Private Sub EndButton_Click()
End
End Sub
Private Sub ExecButton_Click()
Dim OutFil As String
If xmlOpen.filename = "" Then
Exit Sub
End If
Select Case ScriptNum
Case 0
xslDoc.Load ("html.xsl")
OutFil = ShortFileName + ".htm"
Case 1
xslDoc.Load ("spss.xsl")
OutFil = ShortFileName + ".sps"
End Select
outDoc = xmlDoc.transformNode(xslDoc)
Open OutFil For Output As #1
Print #1, outDoc
Close #1
Result.Text = "File " + OutFil + " has been generated"
End Sub
Private Sub Form_Load()
Scripts(0).Value = True
ScriptNum = 0
Set xmlDoc = New DOMDocument
Set xslDoc = New DOMDocument
End Sub
Private Sub Scripts_Click(Index As Integer)
ScriptNum = Index
End Sub
Private Sub SelButton_Click()
xmlOpen.filename = ""
xmlOpen.ShowOpen
If xmlOpen.filename = "" Then
End
End If
xmlDoc.Load (xmlOpen.filename)
If xmlDoc.parseError.errorCode <> 0 Then
Result.Text = xmlDoc.parseError.reason
Exit Sub
End If
Source.Text = xmlOpen.filename
ShortFileName = xmlOpen.FileTitle
ShortFileName = Left(ShortFileName, Len(ShortFileName) - 4)
End Sub
Appendix G. Interactive Question Browser in Visual Basic
Private Sub DispQuestion(I)
Dim S, T As String
Dim J, K As Integer
Set e = eList.Item(I)
Set ec = e.attributes.getNamedItem("Qname")
Qname.Text = ec.firstChild.nodeValue
Set ec = e.getElementsByTagName("Qtext").Item(0)
QText.Text = ec.firstChild.nodeValue
Set e = e.firstChild.nextSibling.nextSibling
T = e.nodeName
QType.Text = T
Select Case T
Case "Open"
Grid.Visible = False
Qanswer.Visible = True
Set ec = e.attributes.getNamedItem("Length")
S = "Text of atmost " + ec.firstChild.nodeValue + " characters"
Qanswer.Text = S
Case "Numeric"
Grid.Visible = False
Qanswer.Visible = True
S = "Number between "
Set ec = e.attributes.getNamedItem("Min")
S = S + ec.firstChild.nodeValue + " and "
Set ec = e.attributes.getNamedItem("Max")
S = S + ec.firstChild.nodeValue
Qanswer = S
Case "Closed"
Qanswer.Visible = False
Grid.Visible = True
Set iList = e.getElementsByTagName("Item")
For K = 0 To iList.length - 1
Grid.Row = K + 1
Set ec = iList.Item(K)
T = ec.attributes.getNamedItem("Code").firstChild.nodeValue
Grid.Col = 0
Grid.Text = T
T = ec.attributes.getNamedItem("Name").firstChild.nodeValue
Grid.Col = 1
Grid.Text = T
T = ec.attributes.getNamedItem("Label").firstChild.nodeValue
Grid.Col = 2
Grid.Text = T
Next K
For K = iList.length To 19
Grid.Row = K + 1
Grid.Col = 0
Grid.Text = ""
Grid.Col = 1
Grid.Text = ""
Grid.Col = 2
Grid.Text = ""
Next K
End Select
End Sub
Private Sub Disp(Text As String)
Result.AddItem Text
End Sub
Private Sub CloseButton_Click()
End
End Sub
Private Sub Command1_Click()
Dim I, p, n As Integer
Set xmldoc = New DOMDocument
Result.Clear
xmlOpen.filename = ""
xmlOpen.ShowOpen
If xmlOpen.filename = "" Then
Exit Sub
End If
xmldoc.Load (xmlOpen.filename)
If xmldoc.parseError.errorCode <> 0 Then
Result.AddItem (xmldoc.parseError.reason)
Exit Sub
Else
Result.AddItem ("XML file is OK")
End If
QList.Clear
Set e = xmldoc.getElementsByTagName("ModelName").Item(0)
MName.Text = e.firstChild.nodeValue
Set e = xmldoc.getElementsByTagName("ModelText").Item(0)
MText.Text = e.firstChild.nodeValue
Set eList = xmldoc.getElementsByTagName("Question")
n = eList.length
I=0
Do While I < n
Set e = eList.Item(I)
Set ec = e.attributes.getNamedItem("Qname")
QList.AddItem ec.firstChild.nodeValue
I=I+1
Loop
I=0
DispQuestion (0)
QList.ListIndex = 0
QList.SetFocus
End Sub
Private Sub Form_Load()
Grid.Rows = 21
Grid.ColWidth(0) = 300
Grid.ColWidth(1) = 1000
Grid.ColWidth(2) = 8000
Grid.Row = 0
Grid.Col = 1
Grid.Text = "Name"
Grid.Col = 2
Grid.Text = "Text"
Grid.Visible = True
Qanswer.Visible = True
End Sub
Private Sub QList_Click()
DispQuestion (QList.ListIndex)
End Sub
The internet, Blaise
and a representative panel
Adriaan Hoogendoorn
Dirk Sikkel
Bas Weerman
30 march 2000
ii
The internet, Blaise and a representative panel
Abstract
For 10 years CentERdata has operated a household panel that is representative for the
population in the Netherlands. Recently, the production system has switched to the internet,
using Blaise software. It is described how the production system works and how Blaise fits in.
Adaptions had to be made to make complex page layout possible when a respondent uses a
relatively simple settop box. Two examples of complex surveys are given. The first example is
a large and complex financial survey that is repeated every year. The second example is a
survey on product innovations which is repeated monthly.
1
1. Introduction
Collection of household data with electronic means has been a major development during the
last 20 years. The most common tool so far is the laptop computer. Interviewers use them to
enter the data in the presence of the respondent thus enbling the respondents to correct
inconsistencies and statistical agencies to produce reports immediately after data collection.
These CAPI (Computer Assisted Personal Interviewing) procedures nowadays are used by
many governmental statistical agencies and commercial market reserach firms. With the rise of
the internet, however, new ways of household data collection seem to arise: the internet
interview. Respondents fill in questionnaires they find on the internet, and mail the data to the
address of the data collector. With respect to this practice, several observations can be made.
1.
The idea of direct electronic household data collection is not new. CentERdata has carried
out such interviews already for more than 10 years, using its own communication channel.
The data were collected in a ‘telepanel’, a panel of households who have a PC (if they
don’t own a PC, they may borrow from CentERdata). The households fill in a
questionnaire every week.
2.
Data collection over the internet takes place without interviewers. This makes the design
of the questionnaire even more critical than in the case of CAPI. Extra care has to be taken
that ambiguity is avoided, that the respondent has all the information he needs (a good
help function), that no routing errors are made and that the respondents are motivated to
give valid answers.
3.
Interviewing over the internet raises the question of representativity. When a questionnaire
is placed on a fixed location, waiting for respondents to pass by, there is no way of
knowing what the composition of the set of respondents is. The same is true when a
questionnaire is sent out to a random group of internet users. Even worse results may be
obtained when from a large group of internet users a group is selected that is interested to
take part in a survey. The participants to such a survey may have a specific interest in its
outcomes.
4.
The anarchistic character of the internet makes it possible for virtually everybody to do
research on the internet. Household data collection is, however, a discipline that requires
talent, training and skills. It is important that it becomes clear which firms have the
necessary skills and means to succesfully execute research projects using the internet.
In this paper, we address the aspects which determine the quality of the collected data. The
first aspect, selection of respondents, is discussed in section 2. Section 3 deals with executing
and monitoring the production process. The technical execution of the interviewing process is
the subject of section 4. The data quality is, of course, also determined by how the
questionnaire is designed from a substantive point of view. Two examples are given in section
5. Section 6 concludes.
2
1. A controlled representative panel
CentERdata selects its panel, the CentERpanel, in such a way that the panel is a good cross
section of the Dutch population. The selection procedure takes place in two steps.
1.
The recruitment interview. This is a CATI interview among a random sample of the Dutch
population. This is a short interview. Its main purpose is to determine if households are
willing to take part in the CentERpanel. Respondents who do not refuse to consider taking
part in the panel are moved to a database. In this database their demographic
characteristics are stored. In the CATI interview the respondents are questioned, apart
from demographics, about a variety of subjects including health, work, victimization and
participation to cultural activities. The resulting data, including those which belong to
respondents that refuse to partipate in the panel, are used as reference distributions for
weighting panel members.
2.
The selection interview. New potential panel members are selected from the data base.
This selection is based on demographic characteristics. Those potential members are
selected who bring the distributions of age, income, composition of the household, region,
urbanisation and voting behaviour as close as possible to the corresponding population
distributions.
In this process, there are three moments on which persons may refuse to participate. In the first
place, a person may refuse to participate in the recruitment interview; 62% of the persons
which are selected take part in the recruitment interview. At the end of the recruitment
interview, respondents may indicate that they refuse to participate in the panel; 52% is willing
to consider participation in the panel. Finally, when the respondents are asked to actually
become a panel member, 35% of the respondents agrees. Thus, the participation rate is
0.62*0.52*35% = 11%. This may seem a small number, but with respect to the variables
mentioned in 2, the panel still is forced to be representative. Moreover, we can compare
distributions of the variables in the recruitment interview and the selection interview to the
actual panel data. Table 1 shows that the distributions with respect to health and cultural
participation are somewhat dissimilar. Of course, by weighting the data, this dissimilarity can
be adjusted.
3
Table 1. Distributions of variables in the recuitment interview, the selection interview and in
the panel
Recruitment %
Selection %
Panel %
buy/rent dwelling
Buy
rent
other
72.8
25.8
1.4
74.1
25.2
0.7
68.7
30.1
1.2
number of rooms in the house
1-3 rooms
4 rooms
5 rooms
6 or more rooms
13.1
37.3
28.3
21.3
12.1
42.9
27.3
17.6
17.7
31.8
30.9
19.5
traveling time to work
>20 minutes
<20 minutes
40.7
59.3
52.0
46.8
49.3
50.7
ill at home last 3 months
Yes
No
20.9
79.1
21.3
78.7
27.0
73.0
chronic disease
Yes
No
18.4
81.6
21.1
78.9
22.5
77.5
rating personal health
1 through 5
6
7
8
9, 10
6.0
6.3
22.6
40.0
23.8
2.9
5.9
21.7
46.9
22.6
7.3
10.8
27.5
36.3
18.1
visited the cinema last year
Yes
No
No
48.6
51.4
51.4
53.5
46.5
46.5
38.4
61.6
61.6
visited the theater last year
Yes
Yes
No
No
31.7
31.7
68.3
68.3
38.7
38.7
61.3
61.3
45.3
45.3
54.7
54.7
victim of a burglary
Yes
Yes
No
No
16.4
16.4
83.6
83.6
18.4
18.4
81.2
81.2
22.8
22.8
77.2
77.2
sometimes afraid at home
Yes
Yes
No
8.2
8.2
91.8
8.0
8.0
92.0
7.5
7.5
92.5
4
sometimes afraid on the street
Yes
No
9.5
90.5
10.8
89.2
12.2
87.8
5
1. The production process
The newly developed interview system of CentERdata uses the internet for interviewing. The
respondents fill in their questionnaires using a website. This interview system makes it
possible to follow the steps a respondent takes in real-time. As soon as they respond, their
answer is known. The moment they encounter a problem, CentERdata is aware of it. This
makes it possible to give online support during a questionnaire. CentERdata aims at a system
where almost all of the problems are solved online. This system does not only save costs but is
also a great step forward in supporting the respondent.
The system of weekly interviewing is more complex than one might think at first glance.
Usually, each week more than one project is run. Sometimes, response is needed on
questionnaires of previous weeks by those respondents who lagged behind. This requires an
advanced selection system which assigns weekly the right questionnaires to the panel
members. This weekly selection now is also made through the internet. The survey research
division makes the selection by filling in a form on a website, thus deciding which respondent
receives which questionnaires. The selection is saved in a selection database, where all the
selections are stored. Some of the background information of the respondents is also stored in
a database called the household database. The use of databases makes it possible to make more
complex selections. Selections can for example been made on the base of response behaviour,
formerly filled in questionnaires, geographical variables, income, number of children and so
on. More complex selections can be made in cooperation with the system manager. All the
selections (also the selection made by the survey research division on internet) are completed
by using SQL-statements on the CentERdata databases.
The answers of the respondents are also stored in databases. The moment the respondent gives
an answer to a questionnaire, the answer is stored in an database at CentERdata. This makes it
possible to view the results of a questionnaire in real-time. These results can be published to
the internet at the same time. It is possible to make a press release the weekend before the
questionnaire is held. This press release should then contain a small explanation of the survey
and an internet address of the place where the results can be found. CentERdata uses a
dynamic way of publishing her information to the internet, so a graphical reflection of the
collected data (collected so far) can be made. This way of publishing data is unique. The press
or other interested parties can be made aware of the survey before the data collection has even
started. They can follow in real time the results building up and use them when they are
satisfied that a sufficient number of panel members has responded.
As mentioned before, CentERdata is concerned by the question of representativity. Not all
respondents have an internet connection at their disposal. These respondents are provided with
a so called settop box. This ‘box’ makes it possible to connect to the internet by using a
telephone line, a television and a cordless keyboard. By pressing a button on this keyboard, the
connection to the internet is made and the CentERdata questionnaire website appears. Some of
the respondents may not even know they are connected to the internet. They are just filling in
their questionnaire and after they completed their questionnaire, the settop box is shut down.
There is no need to be familiar with the internet in any way to fill in a questionnaire.
6
2. The role of Blaise
CentERdata uses Blaise for her interviewing. The newly developed Blaise for Internet system
makes it possible to make questionnaires through the internet. There are currently three options
to fill in a questionnaire.
1.
1 The offline version. With this version a complete questionnaire can be made without a
connection to the internet. A connection is made once, the questionnaire is loaded and the
questionnaire can be made. After the questionnaire is completed, a connection to the
internet is made to send the answers back.
2.
The online version. By using this package, a respondent stays online with the internet. A
more complex questionnaire can be made by using this version of Blaise for Internet.
3.
The last version is a combination of the online and offline version. This version is cost
efficient when large parts of the questionnaire are simple, but a few complex lookups or
decisions have to be taken.
The HTML code the Blaise for Internet package delivers to a web browser is rather complex.
CentERdata experienced a number of problems using the package on the newly bought settop
boxes. For example, the Blaise for Internet package uses a version of javascript that the settop
boxes couldn’t understand. This problem has nothing to do with the quality of the Blaise
package. The settop boxes are just not complex enough for the job. This, together with a
problem concerning the identification of the respondent while filling in a questionnaire, made
it necessary for CentERdata to develop a communication program in between the settop box
and Blaise for Internet. The HTML code which is delivered to the communication program by
Blaise for Internet is translated into HTML code which is understandable for the settop box
and the information from the settop-box is made understandable for the Blaise for Internet
package. Nothing was changed to the Blaise package, not by CentERdata and not by the CBS.
The layout of the questionnaire is very important to CentERdata. Our respondents are familiar
with a certain layout. By the transition of the former interview system to the Blaise for Internet
system, it was our goal to use a rather similar layout. The modelib editor makes it possible to
design your own layout with a questionnaire. Due to the problems with the settop boxes and
the communication program CentERdata had to build, all the layout elements are now handled
in this program. The current layout is illustrated in the following figures
7
8
1. Two examples
5.1 The CentER Savings Survey
The CentER Savings Survey (in short: the CSS) is a panel survey that started in 1993. Each
year, financial data are collected with 2000 households of the CentERpanel. The data contain
information about work, pensions, accommodation, mortgages, income, assets, liabilities,
health, perception of the personal financial situation, perception of risks, and much more. The
data are unique because with these data it is possible to research both economic and
psychological aspects of saving behavior. The CSS consists of five questionnaires:
Work and Pensions
Accommodation and Mortgages
Income and Health
Assets and Liabilities
Economic and Psychological Concepts
We will focus on the questionnaire on assets and liabilities, the most complex of these five.
Assets and liabilities are measured in a very detailed way. Assets are investigated by
distinguishing over 20 different asset components. Liabilities are divided into eight
components (see table 2). In this questionnaire we assess the total value associated with each
asset component, the (financial) institutions, the name of the product, the term, the interest
rate, etc. The questions with respect to liabilities are similar.
Table 2. Overview of asset and liability components
assets
checking accounts
employer-sponsored savings plans
savings accounts linked to a Postbank account
savings and deposit accounts
deposit books
savings certificates
single-premium annuity insurance policies and annuities
savings or endowment insurance policies
growth funds
mutual funds or mutual fund accounts
(mortgage) bonds
shares
liabilities
private loans
extended lines of credit
debts based on payment by installment etc.
debts with mail order firms etc.
put options bought
put options written
call options bought
call options written
real estate
cars
motorbikes
boats
caravans
money lent out to family or friends
other assets
loans to family or friends
study loans
credit card debts
debts not mentioned before
9
In order to improve the quality of the data collection we will pay attention to the following
topics
1.
2.
3.
the use of a help function to explain financial terms
providing overviews
using data gathered in earlier waves
5.1.1 Help function
The questionnaire on assets and liablitities contains many financial terms that require
explanation to the respondents. Terms like ‘annuity insurance’, ‘single-premium insurance’,
‘endowment insurance policies’, ‘growth funds’ may not all be clear to the respondent. We use
HTML anchor tags to provide the help texts. In the Bliase questionnaire we define local
variables that we will use for variable text fills. The local variables contain anchor tags, so that
the internet browser will show the financial term underlined, allowing the respondent to click
on the financial term and get the help text. In Blaise we need the following code:
LOCALS
TxtGrowthFund: STRING;
FIELDS
Bank “With which bank or financial institution did you make the investment with your
^TxtGrowthFund?”:
TBank
Name “What is the name of your ^TxtGrowthFund?” : Tname;
Value “How much was the value of the investment with your ^TxtGrowthFund on 31
December 1999?”:
TEigth9s;
RULES
TxtGrowthFund:= ‘<A HREF=css.php?state=help&item=‘‘growth fund’’>growth
fund</A>
Bank
Name
Value
When filling out the questionnaire, the internet browser will display the text of the question
Bank as: ‘With which bank or financial institution did you make the investment with your
growth fund?’. If the respondent clicks the term ‘growth fund’ the internet browser will display
the page: css.php?state=help&item=‘growth fund’. This page (HTML file) containing the
help text is generated by PHP. The file ‘css.php’ may look as follows (we added some extra
code for showing overviews which we will discuss later):
<?
$HelpArray = array();
10
$HelpArray[‘growth fund’] = “<B>Growth funds</B> are investment funds that do not pay
out interest or dividends, but invest their returns in the fund itself. In this way, no income tax
has to be paid on the returns.”;
$HelpArray[‘annuity insurance’] = “By taking out <B>annuity insurance</B> the insured is
function ShowHelp($arg_item){
global HelpArray;
echo $HelpArray[$arg_item];
echo “<BR><BR>\n”;
echo “<A HREF=javascript:history.back()>Return to the questionnaire</A>\n”
}
function ShowOverview(…){
…
}
/* MAIN */
echo “<HTML>\n”;
echo “<HEAD><TITLE>CentER Savings Survey</TITLE></HEAD>\n”;
BGCOLOR=\”#D3F4E9\”>\n”;
switch ($state) {
case “overview”:
ShowOverview(…);
break;
case “help”:
ShowHelp($item);
break;
}
echo “</BODY>”;
echo “</HTML>”;
?>
5.1.2.Providing overviews
Filling out the questionnaire on assets and liabilities is not an easy task for a respondent. He
may easily loose track of the assets that she already reported or did not yet report. It is
therefore important to provide overviews. Providing overviews is desirable, but not a
straightforward task in the internet version of Blaise. The usual way to construct overviews in
11
Blaise is to use table questions, but the table layout is not supported in the internet version.
Therefore we use PHP in order to provide these overviews. In Blaise the code for a question
Check that allows the respondent to get an overview, may look as follows:
FIELDS
TableGrowthFunds: TTableGrowthFunds;
AUXFIELDS
Check “Please click the button and check the growth funds that you reported!
@/<FORM ACTION=css.php METHOD=post>
@/<INPUT TYPE=hidden NAME=state VALUE= ““overview””>
@/<INPUT TYPE=hidden NAME=asset_component VALUE= ““growth funds””>
@/<INPUT TYPE=hidden NAME=column_header1 VALUE= ““bank””>
@/<INPUT TYPE=hidden NAME=column_header2 VALUE= ““name””>
@/<INPUT TYPE=hidden NAME=column_header3 VALUE= ““value””>
@/<INPUT TYPE=hidden NAME=column1[] VALUE=
““TableGrowthFunds.Row[1].bank””>
…
@/<INPUT TYPE=hidden NAME=column1[] VALUE=
““TableGrowthFunds.Row[10].bank””>
@/<INPUT TYPE=hidden NAME=column2[] VALUE=
““TableGrowthFunds.Row[1].name””>
…
@/<INPUT TYPE=hidden NAME=column2[] VALUE=
““TableGrowthFunds.Row[10].name””>
@/<INPUT TYPE=hidden NAME=column3[] VALUE=
““TableGrowthFunds.Row[1].value””>
@/<INPUT TYPE=hidden NAME=column3[] VALUE=
““TableGrowthFunds.Row[10].value””>
@/<INPUT TYPE=submit VALUE=Show overview>
@/
@/Is everything correct?”: TYesNo;
In the internet browser the question Check will appear as:
Please click the button and check the growth funds that you reported!
Show overview
Is everything correct?
12
The action of showing the overview is laid down in the file ‘css.php’. We define the function
ShowOverview as follows:
function ShowOverview($arg_asset_component,
$arg_column_header1, $arg_column_header2, $arg_column_heade3,
$arg_column1,$arg_column2 ,$arg_column3) {
echo "These are the $arg_asset_component you reported:<BR>\n";
echo "<TABLE>\n";
echo "<TR><TD><B>$arg_column_header1</B></TD>”;
echo "<TD><B>$arg_column_header2</B></TD>”;
echo "<TD><B>$arg_column_header3</B></TD></TR>";
$counter = 0;
$endcounter = 0;
while($counter < 10):
if ($arg_column1[$counter] == ""):
else:
echo "<TR><TD>$arg_column1[$counter]</TD>";
echo "<TD>$arg_column2[$counter]</TD>";
echo "<TD>$arg_column3[$counter]</TD></TR>";
endif;
$counter += 1;
endwhile;
echo "</TABLE>\n";
echo “<A HREF=javascript:history.back()>Return to the questionnaire</A>\n”
}
In the internet browser the overview of the growth funds will appear as:
These are the growth funds you reported:
bank
name
value
ABN-AMRO All Dollar Bond Fund
12345
ING Bank
ING Bank Rente Groeifonds 67890
Return to the questionnaire
5.1.3. Using data that were gathered in an earlier wave.
The CSS is a panel survey where the five questonnaires are administered every year. It is our
experience that the respondents do not find it easy to fill out the questionnaires. This is
especially true for the questionnaire on assets and liabilities: there is a high burden in filling
out all the detailed questions on all the different asset components. Things get even worse for
those components that were reported earlier and have changed little (or not at all) since the
last time. For those components it seems reasonable to provide the respondent with the data
13
that they reported earlier and ask till what extend the information changed. In order to include
the previous data we read all the previous answers into the ‘external’ PreviousData. This is
done as follows:
DATAMODEL Assets;
USES Assets;
PRIMARY Ident;
EXTERNALS PreviousData : Assets ('previousdata\assets'); {a local path that contains
previous data}
AUXFIELDS
PreviousDataExists "Previous data available?" : TYesNo;
FIELDS
Ident: TNine9s;
RULES
Ident;
PreviousDataExists.Keep;
IF (Ident <>EMPTY) AND (PreviousDataExists = EMPTY) THEN
IF PreviousData.Search(Ident) THEN
PreviousDataExists:= yes;
PreviousData.READ
ELSE
PreviousDataExists:= no;
ENDIF
ENDIF
PreviousDataExists.SHOW
Having previous data at our disposal, we still have to decide on the amount of feedback we
want to give the respondent, and on the reactions we allow the respondent to give. In the
example below we provide the respondent all available information. Furthermore we allow the
respondent either to change all answers, to only change the value of the growth fund, or to
state that nothing has changed.
TYPE
TStillOwn =
Yes_nothing_changed "Yes, and nothing changed",
Yes_value_changed "Yes,but the value changed",
Yes_more_changed "Yes, but some properties changed",
No "No, I don’t have it any more");
AUXFIELDS
StillOwn "Last time you reported a ^TxtGrowthFund called ^Name with the ^Bank, and you
reported
that its value was ^Value. Do you still own it?: TStillOwn;
14
FIELDS
Bank “With which bank or financial institution did you make the investment with your
^TxtGrowthFund?”:
TBank
Name “What is the name of your ^TxtGrowthFund?” : Tname;
Value “How much was the value of the investment with your ^TxtGrowthFund on 31
December 1999?”:
TEigth9s;
RULES
IF (PreviousDataExists=Yes)
THEN
Bank:= PreviousData.Bank
Name:= PreviousData.Name
Value:= PreviousData.Value
StillOwn;
ENDIF;
IF (StillOwn=Yes_nothing_changed) OR (StillOwn=Yes_value_changed) THEN
Bank.Show; Name.Show
ELSEIF (StillOwn=Yes_more_Changed) OR (PreviousDataExists=no) THEN
Bank; Name
ENDIF
IF (StillOwn=Yes_nothing_changed) THEN
Value.Show;
ELSEIF (StillOwn IN [Yes_valueChanged, Yes_more_Changed]) OR
(PreviousDataExists=no)) THEN
Value;
ENDIF
5.2 The innovation survey
The innovation survey is an example of a set of processes which are followed on a monthly
basis. Each process is the introduction of a new product to the market. Consumer behaviour is
modeled in the following way. With regard to each of the products the consumer finds himself
in one of the following states
0.
1.
2.
3.
4.
5.
6.
7.
never heard of the product
knows the name of the product and is able to classify the product
has some interest in the product (does not rule out the possibility that he may buy)
has knowledge of the product (and is able to compare with similar products)
has a positive intention to buy
has tried the product
has adopted the product (buys it on a regular basis); this does not apply to financial
products
has rejected the product, will never buy it (again)
15
The flow of the meaasurement cycle is basically as follows:
-
when measurements are made with respect to a new product, alle respondents start in the
initial state 0 To determine whether the respondent knows a product the following
question is asked
_______________________________________________________________________
Hear: "Below you see a list of product names. Of which of these product have you heard
and do you know waht product it is? (don’t click on it when you know the name but not
the product type. You may click on more than one name”: SET OF
(a1 "Life Mortgage,
a2 "Stock Mortgage",
a3 "Combination Fund",
a4 "Termijnkoopsompolis",
a5 "Linear Mortgage",
a6 "Education Insurance",
a7 "Growth Power",
a8 "Spavings Certificate",
a9 "European Equity Fund",
a10 "Clickfund",
a11 "Saving Stocks",
a12 "Capital Raiser",
a13 "Pure Gold",
a14 "Annuities Mortgage",
a15 "Fortune Fund",
a16 "NONE of the above");
______________________________________________________________________
Some of the products are fake products; only three of them are of interest and cause
follow up questions when clicked
-
in each wave, the transitions from one wave to another are registered. For state 3,
knowledge of the product, this question is
_______________________________________________________________________
Know “Do you know in what respects the Education Insurance is different from
comparable products?”: ARRAY [1..4] OF (no, yes)
_______________________________________________________________________
-
when a new state is entered, the respondents answers questions which are associated to
this state. For state 5, trial, the following question is asked
Buy "Is the Stock Mortgage only in your name or (also) in the name of someone else?”:
ARRAY[1..4] OF (a1 “only in my name", a2 "(also) in the name of someone else (spouse,
family, friends)")
-
for each of the products, the states in which the respondents finish the questionnaires are
stored; in the next wave (usually one month later), the states are retrieved and serve as a
starting point for the interview
16
_______________________________________________________________________
USES WriteVar 'writevar';
EXTERNALS WriteFile: WriteVar('savenn');
FOR i:=1 TO 4 DO Mod1[i]:= WriteFile.Mod1[i] ENDDO;
FOR i:=1 TO 4 DO Mod2[i]:= WriteFile.Mod2[i] ENDDO;
FOR i:=1 TO 4 DO Mod3[i]:= WriteFile.Mod3[i] ENDDO;
FOR i:=1 TO 4 DO Mod4[i]:= WriteFile.Mod4[i] ENDDO;
FOR i:=1 TO 4 DO Mod4a[i]:= WriteFile.Mod4a[i] ENDDO;
FOR i:=1 TO 4 DO Mod5[i]:= WriteFile.Mod5[i] ENDDO;
FOR i:=1 TO 4 DO Mod6[i]:= WriteFile.Mod6[i] ENDDO;
FOR i:=1 TO 4 DO Mod7[i]:= WriteFile.Mod7[i] ENDDO;
FOR i:=1 TO 4 DO Mod8[i]:= WriteFile.Mod8[i] ENDDO;
_______________________________________________________________________
-
The states 6 and 7 serve as terminal states. When a respondent enters state 6 or 7 he will
not be questioned about the product again. For financial products, state 5 replaces state 6
as terminal state.
The result of this procedure is a database in which invaluable information is stored about the
course of different product innovations. It shows where problems arise in marketing, how
communication in different media yields different results, which role the strengths and
weaknesses of each product play and at what rates products are adopted by different target
groups.
6. Conclusion
The combination of new the production system of CentERdata and the programming power of
Blaise brings household data collection to the current internet standards, without loosing the
long established scientific standards. Key ingredients are
1.
2.
3.
a respresentative household panel
an interface between Blaise and HTML
easy database maintenance with the procedures that come with Blaise
It is to be expected that in the near future, when internet hardware is improved and new and
better software is available, internet interviewing will become even more attractive, both for
data collectors and respondents.
Session 4
Special Applications in Blaise
Audit Trails or How to Display Arabic Text in Blaise
Leif Bochis, Statistics Denmark
Blaise generator for High speed data entry applications
Pavle Kozjek, Statistics Slovenia
ManiTabs: Making tabulations in Ms-EXCEL with Manipula
Tjeerd Jellema
Blaise and API
Steve Anderson, ONS
Audit Trails Or How To Display Arabic Text in Blaise
Leif Bochis
Statistics Denmark
Abstract
Audit trails is a feature in Blaise 4 which is very useful for - as stated in the Developers's Guide methodological research of questionnaires, analysis of interviewers' use of the system, debugging of
Blaise code and backup/recovery.
The core of the audit trail mechanism is a sort of 'event trigger' where each kind of event causes a call to
an external procedure defined in a DLL. These DLL procedures may be programmed to do exactly what
may be the actual need for such an audit trail.
Because the audit trail mechanism is implemented in such a general way it allows the programmer to
exploit the information from this event trigger in various ways and for various purposes.
This paper describes an example of passing information from the audit trail event trigger to an other
program which in turn displays supplementary information in a separate window - in this example field
texts and answer texts in Persian for a multi language survey.
Immigrant Surveys in Statistics Denmark
From autumn 1998 to summer 1999 Statistics Denmark carried out series of interviews on a number of
studies of immigrants in Denmark.
The largest of the surveys was carried out in a number of steps:
1. An initial pilot study in CATI, in order to test and refine the questionnaire - carried out in October
1998.
2. A CATI survey carried out from the end of November 1998 until June 1999.
3. Supplementary CAPI interviewing in order to raise the response rate for groups difficult to catch by
telephone - carried out April to June 1999.
The respondents were a sample from major immigrant nationalities to Denmark from outside
Scandinavia, i.e. immigrants and descendants of immigrants from among other countries Lebanon, Iran
and Vietnam.
A Blaise III solution
Some of the important questions concerned language skills of the respondents and it was decided that the
respondents should be interviewed in Danish if possible, otherwise in their own language if applicable, or
in English as a third alternative.
In other words, the interviewers should be able to change interview language at contact, which led to the
decision to use Blaise III as the interviewing tool, because of its capability to handle a number of
interviewing languages that could be changed on the fly. At the time Blaise 2.5 was the tool used by the
interviewing section of Statistics Denmark, but as we had to hire interviewers capable of interviewing in
Danish as well as the relevant languages for this survey, we could start this survey just training these
specific interviewers in Blaise III usage.
Blaise 4 was too young to be a realistic alternative at that time.
Because of very short time to develop the instruments, we had no time to prepare our system to use the
relevant Dos codepages for the selected language, but by removing some diacritical symbols from the
translated texts it was possible to include for example the languages Polish, Serbo Croatian and Somali in
the list of languages available on the screen. Arabic, Farsi and Vietnamese, however, had to be read up by
the CATI-interviewers from a print-out next to the screen. It was a somewhat awkward solution, but the quite few - interviewers soon learned to translate on the fly, so the problems with this solution almost
disappeared in a couple of weeks.
A possible Blaise 4 solution
At the Blaise Conference in Lillehammer (November 1998 - between the Pilot Study and Real
Interviewing), I got a couple of ideas of how to do this in a more professional manner using Blaise 4
Windows. There was too short time after the conference to get a solution ready for the CATI Survey (and
to get assured that Blaise 4 was mature), but still some time to get it ready for the scheduled CAPI Survey.
The main goals were :
− get the translated texts in Arabic, Farsi and Vietnamese in a machine-readable form
− get a way to display it on the screen
− get a way to make Blaise display it on the screen
Choosing Arabic Font
Arabic and Farsi are written with the Arabic alphabet - a number of fonts are available on the Internet
supporting the number of codepages defined for the Arabic alphabet. The choice was a proportional
Windows TrueType Font, which could be used for Arabic as well as Farsi. The chosen font also
comprised the Latin alphabet (letters from A to Z).
As some of the questions referred to specific terms it was an advantage that these Danish terms could be
displayed as part of the question text.
The disadvantage of the chosen font was the missing of certain characters - such as special hamza
combinations.
Choosing efforts
We chose to concentrate on the Farsi questionnaire by several practical reasons.
The Arabic text was not available in a single machine-readable form, so this was dropped.
The vietnamese text was available as a Word document, but after a couple of tries, I gave up converting it
to a simple text file. Besides, the Vietnamese respondents were generally well-integrated, so only few of
them really needed to be interviewed in Vietnamese.
The Farsi text was available in a format which was possible to get hold of and a quite simple Pascal
program could scan the source and convert the contents into a simple text file format that matched the
chosen font.
Demands to the conversion program
The conversion program dealt with
− how to manage switching between left-to-right and right-to-left displaying (in some of the field texts
or answer texts short explanations in Danish were inserted in the Farsi text)
− the four Arabic presentation forms (the characters are different in shape decided by the position in the
word : In the beginning of the word, in the end, between other characters or alone - in Latin alphabets
you can compare these presentation forms with upper case and lower case)
− how to convert from an Arabic codepage in the original file into the codepage of the chosen font
With this approach it was possible to get a print-out from the Notepad text editor using the Persian Font,
which looked pretty much the same as the print-out from the Farsi word processor the translator used.
Making Blaise 4 Display Arabic Letters
In Blaise 4 it is possible to define alternative fonts to display field texts and answer texts - however:
Blaise 4 source files were compatible with Blaise III source files, so Blaise 4 source files are converted to
OEM when saved and converted to ANSI when read - I didn't dare to think of how to manage these
conversions of text files when applied on characters not defined in the two relevant character sets - and I
didn't even dream of how eventually to edit these characters!
So the solution was to use the Audit trail event trigger ...
What is the Blaise 4 Audit Trail ?
A generalized event trigger that leaves the actual event-caused actions to the user-defined functions
assigned to the events.
With this approach it is possible to use Delphi to design a supplementary window with a text display
control. The proper events triggered causes some text to be displayed through this control.
In this study only three of the defined controls were relevant:
− AuditTrailInitialization, used to initialize the system, i.e. read the Farsi text file into the arrays.
− AuditTrailEnterField, used to display the Farsi text relevant to the proper field.
− AuditTrailFinalization, used to close down the system.
Implementation of a Supplementary Window
The supplementary window should contain a few controls where the most important should be able to
display Farsi text, line by line, aligned to the right, using the chosen Persian Font.
We decided to use the built-in standard Rich Text Control. This Rich Text Control is able to display text
with a chosen font, alignment, size etc. The advantage of this choice was that we didn't need to develop a
tailored text display window so the actual text display control was developed in a very short time.
A text file containing the Farsi text
A few conventions for the text file was decided:
1. Every new field text was identified by a line starting with the characters ###.
2. The characters ### is followed by the full name of the field as it is delivered from the Audit Trail
Event trigger AuditEnterField.FieldName property.
3. Following a number of lines including the Farsi text, until
4. A new line starting with ### denotes the beginning of a new field.
See example in Appendix I.
The lines of Farsi text was produced by the conversion program automatically in such a way that a text
was split after 80 characters (the first space met after character no. 80 produced a line split). It was done
this way in lack of a Windows control that was able to display left-directional text and manage line shifts
by itself. With a maximum of slightly more than 80 characters per line the Farsi text almost filled the
screen width at a 800x600 resolution, and therefore the text could be displayed quite properly by the
standard Rich Text Control, using the Persian font and right-aligned.
A list of field names were produced by a Cameleon script and were merged into the field texts manually.
After this followed some minor editing of the automatically produced field texts.
At the initialization of the 'Audit trail' - AuditTrailInitialization procedure - the text file was read into
memory in two arrays: One array holding the names of the fields, and the other holding the text lines (in
the earlier mentioned built-in Delphi-structure).
When the instrument enters a new field the AuditTrailEnterField procedure triggers the name of the field,
searches for it in the field names array and - if found - displays the corresponding Farsi text in the Rich
Text Control in the Supplementary Window.
The data structure could be more refined, but as it worked very fast in the test, there wasn't really a need
for it in this study.
Overview
Datamodel
Configurationfile
Normal
Dep
window
dep
Audit trail
event trigger
Farsi text file
Supplemt.
window
Arabic.dll
The Blaise instrument
The instrument was prepared using Blaise III, and while Blaise III and Blaise 4 was able of sharing the
datafiles, we left the interviewers the choice of selecting the preferred tool - actually it was a standard
installation, so every interviewer had the choice to select either Blaise III or Blaise 4 version.
The three Farsi-speaking interviewers, however, were already used to translation on the fly, so they didn't
really need the solution - and in practical interviewing they just carried out using the tool they were used
to.
Conclusions
Though the system was not used in practical interviewing, the study showed that it was possible to exploit
the Audit Trail mechanism for these purposes, and to make a workable solution that way.
Lot of things could be refined, the DLL could easily be made more general in order to dynamically select
a language, a font and a text file - either on request by the user or for the particular user select the proper
values from the Registry or Environment variables.
Sparse tries in Blaise 4.3 shows that when there is no OEM-ANSI conversion involved it is possible to fill
the text right into the Datamodel source the same way as the other languages, so if the proper text can be
represented by a suited font, there is no need to keep it and edit it separate. However, the font selection
capabilities of Blaise 4.3 still lacks the property Alignment.
Though we probably won't need this way to display Arabic text again, the study was good to get an
overview of the large potentials of the Blaise 4 Audit Trail mechanism - and to learn the characteristics of
the Arabic Alphabet.
References
Blaise 4.1 Developers' Guide, Chapter 5.6 Audit Trail, pp.282-293
APPENDIX I : Farsi.txt-sample:
###SpSkema.Blok01.Spm01i
ö‘ð¢÷û‘÷• ø öþ¤›‘úõ ) ö‘þ›¤‘¡ á‘®ø• ¥ • ë þì Ÿ— ø ü¨¤¤“ ñ‘Ÿ¤¢ õ÷• ¢ ¤‘õ o¤• ¢•
ñ‘¨¤• ö‘— þ•¤“ « ø¬¡ öþ• ¤ ¢ ý• ùõ‘÷ ü𥠑—“ ‘õ .¢ª ‘“þõ õ÷• ¢ ¤¢ ‘ú÷ ü ð¢÷¥ oøŸ÷ ø (
‘õª «¡ª ‘“ •¤ ù“Ÿ‘¬õ öþ• ‘— ô þóþ‘õ ‘õ •¤ ùî –¨• ù—ê¤ ù¤‘ª • ö ¤ ¢ ùî ôþ• ù—ª • ¢
.¢þ‘õ÷ üõ öþõ®— •¤ ‘ õª ö¢÷‘õ §‘÷ª ‘÷ Š ü—‘ì þì Ÿ— ¤‘î ø ü¨¤¤“ öþ• ù÷øð ø ôþª ‘“ ù—ª • ¢
ü—‘õ¢ì õ –ò• ¸Þ
: • – õ¨ì
¥ ‘è ¢þ ü õ ö ¥ • ùî ý¤øª î ø ö‘“¥ o¤‘“ ¤¢ ñ• ¸Þ¢÷• ‘“ •¤
ù“Ÿ‘¬õ ö‘— ù¥ ‘›• ‘“ ö õ
.ô÷îþõ
###SpSkema.Blok01.Spm01
Œ¢¤þ£ • –¤ø¬ ‘õª ‘“ ù“Ÿ‘¬õ öþ• ùî ¢þóþ‘õ ü÷‘“¥ ù ù“ -•
•
ü“¤ä
‚
üõ÷• ¢
ƒ
ü¨þóð÷•
„
ü¨¤‘ê
… ü÷‘—¨úó
†
ü—• ø¤î Š ü“¤¬
‡
üŽ‘ þó‘õø¨
ˆ
ü
‰ ü“‘›÷• /ø¢¤•
•
üõ‘÷—þø
###SpSkema.Blok01.Spm05
ü“û£ õ ‘þ ø ü÷‘“¥ à‘Ÿó ¥ • ù ) ü õøì –þóì • í þä¥ › ö‘— öúþõ ¤¢ ‘õª o¢• ø÷‘¡ / ‘õª ‘þ-…
Œ¢þ—ê¤ üõ ¤‘õª ù“ (
•
ý¤
‚
ù÷
###SpSkema.Blok01.Spm06
.....................¢þÞ‘õ¤ê ¤î£ ‘ê¯ ó Œ–þóì • ô• ¢î ù“ ý¤ ¤ ð• -†
APPENDIX II : Delphi program
library Arabic;
uses
SysUtils,
DepAudit in 'DepAudit.pas',
Forms,
Unit1 in 'Unit1.pas'{Form1};
procedure AuditTrailInitialization(const AuditInitialization: TAuditInitialization); export; stdcall;
begin
Application.CreateForm(TForm1, Form1);
Form1.Show;
end;
procedure AuditTrailFinalization(const AuditFinalization: TAuditFinalization); export; stdcall;
begin
Form1.RichEdit1.Clear; Form1.RichEdit1.Free; Form1.Close;
end;
procedure AuditTrailEnterField(const AuditEnterField: TAuditEnterField); export; stdcall;
var s: String;
begin
Form1.FormUpdate(AuditEnterField.FieldName);
end;
{*** dummy procedures, defined for compatibility reasons only ***}
procedure AuditTrailLeaveField(const AuditLeaveField: TAuditLeaveField); export; stdcall;begin end;
procedure AuditTrailAction(const AuditAction: TAuditAction); export; stdcall; begin end;
procedure AuditTrailEnterForm(const AuditEnterForm: TAuditEnterForm); export;stdcall;begin end;
procedure AuditTrailLeaveForm(const AuditLeaveForm: TAuditLeaveForm); export;stdcall;begin end;
exports
AuditTrailInitialization
AuditTrailFinalization
AuditTrailLeaveField
AuditTrailEnterField
AuditTrailAction
AuditTrailEnterForm
AuditTrailLeaveForm
begin
end.
index 1,
index 2,
index 3,
index 4,
index 5,
index 6,
index 7;
unit Unit1;
interface
uses
Windows, Messages, SysUtils, Classes, Graphics, Controls, Forms, Dialogs,
StdCtrls, ComCtrls, Menus;
type
TForm1 = class(TForm)
RichEdit1: TRichEdit;
Label1: TLabel;
procedure FormCreate(Sender: TObject);
private
{ Private declarations }
public
{ Public declarations }
procedure FormUpdate(SpmNavn : PChar);
end;
const
MaxEntries = 200;
MaxTxtLng = 2000;
var
Form1: TForm1;
F : Text;
FeltNavn : array [1..MaxEntries] of PChar;
FeltIndh : array [1..MaxEntries] of PChar;
NofEntries : Integer;
implementation
{$R *.DFM}
procedure TForm1.FormCreate(Sender: TObject);
var
i : integer;
S : String;
P1 : PChar;
atmp : array [0..MaxTxtLng] of char;
atmp2 : array [0..100] of char;
function Kopier (st : String) : PChar;
var
A : array [0..MaxTxtLng] of char;
P : PChar;
begin
A:='';
P := StrPCopy(A, St);
Result := StrNew(P);
end;
begin
Label1.Caption := 'Spørgsmålsnavn';
AssignFile(F, 'farsi.txt');
{* This ought to be defined somewhere else, but never mind now! *}
reset(F);
i:=0;
NofEntries:=0;
while not eof(F) do
begin
readln(F, S);
if Copy(S, 1, 3) = '###' then
begin
if i>0 then FeltIndh[i] := StrNew(atmp);
i:=i+1;
FeltNavn[i] := Kopier( Copy(S,4,Length(S)) );
atmp :='';
FeltIndh[i] := atmp;
end
else
begin
P1:= StrPCopy(atmp2, S + Chr($0D) + Chr($0A) );
FeltIndh[i] := StrCat(atmp, P1);
end;
end;
FeltIndh[i] := StrNew(atmp);
NofEntries:=i;
CloseFile(F);
end;
function FindIndhold (FieldName : PChar): PChar;
var
i : integer;
S : PChar;
begin
S:=''; i:=0;
repeat
i:=i+1;
if StrComp(FeltNavn[i], FieldName) = 0 then S := FeltIndh[i];
until (i >= NofEntries) or ( StrLen(S) > 0 );
if StrLen(S) = 0 then FindIndhold := 'Kun dansk tekst til dette spoergsmaal!'
else FindIndhold := S;
end;
procedure TForm1.FormUpdate(SpmNavn : PChar);
var Navn : String;
i : integer;
P : PChar;
begin
Navn:='';
for i:=0 to StrLen(SpmNavn)-1 do
if SpmNavn[i] in ['0'..'9']
then
Navn:=Navn + Chr(Ord(SpmNavn[i]) + $50)
else
Navn:=Navn + SpmNavn[i];
Label1.Caption := Navn;
with RichEdit1 do
begin
P := FindIndhold(SpmNavn);
Text := P;
end;
end;
end.
6th INTERNATIONAL BLAISE USERS' CONFERENCE 2000
CORK, May 2000
Blaise Generator for hi-speed data entry applications
by
Pavle Kozjek
Statistical Office of the Republic of Slovenia
1. Introduction
Modern theories of statistical survey processing consider hi-speed ("heads down") data entry mainly as
a little bit old-fashioned. In the survey process it's been replaced by recent methods ant techniques, like
CAI, EDI and internet data collection. However, in practice many statistical offices still have to deal
with hi-speed data entry from paper forms without (or with minimum) data checking at the time of data
entry. Usually it is organised on a mainframe platform, but using the systems like Blaise it can be
supported on a LAN platform as well.
At the Statistical Office of the Republic of Slovenia there's still a large amount of data entered by a
dedicated package for hi-speed data entry on a mainframe platform. The system is out-of-date and need
to be replaced, so a new solution on a LAN Windows NT platform was developed. With the new
generator (written in Blaise 4 Windows and Visual Basic), end-users can produce (on a basis of paper
documentation) hi-speed data entry applications without developer's help.
New solution is based on existing methodology and documentation, and can be integrated in the
existing survey process by mixing mainframe and LAN platform. At the same time it sets some basic
standards and prepares ground for the redefined survey process that completely takes place on a LAN
platform.
2. Reasons for development
Statistical Office of the Republic of Slovenia (SORS) is a centrally organised statistical office. Already
early in 70's SORS started to explore the possibilities of building up a statistical system based on
registers, and today this strategy is continued.
However, there's still a large amount of survey data collected on paper forms using traditional mailout mailback method. One reason for relatively large batches of forms is complete coverage of population
in many surveys. In some cases it is necessary, in other cases we need to introduce sampling methods.
Another reason is growing number of surveys. New developments mainly make use of CAI and EDI
methods and techniques, but the major part of surveys (especially from economic area) still report on a
paper forms. A part of this data is captured by OCR, and the rest by hi-speed data entry. Although the
share of data entered "heads down" is slowly decreasing, a reliable support for that kind of data entry
should be obtained.
1
The existing system DCR 5000 (Data Capture & Retrieval) is a specialised hi-speed data entry software
package that runs on the Unisys U Series product line (Unix operating system). The main reasons for
replacing the system are: old and unreliable HW equipment, maintenance problems and poor
compatibility with the new SORS information system infrastructure, based on a LAN Windows NT
environment. A part of the old system was also not Y2K compliant (a rough-and-ready solution was
found), so the basic functions of a new system had to be ready by the year 2000, to take over the
production in case of Y2K problems.
Since Blaise supports most of SORS new developments on survey data entry, the Blaise system was a
logical choice to support the new hi-speed data entry solution as well.
3. Building up the generator
Preparing replacement for the existing system was not an easy task. In general, the new system should
support all the functionality of the old solution, and possibly add some improvements. But on the other
hand, very small resources were available, and the system should not be too complex.
Development of generator would not be possible without some standards concerning data models.
Because of data storing, these standards were taken from mainframe and (although including many
restrictions) they were used as a guideline to define generator outputs. When entry is finished, final
Blaise database is converted to ASCII and transferred to the mainframe. Since mainframe archiving
system has limits in record length, one survey form is usually entered as a set of records of different
types.
The old DCR-5000 system is a highly specialised program package and years ago it was integrated in a
complete data capture-archiving-retrieval system on a mainframe. Data entrists are used to work on a
special keyboards, so with the new data entry solution also the new special programmable keyboards for
data entrists were obtained.
There was an important request, that users should be able to produce (on a basis of paper
documentation) data entry programs without the intervention of developers. Users were not expected to
write code, so generator was the solution. Data entry should be fast, and verification (double keying)
must be enabled.
The development of generator began in July 1999, using Blaise 4 Windows (version 4.1) and Manipula
for application development, and Visual Basic 5 for development of user interface. There was almost no
documentation about the existing application, so a permanent contact with people involved in an
existing production process was necessary.
Beside data models for entry and verification, generator produces many auxiliary Manipula setups to
support administration and control the process. Blaise and Manipula command line parameters were
widely used in development of user interface.
3. Main problems and solutions
One of the main problems was how to help and enable end-user to correctly define data model,
following the existing documentation. To support this, a special Blaise data model was defined, where
all the survey parameters, fields and specifications are entered. Each entry in this specification model
(key is unique survey code and version) defines a new generated data model for hi-speed data entry.
There are paper and on-line instructions available to the person who specifies the data model. In our
case supervisor (data entry administrator) is responsible for that task.
Next question: how should look the output of the generator -Blaise data model. Generated application
can not be (and don't need to be) a complex Blaise instrument. On the other hand, it has to fulfil the
general needs of surveys that use hi-speed data entry. Manipula reads the parameters from the
specification data model and writes the code for hi-speed entry with the following general structure:
2
DATAMODEL Survey
FIELDS
Field_1
--Field_ j
Record_Type: 1..i
BLOCK B[1]
B1Field_1
-- B1Field_m
ENDBLOCK {1}
--BLOCK B[i]
BiField_1
--BiField_n
ENDBLOCK {i}
RULES
Field_1
--Field_j
Record_Type
IF Record_Type = 1 THEN B[1] ENDIF
--IF Record_Type = i THEN B[i] ENDIF
ENDMODEL {Survey}
With this simple general structure, all data models of surveys that use hi-speed data entry are covered.
There are common (form-characteristic) fields on a first level and a number of different blocks on a
second level. Each block in a generated model represent a different record type. Final ASCII records,
produced by Manipula setup always consists by common fields, field that define form type and a
number of fields defined by that form type. Single level data model definition is also supported.
Most of the fields on a form level are usually SORS standard, so their specifications can be pre-defined
and imputed. A question was how to enable and support correct entry for the field "record type". This is
an important key field for generation of applications, but treated in a very different way in a different
surveys. Usually it need to be separated in two fields, to enable correct generation of data entry
application. Specifications (type, length etc) for the data fields in blocks are entered into the
specification model directly from the survey documentation. There are a few checks included, obtaining
correct positions of fields.
Another hard task for supervisor is how to define key fields of generated data model. Due to speed of
entry only the secondary keys are defined. Usually the key is composed of sequence or ID number of
form, and type of record. In the generator key definition is now supported and facilitated by presenting
all possibilities in a closed question.
All the hardest problems for supervisor when specifying data model (like specifying key fields and
fields for record type) were additionally explained to the supervisor.
Another problem was verification. Reference files are not a good solution, since response should be
immediate. The idea was to put both fields (for entry and verification) in the same data model. There
are only entry fields on the screen during the entry session, and only verification fields during
verification, which is based on time sequence of entered records. But this approach disables common
data base, so in the first step partial data bases (covering one batch of paper forms) are created and
verified, and in the second step they are merged in a common Blaise data base of a survey. Verification
process added a lot of administration, but seems to be inevitable if the entry is really hi-speed.
Final step is data transfer to the mainframe archiving system, so the rest of the process on mainframe
can remain unchanged. Storing ASCII data on a mainframe is certainly not an optimal solution: it
3
requires additional administration, and a part of information (metadata) is not used. We hope it is
temporary (until completely supported on LAN), but until that time it should be automated as much as
possible. Job control script for mainframe archiving system is generated on LAN and transferred
together with data, so data transfer can be controlled by the end-user as well. This part of a system has
only a basic functionality and is still under development.
Hi-speed data entry needs standard screen layout and standard commands. Both was discussed with
end-users and prepared in Blaise, using Modelib Editor and DEP Menu Manager. Combining these
tools and programmable keyboard, the work for data entrists didn't change very much. With a few
exceptions all the main commands have the same keys as before, and all commands are executable
without mouse.
Last version of generator uses Blaise 4.3 (build 4.3.2.436) and Visual Basic 5.
4. Preparing data entry application step by step
A new data entry application is defined and generated through VB "development" user interface that
integrates all the necessary interactive and batch processes. The interface is used by supervisor -data
entry administrator who specifies and generates data entry model. Another, different user interface is
prepared for "production" data entrists.
The user responsible for defining data model (supervisor) has to execute the following steps:
•
Step 1: Defining a new data model for hi-speed data entry. Supervisor enters all the necessary
specifications into Blaise data model for generation.
•
Step 2: Generating all applications. Before compiling, generated datamodels for data entry and
verification are presented on the screen (Blaise editor), so additional improvements can be made if
necessary.
•
Step 3: Testing in development environment. Complete process (entry, verification, creating final
data set, file transfer to mainframe) should be tested before it is implemented in production.
•
Step 4: Transfer of application files to the production environment (different folder on the same
server).
Before the production work starts, the application is shortly tested once again in production.
5. First experience
First application in production was one of monthly traffic surveys with only about 1000 records. No
serious problems were noticed and there are already some new data models defined. New system was in
general well accepted between end users. There are still some problems to be solved with verification,
which is more different compared to the old solution. It seems like we succeed to bring it close to the
end-user, but on the other hand this made the system more complex and more complicated to maintain.
We hope that the "balance" between users and developers tasks is still OK. To leave the process control
completely to the users, the administration still has to be improved.
6. Conclusions
In future, hi-speed data entry at SORS should be gradually replaced by recent data entry techniques,
which can be better integrated in a modern information systems. But while migrating to a LAN platform
and redesigning processes, an efficient solution to support traditional hi-speed data entry is necessary to
obtain the statistical production.
What did we get with the new application ? There are some answers:
• functionally seems to be a successful replacement for the old one
• it is flexible and well integrated in the SORS information system (and the future strategy)
4
•
•
Blaise application development is expanded (not just CAI) - in-house standardisation
generator can be used to support process, running completely on a LAN platform, so it is an
important step in the migration to the new environment
• it could serve as starting point for non-EDP people (or people who learn Blaise) when developing
data models
•
by adding checks, comments etc. generated data model can be used as conventional CAI
application
There are also some negative points: generator became relatively complicated to maintain (due to
verification module, special user's needs etc); we still don't know exactly how far we need to go with
administration and automation of the process. But in general we believe that our solution is a good
choice in the existing situation, and that it will contribute to the development and modernisation of the
survey processing system at SORS.
5
ManiTabs
Making tabulations in Ms-Excel with Manipula
T.R. Jellema
NAMES B.V.
Korte Raam 1A
2801WE Gouda
The Netherlands
[email protected]
HTTP:\\WWW.NAMESBV.NL
Abstract
Blaise datamodels and Manipula scripts have long had the capability to call DLL’s through the alien procedure interface. The
article explores the capabilities of Manipula alien procedures with regards to controlling OLE automation servers. As an
example we use a Manipula script that automates Microsoft Excel’s PivotTable in order to create cross tabulations.
Introduction
This article will illustrate for you the power and flexibility that you can obtain when you combine Blaise for Windows support
for ALIEN PROCEDURES with DLL’s that are OLE-Automation controllers. The subject matter is technical in nature as it
involves the combination of two programming techniques. However we feel that the potential benefits of the application of the
technique make it relevant to a wider audience.
The benefits of the technique are quite clear. In your Manipula/Maniplus scripts you can write statements that control other
programs. The control you obtain can be quite extensive. You can transfer data into and out of the target program and you can
issue commands to have the target program manipulate the data, or output it.
The technique is particularly relevant to offices that have invested heavily in the use of generic ‘Office’ software and require
reports, tables, charts etcetera to be prepared in products such as Excel and Word, and e-mail communication to be performed
by Exchange or Outlook. We list a few examples:
§
§
§
§
§
Sending data as e-mail using Ms-Outlook
Retrieving data from the e-mail system and placing it into Blaise datasets
Tabulation of data from Blaise data sets using MS-Excel or SPSS-Tables
Preparation of Charts using Ms-Excel or SPSS-Chart
Preparing printed reports or form letters using MS-Word instead of using PRINT-Section formatting
In this article we would like to show you a non-trivial example to illustrate the power of the technique. A particular useful
feature in MS-Excel is the pivot table. This allows you to interactively define tabulations on multidimensional data. The
pivottable is a good example to illustrate the technique because:
§
§
§
Ms-Excel is ubiquitous. Almost all statistical offices have standardised around Ms-Office, and each desktop will have a
copy of Ms-Excel. Many users will therefore be familiar with pivottables.
Pivottable are extremely user friendly.
Pivottables are extremely flexible and allow a high degree of customization.
Before proceeding with the Tabulation example, we first present the two building stones of the technique, Alien Procedures in
Manipula and OLE-Automation. For both techniques we include a complete example to illustrate that the actual amount of
effort in making these techniques is limited. Because we need to program DLL’s, it is inevitable that we present some Delphi
(=Pascal) source code. We will only show the essential parts that illustrate the technique as we cannot assume that you are
familiar with this development environment .
Alien Procedures
At the heart of the technique is Blaise/Manipula’s ability to call Windows DLL programs. DLL stands for Dynamic Link
Library. DLL’s are pieces of programs that are ready to be called by another program and only loaded when required. The
Blaise user manual describes the process of declaring and calling such programs.
You cannot just use any DLL however. The procedures that are exported from the DLL must adhere to a standard interface.
The interface is documented and implemented in a Delphi unit file called MANWDLLO.PAS that is distributed with the Blaise
system. This basically means that you will need to write your own DLL’s in order to use ALIEN PROCEDURES in Manipula.
You could write the DLL using Delphi (recommended by the Blaise team) or C++.
You would use DLL’s for problems that are difficult or impossible to solve using Manipula alone. You can use these DLL’s to
provide procedures that provide information about the computing environment, that perform certain complicated statistical
operations, or that interface into other programs.
In order to provide you with a simple example of what is involved in using DLL’s, below we present the Manipula definition of
an ALIEN PROCEDURE that shows a message dialog with three choices, Yes, No, Cancel and returns an integer value. For
those of you familiar with MANIPLUS this would provide an extension to the CONFIRM dialog. The DLL is called
‘MANIYNC.DLL’, and it contains the procedure ‘ConfirmCancel’
PROCEDURE ConfirmCancelDialog
PARAMETERS
IMPORT Msg : STRING
EXPORT iRes: INTEGER
ALIEN('MANIYNC','ConfirmCancel')
ENDPROCEDURE {ConfirmCancelDialog}
You would call this procedure in your MANIPULATE section as follows:
MANIPULATE
sMsg := 'Do you want to impute the results (Yes/No) or cancel the process '
iRes := 0;
ConfirmCancelDialog(sMsg,Ires)
Case ires of
0: Display('Returned Cancel',wait)
1: Display('Returned Yes',wait)
2: Display('Returned No',wait)
endcase
The implementation of the DLL requires a little Delphi programming. In defining the procedure in Delphi, you will need to
adhere to the definition in MANWDLLO.PAS. If you keep to the definitions, writing the procedure is simple. The
GetStringValue and SetIntegerValue procedures are used to move the data into and out of the procedure. The DLLInterface
parameter contains all of the information on the various parameters passed to the DLL procedure. If the parameters passed
conform to the required information then the parameter values are obtained, and a messagedialog is shown that has three
buttons. ([mbYes,mbNo,mbCancel]). The outcome is captured in the variable res, and transformed such that cancel = 0, yes = 1
and no = 2.
Procedure ShowYesNoCancelDialog(DLLInterface:TDLLParamsInfo);stdcall; export;
var
msg : string;
res : integer;
dllparam1,dllparam2 : tdllparameter;
begin
if dllinterface.getparametercount= 2 then
begin
dllparam1 := dllinterface.getparameter(0);
dllparam2 := dllinterface.getparameter(1);
msg := getstringvalue(dllparam1);
res := MessageDlg(msg,mtconfirmation,[mbyes,mbno,mbcancel],0);
case res of
2: res := 0;
6: res := 1;
7: res := 2;
end;
SetIntegerValue(dllparam2,res);
end;
end;
exports
ShowYesNoCancelDialog index 1 name 'ConfirmCancel' resident;
Finally the ‘exports’ statement specifies how the showYesNoCancelDialog procedure is made available to the outside world.
You can see that it can be referred to by a number (index=1) or by an identifier (‘ConfirmCancel’).
The main point about this example is that the actual work is in setting up the exchange of information between Manipula and
the DLL. Fortunately this part is easily standardised. The actual work of showing a 3 button dialog is a single line in the
program, using a standard function MessageDlg.
OLE Automation
Automation is part of a technology that used to be called OLE (Object Linking and Embedding) and at present is known as
COM (Common Object Model) that has been developed by Microsoft and that is a key part of the Windows operating system.
You can have automation servers; programs that perform certain tasks and that provide a COM interface such that other
programs, automation clients, can control the execution of those tasks.
During the last IBUC Blaise 4.5 was shown by Statistics Netherlands in beta as an Automation server being controlled by MsExcel, the automation client. By programming MS-Excel using Visual Basic for Applications both data and metadata could be
extracted from a Blaise data set and to manipulate it using the Visual Basic for Applications programming language available in
MS-Excel.
MS-Excel however is itself also an automation server. You can make Excel programmatically perform any task that you can
perform interactively. You will need to study the Excel object-hierarchy to understand how to achieve particular tasks. The
top-level object is the application object. In the example below the Excel application object is represented by the v_xls
variable. You can see that we refer to cell A1 in the active sheet of the application as
V_xls.Activesheet.range[‘A1’].value := ‘Manipula controls Excel!’
The process of invoking Excel, opening a workbook, placing some data into a cell and saving the workbook is illustrated in the
following code extract:
…
try
v_xls := createoleobject('excel.application');
except
showmessage('Could not start MS-Excel');
exit;
end;
v_xls.Visible := True;
v_xls.workbooks.add;
v_xls.activesheet.range['A1'].value := 'Maniplus Controls MS-Excel';
v_xls.activesheet.range['A1'].font.size := 54;
v_xls.activesheet.columns['A:A'].columnwidth := 100;
v_xls.displayalerts := false;
v_xls.workbooks[1].saveas(‘BlaiseFecit’);
v_xls.quit;
…
It is taken from our second example DLL (MANIXLS.DLL), which only has a single procedure Makesheet. This procedure
invokes Ms-Excel , makes Excel show itself, creates a new workbook, and places a text in the active sheet of the new
workbook. After some formatting, it saves the spreadsheet under the name ‘BlaiseFecit.xls’.
To be complete, below is the source code for the Maniplus script that drives the DLL:
PROCESS TestExcel
AUXFIELDS
IRes : INTEGER
PROCEDURE MakeSheet
PARAMETERS
EXPORTS Result:INTEGER
ALIEN('ManiXls','MakeSheet')
ENDPROCEDURE {Makesheet}
MANIPULATE
MakeSheet(iRes)
Display('Invoked excel, returncode ='+str(iRes),wait)
Using MS-EXCEL Pivot Table interactively.
Before we start automating tabulations using the PivotTable, it is useful to have an idea what steps are involved in the process
of generating tabulation interactively.
We start this process with the generation of an Excel worksheet that contains the data to be tabulated in one of the worksheets.
Because there are a few problems in importing Blaise data into Excel that we like to avoid we use a Cameleon setup we
developed to load up the data.
Then the definition of the PivotTable can take place. This is actually a four-step process.
§
§
§
§
You define the kind of data source
You define the location and kind of the of the data
Then you define the tabulation
Then you define the location of the table in the workbook
To do this most easily you first select the columns that contain your source data, and then you activate the PivotTable
command.
MANITABS has only a few keywords. Because the Manipula DLL interface is implemented as ALIEN PROCEDURES, each
MANITABS keyword is a procedure call.
As an example lets take an excerpt from a business survey that contains information on opening and closing stocks and sales
and purchases. All of the enterprises are classified at NACE class, division and section level. The NACE codes are
implemented as STRING types. Also the Nace section and division level codes have been implemented as a Classification type,
and finally the section level codes have been implemented as an enumeration type.
We would like to make a very simple tabulation that shows opening stocks, purchases, sales and closing stock for each activity.
The table would look like this:
NACE Section
D
….
NACE Division
22
24
….
Count of Units
####.##
####.##
Opening Stock
####.##
####.##
Purchases
####.##
####.##
Sales
####.##
####.##
Closing Stock
####.##
####.##
The source code extract shown below is a typical sequence used for preparing a tabulation.
Specification of input and output
You first specify input and output files:
InitializeConstants
aFilePath := 'D:\job\delphi3\xlspivotdll\'
InputFileName(afilepath+'example01.txt')
ExcelFileName(aFilePath+'TABLE01.XLS')
ASCIISeparator ( 2) {comma}
ASCIIDelimiter ( 1) {doublequote}
§
§
§
§
The Initializeconstants procedure is defined in MANIPLUS.INC. It sets up the auxiliary variables that contain the Excel
constants.
The InputFilename procedure sets name and location of the ASCII file that contains the source data for the input file.
The OutputFileName procedure sets the name and location of the Excel workbook that contains the tabulation.
The ASCIISeparator and ASCIIDelimiter procedures establish the type of the ASCII inputfile. As mentioned earlier, it
needs to be a delimited file type. You could also use a TAB delimited file.
Specification of file structure and tabulation
Then you simultaneously define the structure of the inputfile, as well as the bare bones definition of the tabulation.
Addfield('QuestCode'
AddField('QuestCode02'
AddField('QuestCodeSec'
Addfield('Serial'
Addfield('retopen'
AddField('retpurch'
Addfield('retsales'
AddField('retclose'
Addfield('retmargin'
,2,0,0)
,2,1,2)
,2,1,1)
,1,4,0)
,1,4,0)
,1,4,0)
,1,4,0)
,1,4,0)
,1,0,0)
In designing MANITABS we have chosen to limit the number of procedures to a minimum, so there is a single procedure
ADDFIELD that defines a field in the input file as well as determines if and how this field is tabulated. The ADDFIELD
procedure has four arguments
1.
2.
The name of the field. You are free to name the field as you like, as long as it is unique.
The format specifier for the data. This is important. Normally Excel will import data in the ‘general’ format (1). This will
give erroneous results if you are importing classification codes, as these will be interpreted as numbers instead. Here you
can specify that you want such fields imported as ‘Text’ (2). You can also use this parameter to indicate the layout of date
fields.
3.
4.
The kind of field in the tabulation. Fields can be either skipped (=0), a row field (=1) , a column field (=2), a page field
(=3) or a data field (=4)
When you have several row fields or column fields it is important to establish the hierarchy between them. For instance if
you would like to prepare a tabulation showing both section and division levels of a classification, you would want the
section level to be shown is the outer field. You can use the fourth argument to indicate this sequence.
Specification of Tabulation Options
Datafieldoptions('serial'
Datafieldoptions('retopen'
Datafieldoptions('retsales'
Datafieldoptions('retpurch'
Datafieldoptions('retclose'
DatafieldOrientation(2)
ExcelVisible(2)
PivotFontSize(8)
PivotFontName('Arial')
,0,
,0,
,0,
,0,
,0,
Func.xlcount,'#,##0');
Func.xlSum, '#,##0');
Func.xlSum, '#,##0');
Func.xlSum, '#,##0');
Func.xlSum, '#,##0');
{count}
{sum}
{sum}
{sum}
{sum}
{columns}
Finally you can define some tabulation options.
§
§
§
§
The DatafieldOptions procedure allows you to specify for each datafield how it should be presented (as a value, as a
percentage of the total etcetera), what the aggregation method is (counting, sum, average, maximum, minimum etcetera.
Note the use of the Func auxiliary variable to mimics constants), and what the presentation format should be. The chosen
format here is no decimals, but with a separator between thousands.
The datafieldorientation procedure allows you to set whether you would like the datafields to be presented in separate
columns (=1) or in separate rows (=2).
The ExcelVisible procedure allows you to specify whether you want to see Excel build the pivottable (=2) or not (=1)
The PivotFontname and the PivotFontSize procedures set the font properties of the PivotTable.
Creating the Tabulation
Up until now there ha been precious little activity. We have provided the DLL with all the variable parameters that it needs to
control MS-Excel. Excel itself has not been ‘invoked’ as yet.
Tabulate(iRes)
There is a single procedure, Tabulate, that changes all this. The Tabulate procedure will invoke Excel, and issue all the OLEAutomation commands to make Excel prepare the tabulation you have defined in Manipula. Tabulate takes a single parameter,
iRes, which should contain the value 0 after Excel finishes. If it contains another value something has gone wrong.
The Clearfields procedure clears the definition from the DLL.
You can use MANITABS in both MANIPLUS and MANIPULA scripts. However MANITABS will feel at home in
MANIPLUS scripts, because these do not require specification of INPUTFILE and OUTPUTFILE sections. Also, you might
benefit from a CIF set-up that takes a hand in providing you with some additional Metadata, and would write out the fieldnames
of the output files for you, as well as any calculated fields you might want to add.
After playing the Manitabs script we find that a pivot table has been prepared that is very similar to our design objective. We
have separate columns for each of our data fields, we have succeeded in having the number of enterprises counted, but the other
numeric data added together, and we have used a string field as a row field.
MANIPULATE {Transform string data into enumeration}
case QuestCodeSec of
'A' : QuestCodeSecEnum := SecA
'B' : QuestCodeSecEnum := SecB
'C' : QuestCodeSecEnum := SecC
'D' : QuestCodeSecEnum := SecD
… {some codes later}
'Q' : QuestCodeSecEnum := SecQ
endcase
case QuestCode02 of
'01' : QuestCode02Enum := Div01
'02' : QuestCode02Enum := Div02
'05' : QuestCode02Enum := Div05
'10' : QuestCode02Enum := Div10
… {many codes later}
'72' : QuestCode02Enum := Div72
else
QuestCode02Enum := DivUnknown
endcase
Counter := 1;
OutputFile1.WRITE
Subsequently you would need to write a translation Manipula script that translates each individual value for the row and column
fields into an enumerated value. Below we show you a typical extract for a manipulate section that recodes string data into an
enumeration. It relies on a CASE/ENDCASE statement for each of the translations. We did not attempt to set up an
enumeration and recode the four-digit NACE class codes as there are around 450 of those. Also notice the introduction of a
DATAMODEL Example02 "Example with enumerated fields and dummy counter
TYPE
tQuestCodeSecEnum =
tQuestCodeDivEnum =
field"
(SecA (1) "Agriculture",
SecB (2) "Fishery" ,
… {many codes later}
SecQ (17) "Extra territorial organizations" )
(
Div01 (1)
"Agriculture Hunting and Related",
Div02 (2)
"Forestry and logging",
…{many codes later}
DivUnknown (99))
FIELDS
QuestCode
"NACE 4 digit Activity code"
: STRING[4]
QuestCode02 "NACE 2 digit Activity code"
: STRING[2]
QuestCodeSec "NACE Section level code"
: STRING[1]
QuestCode02Enum "NACE 2 digit Activity code as enumeration" : tQuestCodeDivEnum
QuestCodeSecEnum "NACE Section level code as enumeration"
: tQuestCodeSecEnum
‘Counter’ field that obtains the value 1 in order for us to be able to include counts and totals in the same tabulation.
In Figure 7 below we show you the outcome of this tabulation. Notice that Abacus substitutes the category text for the category
identifier (the section codes). Abacus does not print the category values.
References
1.
2.
3.
4.
5.
6.
7.
8.
Blaise Developers Guide, Chapter 5. Statistics Netherlands, 1998
Abacus Users Manual, Version 4.1, Statistics Netherlands 1999
MANWDLLO.PAS in \program files\statneth\blaise4.2\tools\dll\
Microsoft Office97 Visual Basic Programmers Guide, Microsoft Press 1997
Microsoft Excel 97 Developers Handbook, Wells & Harshbarger, Microsoft Press 1997
Delphi 4 Unleashed, Chapter 16. C. Calvert, SAMS, 1999
Excel by Blaise, a primer in Cameleon and Maniplus scripts, T.R. Jellema, NAMES B.V., Unpublished Course Material
1999
Maniplus Tutorial, T.R. Jellema NAMES B.V., Unpublished Course Material 1999
Session 5
How Survey Organisations use Blaise
Around Blaise Surveys at Statistics Netherlands
Marien Lina, CBS
Blaise in European Community Household Panel of Statistics Italy
Alessandra Sorrentino, ISTA
The process of Making a new CAI operation in Statistics Norway
Hilde Degerdal, Statistics Norway
Five years experience with CAI and Blaise
Fred Wensing, ABS
Around Blaise-surveys at Statistics Netherlands
A new ship for a voyage to the Mixed Mode Archipelago
Marien Lina
Blaise support
Statistics Netherlands
Introduction
In 1998 and 1999, all Blaise surveys at Statistics Netherlands were converted to Blaise for Windows. Around the
questionnaires and Cati management, a variety of software applications were active for survey management and
administration. These applications are in part inconsistent and old-fashioned. The Data input division for Person and
Household Surveys of Statisics Netherlands searches for a new system to replace the available variety of tools. All surveys
should be able to supply consistent information to this system. Increasing demands on flexibility (for example, combining
mixed mode with multiple waves) ask for one integrated system. This paper aims to outline the shape of this integrated
information system for managing the survey process at Statistics Netherlands.
This project of developing a new management system for the survey process is still in preparation. Needless to say that the
final project may differ from the ideas below, taken from the draft version of the project plan.
Blaise Island in the past century
In the past century Statistics Netherlands has been developing Blaise. The developments went fast. In the eighties there were
merely tools for data entry and cleaning forms. In the early nineties Blaise was in use on laptops for the Dutch labour force
survey. At Statistics Netherlands, this was the starting point of computer assisted interviewing. At that time the main focus was
on computer assisted interviewing itself. At Statistics Netherlands software development for survey research concentrated on
the Blaise data entry program: the part of the software that enabled to show question texts on screen and to arrange the order of
the questions in a flexible routing mechanism.
In 1989 the Cati-management system has been added. An increasing demand for information asked for larger samples, new
surveys and more frequent panel interviews. Apart from CATI-management, other features at that time (Abacus, Manipula,
Bascula, Set-ups, Conversions, Coding, Form manager) are not really integrated in Blaise but they were a bunch of
independent “tools” placed in a sub-menu of Blaise 2.5. Tools were added to Blaise incidently if there was time to develop a
new functional tool for somebody who asked for it. The most important tool around Blaise at that time was Manipula. In the
past 10 years Blaise III and 4 have introduced Maniplus and a more consistent language definition for Blaise and Manipula.
CATI island in the past century
On Cati Island there are about 100 interviewers. They work in shifts. The CATI-calling centre at Statistic Netherlands has 54
chairs.
The survey procedures at the CATI call centre are well structured when it comes to handling appointments, non-response and
the status of a call. Many credits here for the Cati-call management system. The history files supply standard information,
enabling a structural approach of dial results. For example, for monitoring the performance of the interviewers are retrieved
from the history files. Management information (time consumption for calling and time in between) from the history files is
used for planning interviewers capacities. This kind of small investigations were not performed on a structural base, mostly
using Manipula (or home made Pascal routines). Apart from the data in the Cati management administration there was no big
administration. The supervisor has a simple (Blaise III like) menu to create overviews of the Cati-surveys (per interviewer, per
day or survey period). Non-Response reports are edited manually. Data from the Cati-management system Tools for coding,
converting and finishing data were developed outside Cati-island. The advantage of the cati-management system was that the
information about Cati in the interview data is uniform.
CAPI island in the past century
For CAPI there are about 550 interviewers in 80 districts around the country. They all have a laptop with a modem at home.
They contact field work managers at Statistics Netherlands directly.
There is no Blaise standard CAPI-management system (like the CATI-management system). Outside Blaise a interview
administration produces standard tables. It includes ‘reasons for non-response’ tables from the viewpoint of the data collection
department. The figures may differ from the non-response definition for the survey from a statistical viewpoint. The nonresponse classification in EA is merely arranged to give account of proper handling of visiting addresses by the interviewers.
Additional tools have been developed outside Blaise. They cover CAPI-management (like CATI-management) but also tools
for data communication, the status of an interview, processing visit records and for keeping the salary-records. These CAPI
tools have been developed completely separated from the tools for CATI.
Despite an increasing CATI share, CAPI remains an important input source for statistical analysis. The old tools work together
as a solid machine, at least, if they are handled correctly. However, many of the tools for CAPI management ask for manual
interventions, are survey dependent, old-fashioned and therefor they ask for replacement by a more consistent Capimanagement system.
The Survey Bay
At Statistics Netherlands, organising and executing the field work for the surveys is the task of GEP or “Gegevensverzameling;
Enquetering Personen” (in English: “Data collection; Person Interviews”). GEP consists of 70 staff-members persons. They
supervise and execute the survey process. Each survey has its own process manager. They guide and monitor the whole
process: maintaining the questionnaires, training interviewers, collecting data, coding, quality control, planning and data
delivery. The interviews are performed with Blaise.
The organisation of the GEP-staff roughly is devided into CAPI and CATI-surveys. A closer look shows that survey
procedures are different for every survey. This asked for survey-dependent protocols. In this sense each survey has its own
boat to get the Blaise data from Cati- and Capi-Island. For example, the nature and the amount of finishing jobs (coding,
quality control and data delivery) depends on the survey. In the past special help-tools and procedures have been developed for
specific surveys. These individual tools are based on a diversity of DOS-applications (Blaise 2.5, Paradox, Pascal, Cobol). The
applications needed frequent maintenance.
The rowing boats to Cati Island
For each Cati-survey there is a “rowing boat”. The boat delivers the sample data, and if necessary a new questionnaire, external
files, or even a new Blaise version to Cati-Island. Afterwards the rowing boat picks up the interview data (including Catimanagement data), updates statuses of interviews, creates some non-response figures, determines the destination of a record
and does some administration on board. The procedures on board imply many manual interventions. If someone disturbs the
cadence there is a big problem to transport the data from wave to wave. The boat usually manages to get the data safely to the
Survey Bay.
The old vessels to Capi Island
A lot of CAPI-management is still done manually. An increasing amount of data collection asked for a new system around
Blaise, reducing error caused by manual actions. In the nineties there were four sub-systems around Blaise that managed a part
of the required functionality around a survey. Together they form the system called “SPEER”. The sub-systems are:
SPIL (System to Perform dataInterchange with Laptops). This system has been designed to bring sample data to the laptops of
the CAPI interviewers at home.
LIPS (Laptop Informationsystem for Personal Surveys).
This system is on the interviewers’ laptops to start datacom, load interiews, make visit reports, remarks and send completed
interviews back to the office.
COBS (Computer assisted data manipulation)
This system has been designed for automated data manipulations after the interview data returned at Statistics Netherlands (for
example for coding).
EAS (Interview Administration System)
This system keeps track of the status of an interview task. The survey managers use the system to check the response figures. It
is also used for the pay-roll of the interviewers. This system has been changed and adapted to meet the needs of different
surveys. The result was merely a number of different management systems than one standardised system.
The old system has many loose boats and ships, drifting somewhere in the ocean. Nevertheless also in the current system,
automated sub-procedures (such as keeping the pay-roll) and fixed protocols ease management and supervisors. To call this
system a fleet of old vessels is not meant to be a disqualification of its design or the expertise and/or the many investments of
its builders. Until today these boats are still on duty and they still succeed to deliver the load they have to.
The exploratory drilling rig called POLS
Until now there is not a consistent system to direct the boats of the fleet in the right direction. As already mentioned each
survey has its own management and there was no drive to a uniform approach. In fact every Cati / Capi and Cadi (sub-)survey
was an island. This has been changed when the Life Situation Survey (POLS) came alive. POLS was the start of a new
approach in which all surveys were regarded as one entity. POLS combined three important surveys (about medical care, life
conditions and legal protection) in one system.
For those surveys uniformity in the interview organisation and administration has been reached. However, the three surveys
have in common that the observation unit is a person and that for each address only one person has been selected in the sample.
The whole system around POLS has been designed for the situation where only one person of a household was questioned.
Unfortunately, other surveys (for example the EBB (labour force survey) and the PAP (a survey about private car use) do not
fit on the POLS platform. They have other sample units (households and companies) and may imply multiple observation units
per sample unit (persons and license plates). So to say, the drilling isle was too much restricted to one situation, not flexible
enough and there was a need for a new ship.
Currently the system meets the point where innovation is required. Changes are needed to improve the handling of mixed
mode surveys, stratified sample units (persons in households), panel management and consistency in administration and
organisation.
Searching for a new vessel.
To gain the profits of new technology in Blaise 4, one new ship should replace the old fleet. The aim is a new parameter- and
menu-controlled system that can handle all relations between CAPI and CATI, suitable to load and carry all survey designs and
minimising maintenance. The aimed system includes:
-
handling complex survey designs
- combining different interview modes (Cati, Capi, Casi, Cadi)
- combining different sample units (households, persons, addresses, license plates)
- handling data flow from wave to wave in panel surveys
-
standardisation
- consistent procedures for survey supervisors and interviewers.
- standardised procedures to deliver data to the statistical departments
- uniform administration for all surveys.
- compatible data and standardised blocks for non-response treatment
-
Version control (data models, questionnaires, external files, Blaise versions) and documentation.
-
Windows orientation, optimising use of available ADO components.
A model for a new ship: The body.
This model shows the main flow from sample to data delivery. This model focuses on the essential process in general terms: to
keep the survey going. Many sub-processes are reduced to one here.
The main purpose of system is to combine:
1.
2.
controlling the information flow between panels and modes and the statistical database
keeping the records of the complete person and household survey administration of Statistics Netherlands.
The system keeps track of the survey process between sampling and data delivery and manages the subsequent steps to be
taken.
Figure 1. Simple process model of the survey organisation.
sample
survey
management
(system)
statistical
database
interview
administration
data
delivery
The sample is the input of this process model. The output of the of the model is the data delivery process.
Data from the sample are directed to a statistical database. The database keeps information from the sample and the
interviews. The statistical data include keys to link to the administration. Each sample unit that enters the database gets a
status. This status is kept and updated in the administration.
If records are sent to the interview process, the interview will be carried out and the results (completed forms, reports) are
updated in the statistical database (data).
The co-ordination of the whole process is done by the survey management (system). The brackets indicate that a part of it may
be automated. The survey management system is the wheelbox of the process. For each survey, there is a blueprint of the steps
to take for the sample unit before a record it is ready for data delivery. The flow to specific surveys and waves is controlled by
these blueprints and the status in the administration.
The survey management system systematically:
1. Checks if there are changes in the statistical database to update the status of records in the administration.
2. Activate sample units for interview or data delivery based on the updated status in the administration.
Based on information from the administration and the statistical database the management determines the next step for each
record. This may be the interview process or data delivery.
The interview process
The process model above is the general process model for the main stream of interviewing data. The decision to activate the
interview process is carried out by the survey management system. The organisation of moving between the statistical database
and the interview process is more complicated.
Depending on the survey, codes are supplied with the interview record, controlling the route (i.e., to which questionnaire,
wave, interview mode, interview period, version control, check on external data, Blaise version). The system will have to allow
for different sample units (person, household or others). Until now much of the decisions are done “manually”. The new
approach is to automate the decision rules as much as possible.
No matter how complicated the decision rules are, they are made in advance. The decisions are taken outside the interview
process. The interview process is reduced to IMPORT the records in a standard way, to direct them to the proper interview
mode (Cati, Capi or Cadi), do the interview and EXPORT them back to the statistical administration.
Figure 2. Process model of the INTERVIEW process.
cat i
imp ort
exp ort
cap i
cadi
interview
management
All information exchange with the statistical database passes the IMPORT or the EXPORT module. This ensures uniform data
handling. The interview management in the person of a CAPI- or CATI supervisor keeps having an active roll. The supervisor
continuously checks if the “interview machine” is working properly. They manage the scheduler for the interviewers. If an
interviewer is absent the interview manager takes care for replacement. If there is a problem with the system they report it to
the survey management.
Data delivery
The data delivery process in the first model implies two processes: finishing and data delivery.
Figure 3. Process model of the data delivery process.
finishing
data delivery
management
Before data are directed from the statistical database to the client, there is a finishing process. The number of finishing jobs and
their nature depends on agreement with the client (the statistical departments). This finishing process may include coding jobs
(for example education and kind of job), cleaning data, quality control of the data and computation of derivations.
The data delivery does not necessarily have to be reduced to the interview records. This may also imply other information
(such as the visit reports, remark files, history files, survey reports).
Automated administration
In the previous figures, there is only one line to the administration. The Survey management updates all information in the
administration. In fact, the plan is to automate the flow of information to the administration. To reduce the amount of arrows in
the figures all of them have been left out.
The Blueprint of the ship
The models above have been put into one complete blueprint. Each survey is supposed to fit in this model.
Figure 4. Draft version of the process model
RSM
EXTERN
GEP
samples
changes
mutations
selections
external data
questionnaires
mutations
ADM
ADM
DATA
DATA
MANAGE
MENT
1
FINISHING
mutations
DATADATAMODELS
MODELLEN
status
administration
coding
computing data
EXPORT
MODULE
2
STAT
STAT
DATA
DATA
6
export
sample
sample units
retro data
CATI
reports
reminders
treated / coded data
data
com
LIS
5
payment data
3
sample units
retro data
statistical data
data
com
IMPORT
MODULE
4
delivery
statistical data
GEP
CLIENT
BISNIS
This process model implies more than the simple models mentioned earlier. There is more detail in this model, nevertheless,
this is a draft version.
RSM is the department delivering the input of the system: the sample. This is the only relation of RSM to the system. GEP is
the department in charge for survey management. Added in this model is the GEP input in the process, for example,
datamodels, mutations on them and mutations on administration data. At the centre of the system the administration (SQLbased) and the statistical database (Blaise based) can be recognised.
Standardising Import and Export to Capi and Cati Island
On the right side of the figure the IMPORT and EXPORT module link records from the statistical database to the interview
process (CATI and CAPI). LIS is the system for CAPI.
Data from interviewers are imported solely by the import module. Similarly, data to transmit to the interviewers must always
pass the export module. The EXPORT module takes care for exporting sample data in empty interviews to CAPI and CATI
and the IMPORT module takes care for importing completed interview forms into the statistical database and the
administration. Using only the modules for import and export ensures that it happens on a standardised way. If for a certain
survey the interviewing job is put out to an external enterprise, also the data to and from these EXTERNAL interviewers
should pass the import and export modules.
Overall survey management
GEP manages the whole survey process. Part of the system will always ask for manual interventions. If there is a change in any
corner of the system, GEP is involved. If the system is out of order GEP organises a repair. For example, when a data
communication problem occurs between interviewers and Statistics Netherlands, necessary interventions are controlled by
GEP.
The checklist for the ship
A lot of details often are forgotten. This is why a checklist has been made. In fact it concerns too many details to make it an
amusing story. Here is just a small part of it.
Survey organisation
- Creating and distributing interview materials (letters, answer cards, panel cards, removal cards)
- Re-distributing returned untreated sample units.
- Reminding interviewers and possible respondents
- Automatic computing analyse fields from values in basic interview fields.
Preparing datacom and Cati
- Preparing and installing the required questionnaires (including Cati system and external files)
Software on the Laptop: LIS, the Laptop Information System enables:
- Importing sample data (unpacking, error handling, log-file sent back to Statistics Netherlands)
- Checking completed interviews for datacom
Planning
Until here is where the project got so far. The plan is still to be finalised. The project aims to start in May 2000 and is planned
to be finished at the end of 2001. The current planning of this draft project plan speak about 11 FTE years (not engaged yet).
Credits
Credits go to the project managers and advisers Theo Huijs, Antoon Hogervorst and Frans Kerssemakers for their information
about this project.
BLAISE IN EUROPEAN COMMUNITY HOUSEHOLD PANEL
OF STATISTICS ITALY
Alessandra Sorrentino, ISTAT, ITALY
USE OF BLAISE IN ISTAT
The presence of Blaise in Istat dates back to year 1994.
Some CADI and CAPI application, even dealing with complex questionnaires, have been developed.
Salary and Wage Structure Survey, Small Enterprises Survey, Italian Household Budget Survey and European Community
Household Panel made use – and some of them still use - Blaise System.
Interesting studies regarding, for example, the Italian Household Budget Survey - an important monthly survey - have been
conducted on comparison between Blaise controlled data-entry and traditional data-entry (almost without check). Some
consideration about this matter:
- 25% time increases during Blaise controlled data-entry. On the other hand this is a natural consequence of this new
methodology concentrating on data quality rather than on acquisition speed;
- however this increase in time for acquisition, results in a decrease in time for manual revision of questionnaires;
- moreover Blaise user interacts with this new way of working and seems to be more interested in his job.
Blaise version 2.5 has been used until 1996. Between 1996 and 1997 Istat bought Blaise III licence that simplified the
realization of cross-sectional and longitudinal check programs.
A quite user-friendly language represents one of the most interesting Blaise features even if the user is not a skilled software
developer. This feature is one of the reasons for its diffusion.
Many surveys are carried out in Istat, but the data-entry is usually performed externally by private companies, with the help of
other software. Certainly this is one of the reasons of restricted diffusion of Blaise system in Istat.
Best way for exploiting Blaise system features is to design a controlled data-entry application; in Istat, however, we managed
to obtain many other advantages, by means of computer aided revision and edit.
EUROPEAN COMMUNITY HOUSEHOLD PANEL - ECHP
The most demanding Blaise application in Istat is the one concerning the European Household Panel (ECHP).
The ECHP is a yearly survey carried out in States members of European Community. Eurostat had planned this survey and
coordinates the activity of different European Countries.
The first Wave started in 1994 and the surveys are going on till 2002.
The models collect questions about work, income, properties, residence, training and education, health, migration and other
social indicators concerning household and his members.
The feature of the panel technique is that the interviews are carried out on the same sample of persons and households every
year. This allows, after the first year, to analyse the evolution of the sample, from different points of view.
Through a longitudinal comparison of two or more waves or a cross-sectional study between data collected in the 14 countries
involved, it is possible to single out social and economic characteristics of Countries, becoming a part of a European context.
CAPI EXPERIMENTATION IN ECHP
The department of methodological studies in Istat has carried out a little CAPI experimentation regarding ECHP survey with
Blaise programs. Some interviewers together with Istat employees have interviewed about a hundred of the households using a
notebook.
It has been the first CAPI experimentation in Italian Statistical Institute and the outcome was successful both for the positive
reaction of households and the good quality of data collected.
At least 50% of households have showed interest in using a notebook.
However this mode of conducting the survey results too expensive without a good network of interviewers (depending on Istat
and equipped with notebook) covering all the national territory.
BLAISE IN ECHP SURVEY
On the basis of four standard models sent by Eurostat to Community Countries Members, three Italian models have been
prepared (each one with its one record type), keeping the same information in a different format. This adjustment for the Italian
social-economical reality has been essential to allow the interviewed households to understand and answer to questions.
The three models are:
1.
Household Register is a basic instrument of operational control in the ECHP, collecting information about number of
household members, the coding of interview result, the relationships between the individuals and demographic
information.
2.
The Household Questionnaire contains information about migration, income and economic situation of household.
3.
The third and more complex model is the Personal Questionnaire. Each member in the household aged 16 years or more is
interviewed. The individual model collects detailed information on each person’s economic activity and income,
instruction, health and a large number of other variables.
Blaise 2.5 has been used for the first and second waves (1994 and 1995). This version has allowed simple management and
automatic counting of dirty and clean records, but this has involved restrictions in datamodels linkages.
Because of the complexity of this surveys, the high number of questions, the longitudinal follow-up year by year both the mass
of data and the possibility of mistakes increases and, consequently, the number of checks to implement.
The passage to Blaise III, between 1996 and 1997 gave way to an easier and exhaustive development of checks, carried out
either in respect of previous years or current year data.
Thanks to Statistics Netherlands the passage to new release was not a problem.
Our Statistic Institute did not buy Maniplus licence, that had allowed a personalization in procedure. In order to make a userfriendly application, we prepared simple Dos screen in third and fourth Waves (1996 and 1997), and a Visual Basic
application for two last waves (1998 and 1999).
As described before, in ECHP survey Blaise in not used as a data-entry system – except the CAPI experimentation - but for the
following phase regarding computer aided revision and edit.
Procedure steps in ECHP are listed below:
1. DATA-ENTRY BY EXTERNAL COMPANY
Until 1998 recording of compiled models is carried out by a specialized data-entry company, free to use any software for dataentry. This company also carried out a minimum number of checks.
Data-entry concerns about 7000 households for a total of 30000 questionnaires (7000 Registers, 6500 Household
questionnaires, 15000 personal questionnaires).
2. COUNTING RECORDS AND KEY CHECKS USING SAS
Records are stored on a PC Pentium II Hard-disk.
First step on rough data is the count of questionnaires ordered by geographic region.
By means of Sas language double keys are checked out.
3. LOADING DATA AND CHECKRULES USING MANIPULA
Six PC Pentium II are available for this work.
By means of a LAN different users can access data at the same time.
After storage ‘Check rules’ step starts.
Manipula provides the conversion from Ascii to Blaise format and marks the incorrect records.
We perform batch data processing at evening or nighttime, because data checking in this step could take a large amount of
time.
Manipula processing performs the following actions:
- pointing out the range errors;
- pointing out the route errors;
- pointing out the incompatible values among variables of current wave (cross-sectional checks);
- pointing out the incompatible values between current wave variables and previous wave ones (longitudinal checks).
Check programs contain two types of incompatible errors (hard and soft errors):
- If the user doesn’t correct the error the record remains dirty and data-entry could be inhibited: this is a hard error.
- if the user decides that the variable is correct he can close the message box relevant to the error and retain the original
variable value (but the record hereafter will be considered as clean): this is a soft error.
To improve data query performances during checking, different ‘datamodels’ containing ‘NACE’, ‘ISCO’ and countries code
are linked to current wave questionnaires.
‘Datamodels’ containing previous years variables are also prepared.
4. COMPUTER AIDED REVISION AND EDIT USING BLAISE
Computer aided data correction is a successive step after Manipula ‘checkrules’.
Check plan considers incompatibilities between different variables of current year (cross-sectional check).
Moreover, some variables from previous years data files, are extracted and linked to current year data (longitudinal check);
links between current year variables and code files has been made as well.
To avoid system overloading during this phase of correction, only selected variables from previous year have been extracted.
Comparison between data belonging to different waves is necessary in a panel survey.
The main feature of a panel consists on the longitudinal dimension. This means that some variables could be in contrast with
the same variables in the previous years of the survey. While what is needed is that outcome be coherent with the past waves
Each data resulting in contrast with assigned constraints is enlightened (to enlighten) as a mistake and a relevant message box
appears on the screen. On this message box, even the variables involved in the error, appear.
Some examples of checks here below:
v Household Questionnaire: relation between the number of rooms in the house and its square measure is incompatible:
v Household Questionnaire: the number of rooms in the house is different from the number of rooms in previous year.
The household, however, lives at the same address. An explicative message shows the answers for all previous waves:
the user can decide which is the best answer.
v Household Register: even though in household register is declared that two personal questionnaires are filled in, there
is only one personal datamodel. Blaise requires to verify the number of existing paper model:
v Household Questionnaire: the application links some information from household questionnaire (main source of income
coming from pension) with some other information from the personal questionnaires (source of income). Error arises
because none in the household receives a pension indeed.
v Personal Questionnaire: the interwieved person has declared too large amount of salary compared to the amount for the
previous years (obviously for the same work). This is an example of longitudinal check:
The following table summarizes some information concerning datamodels and error types for Wave 5 – 1998:
Error
Type
B(3)
12
Error
Type
C(4)
59
Total
Error
A+B+C
75
Automatic
Correction
400
Error
Type
A(2)
4
45
120
11
3
25
39
47
202
400
18
16
177
211
75
Datamodel
Program
rows
Questions
Number(1)
Fields
Register
1755
20 + 13
Household
1261
Personal
3420
19
(1) - Question number for Register: 20 questions concerning household + 13 questions for each household member.
(2) - Error type A: pointing out of the errors arising from linking variable values contained in other models for current wave
or code files.
(3) - Error type B: pointing out of the errors arising from linking variable values from previous waves.
(4) - Error type C: pointing out of the errors arising from inconsistency between variable values within the same datamodel.
5. WORKING IN DOS AND VISUAL BASIC
To make user-friendly the Blaise III application we prepared simple Dos form for Wave 3 - 1996. This Dos menu is designed
by means of Dos batch programs.
In short the Dos menu allows:
♦
♦
♦
♦
♦
direct access to selected datamodel, without passing throw the main Blaise menu;
automatic activation of certain data-entry mode (Data Editing Mode);
clean and dirty records counting;
conversion from Blaise to Ascii format;
automatic data saving on floppy-disk.
Moreover, a very useful feature that we have used, is the possibility to change easily data-entry mode. For example, Data
Editing Mode facilitates navigation in datamodels, even if there are hard type errors.
In our department revision and edit is organized in geographical areas and each employee works on a particular area. This
means that a global counting of dirty records was a nonsense. That’s why we prepared other Dos Bat files, managed by a Visul
Basic application.
This application allows a record counting selecting a given area (provincia). So each user is able to check the number of the
record that he has cleaned so programming his work timetable.
Visual Basic application allows the following functions:
♦
♦
♦
♦
♦
one ore more questionnaires selection;
saving of data on others PC’s;
clean and dirty records counting;
recording of a file (log) containing the number of records cleaned and the dates in which this count was required;
exit.
Visual Basic application, that manages described query, is showed down:
6. EUROPEAN DATA FORMAT CONVERSION USING COBOL AND SAS
Once Blaise data correction on Italian format is performed, record types are converted in four Eurostat record types, by means
of Cobol and Sas language. Output data are submitted to Sas checks written by Eurostat. Basically these checks account for
relationships among individuals, structural errors (i.e. incoherence between two models in the same wave), plausibility (checks
on variables – for example income, pensions, mortgage – between two different waves) and so on.
Although the error checklist by Eurostat is large enough, we thought to enlarge this list by adding our own Blaise error codes.
At present we are also thinking to improve automatic editing using appropriate software tool, such as Scia.
Scheme of Panel steps survey (from 1994 to 1998) here below:
FLOW-CHART OF PANEL PROCEDURE
Data
collection
Manual
check
In Istat
Data-entry
in external
company
Recording
models
Loading
and first check
Single
file from
company
First Sas
data check
Three
different
outfiles
Previous year
data and
Blaise
and Manipula
programs
code files
PC LAN
Clean data
for current
year
Eurostat
format
conversion
Data transfer
to Eurostat
Four files
in Eurostat
format
Check Sas
by Eurostat
Clean data
ready for
Eurostat
Stadium
QUALITY INDICATORS
Since Blaise does not count the total errors for each datamodel, but gives only total number of clean and dirty records in a file,
for a better understanding of what type of error it is and its frequency, we completed the records (in Blaise format) by inserting
error codes at the end. In this way it is quite simple to get statistics about the errors.
The table shown below – as an example – is calculated on a sample of 500 households. The example regards the household
questionnaire only:
Error Code
Error Frequency
%
CBF001
CBF002
CBF006
CBF010
CBF011
CBF013
CBF017
CBF019
CBF020
CBF023
CBF024
DBF001
DBF003
DBF004
DBF005
DBF008
DBF009
DBF011
SBF001
SBF002
SBF003
SBF004
SBF005
SBF008
SBF010
10
10
26
1
81
1
6
3
10
1
3
43
1
2
1
1
75
12
9
6
2
2
11
38
1
2,81
2,81
7,30
0,28
22,75
0,28
1,69
0,84
2,81
0,28
0,84
12,08
0,28
0,56
0,28
0,28
21,07
3,37
2,53
1,69
0,56
0,56
3,09
10,67
0,28
TOTAL
356
100,00
Code C…: cross-section error type.
Code D…: automatic correction.
Code S… : structural error type.
Analysing this table allows the researcher to have a feedback to operate on questionnaire formulation or on more instructions
to the interviewers.
FUTURE DEVELOPMENT OF BLAISE IN ISTAT
For the 6th Wave of ECHP (1999) we decided to perform controlled data entry using Blaise III release.
At present we are planning to pass to Blaise IV release for Wave 7 (2000).
We are also examining the possibility to carry out an important survey, such as Italian Labour Force Survey, making use of
Blaise IV Capi mode.
CONCLUSIONS
In this paper the experience of Statistics Italy using Blaise has been presented, with a particular attention to European
Community Household Panel.
Blaise III has become an integral part of Panel survey processing methodology, helping (by designing the appropriate
datamodels) researchers to understand how to improve questionnaire and easing the checking phase too.
This document shows also the good properties of Blaise III, Manipula and Visual Basic as tools for a rapid application
development.
Thanks to:
Sara Mastrovita and Pierpaolo Massoli for the active collaboration in paper translation;
Stefania Macchia for studies on Italian Household Budget Survey and CAPI experimentation on ECHP;
Sandro Baldanza for Visual Basic application;
Concetta Pellegrini for Flow Chart of Panel Procedure.
Alessandra Righi, Giuliana Coccia, Stefania Macchia and Giulio Barcaroli for comments on paper.
The process of making a new CAI-operation in Statistics Norway
Hilde Degerdal
Statistics Norway
In 1994 we implemented our first CAI-operation in Statistics Norway. It turned out to be quite successful. We did not have to
make any changes in the solution for five years. In this paper I will describe the changes done in 1999, and how we organised
the work.
At the beginning of 1999 the procedures and the hardware were almost the same as those we started with in 1994. It was an old
server (Pentium 60/32 MB) running under NT 3.5, and 150 laptops, mainly Toshiba 1910 (486/4MB), running under Windows
3.1. We used Blaise 2.5, and for the communication part, Microsoft Mail with some modifications.
It was all growing quite old-fashioned and laptops broke down more and more often.
Both the interviewers and the staff in the office suffered from the lack of a good case management system. “The Data
Inspectorate and the protector of privacy in Norway” has very strong restrictions for operations of this kind, and accordingly,
they would not appreciate our solution by then. And finally we had the ghost of Y2K. It was obvious that we needed to do
something.
What to renew?
We decided to make a complete new CAI-operation. Some choices were easy to make, and one of the easiest ones was to go
for Blaise 4 Windows.
To change from Blaise 2.5 to Blaise 4 Windows meant that every questionnaire had to be rewritten and the data management
for the surveys had to be rebuilt to fit the new data input.
Our old operation had very poor case management systems both in the office and out on the laptops. Consequently, these were
really areas for improvement.
The interviewers report their time lists in a system built up as a Blaise questionnaire. This questionnaire had to be rewritten.
Another task in this area was to build up one updated register with all necessary information about the interviewers, to be used
for all purposes.
One of the major tasks was to purchase the required hardware. This was of course also the most expensive part.
The most complicated part, however, was to build up a convenient and user-friendly communication solution, which still met
the restrictions of “The Data Inspectorate and the protector of privacy in Norway”.
Organisation of the project
The old CAI-operation was built up, and was an application running inside the Division for Sample Surveys. We aimed at
building the new system in such a way that it was to be seen as a part of Statistics Norway’s total IT –structure. It was
necessary to pick resources from the whole organisation to build up this new CAI-operation.
To understand the composition of the groups developing the new system it is necessary to have an Organisation map of
Statistics Norway (figure 1)
We built up an organisation with working groups for each of these main areas.
• Implementation of Blaise 4 Windows
• Taking care of influences on the surveys that are continually conducted
• Case management system
• Necessary changes in payment and personnel management of the interviewers
• Hardware purchase
• Communication solution
Statistics Norway
Chairman of the Board
Director General
Department
Economic
Statistics
Social
Statistics
Industry
Statistics
Research
Administrative
Affairs
Coordination
and
Development
Unit without
department
connection
Social and
Demographic
Research
Population and
Education
Statistics
Health Statistics
Business
Register
Public
Economics
Budget and
Accounting
Division for IT
International
Consulting
Income and
Wage
Statistics
Primary
Industry
Statistics
Resource and
Environmental
Economics
Macroeconomics
Personnel
Administration
Statistical
Methods and
Standards
Information and
Publishing
Division
National
Accounts
Environmental
Statistics
External Trade,
Energy
and Industrial
Production
Statistics
Economic
Indicators
Public Finance
and Credit
Market
Statistics
Labour Market
Statistics
Sample Surveys Transport and
Tourism
Statistics
Social Welfare Data
Statistics
Registration
Population and
Housing
Census
Construction
and Service
Statistics
Administration
Administration
Administration
IT
IT
IT
Microeconometrics
Office
Joint Services,
Kvgr
Joint Services,
Oslo
Fig 1
The participants in the groups were mainly picked from different divisions in Statistics Norway, according to the task of the
group. We could not find any person inside Statistics Norway with the knowledge of making a communication solution
meeting the strong restrictions demanded. If someone had the knowledge, they were not idle to do it. It was generally a lack of
IT-resources in-house because there were several other Y2K-related projects running in Statistics Norway as well. Therefore
we had to hire some consultants for this task. We ended up by hiring two consultants from the company Computas AS.
A steering committee was established to keep an eye on the process and use of resources.
The steering committee consisted of the leaders from
• The Division for IT
• The Department for Social Statistics
• The IT-office of the Department for Social Statistics
• The Administration-office of the Department for Social Statistics
• The Division for Sample Surveys
A representative for the consultant’s agency also attended the meetings of this group. The meetings were kept quite regularly,
once a month during the period of May to December 1999.
Of course we wanted to develop the new operation in cooperation with the users.
We put together a reference group, consisting of 7 interviewers, one representative from the division of Labour Market
statistics, and 1-2 representatives from each of the different groups in the division of Sample Surveys. Members of this group
were summoned when they were needed for discussing matters in the working groups.
The working groups and their tasks
Implementation of Blaise 4 Windows
We wanted to develop our competence in Blaise 4 Windows in an efficient way. We hired an instructor from the company
Names to give a course in Blaise 4 Windows. He stayed a week in April last year. He pointed out the main issues in the new
software. By having a course like that we also gained of getting a dedicated week for training.
We wanted to use the opportunity to make the questionnaires for various surveys more similar than they used to be. Therefore
we made a template for questionnaires with standards for layout and a set of administrative variables. We also built up a sort of
a question library for background variables. Concerning layout, it was obviously even more necessary with standards in Blaise
4 Windows, with all its possibilities for colours, fonts and so on.
We needed new coding lists for use in the new Blaise questionnaires as well. The list of professions also had to be converted to
the International Standard Classification of Occupations (ISCO-88). The old one was built on an older standard, and a number
of newer profession titles were lacking. The list was made by picking data from the Labour Force Survey, different registers
and the Population Censuses, totally 4 260 cases. Professional coders in Statistics Norway had coded these. It was also made a
coding list of municipalities, and a couple of others regularly used lists.
In this group mainly persons from the Division for Sample Surveys took part.
Surveys conducted continually
•
•
•
Labour force survey
Household budget survey
Survey on dwelling and rent
These surveys are always running. It was an important task to avoid them suffering from the changes caused by the switchover.
Of course it was necessary to rewrite the questionnaires for the Windows version. As the reception system for the data from the
Labour Force Survey could not handle any changes in the data structure, it had to be handled very carefully.
The plans for implementation of the new operation meant that it was no distributed interviewing going on in January 2000. All
interviewing for the continuous surveys had to be handled with extraordinary CATI-operations in the office.
A working group was appointed for each of the surveys. They consisted of persons from the Division for Sample Surveys and
persons from the divisions with the thematic responsibility for each of the surveys, which are the Division for Labour Market
Statistics (the LFS), the Division for Social Welfare Statistics (Household budget survey) and the Division for Economic
Indicators (Survey on dwelling and rent).
Case management systems
In the office
We needed a good tool for management of interviewers, surveys, questionnaires and interview objects. It should be a tool for
preparation, distribution and delivery of interview objects as well as reception. The management system should also be a tool
for supervision during the period of data collection. The field staff wanted a suitable tool for supervision of the interviewers'
work, a possibility to locate an interview object when wanted, and a system making it possible to redistribute interview objects
from one interviewer to another. The system was built up in Oracle. (For more details on the solution, see Thomas Hoel’s
paper "Central and local survey administration through communicating data systems”)
On the laptops
We wanted to build up a user-friendly solution to handle the installation, information, appointments and return of data for the
respondent on the interviewers' laptops. The solution should be an improvement seen from the interviewer’s point of view, in
that they should have as much information as possible about the respondent in advance. The old operation had no possibility of
handling appointments across the surveys. This was absolutely wanted. Since this tool should handle Blaise data, it had to be
written in Manipula/Maniplus (For more details on the solution, see Thomas Hoel’s paper “Central and local survey
administration through communicating data systems”)
The groups developing these systems consist of staff from the IT-office in the Department for Social statistics and persons
from the Division for Sample Surveys.
Payment and personnel management of the interviewers
In parallel with our project there was another project going on, handling personnel management and wage system in Statistics
Norway generally.
One of the main tasks for our group was to make a new Blaise questionnaire for the CAP-system (Computer Assisted
Payment). The data from this questionnaire, it means data of working hours and other expenditures in connection with their
work, is handled in a separate system before it is forwarded to the central governmental wages system. This system had to be
renewed, as a consequence of changes in input, as well as in output.
There existed several registers and databases with personnel information on the interviewers for various purposes. We aimed at
building up one updated register with all necessary information.
The changes made by the other project lead to a solution where all the personnel information was kept in a separate network.
This decision made it impossible to reach our goal of one register.
Still we have no complete register with all the information that we want to have about the interviewers, for use in our division.
This group was staffed from the Administration-office in the Department for Social statistics, the IT-office in the Department
for Social statistics and the Division for Sample Surveys. We did also cooperate with people from the central Department of
Administrative Affairs.
Hardware purchase
Some of the newer laptops that were in use could have been upgraded. However, it was desirable to have screens handling the
resolution of 1024 * 768 pixels, both for the application for case management (made in Maniplus) and for the Blaise
questionnaires.
That meant that we had to replace all the laptops. Beside the economic point, we set great store on the ergonomic points. We
ended up with Toshiba Satellite, 4090. It is a model with Celeron processor, 400 MHz, 64 MB Ram and a 14.1” TFT-screen.
As we had not employed new interviewers during the year of 1999, we had a vacancy of 20 jobs at the end of the year.
It meant we needed to buy 130 of the laptops. They were delivered equipped with network cards.
Another task in the same area was to take care of the process of switching the analogue lines by the interviewers to digital
ones. The interviewers installed the necessary equipment themselves. Routers were purchased for all the interviewers. The
routers also had analogue ports, making it possible to use the old equipment in the transitional period. The interviewers still use
analogue phones.
Of course new servers and central routers were also needed for the new operation.
This group was mainly staffed with persons from the central unit, Division for IT.
The communication solution
This is of course the most critical part in any distributed CAI-operation. And with the strong restrictions it was quite a
challenge to build a good solution here.
We wanted an ordinary mail program. This was a feature in our old CAI-system, and we had learned to appreciate this way of
communicating with the interviewers.
Of course we needed programs at the laptops making it possible to
• collect the data for return to the office
• install a new questionnaire
• install respondents (initial and additional)
• upgrade and retrieve files.
The solution should also offer a possibility for the interviewers to reach the database in the office, in order to
• pick up new questionnaires or other updates
• pick up new respondents
• deliver data
•
update the status in the database
The data transmission are of course encrypted. We needed firewalls and built up a structure as scratched in figure 2.
Fig 2
The greatest challenge was, however, how to meet the requirement from “The Data Inspectorate and the protector of privacy in
Norway” at the point “Initiation of access to data inside Statistics Norway shall not be possible from the outside”
The communication is using a dial-back RAS connection (Remote Access Server) over ISDN. The interviewer client
communication software talks to a reverse proxy server, which is polled from the inside. In this way, all traffic through the
firewall is initiated and controlled from the inside.
The main units in the communication solution are the packages. We have packages of different kinds for the different purposes
(For more details, see Thomas Hoel’s paper “ Central and local survey administration through communicating data systems”)
The tools used in the communication part are Internet Explorer 5.0 and Java. For accessing Blaise databases Java calls
Manipula scripts.
The consultants did the main part of the development here. It was done in close cooperation with people from the Division for
IT, as well as people from the IT-office in the Department for Social Statistics.
Schedule
We started planning the process in the autumn 1998. The project was intended to start as early as possible in 1999. The real
kick-off of the project, however, was not until the beginning of March. Almost all the groups had their deadline in the end of
November. The plan was to use December for testing, and January 2000 for training of the interviewers. However, we got a
delay on the communication functionality. This was not complete until the middle of January, 5 days before start of the
courses.
Resources
We received the laptops in December. It was planned that way in order to delay the main expenditure of hardware purchase to
2000. The main burden for software development was in 1999. From an economic point of view it was preferred to have the
expenses divided over two different years' budgets. The total budget was 5.5 mill NOK, and additionally 5050 man-hours of
work inside Statistics Norway.
Training of the interviewers
We arranged 5 courses at different locations in Norway. During the courses the interviewers received their laptops, and they
learned to use the new software. The training was combined with training for a new big survey starting in February. Only one
day was dedicated for learning the new CAI-operation. In addition the interviewers was paid for 10 hours of training and initial
preparation at home.
The experience so far
We have had more ”children’s diseases” than we wanted, mostly in the area of communication.
There have been some problems with session handling, resulting in lack of contact with the database. The solution with the
routers has also proved to be somewhat unstable.
We started with laptops with encryption of the disk, but this solution led to a lot of hang situations with blue screens. So still
we are testing out other sorts of software for this purpose.
All in all I think the new CAI-operation means an improvement for all users.
First of all we have far much better administration tools both in the office and on the laptops.
The whole solution is built up on modern software. The Web technology is a handsome way of delivering and reaching
information. The interviewers really appreciate their home page (an example in figure 3) giving them the status of their
workload for the moment.
This page also offers access to a lot of information needed from time to time, as lists of postcodes, rules of working conditions,
tips on good working habits etc. They also reach reports of their working hours reported, for each day, and month. There are
plans for more reports, e.g. a report making it possible for the interviewers to compare themselves with their colleges in
question of non response percent for a survey and so on.
Another feature appreciated by the interviewers is the automatic dialling of phone numbers. Using the analogue telephones
together with the internal modems in the laptops makes it possible to dial a phone number from buttons in the Maniplus-screen.
We have also succeeded meeting the restrictions from “The Data Inspectorate and the protector of privacy in Norway”.
There have been composed several reports for the purpose of supervision, and even more are planned, meaning that the system
offers a good tool for supervision.
So, all in all, I think the process has been a success, even though it has not been without complications.
I will also use the opportunity to thank Vesa and his colleagues for several good ideas during our visit in Helsinki in May. We
will also thank Lon and Marien for answering countless questions about Blaise/Manipula when we visited them in September
and in several mails. Last, but not least, thanks to Leif, for his kind help with the TAPI functionality.
Five years’ experience with CAI and Blaise
Fred Wensing, Eden Brinkley, Australian Bureau of Statistics
Abstract
This paper summarises five years of experience by the Australian Bureau of Statistics (ABS) with Computer Assisted
Interviewing (CAI) and the use of Blaise.
The paper will give a brief history of the use of CAI in household surveys at the ABS, commencing with a small scale trial in
1994 and progressing through its use in 5 major surveys. The paper will discuss the issues considered in the business case for
CAI and some of the concerns which led to it not being implemented as widely as first planned.
The ABS decided to use Blaise for CAI in household surveys after a detailed evaluation of the software was made in 1994 and
in recognition of the plans that were being made to further develop the product. The ABS has used version III of Blaise since
the early beta test versions became available in 1995. Our experience with Blaise software has been varied and much has been
learned about building instruments and applications. In recent months some of our Blaise facilities have also been converted to
make use of Blaise 4 Windows. The paper will give a summary of those experiences and highlight some of the lessons
learned.
Five years’ experience with CAI and Blaise
Fred Wensing, Eden Brinkley, Australian Bureau of Statistics
Introduction
Computer assisted interviewing (CAI) has been employed as a collection method for a selection of household surveys at the
Australian Bureau of Statistics (ABS) since 1994. During that time we have maintained a stock of 230 notebook computers,
conducted over 17 pilot tests and 6 major surveys involving more than 250,000 CAPI interviews, 400 interviewers and 150
office staff.
This paper summarises the ABS experience and highlights the major issues associated with the decisions to make use of CAI.
Some of the difficulties experienced are also discussed.
When CAI was first employed by the ABS in 1994 version III of Blaise software (for DOS) was just becoming available in a
beta test version. Our use of Blaise has progressed through a number of enhancements of the software and we are now
commencing to make use of Blaise 4 Windows.
This paper also describes our experiences with the development of the infrastructure associated with CAI, in particular the key
role played by the Blaise software suite.
Brief history of CAI in the ABS
The use of CAI in ABS household surveys was examined in 1993 and a case was prepared for its introduction subject to a
comprehensive test being conducted to ensure that it was viable. Previous considerations of CAI had concluded that systems
were not advanced enough. But the situation had changed, with a number of overseas agencies adopting CAI.
A small scale trial of CAI was conducted in July 1994 using the Household Expenditure Survey (HES). The HES was
deliberately chosen as it was a large survey questionnaire involving more than 800 questions. The trial was conducted on a
sample of 450 households using 10 interviewers who were each equipped with a 486 notebook computer (monochrome
screen). The test also included the transmission of data via E-mail.
On the basis of the success of this first trial of CAI a proposal was developed and approved in 1994 for the introduction of CAI
to all household surveys by 1997, including the monthly Labour Force survey.
From the end of 1994 and through 1995 work proceeded on the infrastructure required for CAI, such as field systems, office
systems, transmission systems and instrument design. During that time a further four tests were conducted to check various
aspects of the infrastructure, office and field procedures, and training material.
In order to ensure that the systems could support the requirements of a monthly survey with a tight schedule, a major trial of
CAI was conducted in the first six months of 1996. This trial made use of 80 interviewers and a rotating sample of 4,000
households per month which was conducted in parallel with the existing monthly Labour Force survey (which used a pen and
paper collection methodology) to enable direct comparisons to be made. This major test provided valuable experience which
contributed further to the development of systems.
At the same time, indications were emerging that the original cost estimates for CAI were likely to be significantly exceeded
particularly in the area of hardware. This led to a management decision taken in late 1996 to pull back from full
implementation in all household surveys. Given that the stock of notebook computers had reached 230 by then (in preparation
for the first production use in an ABS survey), it was agreed that CAI should continue to be used for a number of major standalone surveys but that plans to employ CAI for the monthly Labour Force survey should be abandoned for the time being.
The first production application of CAI at the ABS occurred with the second wave of the longitudinal Survey of Employment
and Unemployment Patterns, conducted in September 1996 with a sample size of 8,500 and interviewer work force of around
200. The most significant feature of this survey was the use of dependent interviewing in which information from the previous
wave of the survey was used within the CAI instrument to guide the conduct of the interview.
CAI went on to be used in the following major surveys conducted by the ABS:
-
Survey of Mental Health and Wellbeing (1997) using a client-provided CAI instrument;
Third wave of the longitudinal Survey of Employment and Unemployment Patterns (1997);
Survey of Disability, Ageing and Carers (1998);
Household Expenditure Survey (1998/99);
-
Australian Housing Survey (1999).
With the stock of computers coming to the end of its useful life in 1999, it was necessary to develop a new case for
continuation of CAI. With careful structuring of the survey program and due consideration of the costs and benefits, a
successful case has now been presented to management to enable CAI to be continued for major surveys in the future. The
details of this case are discussed later.
Initial justification for CAI at the ABS
The case for CAI at the ABS was based on expectations of improvement in data quality, survey timeliness and cost
effectiveness. At the time of preparation of the initial case for CAI, these benefits were described in the writings of a number
of authors (Weeks 1992, Manners 1992, Martin, O'Muircheartaigh, Curtice 1993). The attractions of CAI could be
summarised as:
Improvements in data quality - Interviewers are directed automatically by the computer to the next relevant question,
eliminating any sequencing errors. Editing of responses can be done during the interview, allowing queries to be
answered directly and immediately by the respondent. Introducing questioning based on responses given in previous
interviews (dependent interviewing), can provide greater consistency and accuracy of data over time.
Improvements in timeliness - Timeliness of survey processing can be improved as data is available in electronic form at the
end of the interview. Time spent on handling paper forms and entering data into the office computing system is
eliminated. Potentially, the data delivered by the survey instrument could be a clean unit record which would be fed
directly into the survey output system. In practice, for a complex survey, some post-field processing may still be required
to clean records.
Reduction in survey operating costs - CAI offers savings in a number of areas of survey operations. Printing of paper
forms is no longer required. Physical handling of forms (bundling, processing, storage) is also removed. Office editing
and coding is greatly reduced. Clerical data entry is eliminated. It is also possible that costs of survey management can be
reduced. Any savings in these areas need to be counterbalanced with the additional costs of hardware, software and
development time accruing to CAI implementation. As these costs are greatest at the outset, savings are likely to be
realised only in the longer term.
It was recognised that the cost reductions mentioned above may not be as great at the ABS as some other agencies because
clerical data entry had been replaced with optical mark reading (OMR) of forms for household surveys in 1989. The remaining
benefits were accepted by ABS management, subject to confirmation through the testing programme.
The small scale trial, which was conducted in July 1994, concluded that CAI was indeed viable and could deliver quality and
timeliness improvements with possibly some cost savings. The trial also showed that it was relatively easy to introduce CAI to
an interviewer workforce who have had very little computing experience. Respondents were not at all concerned by the use of
computers in the field. It was on that basis that continued use of CAI was approved at the time.
Major issues which received attention
Choice of software
One area to receive early attention was the selection of suitable CAI software. Due to the special nature of CAI it was
preferable to use an existing software package rather than to build one of our own. Evaluation of available software was
carried out against a set of defined criteria which can be grouped under the following headings:
Facilities provided - the software must provide adequate functionality for the survey business and primarily for the
interviewing part. Features should include support for editing, routing, coding, derivation, complex data structures, error
recovery, management and analysis.
Metadata - this area of concern related primarily to how the product was to fit into the ABS corporate infrastructure which
placed a significant emphasis on metadata. Features would include the ease with which metadata could be used by or
supplied to other systems.
Usability of the software - this related to how efficient and easy the product is to use. The software was assessed on such
characteristics as the ease of learning, speed of questionnaire development, provision of development tools, documentation
and help facilities, usability by questionnaire designers who are not necessarily IT professionals, maintainability and
readability, reusability of code between surveys and training required for all types of staff involved.
Usability of the resulting collection instruments in the field - this related to how usable the resulting collection instruments
are in areas such as layout and readability, performance and efficiency (including response time for all functions), on-line
help for all functions, robustness and error recovery (including protection against data loss) and overall acceptance by
interviewers.
Post-field processing - this addressed how further processing of data is supported, including derivation, weighting,
tabulation and ease of linking to alternative post-field processing products.
Other ABS computing environment issues - these requirements were to ensure that the product would fit satisfactorily into
the ABS computing environment, and covered such considerations as compatibility with other software, file management,
communications and security.
Future directions - this addressed relevance of future directions as perceived by the ABS, in areas such as transition to
Windows, links to external systems and adaptablity.
A brief assessment of the alternatives was made and two serious possibilities (one of which was Blaise) were then given closer
scrutiny and testing. In the end, Blaise (version III) was selected as the most appropriate software for CAI in the ABS due to
its language characteristics (simple syntax and block structure), its metadata-centered approach (shared by all the tools) and the
availability of data and metadata conversions to interface with the ABS environment. While there were some limitations in the
software at the time (being 1994) it was known that these were being addressed by the software developers. It was further
recognised that the developers of Blaise, Statistics Netherlands, had very similar goals and priorities to the ABS and was
pursuing developments in accord with those at the ABS.
Selection of hardware
The minimal technical requirements for notebook computers required to operate Blaise III software in 1994 were determined to
be:
-
Intel 486sx processor (this was later changed to 486dx in anticipation of additional demand by the software)
DOS 6.2 operating system
4 megabytes of RAM (preferably upgradable)
80 megabyte hard disk (allowing for future requirements)
Full size keyboard
VGA graphics screen (to handle 80 by 25 characters of text)
Unit to be connectable to modem, external keyboard and/or monitor
Non-technical requirements included:
-
Low physical weight (preferably less than 2.2 Kilograms)
Screen to be easily readable (colour optional)
Minimum of four hours continuous battery life
Unit that is easily to carry and use while sitting or standing
Shock resistant case
Cost
Future plans for upgrades and support
Weightings were assigned to the functional requirements of the notebooks with non-technical issues being given a high level of
consideration in the selection/evaluation process. The physical and ergonomic features/characteristics of the notebooks were
considered very important. Consequently, the following criteria were given high weightings as mandatory requirements:
-
low physical weight
high quality display screen
long battery life
reliable battery life indicator
Tenders were received from 14 suppliers which were then shortlisted on the extent to which each tender complied with the
mandatory functional requirements specified. The tendered notebooks were then ranked on their value for money, calculated
as a ratio of the cost over their score on technical worth. Six shortlisted tenderers were asked to provide the ABS with
appropriately configured hardware to allow performance tests to be conducted.
The shortlisted notebooks underwent comparative performance testing using the CAI application. A physical evaluation of
these notebooks was also conducted examining ergonomic issues such as keyboard feel and screen clarity. Some interviewers
were also invited to assess the equipment.
Following the detailed assessment described above, and further discussions of price and future plans, the decision was made to
purchase the IBM Thinkpad 340 (486dx 75Mhz colour with 4Mb RAM).
Purchase and delivery of the notebook computers were made in three lots with a total of 230 being purchased by 1996 when
the decision to curtail CAI was made. By the time the third lot of computers (150 in number) was ordered the 486dx processor
was no longer available and the IBM Thinkpad 560 (pentium 75Mhz colour with 8Mb RAM) was substituted.
At about the time of the placement of the third order for notebook computers (mid 1996) it was quite noticeable that 4Mb of
RAM was inadequate for good performance of version III of Blaise and RAM upgrades were purchased for all the existing
stock of 80 computers. This additional outlay was quite expensive.
While the notebook computers were certainly adequate for the operation of CAI applications (all in DOS) when purchased, the
speed of change in software was such that by the time they were two years old they were inadequate for operating anything
else. In particular, they were not suitable for Windows applications which restricted the possibilities for using Blaise 4
Windows.
The final price of notebook computers in 1996, including an encrypting modem and a three year service arrangement was
almost 100% more than the estimate prepared in 1994. The higher than expected costs were a significant factor in the decision
to pull back from full implementation of CAI in all household surveys
Occupational health and safety
A consultant was hired to conduct research into feasible and practical ways of minimizing the risks associated with the use of
notebook computers in CAI. A primary objective of the consultancy was to determine whether a suitable ergonomic aid could
be designed to support the weight of a notebook computer when used in a standing position.
The development of such an aid to interviewing was considered important because most face-to-face interviewing of the
Labour Force survey in Australia, our largest and most important household survey, is conducted at the door. Use of the
notebook computer in these circumstances, without a physical support of some kind, was considered to be an occupational risk.
To encourage interviewers to go indoors risked increasing the enumeration costs.
The consultants designed a prototype collapsible frame which was capable of supporting a notebook computer with safety.
Around 80 of the initial design were manufactured and used in the 6 month trial of CAI in 1996. Following feedback from the
interviewers the design was revised to make it more collapsible and more readily carried in the canvas bag used to carry the
computer. The design has subsequently been patented.
Apart from the ergonomic stand, revised field procedures have also been implemented for the major surveys undertaken using
CAI to date. In particular, respondents are requested to make available a suitable table at which the interview can be
conducted. Relevant literature and training is also routinely given to all interviewers undertaking CAI surveys about the
health and safety aspects of the use of notebook computers.
Security
Security of respondent data is an important issue and a number of measures were employed to ensure that the data was safe
both on the notebook and in transmission. The following measures were employed:
No floppy disk access - notebook computers were configured without an internal floppy disk drive to safeguard against
unauthorised copying to disk.
Screen saver – screen saver software was included to prevent access to the data if the notebook was unattended for any
period of time (such as during transmission).
Encryption and passwords - the notebook hard disk was encrypted (using Blockit software) so that data access was not
possible without a password. The encryption was also linked to the configuration of the notebook which made it
impossible to access the data on the hard disk if the configuration has changed. Passwords need to be updated by the
interviewer on a monthly basis.
Encrypted transmission - transmissions were carried out via an encrypting modem which ensured that the transmitted data
cannot be interpreted. While encrypting modems are much more expensive it was justified to protect the data.
Secure logon procedures - logon to the FTP computers in the office (for transmission) was done through a system which
requires the entry of a 6-digit pin number obtained from the readout on a smartcard (or key fob) which provides a
sequence of 6-digit pin numbers which changes once every minute. The FTP computer in the office matches the generated
pin number with the card number and registered owner (interviewer) before further access to the server is granted.
While this kind of system was more complicated to establish and the procedures took a while to master, there was a general
acceptance that our duty towards respondent privacy warranted it.
Infrastructure built for CAI
The development of CAI facilities happened at the same time as other significant developments were taking place at the ABS.
These were:
Development of a corporate data warehouse which provides a central store of all released and releasable statistical data
along with comprehensive metadata and access facilities. By policy all major systems in the ABS are required to link with
this facility and eventually deliver data and metadata to it.
Redevelopment of processing facilities for household surveys to overcome concerns about the viability of existing systems
(which use legacy software). Developments were also aimed at taking advantage of new technologies and linkage to other
systems such as the corporate data warehouse.
When CAI was first proposed there were virtually no support facilities in existence in the ABS. The plans for CAI therefore
included the development of infrastructure to support it. The main components which were developed were:
-
Survey Development Tool to facilitate preparation and specification of the survey concepts, data items, question modules
and derivations to feed the CAI instrument preparation
A field management system called the Interviewer Workload Management System
An Office Management System
Transmission facilities
These are described briefly below.
Survey Development Tool
Development of a survey questionnaire or instrument commences with the preparation of detailed data item specifications.
Before CAI the specifications had been prepared in the form of documents or spreadsheet tables which described the data items
in detail, including relevant respondent populations, definitions and response categories. The specifications provided in this
way were then converted to paper questionnaire designs by survey staff using publishing software. The focus of specification
in this case was the design of questions with little attention being paid to the edits, derivations and output items at this time.
The advent of CAI brought with it the possibility of applying edits and derivations in the instrument. It also opened up new
ways for designing simpler more modular questionnaires, as the number of pages (and hence the need for more convoluted
sequencing) was no longer a constraint. A way of specifying the questionnaire for more optimal Blaise coding and
questionnaire validation was also required. These factors significantly increased the complexity of the specification process.
In addition, because CAI requires the involvement of more people (eg. programmers), there was a need to make the
specifications more widely accessible within our network environment. At the same time, the emergence of the corporate data
warehouse was also placing pressure on areas to make their metadata available for linking with other collections.
As a result of these pressures it was decided to develop a special tool called the Survey Development Tool (SDT) which could
be used to store and manage the specifications (or metadata) for all household surveys and particularly the CAI surveys.
The design objectives of the SDT were to:
-
have a single centralised store of survey metadata (or specifications);
accessible to all who needed to specify, examine, modify or use the information;
assist with the management of the specification process;
assist with the instrument development and validation processes;
have the possibility of generating Blaise code;
link with the corporate data warehouse; and
be easy to use.
The SDT was developed as a Lotus Notes database which contained various forms to record all the specification details, and
structured views to assist with locating and reviewing the contents. Lotus Notes was chosen because it was, and still is, the
standard group-ware used by all staff at the ABS and was therefore considered to be the most user-friendly option.
The basic building unit of a questionnaire specification under this tool is a module of related questions. Such a module may
measure a single concept or group of related concepts and will generally be applicable to a defined population in the survey.
Earlier prototypes using a question as the building unit gave too many elements and were found to be difficult to manage. For
convenience a module can be seen as containing up to 10 questions although provision was made for larger modules. A
module has the advantage of having closely related questions kept together and could be small enough to treat as a single unit
that can be stored and reused for other surveys (without the likelihood of breaking apart). The module concept was also
similar to the block construct used in Blaise.
The SDT was designed to be linked with the Data Warehouse and a cycle of metadata exchanges were envisaged between
them to ensure that data items and concepts were aligned with those of other collections. Control of the development and
collection processes were to be linked with other corporate management facilities of the Warehouse. Integration of the SDT
with Data Warehouse is described in detail in a separate paper (Colledge et al 1996).
A production prototype SDT was constructed and used for the first few CAI surveys. The initial functionality was limited to
the development and storage of specifications, with some export functions to assist with other aspects of survey work,
including an early attempt at Blaise code generation. Unfortunately, the decision to pull back from full implementation of CAI
in all household surveys in 1996 meant that further work on this tool was also stopped. Nevertheless, the SDT has continued
to be used for all CAI surveys and is still in use today.
Further development of the SDT will occur as part of future work on the CAI infrastructure with particular attention being paid
to the links with other systems.
Interviewer Workload Management System
Soon after the commencement of work on CAI it was realised that a system was required to manage the interviewer work in
the field. Since there was no generic facility available from other agencies using Blaise (particularly not in Blaise III) it was
decided that one should be built.
The first prototype system for field management was built in the ABS using Pascal. This facility simply fed a list of addresses
in a screen to the interviewer who selected them for interview. This was adequate for the first few tests using CAI.
As soon as Maniplus became available (in beta form in late 1995) serious development started on a comprehensive Interviewer
Workload Management System (IWMS). Maniplus, being part of the Blaise suite, had the distinct advantage of being able to
extract information from Blaise data files for display and then update those same files with interviewer remarks, address
changes, appointment information and status codes, all fed from Maniplus dialog boxes and display screens. The compiled
facilities of IWMS had a consistent look and feel to the Blaise instrument and made the transition between field operations and
interview quite seamless.
The IWMS as developed in the ABS provides the following major functions:
-
receipt and transmission of data and programs from the office
access to training materials
listings of parcels of work (known as a workload)
listing the addresses to be visited
display the names and details of household members
recording of appointments
backup facilities
control the flow of interview between instruments
ability to update the status of records
The IWMS was intended to be a generic facility capable of managing all surveys in the same way. However, the differences in
requirements for complex surveys were such that the IWMS needed to be adjusted for almost every survey. Differences have
occurred in information to be displayed, different flow of interviews with different instruments, different recording of status
and different appointment details.
The main characteristic of the work provided to interviewers is that it is organised into parcels called workloads. A workload
is a group of addresses (usually in the same local geographical area) which are to be administered the same survey. The
number of addresses in a workload varies according to the complexity of the survey but is approximately what can be achieved
in a one week or two-week interviewing contract. The workload has its origins in the paper systems but was kept as something
that interviewers and office staff were used to dealing with.
Supporting the workload concept described above has made the management of cases under CAI a little more complicated.
This was particularly so when one or more cases need to be referred to the office, or to another interviewer, or when
transmission of some completed cases occurs. Because all cases in a workload are generally kept together, transmissions
would involve all records in the workload no matter whether those cases were completed or not. This can result in the same
record being transmitted to the office a number of times as the workload becomes progressively more compete. While this was
initially thought to be a problem, it turned out to have a positive aspect in that it provided multiple copies that could form
backup versions if the workload became corrupted or a transmission was lost for some reason. The problem with potentially
multiple copies of a workload being available, however, was to know where the latest copy of any case was.
The solution which was devised for tracking of individual cases in the field and the office involved the use of a control file
which is maintained as a Blaise data file in the office. The control file has a record of every case and an indicator of which
interviewer or system component has the most up-to-date details for the case. The operation of this control file is described in
more detail in a paper on the Office Management System (Henden et al 1997).
The main design feature of the IWMS is the use of "buttons" and fields that can be updated on the screen. The use of pulldown menus, although possible, has not been employed in the IWMS because most interviewers were not familiar with
computers and track balls, making buttons operated by Alt-key operations (or by tab key movement) easier to use.
Some performance problems were encountered in the refreshing of lists on the screen particularly when a case or household
record had been updated, or when the interviewer applied a sort operation to the list of addresses. These problems were
overcome through the use of indexing on the underlying data files.
The functionality of the IWMS has served our CAI surveys well and the latest version provides a good model for the one
which will be written in Maniplus under Windows for future surveys. It is expected that some refinements will be made to
make it more generalised and easier to maintain.
Office Management System
An office management system (OMS) was developed to manage the flow of work to and from the interviewers and to enable
the received data to be checked and prepared for processing.
The system was expected to provide the same degree of management and flexibility which existed with non-CAI systems in
existence at the time.
The OMS was developed during 1996 and now provides the following functionality:
-
assign selected addresses to workloads;
assign workloads to interviewers;
prepare respondent records for each workload from data collected previously;
collate workload data for transmission to each interviewer;
collate associated instrument software for transmission to each interviewer;
manage transmission to and retrieval of data from interviewers;
provide for reallocation of workloads or individual respondents from one interviewer to another;
enable the examination of received data to clean up 'dirty' records or to resolve queries raised by interviewers;
provide for the coding of some data fields in the office (eg. occupation, industry);
provide different levels of functionality for central and regional staff;
monitor survey progress and extract management information; and
export a clean data file for further processing.
The OMS facilities were built using a mix of Oracle/SQL, Blaise and DOS. The Oracle components were required to
interrogate and manage the links with the sample address lists (based in Oracle tables). The Blaise components were required
to load and prepare the instruments with records passed to it from the Oracle facilities, then package them and copy them to the
FTP server for interviewers to collect (by transmission).
Once the data is returned from the field (by transmission), Blaise based facilities are used to unload the data and present the
records to office staff for checking. At that stage additional coding may also be done. Survey data is then collated from
groups of interviewers into regional data files which are then sent to the central office for final checking and export to ASCII
files for processing by other systems.
A comprehensive description of the OMS is contained in a paper presented at the Fourth International Blaise Users Conference
in Paris (Henden et al, 1997).
As mentioned earlier, a key feature of the OMS is the use of a control file to track the location of respondent records between
sample systems, office processing and field work. Each time a respondent record is moved to or from any of the processes
which form part of the office and field systems, the control file is first checked to determine whether that process has control of
the record. If it does then the process is activated and a record is written or modified in the control file to indicate the change
in control.
Transmission
Transmission to and from the interviewers is managed through a series of regional FTP (file transfer protocol) servers
connected to the LAN and protected with a "firewall" which certifies the user (both internal and external) and controls access
to the facilities on the server. Dial-in access to the server is only possible through encrypting modems which ensure that all
communications are authorised and protected. Access is further controlled through a technique known as "strong
authentication" which requires the interviewer to carry a smart card (or key fob) that generates a single-use password with a
limited validity time (a few minutes) that can be validated by the server.
Experience with Blaise
As mentioned earlier, the ABS decided to use Blaise for CAI in household surveys following an evaluation of the software in
1994 (see earlier section). All the Blaise systems and survey instruments mentioned in this paper were developed using
version III of Blaise (various releases).
Some of the issues that have arisen in our use of Blaise are discussed below.
Developing software
A succession of updates in the early days of version III of Blaise did provide us with the challenges of testing the software and
then convincing our development and field operations staff that the new release would (generally) be better than the old with
risks of problems in the field being minimal.
Introducing new releases of any software to production systems does have an element of risk and it is pleasing to note that
generally the experience with Blaise upgrades of version III has been uneventful. The software release practices of Statistics
Netherlands have also improved considerably with very good versioning and update history now being made available.
Extent of use in ABS
Although Blaise has been approved for use in the ABS for household surveys it has been restricted to data capture and limited
office processing functions as described in this paper. The main reason for this has been that Blaise III is a DOS product and
many ABS applications, as well as the general office software, had been operating in a Windows environment for some time.
A further reason was that many of our processing systems made use of other software (eg SAS or Oracle/SQL) which was
where the expertise was and there was no convincing reason to change. Some of components of the Blaise software suite (eg.
Abacus, Bascula and CATI call management) have received little attention at the ABS as a result.
The advent of Blaise 4 Windows does open up opportunities for more extensive use of Blaise software in applications other
than household surveys. However its use may be limited by the ability for it to fit into the broader ABS corporate
infrastructure, in particular, the Data Warehouse and our office group-ware (Lotus Notes).
Some experiences in integration with Blaise III is contained in a paper presented at the Fifth International Blaise Users
Conference in Lillehammer (DeMamiel et al, 1998) which discusses the use of Blaise in the data capture of diary information
for the Household Expenditure Survey and the exchange of data and messages with office software.
Experience in programming in Blaise
Given the amount of infrastructure that needed to be built we quickly established a fair amount of expertise in the
programming of Blaise applications. Most of the training was on-the-job and made use of the manuals and sample code
provided with the software.
At the time of peak demand for Blaise experience in the ABS (probably 1996) there were 3 officers who were well experienced
in the programming of Maniplus and another 12 officers who were involved in writing the Blaise code for various instruments.
With the recent pull back in CAI, however, those numbers have reduced to around 3.
Who should write Blaise code
There are differing opinions on who should write the code for CAI instruments and a fundamental issue is whether the same or
different people are responsible for content development and CAI programming (Kinsey and Jewell, 1999).
At the ABS, the writing of Blaise code for instruments has been carried out by survey branch staff rather than programmers,
although advice and training has been provided by them. People writing Blaise code at the ABS have tended to be staff who
have some understanding and experience in survey processes and who posses an aptitude for or skills in programming work.
The specifications for CAI instruments are supplied by development staff or researchers who have training or experience in the
design and testing of questions. In order to standardise the specification process there has been a requirement to make use of
the Survey Design Tool (SDT) described earlier.
While there is no objection to the suggestion that development staff could write their own instruments there is a feeling at the
ABS that people with training and technical skills in question design and testing are better to focus on questionnaire
development work, while others with skills in programming are better to focus on the activity of Blaise programming. Given
the relatively high staff turnover in our survey infrastructure areas it would be difficult for someone to become highly
proficient in both areas of work, but more importantly the creative tension between the question designers and Blaise
programmers has been a healthy one for the surveys where we have pushed the limits of what is possible. There is also an
expectation that the further development of CAI facilities will result in more code being "generated" by the system which
supports the SDT.
The development of Maniplus facilities such as the IWMS and OMS described above has always been considered the function
of programmer staff at the ABS.
Software interaction problems at the ABS
The functionality of version III of Blaise has continued to improve over the years although a few problems in the software and
its interactions with ABS technical infrastructure remain. These are:
The sticky key problem - for some unknown reason, the Blaise III software occasionally produced a locking of certain keys
on the IBM 340 Thinkpad notebooks. Despite sending the computer to the Netherlands for further investigation and
upgrading the system BIOS this problem never disappeared. It was tolerated by interviewers who developed ingenious
methods for "unsticking" the keys so they could continue interviewing.
The network interaction problem - use of Blaise III produced an occasional problem on the ABS network (Banyan Vines)
which resulted in a "locked file" situation on the ABS logo file (in a read-only directory) and terminated the execution.
This problem was never resolved but could be avoided by removing the offending logo file from the software set.
The shared file problem - use of shared network files (for code look up) in an office data entry system (for entry of diary
data from the Household Expenditure Survey), involving 6 coding staff sharing the same network drive, produced
mysterious "crashes" which were only solved by localising both the lookup files and the software. (This solution also
produced better performance).
Resolution of some problems is hampered by an inability to run some of the diagnostic software which is only available to the
software developers, and the cost of arranging for someone to come halfway around the world to be on site to investigate
matters locally.
It is expected that the Windows version of Blaise will be more compatible with other software written for Windows.
Support from the supplier
Blaise software was developed by Statistics Netherlands and, despite the separation of distance, relations between the ABS and
Statistics Netherlands in relation to Blaise have always been good. The problem of whom to contact, which was present in the
early days of ABS use of Blaise, have largely disappeared with the creation of the [email protected] e-mail address. Nevertheless,
communications which are separated by time and distance can sometimes be a cause for frustration if systems are dependent on
an urgent solution to a problem, no matter how small. The inability to share one's problems face to face with the Blaise
developers is also a disappointment, although new possibilities could be opened up with video links over the internet.
The manuals for Blaise software and the sample programs which accompany the software are very useful sources of
information about its operations.
Sharing experiences
Given the extent of use of Blaise around the world, there should be an increasing pool of people to share experiences with.
The establishment of the Blaise user group with its newsletter and website, the Blaise Corporate Users Board, and series of
international conferences provides excellent avenues for the sharing of experiences to occur.
ABS staff have tried to maintain contacts with key people in the Blaise fraternity but it can be time-consuming because most
communications are by e-mail which takes time to compose. Furthermore, most people being consulted are heavily committed
in their own work areas and not always able to respond in a timely way.
Split datamodel instrument design
One of the advantages that CAI provides is the ability to store survey data collected information from a complete household
within one physical record. While this keeps the members of a household together it has the limitation of providing a more
complex instrument (essentially an array of person records) with many more fields, leading to a demand on both memory and
storage space. A single household record containing all persons also results in a nominal limit being placed on the number of
persons that can be included (currently 10 in the ABS).
When problems were encountered with lack of memory on the 4Mb notebooks, the possibility of separating the individual
questionnaires from the household was suggested as a way of reducing the demand on memory and improving performance
(Wensing, 1996).
This proposal became known as the split datamodel design in that it splits the physical datamodel into two or more parts. Once
the household part has been completed the interviewer drops back into the IWMS which presents a dialog box of the personal
interviews that remain to be conducted. Each required personal instrument is initialised with corresponding data from the main
household instrument. Edits in the personal instrument which need information from the household instrument can still be
carried out using relevant Blaise statements that can extract (lookup) the required data from the corresponding household
record.
The disability survey 1997 was the first survey to employ the split datamodel design and, while it complicated the management
of questionnaire flow in the IWMS, it was considered to be a success and has been used in most CAI surveys since.
The main disadvantage of the split datamodel is that both parts of the datamodel need to be present for any processes (such as
interviewing, editing or transferring data) to be applied successfully. On the other hand, a split datamodel enables each part to
be treated as an instrument on its own from the point of view of the data within it being considered clean and available for use.
Other instrument design issues
CAI has brought with it a temptation to collect more information because the constraints of a paper form do not exist. Thus, it
is easy to add a field here and there, or to collect text responses where previously there may have been a simple tick box. Also,
the limits on collecting the details of instances of something (eg. loan details in the HES) can be pushed out beyond those
which may have applied to a paper form. This has resulted in much larger record structures and greater volumes of data to be
processed, possibly at the expense of efficiency.
Integration with other processing
Use of CAI enables other processes, such as imputation and derivation of new variables, to be brought forward in the survey
cycle, thereby saving output time. Ideally some of these processes should happen in the electronic survey instrument and
Blaise provides the functionality for that.
While it was the intention of the CAI development team at the ABS to incorporate additional processes in the instruments that
have been developed over the past five years, in practice only those items deemed necessary for the conduct of the interview
have tended to be derived. In only one CAI survey at the ABS has this integration of derivations into the instrument been
achieved, and even then the processing was executed in the office. In all other cases the data has been extracted from Blaise
files and processed in other software (usually SAS).
A major problem encountered in transferring data to other software for processing was the need to translate the Blaise field
names into a set of unique 8-character names. The Cameleon software component of Blaise provides a function to “generate”
these unique 8-character names but the outcome suffers when an existing Blaise field name ends in a numeric character (and
the field is used in an array). This led to the preparation of a naming convention which kept those parts of Blaise names both
short and devoid of numeric character endings (Wensing, 1999).
The issues of integration of other processes will be looked at more closely with the next round of developments for CAI at the
ABS. An emphasis will be placed on translating the questions to as complete and final a data item as possible in the instrument
and keeping the re-processing of data in the office to a minimum.
Business case for renewed CAI
Despite the pull back from CAI in 1996, there has remained a positive opinion among survey staff at the ABS about the
prospects of continuing to make use of CAI. With the stock of notebook computers approaching the end of their serviceable
life, a business case was prepared in 1999 to recommend the continuation of CAI for larger household surveys.
The business case for the re-development of CAI focussed on three key aspects:
Better utilisation of notebook computers – by structuring the schedule of surveys appropriately so that there are no
significant peaks and troughs in the work, it is possible obtain more usage from the stock of notebooks than had been
obtained previously. This means that less notebooks are needed, saving on cost.
Determination to actively pursue the re-engineering of all processes – CAI has the ability to deliver data which is more
complete in that more of the processing operations (eg. coding, derivation) can be done in the field. These gains are only
possible if the development and operational processes involved are changed (re-engineered).
Management of the project - a strong commitment to carefully manage the project, so that all of the benefits that the
methodology can provide would be realised at some point in the future.
With this approach, it is expected that CAI will produce improvements in quality and timeliness and some small savings in
ongoing costs that will be worth the investment in hardware and software development.
Conclusions
What can be seen from the ABS experience is that CAI requires a fair amount of infrastructure and we have built almost all of
it ourselves. Given that other agencies using CAI need similar facilities there would be merit in some joint developments
occurring between agencies.
The Blaise suite of software has provided the underlying tool set for most of the facilities we have built. It may be appropriate
for more infrastructure elements to be built into Blaise software. One example where this has been done is in CATI call
management which operates on special blocks that are required to be added to CATI instruments. Maybe features like this
could be added to support case management via a generic case management tool (replacing our IWMS).
The ABS has gone from being an early user of Blaise version III to a late starter in Blaise 4 Windows. When Blaise was
chosen for CAI in 1994 other developments at the ABS were well advanced in the use of Windows, and office software was
about to move to Windows 95. Use of Blaise III for CAI kept those developments in DOS when other staff were becoming
used to a Windows environment. This meant that use of Blaise beyond data capture was unlikely to happen at the ABS. This
may change with Blaise 4 Windows.
Enhancement of Blaise and other software over time has increased the demand on hardware such that our CAI notebooks are
now suffering in performance. Software developers, such as those developing Blaise, need to be aware that users do not
always have the latest most powerful hardware and resist the temptation to make their software bigger and faster without due
consideration of the equipment implications for their customers.
The ABS has a diverse technical environment and only a few applications have been built in Blaise. With the move of Blaise
to the Windows environment it is hoped that there will be more compatibility between Blaise and other applications. That way
there will be greater opportunity to develop integrated solutions that draw on the best features of each software. One particular
need that arises out of integrated solutions is the need to be able to convert data and metadata more readily from Blaise to other
forms (and vice versa).
Finally, much has been learned about CAI at the ABS over the past five years and we are well positioned to launch into
another period of development in preparation for the next series of household surveys to use CAI commencing in 2001.
References
Colledge M., Wensing F., and Brinkley E. (1996), “Integrating Metadata with Survey Development in a CAI Environment”
Proceedings of the Bureau of the Census Annual Research Conference and Technology Exchange, Washington DC: US
Bureau of the Census, pp. 1078-1100.
DeMamiel M., Wensing F. and Green, B. (1998), “Diary and Office Processing: Integrating Blaise with other Facilities”,
Proceedings of the Fifth International Blaise Users Conference, Oslo: Statistics Norway, pp. 66-77.
Henden M., Wensing F., Smith K. and Georgopoulos M. (1997), “An Office Management System in Blaise III”, Proceedings
of the Fourth International Blaise Users Conference, Paris: INSEE, pp. 107-122.
Kinsey S. H., Jewell D. M. (1995), “A Systematic Approach to Instrument Development in CAI”, Computer Assisted Survey
Information Collection, New York: Wiley & Sons, pp. 105-123.
Manners T. (1992), “New Developments in Computer Assisted Survey Methodology (CASM) for the British Labour Force
Survey and Other OPCS Surveys”, Proceedings of the Bureau of the Census Annual Research Conference, Washington DC:
US Bureau of the Census, pp. 491-500.
Martin J., O'Muircheartaigh C. and Curtice J. (1993), “The Use of CAPI for Attitude Surveys: An Experimental Comparison
with Traditional Methods”, Journal of Official Statistics, 9, pp. 641-661.
Weeks, M. F. (1992), “Computer-Assisted Survey Information Collection: A Review of CASIC Methods and Their
Implications”, Journal of Official Statistics, 8, pp. 445-465.
Wensing F. (1996), “Memory Madness” International BLAISE User Group Newsletter, Issue number 9, ??
Wensing F. (1999), “Naming for Export: A problem concerning Blaise field names and export” International BLAISE User
Group Newsletter Issue number 12.
Session 6
Design issues in using Blaise
Configuration Management and Advanced testing methods for large, complex
Blaise instruments
Steven Newman & Peter Steghuis, Westat
Whatever Happened to our data model?
Sven Sjodin, National Centre for Social Research
What users want from a tool for Analysing and documenting electronic
Questionnaires: The user requirement for the TADEQ Project
Maureen Kelly, ONS
Converting Blaise 2.5 to Blaise4Windows
John O’Connor, Jacqueline Hunt, CSO
NASS Conversion to Blaise4Windows with a Visual Basic Interface
Tony Dorn, Roger Schou
Configuration Management and Advanced Testing Methods for Large,
Complex Blaise Instruments
by Steven Newman and Peter Stegehuis
Westat, USA
Abstract
Blaise instruments that Westat creates for its clients are often large and complex. These instruments can include hundreds of
files, including source code files, external data sources, and configuration files. Additionally, instrument development is
performed by teams under tight schedules. Efficient development and testing requires frequent builds (at least once a week) of
the instruments. Thus, these instruments create severe file management challenges. It is imperative to maintain version control
of all files, generate and track problem reports, and efficiently test the instrument after bugs are repaired and new features
added.
This paper describes some of the applications and methods that we are using to manage version control, error reporting, and
automated testing. We discuss how four kinds of tools have been adapted to help manage these functions during the
development of instruments. For version control we discuss Microsoft's Visual SourceSafe and Mortice Kern System's
(MKS) Source Integrity. For person-based interactive error reporting, we discuss our own error reporting system and its
integration with MKS Track Integrity. For automated testing of instruments and automated testing of Blaise as a system, we
discuss WinRunner by Mercury Interactive. The paper discusses the strengths and weaknesses of each type of tool in the
context of Westat's experience.
1. Introduction
Configuration management is the repetitive process of source code revision, testing, integration, and problem management.
Poor configuration management often causes serious and frustrating problems for software development. To manage a Blaise
project successfully, it is essential to track every change to every module in both large and small systems. Version control, in
its simplest definition, means keeping one official copy of each source module within the project. There are many
commercially available version control programs that can perform this task. This paper examines two commonly used version
control applications: Microsoft's Visual SourceSafe and Mortice Kern System's (MKS) Source Integrity.
More difficult then managing version control is the arduous process of testing and tracking problems in instruments. Westat
has developed an error reporting system that allows testers and other users to automatically record critical information about a
bug or problem in an instrument during data entry. The error reporting is invoked in the Data Entry Program (DEP) by an extra
menu option, Error Report, which has a short-cut key assigned to it. The Error Report menu option launches a Delphi
executable program. The DEP automatically passes parameters to the executable, a feature already supported by Blaise. This is
extraordinarily useful, as it 1) automatically records critical information such as the primary key, field name, field value, and
meta file name; 2) eliminates the use of paper; and 3) greatly reduces the overall burden of error reporting while increasing its
accuracy.
Simply discovering and recording errors is not sufficient. Errors must also be reviewed, assigned, corrected, and tested.
Tracking error resolution is complicated, labor intensive, and prone to management problems. With that in mind, Westat has
integrated its unique error reporting system with a mature and robust error tracking system, Track Integrity by MKS. With this
integration, errors are accurately recorded and entered into a tracking system with a few keystrokes. This paper explains
Westat’s automated error reporting and tracking process.
Finally, this paper addresses automated testing of Blaise instruments and automated testing of Blaise as a system and product
itself. Automated testing of instruments can be very problematic, as test scripts can be difficult to maintain during development
when the instrument is frequently changing. However, after an instrument has become reasonably stable, there is little doubt
that automated testing is an extremely useful tool for regression testing and maintenance. Testing Blaise as a product has also
been a focus at Westat. As a stable application, it is a perfect candidate for automated regression testing.
2. Version Control
2.1.
Importance
Version control of Blaise source code files is the only way to ensure reliable instrument development. The importance of
version control cannot be overstated. The entire task of configuration management revolves around the principle that only one
master copy of each source file exists. There are examples of instruments that were built and shipped without features and bug
fixes that developers knew they made. Invariably, their changes were indeed made, but were not included in the build because
another developer, working on the same module, copied his module over the changes made by the first developer. These types
of errors are completely avoidable when version control systems are used.
There are many other advantages of using version control besides the basic function of keeping one official copy of each
module. All version control products provide archiving capabilities that not only backup all revisions of each module in the
project, but also allows programmers to compare any of the revisions. This is of great value to programmers, who can easily
compare changes to modules made by all members of the development team. In this way, debugging is greatly facilitated by
version control.
Version control also solves the serious issue of code divergence. Code divergence occurs when there is an instrument release
that must be maintained and at the same time the development team needs to add new features and bug fixes for a future
release. Code divergence can also occur when an entirely new or experimental instrument is developed based on a revision
from the main development path. Code divergence is solved by two methods: labeling and branching. When a project is
labeled, every module in the project is given a logical label such as Version 2.12.0054. This enables all modules with a given
label to be retrieved whenever necessary (for example, to rebuild an older version of the instrument). Branching is the process
of taking one file or project in two different directions at once. By labeling and/or branching projects when instruments are
built, version control solves the code divergence problem while providing an easy way to build and maintain old versions of an
instrument.
Version control also provides an environment that allows for automating the build process. Batch files can be created that
confidently use the most recent version of the files needed for the instrument. Automated builds can be written to not only
build the instrument, but also to launch automated testing and distribute the instrument to testers and other users.
Version control forces structure on a project. Version control applications require the instrument modules to be in a special
directory structure defined within the version control application. Invariably, this forces the version control administrator, with
the assistance of developers, to create a logical group of folders in which to keep all the files necessary to build an instrument.
The latter point is also significant—in order to build an instrument from the master version control copy, all required modules
must be present. This frequently forces developers to assess which files are necessary, and becomes a catalyst for more
efficient instrument development.
Finally, though difficult to measure, version control is unquestionably cost effective. Version control applications cost
anywhere from $600 to $2000 per license, but the losses incurred by releasing inferior products and discovering bugs late in
development are far greater. Studies1 have shown that the later an error is found, the more it costs to fix, and the cost increases
exponentially. In one example, software development costs were approximately $75 per instruction and maintenance costs
were approximately $4000 per instruction. Version control helps to catch errors earlier. This has been confirmed by Westat’s
own experience, where projects that were late in implementing version control experienced more costly and difficult problems.
In summary, version control:
•
•
•
•
•
•
preserves source code integrity by keeping one master copy of each source file
facilitates debugging by allowing easy comparison between revisions
solves the problem of code divergence
provides an environment for automating builds
forces structure on the project
is cost effective
2.2.
Two Major Version Control Products
There are many version control products on the market. In this section we briefly discuss two of them: Microsoft's Visual
SourceSafe (VSS) and MKS's Source Integrity (SI). Both of these products provide robust and reliable version control.
In both version control applications, master projects are created on servers. Administrators create the master project, manage
security settings, create users, and assign user privileges. Developers then “mirror” the master project on their local drives.
When a developer wants to modify a module, the module is “checked out” of the master project, giving the developer
exclusive editing rights to the module. This means that the developer has a writeable version of the file to edit on his or her
local drive.
VSS calls the local areas where developers work working directories. SI calls them sandboxes. This conceptually and
practically embodies the main differences between the two version control applications. SI manages code divergence by
creating different types of sandboxes, called variant sandboxes. Thus, in SI, a new release is typically maintained as a variant
sandbox, which is, in fact, another physical group of directories on a server or other computer. VSS manages code divergence
by branching. Like the variant sandbox, branching is the process of taking one file or project in two different directions at
once. Up to the point of branching, files share a common history because they were one and the same. After branching, they
diverge. Each direction is a different development path. VSS tracks branches by making each development path a different
project within the VSS working environment.
Both applications provide excellent history tracking, revision numbering, labeling, and tools for viewing and comparing
revision changes. For projects that are time limited and that do not consist of years of upgrades and maintenance, VSS is more
than adequate. Ultimately, SI probably provides the most flexibility, but with the added cost of complexity.
Another consideration for implementing either VSS or SI is the time required for learning and configuring the systems and for
training personnel. For either system, there must be a skilled administrator, probably a mid- or senior-level analyst or
developer, who understands the concepts of version control. If the administrator has previous experience with version control
programs, he or she can master the basics of either application in a week or less. Developers who are clients on the systems can
be taught the basics in less than an hour.
Both systems integrate with error tracking systems. VSS integrates with Visual Intercept, by Elsinore Technologies. SI is
integrated with another MKS product, Track Integrity, a highly configurable change management system that tracks errors,
proposals, and work instructions. For those who are interested in a completely integrated change management system that
includes proposal and specification integration, problem tracking, and work instructions, as well as version control, SI is more
strongly indicated.
1
Testing Computer Software, Kaner,Falk,Nguyen, pg 31, Boehm study
2.3.
Blaise-specific Considerations
When placing Blaise projects under version control, it is important to consider all files in the project, including the data files.
Typically, version control systems only retain source code modules, include files, specification files, and other source files.
Files that are the result of compiles or are otherwise generated, such as Blaise data files or object files by C compilers, are
typically not included in the version control system. However, Blaise projects frequently include generated files that are
essential to the project and that rarely change once they are created. Examples include lookup tables (external Blaise files),
Maniplus shells, and Manipula setups that connect to other programs. These are candidates to include under version control,
keeping in mind that a goal is to be able to build an instrument completely from the contents of the version control project.
Ultimately, including these files under version control can be evaluated on a case by case basis.
2.4.
Possible Blaise Enhancements to Help With Version Control
There are problems associated with identifying the version of Blaise instruments. These are most evident when new instrument
versions are distributed (with and without new data models) and when problems are reported about an instrument.
Configuration management procedures assign a version number to an instrument, such as 3.12.0008, where 3 is the major
version number, 12 is the minor version number, and 0008 is the build number. (This is similar to the scheme that the Blaise
system itself currently uses.) In this scheme, the build number is incremented at each build. The minor version number is
incremented for minor instrument changes or milestones, such as when the data structure changes. The major version is usually
reserved for major functionality such as adding multimedia to an instrument.
When distributing updated versions of an instrument, electronically or otherwise, managing the update process for hundreds of
interviewers is a formidable task. This becomes even more difficult when the update also includes a change in the data
structure. In this case, previously collected data cannot be read using the new data model, requiring the data to be restructured.
Without clear identification of the instrument version, these tasks become very difficult.
The inability to identify an instrument version number also causes problems when errors are discovered in an instrument. At
this time it becomes imperative that the instrument version be recorded along with the problem report. Not all interviewers
receive their updates at the same time, therefore, we cannot assume that all interviewers are running the same instrument at the
same time.
These scenarios lead us to the follow questions:
1.
2.
When a user receives an update or reports a problem, what instrument version is being used and how can it be found?
For a Blaise data file, how do we know which instrument version it was created with and which Blaise data model to use
to read it?
Resolving these questions is facilitated when instrument versions are easily known. Interviewers can be confident that they are
using the latest version, and data model “matching” can be managed.
To help resolve these questions, in some projects we now code the instrument version as a field of the data model. This version
field has to be updated manually every time there is a new build. We then display the contents of the version field on the screen
of the questionnaire –typically on some easy to remember place, such as the first question in the questionnaire. In this case, if
an interviewer reports a problem, then he or she can press the Home key while in the DEP and read the instrument version.
This is not the preferred way to display the instrument version. It would more robust and convenient if we did not have to hard
code it in the data model and if it were accessible from any screen in the questionnaire.
A possible Blaise enhancement to make the instrument version more accessible would be to include it in the MI file of a
prepared data model. The MI file already stores the date and time of preparation. If the instrument version were an element of a
Blaise project file (bpf), the major and minor parts of the version could be set explicitly and the build number portion could be
automatically incremented every time the main data model was parsed successfully. The instrument version could then be
written to the MI file. The DEP could then use a menu option, such as Help or About, to display the instrument version
number. In this case, the Structure Browser could also display the version, since it reads the MI file.
Solving the problem of data model matching is more difficult. Hard coding the instrument version in a data field does not solve
this problem, because even if the version is part of the data record, we can’t read the data until the instrument version is
known. Furthermore, having interviewers send the MI file, which is frequently very large, with every data file is not practical.
We currently have a non-elegant solution for this dilemma—we automatically create a text file with the version number of the
instrument. The interviewer sends the text file along with the Blaise data file (BD file). We can read the text file and know
which data model version to use to read the BD file.
A better solution can be achieved by using the MI file. In the same way that we suggested storing the instrument version in the
MI file, it may be possible to copy it from the MI file to a generally accessible part of the BD file. In this case, a Blaise
enhancement could provide a way to read the information from the BD file, perhaps by using Manipula. This could be read
regardless of which version of a data model the BD file was created with. This would still require a two-step process—first
reading the version number from the BD file and then pointing to the right MI file—but it would be more manageable and less
error-prone than using text files.
3. Testing and Error Reporting
“Software testing is defined as the execution of a program to find its faults.”2 More time is spent on testing than in any other
phase of software development, and there is no question that software that is not tested will not work. Software testing is
difficult to design, time consuming, and repetitive. In addition, testing is only the first part of a cycle of error resolution. The
typical process consist of seven steps:
1.
2.
3.
4.
5.
6.
7.
testing
error discovery
error recording
assignment
fixing
unit testing
integration
There is great complexity and bureaucracy in tracking these steps. At the most basic level, testers can record the problems they
discover on problem sheets. The problem sheets can be sorted, distributed, and tracked. However, this is usually not successful.
At the very start, problems are not accurately described and critical information required for resolution is not recorded.
Problems recorded on paper are difficult to track and archive efficiently. Automating the process is the only way to ensure
success.
3.1.
Westat’s Automated Error Recording System
With this in mind, Westat developed an error reporting system that can easily record errors during data entry and automatically
enter the errors in a problem tracking system, Track Integrity (TI) by Mortice Kerns Systems. This is extraordinarily useful, as
it: 1) automatically records critical information such as the primary key, field name, field value, and meta file name; 2)
eliminates the use of paper; and 3) greatly reduces the overall burden of error reporting while greatly increasing its accuracy.
The error reporting executable, a Delphi program, is integrated with the instrument. A menu option that runs the executable is
placed in the DEP's Options menu and a short-cut key is assigned to it. When a problem or proposal is discovered during data
entry, pressing the short-cut key invokes the dialog shown in Figure 1.
2
Managing the Software Process, Watts Humphrey
Automatically
recorded
Figure 1: Dialog for Automated Capture of Problem Information
The primary key, field name, field value, report date and time, meta file name, instrument date and time, and the Windows
login ID are all captured automatically. The user only selects the Type, Source, enters a Comment, and presses the Save button.
When the Save button is pressed, the problem report is inserted into a TI database. If the TI database is not available, such as
when a user is using a laptop, a text file is written which can later be automatically integrated into the database.
The efficiency of this process for recording errors cannot be overstated. Of particular interest is the great amount of
information that is recorded automatically. Furthermore, the selections in the Type and Source list boxes are configurable, so
that the list of choices that appear in the Type and Source list boxes can be easily determined by the administrator. Errors are
accurately and easily recorded, which greatly reduces the burden of testers and other users. Because errors are entered into a
tracking system, they can be traced throughout their resolution. Once errors are in the database, they can be reviewed,
assigned, corrected, and tested.
Frequently, a text description of a problem is not sufficient and a screen capture is required for completeness. Though not
currently implemented, it would be very simple to acquire a screen capture on demand. Significantly, the TI database supports
attaching a file to a problem report, so the infrastructure already exists to associate files (screen captures or other file types)
with a problem.
In the next section we will show an example of how Track Integrity records and displays problems and how Westat has
integrated its automated error reporting capability shown in Figure 1 with Track Integrity.
3.2.
Track Integrity Database Example
Track Integrity is a highly configurable change management application. It controls the software configuration management
process by tracking the relationship between three classes of inputs: problems, proposals, and work instructions.
To illustrate how a problem is recorded, we will show an example of the TI database. Figure 2 shows the problem overview
display from TI. Problem ID 103 (the highlighted entry) is the most recent entry, and is the problem report example recorded
in Figure 1.
Figure 2: TI Problem Overview Display
Figure 3 shows a detail of Problem 103, and contains some of the information passed by Westat’s error reporting system,
specifically the Type, Summary, and Description.
Figure 3: Detail of TI Problem Report
Pressing the Custom button in the lower right-hand corner displays the rest of the information transferred by the error reporting
system. This is shown in Figure 4.
Figure 4: Customized Portion of TI Problem Report
3.3.
Conclusion
Automating the error recording process and integrating it with a tracking system can profoundly reduce software development
costs while simultaneously producing more error free instruments. By reducing the burden of reporting, testers have more time
to execute test plans. Problems tracked in a robust tracking system can be resolved with confidence.
4. Automated Testing
4.1.
Benefits of Automated Testing
Software managers and developers are being asked to turn around their products within tighter schedules and with fewer
resources. More than 90% of developers have missed ship dates. Missing deadlines is a routine occurrence for 67% of
developers. In addition, 91% have been forced to remove key functionality late in the development cycle to meet deadlines.3
Automated testing can help alleviate these pressures. There are three significant benefits to combining automated testing with
manual testing: 1) production of a more reliable instrument, 2) improvement of the quality of the test effort, and 3) reduction of
the test effort and minimization of the schedule.4
Ultimately, because of the repetitive nature of testing, particularly regression testing, the process must be automated. Although
all test phases—unit, integration, and system—can profit from automated testing, it is important to distinguish the types of tests
that benefit the most from automation:
1.
2.
3.
3
4
Performance testing—confirming that response times of the instrument are within acceptable limits
Stress testing—ensuring the instrument runs under maximum loads and high volume scenarios
Regression testing—performing identical tests on an instrument before and after a bug has been fixed or a new feature
added. A regression test allows the tester to compare expected results of a test with the actual results.
Automated Software Testing, Dustin, Rashka, Paul, pg 3
Ibid, pg 37
4.2.
An Overview of Automated Testing
Automated testing tools such as WinRunner, by Mercury Interactive, provide a way to record and play back mouse
movements and keystrokes. These recordings are called scripts. Scripts are written in special scripting languages, similar to
Visual Basic or C, and can be corrected and customized. Scripts that only play back keystrokes and mouse movements would
only test an instrument’s graphical user interface (GUI). That is, they would only confirm that a new build of an instrument
accepts recorded inputs. They could not detect if the position of the input fields on the page have changed or if features not
affecting the input sequence have changed or been added.
For robust testing, scripts must do more than simply play back mouse movements and keystrokes. They must also do object
testing. Object testing records the properties of objects in an instrument, including non-visible properties that cannot be tested
manually. For example, an object or control would be any input, display, or interface device within an application, such as edit
boxes, list boxes, form pane, buttons, and so on. A property would be an attribute of the object such its location on the page,
height and width . Figure 5 is a page from a typical instrument. Using WinRunner, we can capture the properties of the field
labeled Employer, for which Westat has been entered. Figure 6 shows the dialog displaying the properties of TInputLine,
which is the name of the control containing the entry Westat in Figure 5. The list of attributes for TInputLine appear as a list in
the name column. It includes the height, width, and X,Y pixel positions of the control. If there were a new build and, for some
reason the position of the control changed, WinRunner would report an error.
Figure 5: Page from an Instrument
Figure 6: Properties of Object TInputline
Testing tools can also provide image comparisons, where a baseline screen image is obtained and compared to an image
acquired during testing of a new build. Object Properties, Region Image, Object Data, and other comparisons are referred to as
test cases, or checkpoints. A test case acts as a validation point for the application under test. Test cases are created to capture
and record information about the current state of an object in the application under test. The test case then stores the
information as a baseline of expected behavior. As subsequent builds of the application become available, the recorded test
procedures are played back against the new builds to compare them with the established baseline. When a test procedure is
played back, the testing tool repeats the recorded actions. Each test case recaptures the information and compares it to the
baseline. If the information is the same, the test case passes. If not, the test case fails.
4.3.
Testing the Blaise System and Blaise Instruments
It is important to distinguish between testing Blaise as a system/product and testing an instrument that was developed using
Blaise. In the former case, testing is performed on a stable, mature application. There are typically few GUI changes from one
Blaise version to the next and scripts written for one build should easily work on another. Testing instruments that were
developed with Blaise is more problematic. Since there are frequent and intentional changes to the instrument during the
development phase, previously recorded scripts quickly become out of date and unusable. However, as instruments become
mature and stable, automated testing becomes more useful. As an aid for updating scripts, testing tools provide a feature that
allows a script to be updated with new or changed information during play back. This makes minor updates more manageable.
The capability to recognize Delphi object properties requires that Statistics Netherlands compile files supplied by the testing
tool manufacturer when preparing the Blaise system. This extends the automated testing ability from only comparing screen
images to checking Delphi specific object properties. The extent to which a testing tool can recognize Delphi objects and
properties is determined by the robustness and completeness of the files the testing tool manufacturer supplies to Statistics
Netherlands. To support Delphi, the manufacturers must create up-to-date files when Delphi versions change. This
commitment to Delphi support is imperative when evaluating a tool for Blaise testing.
Automated testing of Blaise as a system has been a focus at Westat. In this case, we have a stable system that, upon new
releases, can be tested using various data models. This is a classic example of regression testing. Blaise tools such as Manipula
and Hospital can also be tested. Figure 7 shows a flow chart for the process of testing the Blaise DEP, where each n represents
a different data model selected to optimize testing for different aspects or targets for each test. Example aspects include normal
interview, extreme navigation, parallel blocks, lookups, etc. Note that there are two paths of testing: a baseline branch and a
testing branch. The baseline branch stores the information as a baseline of expected behavior. The test branch plays back
recorded procedures with new builds to compare their results against the established baseline.
Processing Flow for Testing the Blaise System (DEP)
Baseline Branch
Blaise
Baseline
System
DEP Source[n]
Instrument
prepare
Blaise
Testing
System
run
Instrument
DEP[n]
Testing
Tool
Baseline
Results
preload
scripts
compare
DEP[n]
Testing
Tool
Test
Results
Test
Report[n]
Testing Branch
________________
Notes:
n = external or Westat DEP source
Figure 7: Processing flowchart for testing the Blaise DEP
Figure 8 is a Requirements Tracing Matrix for testing the Data Entry Program (DEP). Westat has created similar matrices for
testing the Blaise Control Centre, Hospital, Cameleon, Manipula, CATI, and other Blaise system components. Each row
represents an aspect of the DEP being tested. A column exists for each data model being used for testing. Within each cell is
the name of the script that meets the required aspect test for each data model. To avoid unnecessary and redundant testing,
there are empty cells indicating scripts that are not required.
Instrument Names
Aspects
Normal interview
Interview with edit failures and other
navigation
Extreme navigation
Edit invoking, edit navigation
Parallel blocks, parallel tabs
Language switching
Functions keys
Lookups
Browse records and other data file
access
Coding – hierarchical
Coding – trigram
Coding – alphabetical
WinHelp
Multimedia
Audit trails
Stress
Display features
Data storage
Diary
DIAR0001
DIAR0002
DIAR0003
DIAR0001
DIAR0001
DIAR0004
DIAR0001
Eu9707s1
EU970001
EU970001
DACFINFA
DACF0001
EU970001
EU970002
EU970001
EU970004
HLFS0002
DACF0001
EU970002
EU970001
DIAR0006
DACF0001A
EU970004
DIAR0001
Figure 8: Requirements Tracing Matrix: DEP
HLFS0001
HLFS0001
HLFS0001
EU970003
EU970001
DIAR0005
HLFS
EU970001
HLFS0001
HLFS0001
HLFS0001
The complexity of testing such a large system becomes immediately apparent. There are hundreds of scripts to run in various
combinations to get complete regression testing coverage. Testing tool programming languages provide a way to run these
script combinations. This means that we can play back a row, column, or any combination of scripts as one test, rather then
executing each script individually. This provides great flexibility in focusing the testing on suspected weak areas. Scripts can
run overnight, with obvious savings in cost and time. The testing tool automatically records test results.
4.4.
Final Comments on Automated Testing
There is a substantial learning curve and commitment associated with learning and implementing automated testing tool
software. In particular, while recording scripts can be relatively simple, to implement a robust automated testing system, the
scripting language must be learned. As with any high level language, this takes some time and experience. When testing the
Blaise system, for example, the Requirements Tracing Matrices indicate the numerous scripts and scenarios that have to be
addressed. A “front end” programming task, written in testing tool script language, could provide the user with an interface to
select which scripts to run. Tasks such as pre-loading data and launching instruments need to be programmed. Furthermore,
testing tool systems come with management software that must be implemented to successfully plan, track, and report the
testing process. Finally, as distributed and Web-based systems become the rule, automated testing tools can simulate hundreds
of users for load testing—a topic we can address in the future. Given the growing complexity of surveying instruments and
scarcity of resources for testing, time spent learning and implementing automated testing is time well spent.
References
Humphrey, Watts S. 1990. Managing the Software Process. New York: Addison-Wesley Publishing Company
Kaner, C., Falk, J., Nguyen, H. 1993. Testing Computer Software, 2nd ed. New York: Van Nostrand Reinhold
Dustin, E., Rashka J., Paul J. 1999. Automated Software Testing. Reading, Massachusetts: Addison-Wesley Publishing
Company
Microsoft Corporation. 1996. User’s Guide, Microsoft Visual SourceSafe, Version 5.0, Microsoft Corporation
Mercury Interactive. 1999. WinRunner Tutorial, Version 6.0, Sunnyvale, California: Mercury Interactive Corporation
Whatever Happened To Our Data Model?
Documenting Change in Continuous Surveys.
Sven Sjödin - National Centre for Social Research, UK
Many, if not most, of the large social surveys are either conducted continuously or are repeated at fixed intervals. The survey
processing systems can usually be recycled with some alterations for the next wave. The effort spent on these amendments
depends on how much the data model has changed. The amount of work can, however, be reduced by good documentation of the
data model changes.
Of course, there are already methods to document data collection instruments - survey organisations have a strong business need
for such documentation. Moreover, the TADEQ project will develop a standard system for documenting computer assisted
interviewing instruments once it is completed. Meanwhile, most organisations have developed their own systems for
documentation. Others have to make do with what the Blaise system can offer: the Blaise data model specification, the Structure
Viewer and Cameleon. However, while some of these documentation systems may be extremely elaborate they fail to address the
issue of alterations to data models, they still only give the static picture of a data model.
1. The Survey
Our need to develop a system for documenting changes between successive data models arose from the Family Resources
Survey. This survey has a very complex instrument, as it is designed to collect information on all kinds of household income in
great detail. The survey is conducted in co-operation between the National Centre for Social Research and the Office for National
Statistics (ONS). The data collection and editing are shared between the two organisations, while the National Centre maintains
the data model and the ONS processes the data for delivery. The data collection is conducted continuously and the data model is
revised once a year.
The Department of Social Security (DSS) - the client - has specified the delivery data as a set of tables together with detailed
meta data documentation. The production of the delivery tables requires a very complex data processing system. Even small
changes to the data collection instrument will have consequences for the processing of the data. For example, an added answer
category to catch a new benefit payment requires a new output table entry with a unique key value. The data output system is too
elaborate to re-design each year. To make the necessary amendments, the specialists at the ONS and the DSS need the best
possible documentation of what exactly has changed since the previous wave.
2. Program Requirements
There are four key requirements for the documentation of changes between successive data models:
•
It must be generated from the Blaise files, either the data model specification or the prepared data model, as manually
maintained documents may not reflect the true contents of the data models;
•
The documentation must record all the relevant changes without over-reporting irrelevant differences;
•
It should be automated as far as possible; and
•
Finally, the system should be applicable to all surveys.
2.1 Comparing What?
Which is the best basis for the comparison: the data model specification or the prepared data model?
The data model specification is the complete definition of the data model, often referred to as the source code. It is possible to
compare two data model specifications and report on the differences using a standard file compare utility, e.g. FC or DIFF.
However, this method would generate a vast output file. Every differing byte in the two input files is reported. It requires a parser
to analyse the output file and eliminate the irrelevant differences. At this level of program development, it would be more
efficient to build a parser that produces a standardised description of each data model specification and then to compare the two
descriptions.
The alternative to the data model specification is the prepared data model. This is not directly readable. It can only be accessed
via the Data Entry Program, the Structure Viewer or Cameleon. Cameleon has a well-defined language that allows you to specify
how to record information about a data model in an output file. All the information from the FIELDS sections is available for the
output specification. However, Cameleon has no knowledge of the RULES sections.
2.2 No Rules?
From the point of view of the current users, reporting differences in the RULES sections between successive data models may not
be a necessary feature as long as the document signals changes to the number of block and field iterations. For example, in a
household survey instrument, the number of possible respondents has been reduced from twelve to ten. This is an important
change that must be reported, but it doesn’t require any direct knowledge of the RULES, because the change will also be reflected
in the array sizes of person level blocks and fields.
Another RULES related change that may be of interest is in the sequencing of the fields. Although the order of the fields in the
FIELDS section doesn’t have to be the same as the order in the RULES section, it is good programming practice to synchronise
them; and Cameleon can be instructed to assign a sequence number to each field.
3. The Design
In designing the system to document changes, the basic idea is to let Cameleon record a standardised set of properties for each
field, then sort them by field name and compare the lists. Any reported difference is categorised into one of three types;
•
A deletion - a field or answer category that has been removed from the new data model;
•
An insertion - a new field or answer category; or
•
A change - a field that is re-specified in some way.
3.1 The Level of Cameleon Output
The implementation of this simple idea of comparing standardised and sorted lists of fields is not as easy as it may seem. There
are a number of factors to consider:
•
First, how to handle the answer categories for enumerated and set field types? The documentation system has to be
able to detect and record any changes to single answer categories, even if the field level properties remain unchanged. The
answer categories are on a relational level below the field to which they belong. Each field can have a number of answer
categories, but each answer category can only belong to one field. The easiest solution is to let each answer category form a
separate record in the output file so that they share the field level properties but differ in the answer level properties. The
resulting file will then have the answer category, rather than the field, as its basic level.
•
Second, whether to record all the instances of a field or just one instance? This issue arises out of the fact that fields,
and blocks of fields, can be repeated in arrays. Recording all the instances of a field would give a much larger output file
and, unless suppressed, changes will be reported over and over again for every instance of such a field. Selecting just one
instance of a field is more efficient, as long as a change to the array size can be detected.
•
Third, how to deal with different fields that share the same field name? Blaise allows fields to have the same name as
long as they are declared in different blocks. As the Cameleon output is sorted by field name, these fields will be stored in
adjacent records. There is a risk that the wrong fields will be compared, which would result in changes being reported where
no change has occurred. The solution is to sort the records by sequence number as well as by field name.
3.2 The Field Properties
Each field and answer category should be sufficiently well described to allow for a detailed comparison. The properties we have
selected include:
1)
2)
3)
4)
5)
6)
7)
8)
9)
10)
11)
12)
13)
14)
Field Name
Field Sequence Number
Field Path
Field Text
Field Type
Field Attributes
String Length (for String type fields)
Lower Bound (for Numeric type fields)
Upper Bound (for Numeric type fields)
Number of Codes (for Enumerated and Set type fields)
Number of Choices (for Set type fields)
Answer Index (for Enumerated and Set type fields)
Answer Code (for Enumerated and Set type fields)
Answer Text (for Enumerated and Set type fields)
Some of the above properties may need further explanation. The answer index can differ from the actual answer code. The Blaise
programmer may have defined the answer code, but the answer index is always incremented by one. The field path gives the full
field name, including the names of enclosing block fields, separated by dots. The field type is defined as Enumerated, Set,
Integer, Real, String, Date, Time, Open or Class.
Not all the properties apply to all the fields. For example, fields of the types Date, Time and Open can only have meaningful
values for the properties one to six. Field properties that don’t apply are generally set to zero or one or a null string.
There are some other field properties that are worth considering. It may be useful to include the field description text (or field
label) for data models that consistently use it. The field description gives the best indication of the meaning of the field.
4. Notes on Implementation
The Cameleon script allows the user to specify the level of the output. As mentioned above, one issue relating to the level of
output is whether to record all the fields or just one instance of each field. The default setting is to select one instance, but the
user can override this by telling the script not to suppress the repetition of arrays. If the array repetition is suppressed, the user
can still select whether to output the first or the last element of the array. Selecting the last element means that the program will
be able to detect changes to array sizes. This is possible because the field path property then records the highest index number of
all the array elements.
It may cause a serious problem for the comparison of the Cameleon output if several fields share the same name. Sorting the
records by sequence number as well as by field name only works if the two data models have exactly the same number of these
fields. Some data models may have special identifier fields in repeated blocks that stores the situation, person, instance, etc, that
the block relates to. If each of the blocks has a unique name (instead of being declared as an array) and the number of these
blocks differs between the data models, the comparison won’t work. Therefore, an additional parameter to Cameleon allows the
user to specify any field name that should be excluded from the output files.
Comparing the two Cameleon output files is a routine data processing task. Pairs of records are compared. If a record is missing
in one of the files, it is either because of a deletion or an insertion. If the pair has exactly the same contents, it is ignored. If they
differ, the program has to establish in what way. The current program applies a priority order of field properties, to avoid overreporting of fields that have changed in more ways than one. This could be amended so that the user can select whether to report
only the most important change for a field or all changes for a field.
Most of the field properties are compared literally. It is only the text properties that require some special handling. We have
designed the current program to take a very simple approach. Only letters, digits and brackets are included in the comparison and
all the letters are converted to upper case. This means, for example, that adding or deleting a comma will not be reported as a text
change whereas renaming a text substitution variable will be reported.
5 The Report Output
There are eleven possible report files, five of which are for printing and six of which are prepared for further processing. The
reason for the latter is that the principal end user wants to load the files into Excel spreadsheets.
The non-printed files contain the Cameleon record from the old data model and, if applicable, the Cameleon record from the new
data model. As all the field properties are comma separated, the records can easily be imported into Excel. These six files contain
deleted fields, inserted fields, deleted answer categories, inserted answer categories, changed fields in field name and changed
fields in sequence order.
The printed files only document the changed fields. Two files record all the changes, one in field name order and one in field
sequence order. The contents of the former is then further split into a file recording text changes, a file recording field type
changes and a file recording changes to the block or array structure. The latter distinction is possible because the field path is
included as one of the field properties.
6. Different Versions
The system for documenting change between successive data models was originally developed in a DOS environment. The user
starts by running the Cameleon script on both data models, copies the output files to a common directory and runs a DOS batch
file. The batch file takes two parameters: the name of the old data model and the name of the new data model. At the core of the
batch run is a QuickBasic program that compares the two files and generates the output files.
The system has subsequently been updated to run in Windows using only Blaise 4 Windows tools. A Maniplus shell, that collects
information from the user and runs the appropriate Cameleon and Manipula routines, controls the processing. A Manipula setup
converts the Cameleon output into Blaise data files. Additional Manipula setups compare the two data files and generate the
report files. All the records that differ between the two data models are stored in a single Blaise data file. In the Windows version
the user can select either or both of the report file formats.
The Windows design is clearly preferable to the DOS version. The user is able to select the data models, set the parameters and
specify the report format in one single environment. There is, however, one small difficulty: the inability to store and process
long strings in Blaise. It is not possible to store the field text in a single data structure, as a field, an auxfield or a local. The only
way around this is to store the field text as an array of strings.
7. Conclusion
The documentation of change between successive data models is already being used with great success for the Family Resources
Survey. It has also proved useful in other surveys. It could provide even more benefits if a future Cameleon has access to more
information from the RULES sections. For example, knowledge about the number of edits in each block would make it possible to
quickly find out why two consecutive data models are incompatible.
What users want from a tool for analysing and documenting electronic
questionnaires: the user requirements for the TADEQ project
Maureen Kelly
Abstract
The TADEQ project is funded under the European Commission’s Esprit programme to develop a tool for documenting and
analysing electronic questionnaires. It is led by Statistics Netherlands and the other partners are the Office for National
Statistics, UK; Statistics Finland; Instituto Nacional de Estatística, Portugal; Max Planck Institute, Saarbrucken, Germany.
National Statistical Institutes (NSIs), research institutes, and commercial marketing research organisations are making an
increased use of computer-assisted interviewing (CAI) systems for collecting survey data. The growing possibilities of
computer hardware and software have made it possible to develop very large and complex electronic questionnaires. As a
consequence, it has become more and more difficult for developers, interviewers, supervisors, and managers to keep control of
the content and structure of CAI instruments. The TADEQ project proposes to develop a flexible tool for documenting and
analysing electronic questionnaires. As a documentation tool, it must be able to produce a human-readable presentation of the
electronic questionnaire.
The paper will describe the first stage of the project: the user consultation and translation of the results into a user requirement
to serve as a basis for the remainder of the project.
Keywords: TADEQ; user requirements; documentation; flexibility; electronic questionnaires
Introduction
Questionnaire documentation is a core tool within the survey process. Throughout the life of a survey there are many different
users of the documentation who use it to perform a number of different tasks. Computer assisted interviewing (CAI) systems
are increasingly replacing paper questionnaires to collect survey data. The documentation of the CAI instruments used to
collect data, electronic questionnaires1, has been problematic and time-consuming. The increasing capabilities of computer
hardware and software have made it possible to develop very large and complex questionnaires. It has become increasingly
difficult to comprehend these complex questionnaires in their entirety. The TADEQ project was set up to develop a tool for the
automatic documentation and analysis of electronic questionnaires.
1.
Background
Computer Assisted Interviewing
National Statistics Institutes (NSIs), research institutes and commercial market research organisations are increasingly using
CAI instruments used instead of paper questionnaires to collect survey data. CAI has made many quality improvements to
survey data that have been well-documented (see for example W L Nicholls II et al. or M Couper and W L Nicholls II).
However, one area where CAI instruments have not brought improvements is questionnaire documentation. The paper
questionnaire, as well as being the interviewing tool, also served as its own documentation; it contained the information
required by documentation users – the questions and the routing instructions. The edit checks were carried out separately in the
office and these were usually available in a separate document.
With the introduction of CAI, questionnaires became more complex. At the same time, it became more difficult to provide
documentation to understand them. The documentation of CAI instruments became a separate task, one that was not necessary
when paper questionnaires were used. At first, this task was not recognised. In the early days of CAI, when electronic
questionnaires were developed for computers of limited size and speed the computer programs were seen by the pioneers as
‘self-documenting’: the programs contained all the information about the questions asked and the routing. However, to a nonprogrammer, using the actual program could be confusing. Users were nevertheless forced to accept it, as it was the only
documentation available. This situation was always unsatisfactory and soon became wholly untenable: as CAI instruments grew
____________________
1
Throughout the paper CAI instruments and electronic questionnaires are used to refer to computer programs which are used for data
collection. CAI programs refer to the source code used to produce the electronic questionnaires.
more complex users were unwilling and unable to use the CAI programs. Therefore users required other forms of
documentation of the electronic questionnaires.
Current solutions to the documentation problem
At present there are a variety of ways in which users have attempted to solve their documentation problems: producing separate
questionnaire specifications independent of the CAI program; manual editing of the program; and semi-automated
documentation of the electronic questionnaire.
Some surveys produce a questionnaire specification that is wholly independent of the CAI program. This type of documentation
can be useful for testing the instrument. However, these documents are produced manually, which can be time consuming and
error-prone. As the questionnaire is produced independently, there is no guarantee either that it matches the specification
exactly or that the specification accurately documents it at the end of the process.
On other surveys, there is an attempt to document the CAI instrument once it has been written, in part or in full. Manual editing
of the CAI program has formed the basis of much recent documentation of this kind. However it is a large and laborious
clerical task to get the documentation into a presentable format. Again, as it involves manual editing it can be error-prone.
Moreover, it is difficult in practice to ensure that any amendments to the CAI program are carried over into the documentation,
particularly if these amendments are made under extreme time pressures.
Consistent and accurate documentation can only be obtained if it is generated automatically from the electronic questionnaire
itself. In 1996 the Social Survey Division of the Office for National Statistics (ONS) developed a tool, in co-operation with
Statistics Netherlands, which could automatically produce documentation from programs in Blaise. This documentation tool
met many of the user needs for ONS's documentation: it has produced the documentation for such large and complex surveys
carried out by ONS as the Family Expenditure Survey, the General Household Survey, and the Family Resources Survey. It has
greatly improved the speed with which the documentation is produced: for example, it is fast enough to be used by the ONS
Omnibus Survey, which has rapid turnaround from module request to fieldwork and results. However, the output still requires
some manual editing so it can still be subject to errors and the updating issues that other documents have - albeit to a much
reduced extent.
Many continuous surveys have a different kind of problem when updating their documentation, in which the majority of the
questions asked are the same as in the previous version. It is sometimes quicker to manually update the previous version of the
document with the recent changes, rather than to start the documentation from scratch again, and repeat all the editing done on
the previous version. Over time, there is a risk that documentation and CAI instrument may diverge significantly, as in the
more general case mentioned above where documentation and instrument are developed separately.
The TADEQ project
There is a need to produce documentation for CAI instruments that is comprehensive and accurate. It needs to be produced
quickly and requires no or little manual editing. This can only be obtained if it is generated automatically from the CAI
program, as that contains virtually all the information required for the documentation. What is needed is a software tool capable
of automatically translating the CAI program into a human readable form.
The TADEQ project is funded under the European Commission’s Esprit programme to develop a tool for documenting and
analysing electronic questionnaires to meet this need. It is led by Statistics Netherlands and the other partners are the Office for
National Statistics, UK; Statistics Finland; Instituto Nacional de Estatística, Portugal; Max Planck Institute, Saarbrucken,
Germany.
The objectives of the project are to produce a neutral tool, which can be used by different CAI systems. The existing ONS tool
it is limited to documenting questionnaires developed in Blaise, and it does not attempt to meet all the user needs which have
been identified by the user consultation and which TADEQ will incorporate.
The TADEQ tool will be able produce both paper and electronic documentation. The tool should be able to analyse the
structure of the questionnaire and report statistics and possible problems with the structure.
There are several stages to the project:
•
A survey among the current users of documentation from electronic questionnaires and development of a user requirement
for the TADEQ project which will form the basis for the remainder of the project.
•
The development of a neutral file format for storing questionnaire contents and questionnaire logic in an efficient machinereadable form.
•
Development of an interface to CAI systems. The interface must allow CAI systems to deposit metadata in a way that can
be read by the neutral file format.
•
Development of a software module that is able to read the neutral file format, produce paper and electronic documentation,
and carry out an analysis of the structure of the questionnaire.
•
Testing of the developed tools by users of CAI systems.
This paper discusses the first of these stages: the user requirements for documentation of electronic questionnaires.
2. The users of documentation from electronic questionnaires
There are many different users of the documentation from electronic questionnaires, spanning the whole of the survey process.
In the first quarter of 1999, the project team consulted a purposive sample of more than one hundred users in twenty-four
organisations throughout Europe. The respondents completed a paper questionnaire or its Web equivalent. The survey's aim
was to provide ideas about the different types of user and their different documentation requirements. As well as the survey, a
number of discussions took place to get a more in-depth view of what users required.
Conducting a survey involves a large number of people, who perform different tasks and they use their questionnaire
documentation in a variety of ways to help carry out these tasks. Different users therefore have different requirements for their
documentation. TADEQ has to produce documentation from CAI instruments that has the flexibility to meet the needs of all
these users.
The responses received from users in the user consultations covered the whole spectrum of survey work: from commissioning
the work at the beginning to archiving the data at the end. Fifteen main roles were identified within the survey.
Users:
•
•
•
•
•
•
•
•
•
•
•
•
•
•
•
commissioned survey research;
were survey customers;
were survey managers;
designed surveys and survey questions;
were subject matter specialists;
developed electronic questionnaires;
developed and use other CAI applications;
developed CAI software;
interviewed respondents;
trained and managed interviewers;
processed or edited the data;
analysed data from their own survey;
analysed and used data from other surveys;
were survey methodologists; or
archived and disseminated survey data and results.
Most users carried out more than one role within a survey. For example, many survey customers also commissioned surveys
and acted as managers for part of the survey process. Sometimes customers were also subject matter specialists or data analysts.
The division of responsibilities for carrying out these tasks can vary from organisation to organisation, survey to survey. For
example, on one survey the people from the organisation responsible for the data collection may also analyse the results in the
first instance. On another survey, the people commissioning the survey may do the analysis themselves, or a third party, not
involved in the any other part of the survey, may be commissioned to do the analysis.
Users perform a number of tasks and can use the documentation in a variety of ways. They therefore have different
requirements for their documentation. Users also have different levels of knowledge about the survey and its contents. Some
users involved in the day-to-day running of the survey have an intricate working knowledge of the questionnaire contents and
need documentation to check on minute detail. Others, such as managers and customers, may not have the information they
require first hand. They may rely on the documentation rather than their own knowledge to provide this information. Policy
makers and academics analysing the data once it has been made public are not involved in the main survey process, but still
require information, albeit at different levels. The questionnaire documentation is their only source of information about the
survey.
Below are listed some of the main tasks for which questionnaire documentation can be used, and the types of users that perform
the different tasks.
Designing surveys and survey questions
Survey designers often wish to use questions from previous surveys, to build on good practice or to facilitate the comparison of
results.
Approval of questionnaire design
The people who are responsible for the design of the CAI instrument and the data collection are not usually the people who
commission or design the survey. The commissioner may wish to approve the CAI instrument to ensure that the instrument is
collecting the information they require. A paper questionnaire used to provide a ready form of documentation. However, with
CAI this approach is no longer feasible – commissioners can rarely understand the CAI program and, even if they can, it does
not usually provide the information structured in a way that they can use quickly and accurately. Tailored documentation is
therefore an essential tool in gaining approval for the content of a survey.
In some organisations the developers of the CAI instruments are specialist computer programmers. Specialist survey
researchers design the questions and also need to approve the design of the electronic questionnaire. Like survey
commissioners, the survey researchers need to approve the design of the CAI instruments developed by the programmers, so
they have the same needs for documentation.
Providing information on the content of the questionnaire
Different users require different levels of detail from questionnaire documentation. Some users, particularly data analysts,
methodologists and survey designers, require the exact wording, routing and answer categories for each question. Other users
such as policy makers and survey managers may require more of an overview of the questionnaire and less detailed information
about individual questions.
Interviewers also like some sort of documentation of the electronic questionnaires, even though they have access to the
questionnaires. Although CAI instruments have dynamic routing (that is, the next question that appears is dependent on
previous answers and is automatically controlled by the program), it is sometimes difficult to get a sense of the overall structure
and flow of the questionnaire as a whole. Alternative documentation can provide this. Interviewers find it useful as they can use
it to gauge the length of an interview and which questions may appear in certain circumstances.
Public documentation
Many survey organisations and customers, particularly those in the public sector, have an obligation to make their survey data
publicly available. Documentation has to be produced which can be archived or published (in survey reports). People who have
had no connection with the process of producing the survey data will be the main users of this documentation. It is essential that
the documentation is self-explanatory and comprehensive enough to meet their needs. These people may use the documentation
for a variety of purposes: for example, to analyse the data from the survey, to help design another survey or to carry out a
methodological study.
Users’ requirements
Users require (and therefore TADEQ will need to produce) documentation to be:
•
accurate – the information displayed in TADEQ should exactly reflect the CAI instrument;
•
automatic – the documentation should require no or little manual editing and therefore be quick to produce;
•
comprehensive – all the information that the user may require from the electronic questionnaire should be available (even
if it is not all displayed at the same time);
•
flexible – users need to be able to easily change the information shown by the tool to meet their individual requirements;
•
available electronically and, subject to the constraints of the medium, on paper; and
•
easy to use for a non-technical user who has no knowledge of CAI programs.
3. Paper and electronic documentation
One of the objectives of TADEQ is to produce both electronic and paper documentation. Almost all the users consulted use
paper documentation. Some users had electronic documentation although none stated they used it exclusively. However, people
report that their use of electronic documentation is limited by a need to mimic the paper documentation they currently use (for
example, a Word document). Improvements in the quality of electronic documentation available would mean users would be
able to utilise the many benefits of using electronic documentation such as: quick navigation using hyper-text links;
computerised search and help facilities; and being able to copy information into other computer packages. Electronic
documentation could be used interactively and the user could alter the documentation to suit their own needs.
However, even with these advantages, there will still be a need to produce paper documentation. Almost all the users that were
consulted stated they would still require a paper version. The reasons users gave were:
•
it was what they were used to;
•
they could still use it when they did not have access to a computer;
•
to show clients, policy makers and to take to meetings;
•
they could easily annotate the document;
•
they could use it as a reference when using other computer packages (for example, some data analysts prefer a paper
document containing the information on variables rather than switching between screens on a computer; and
•
they would need it for publication in a paper report.
TADEQ needs to produce both types of documentation.
Good usability of the documentation produced is vital in both modes. A document can contain all the necessary information but
if it is not well presented users will not be able to find the information they require. The documentation will have failed in its
prime purpose.
There are different considerations for documentation in the two types of media. The paper document is static, whereas the
electronic version can be interactive. The best layout of a paper document is likely to be different from a document viewed on a
screen. In a paper document all the information needed has to shown on the page, whereas on a screen, items can be displayed
or hidden as necessary.
Although some surveys produce different paper documents for different users, most produce one document that attempts to
meet the requirements of the majority of their users. Electronic documentation can be tailored to suit individual requirements.
The navigation and searching for information is different in the different media: in an electronic environment, users can use
hyper-text links, clicking on icons; paper documents require other sign-posts such as page numbers, contents page, section
headings, and an index so that users can find the information they require.
4. Information required from the electronic questionnaire
Users require a wide range of information from the questionnaire. The key to TADEQ will be the flexibility to show
information as and when required, and allowing the user to have control, as far as possible, over what the documentation looks
like.
The key information that users need is: what questions were asked; what the possible answers were; to whom they were asked;
and in what order.
Although most users want the question text, answer categories and a description of the routing, there are various ways this
information can be presented. Users may not wish to see all the possible information on all the variables at one time. It may
actually be counter-productive to show too much at the same time; essential information could be lost in a forest of detail. Users
need to be able to select which variables they require information for and what information they require for these variables.
As well as information for specific variables there is other information that a user will need to know:
•
A title to identify the document. Users may also want a version number, the filename, the time and date of production and
who (person or organisation) produced the documentation.
•
The questionnaires that TADEQ will be used to document may be long, with a huge number of questions. For example,
Manners and Deacon report an instrument with some 30,000 questions. Many of the questions were in loops for all
household members, but some 3,500 were unique. In addition there were 2,500 consistency checks. In order for users to
navigate their way around the documentation it needs to be split into meaningful sections, with signposts and labels. This is
particularly important for paper documentation. Some CAI systems allow questionnaires to be built from blocks of
questions. If these exist they can be used to split the questionnaire into sections or sub-questionnaires.
•
Indexes and variable lists are also essential, in order for users to find the variables they are looking for. Indexing should be
possible by description or by keywords as well as by variable name so those users without detailed knowledge of the
survey can find the relevant variables.
•
Some CAI systems offer the facility to use external data files to read data in or code data contained within the
questionnaire. Users may wish to have references to these files, and a description of their function. They may wish to have
a list of all the files used within the questionnaire and also state at a particular question which file was used. The CAI
instrument may also use external programs that are not part of the CAI system. Again, these programs need to be
documented with a description, if available, of what the function of each program is.
•
Some users may wish to add external information to the electronic version of TADEQ, that is information not produced
from the CAI instrument itself. This further information may be about specific variables, such as frequencies; or a history
of changes to the questionnaire; copies of external coding frames or more general information about the survey, such as
dates of field work, sample sizes etc. There may be a need to add information to meet data documentation and archiving
standards set by customers, National Statistical Institutes or international agreements.
5. Information required for each variable
As previously mentioned the information about the variables contained within the questionnaire is the fundamental part of any
documentation. A wide range of information is required for each variable. There are different ways of presenting each piece of
information as well as issues surrounding how all the information fits together.
Which variables are shown
It may be the case that a user does not want to display all the variables within an electronic questionnaire. Users need to be able
to select the variables they require individually. However, for large and complex questionnaires this could be a time-consuming
task. Users need to select different groups of variables according to different criteria:
•
Many CAI systems allow instruments to be built from blocks of questions. If these exist, then the user could select/deselect
all the questions within a block.
•
Not all variables in a questionnaire are questions that are asked to respondents. As well as variables that are asked, some
variables are computed and shown for information and others are computed and kept in the questionnaire without being
seen. Also some variables can be asked in some circumstances and computed in others. Users may want to see all the
variables, only those that were asked or shown or kept, or any combination of these.
•
Some CAI instruments use variables that are temporary and do not appear on the final database. These are sometimes used
in computations, routing and other functions within the questionnaire, which are not required afterwards. Some users may
wish to see all the variables used in the program others may only want to see those that are permanent variables.
Not showing all the variables can cause problems if any of the variables that are not shown are referenced elsewhere in the
documentation, such as in the routing specification. To users unfamiliar with the CAI program these references will be
meaningless. TADEQ needs to find a way of dealing with such variables. One solution would be to provide a list of variables
that are not shown but are mentioned elsewhere in the documentation.
Variable identifiers
These are essential, however different users need to identify the variables in different ways. In Blaise, variables are identified
using names that include the blocks they belong to, using dot notation. For example, QTHComp.QHComp.NumAdult. Some
users, particularly developers of CAI instruments, require these full names so that they can find the question within the program
itself. These may also be needed to identify a variable with the same name in several blocks. Other users may prefer to have a
short variable name (for example, NumAdult), as this is how the variable is likely to appear in the final database. However,
using these short names could result in more than one variable having the same name. Many users also thought that the
variables should be numbered as it would give an easy reference point. Other users felt that a description of the variable was
important, particularly if the user was unfamiliar with the data and documentation.
Question text
Documentation of the question text is essential. However, many CAI instruments use text substitution where the text of a
question can be altered depending on individual circumstances of the respondent. Although it usually improves the flow of the
interview, it makes documentation of the question text difficult. TADEQ substitution can use either the values of another
variable directly to a temporary string variable into which the appropriate text is computed depending on the answers to
previous questions. In extreme cases, a question may be no more than a sequence of text substitutions.
The documentation tool needs to identify the parts of the text where substitution is used. In many instances the user will not
know what the variables refer to (and the names may not be intuitive) and therefore some indication what the text substitution is
necessary to understand the question. There are several possibilities: a label for the text substitution for the variable; a link,
reference, or box showing where all the text alternatives (and the conditions under which they apply); or a conventional
simplification, such as a pronoun is always shown as ‘you’, ‘yours’ etc. The main requirement from users is for a description or
a conventional simplification. However, in many cases where the text varies substantially, all the alternatives will be required.
Answer types
The type of answer required from the questions is essential information for the majority of users. There are different types of
answers to questions: numeric (integer and real) values; strings, where a text (usually of specified length) is entered;
enumerated types, where there are specified response categories; multiple response enumerated types, where more than one
answer can be recorded; and other special types, for example for recording times, dates or verbatim answers.
Enumerated types have similar presentational problems as variable identifiers, since the answer categories can be referenced in
a number of different ways (by number, a short name that is used in the CAI program, the full answer, or a descriptive label).
Some CAI systems allow text substitution to be used in the response categories and therefore the answer categories can have
the same problems with text substitution as occur in the question text.
Some questions can be left blank, or special keys can be used to enter ‘don’t know’ or a ‘refusal’ at a specific question. Many
users need to know when these keys can or cannot be used or when the questions can be left empty.
Routing
Documentation of the routing was essential for the majority of users. However the routing for many of the surveys for which
TADEQ will be designed is complex and difficult to show in a comprehensible format. One problem with routing (as has
already been mentioned and can make routing incomprehensible to users) is that the routing can contain variables that are not
displayed anywhere in the documentation. Also, the references to the answer categories from an enumerated type need to be
consistent with what is shown in the main documentation. For example, if the short names as used in the CAI program are used
in the routing but are not listed in the documentation then the routing can become meaningless.
As the routing within large CAI instruments can get very complex, many users require an explanation in natural language for
what the routing is doing. This is particularly useful for customers, policy maker or other users who are unfamiliar with
programming languages. Although some users would find this sufficient, many users still require the more ‘technical’ and exact
routing. Some users would like the option to display both. These descriptions of the routing would need to be incorporated
within the CAI instrument so that they can be used by TADEQ.
There are two different concepts that CAI programs can use to control the routing of the questionnaires: ‘conditional’ routing,
which specifies under which conditions the questions will be asked, and ‘goto’ routing which states which questions will be
appear next once certain answers are given. Electronic questionnaires use only one type of routing, users want both types of
routing displayed. The majority of users require the conditional routing and although many users also wanted the goto routing,
none stated they could use this type of routing on its own.
Both types of routing have problems associated with clearly displaying the information. Some of the issues and problems in
showing the routing information required by users are described below. The paper by Jelke Bethlehem elsewhere in this
publication discusses the detail of displaying routing structures of electronic questionnaires.
Go-to routing
For complex questionnaires ‘go-to’ routing is difficult to display in an easy-to-read format, as the ‘go-to’ instructions
themselves may be dependent not only on the answers to the current question but also answers to previous questions. For
example:
Marstat
Are you:
(1) single, that is, never married
(2) married and living with your husband/wife
(3) married and separated from your husband/wife
(4) divorced
(5) or widowed ?
-> if (DMSIZE > 1) goto LiveWith
else goto HHldr
-> goto HHldr
-> if (DMSIZE > 1) goto LiveWith
else goto HHldr
-> if (DMSIZE > 1) goto LiveWith
else goto HHldr
-> if (DMSIZE > 1) goto LiveWith
else goto HHldr
This is a simple example. Many of the conditions used in CAI programs are much more complicated. In complex instruments,
go-to routing which creates the conditions for a variable from routes from several different parts of the instrument makes it very
difficult for an analyst to reconstruct the conditions accurately. Many of the users stated that they would like to have
documentation which shows ‘goto’ routing for their questionnaire (irrespective of the CAI software used to collect the
information). However, many users were worried about the complexity of their surveys and that this would make the
documentation unusable.
One option is to display goto routing as a graphical representation as a ‘flow diagram’. Many users thought a diagram would be
useful to get an overview of the questionnaire as a whole or to look in detail at the flow of questions in particular sections.
However, they felt that a diagram showing the detailed routing for the entire questionnaire would be too complicated to use.
Users stated that they needed some sort of overview of content and structure of the questionnaire. Although many users stated
that this would be extremely useful very few had documentation that provided one. In the electronic version of TADEQ this
diagram could be used interactively, as the basis of navigation throughout the questionnaire; to move up and down hierarchies
and between blocks to see the flow of questions at a particular section. However the user must be able to know where they are
within the questionnaire as a whole, as it would be easy for a user to get lost within a large and complex questionnaires.
Users would also like the option to alter the information shown in the diagram, such as showing just the variable names, or
names plus the description and the answer categories. To keep the diagram simple many users may wish to display the variable
names and would therefore need links and references to the other information they require.
Conditional routing
The conditional routing of questions in complex questionnaires is usually built up from a number of nested statements. For
example:
IF (LDMINDINTERVIEW[LDM1] = now) THEN
Natural
IF Natural = Yes THEN
NatNum
IF (Filling = yes) THEN
NumFill
ENDIF
ENDIF
ENDIF
Some users need to see the full conditions under which each variable applies. This is particularly useful for data analysts or
other users looking at individual questions in isolation. However in complex questionnaires the number of nested conditions
can get very large, resulting in a number of complicated conditions being repeated for each variable. This can make the
documentation hard to read and many users do not find all this information useful; the most useful information is lost in the
forest of detail.
Many users will only be interested in the last few nested conditions, as these are the most likely to change in a related sequence
of questions. Users need to be able to control the levels of routing that are displayed. This could be done either by hiding the
routing which is common to a selected set of questions or they may wish to hide all the nested conditions. Whenever any
routing is hidden there would need to be some indicator to the user that they were not seeing the full conditions of the routing
for the variables.
In many electronic questionnaires questions are repeated, such as asking the same questions for each adult in the household.
These questions can be nested within each other. This repetition, although it makes the instruments more efficient, can cause
problems when trying to make the routing transparent for users. In general, the questions that are repeated should be shown
only once (otherwise the documentation would be extremely lengthy). Users need to know under what conditions and the
number of times the questions are repeated. In many instances repeated questions require the use of temporary variables as
counters that may not appear in the documentation. Sometimes the number of times the question is repeated is not fixed and
depends on the answer to another question within the questionnaire. The ability to add natural language descriptions to describe
the routing and to hide some of the nested conditions would make the routing for repeated questions more comprehensible.
How the question appeared on screen
Some users, particularly methodologists, stated that they would like to know how the questions looked on screen. This was
something that was not available on their current documentation. However, the information required to produce this is not
usually part of the individual questionnaire, but is controlled by the CAI software itself. With the increasing complexity of
computer software the interviewers can change the settings on their computer. That could affect how the questions look, such as
changing the background colour, or the colour, size and font of the question text. Also, with the use of text substitution the
questions themselves can change in different circumstances and this can affect how the questions appear on the screen.
Edit checks and computations
One of the major advantages of using CAI is the ability to conduct consistency checks on the data during the interview. Some
users want to see what the checks were, others do not. Again, TADEQ will need to be flexible enough to provide the
information in the format that is required. The users may wish only to display the checks for certain variables. They may wish
to display the checks as part of the information for each variable or they may want all the edit checks to be displayed together.
They may wish just to see the conditions under which the questions are checked or they may also wish to see the message that
appears to the interviewer.
Likewise, some users want to see the computations that are carried out within the CAI instrument, others do not. There are
many uses for computed variables: to calculate variables that are subsequently used in routing or checks; or for text
substitution; or be used in the analysis of the data, instead of calculating them at a later stage. Some users may wish to know
that the variables were computed without knowing the specific derivation, others wish to see the exact conditions under which
all the possible values are computed. Some wish to see the computations with the main documentation for the variables, others
want them to be listed separately.
Many of the issues and problems of documenting conditional routing also apply to the documentation of edit checks and
computations. For example, there may be a repetition of nested conditions if a number of different variables are computed or
checked under the same conditions, which could greatly add to the length of the documentation.
6. Analysis tools
The aim of TADEQ is to produce a tool that can analyse the structure of a CAI instrument as well as document its content. The
first prototype will concentrate on the documentation tools and the analysis tools will be added later. However during the user
consultation some users did state some user requirements:
•
Questions which can never be asked due to impossible conditions within the routing;
•
Basic information on the questionnaire, such as the number of questions, the maximum, minimum and average number of
questions asked etc.
•
Which questions apply given certain conditions, for example, people aged over 16 and not working;
•
A theoretical simulation of the number of questions and therefore the length of the interview when fieldwork is carried out.
This could be done by estimating of the average number of questions asked calculated from the average number of
questions for separate subgroups of the sample and weighting them according to external information (such as population
figures).
•
Comparison and documentation of the changes between two versions of the same survey.
7. Display templates
As the user will be able to control what information is displayed, they should be able create templates on how the information
will look on the screen or page (such as fonts, sizes, colours for different information). It should be possible for the user to save
these options so that the documentation will appear in the same way the next time it is opened. Users could then use the same
options to look at the documentation from another questionnaire. This would enable users to produce a ‘house-style’. They may
also want a different template for producing documentation for internal use and one for general dissemination. Users may also
want to create a special template for producing a paper document that could include the creation of page numbers, contents
page and an index etc.
8. Conclusion
Large and complex questionnaires require a large amount of information to be documented. The TADEQ tool needs to be
flexible to allow the user to display as little or as much information as they require. The means of achieving this aim will be
different for electronic and paper modes of documentation. This paper has discussed a number of the different requirements
and problems that the TADEQ project has to solve in order to produce documentation that can be used by a wide range of users
to help perform a wide range of tasks.
The TADEQ project will produce a tool that will automatically document electronic questionnaires. It will provide an accurate
and comprehensive representation of an electronic questionnaire. The project will make full use of the facilities available when
documentation is itself electronic, including those such as hypertext links which are not available for paper versions of the
documentation. However, it will be guided by the user requirement for paper documents for the foreseeable future. The
project will ensure that a wide range of options to print out the documentation is available.
The paper has concentrated on what the TADEQ tool may do for users - on its outputs. As with any tool, the inputs (in this
case, from survey designers and their customers) will be crucial to its success. The quality of any automatic documentation
from electronic questionnaires can only ever be as good as the quality of electronic questionnaires themselves, irrespective of
the quality of the documentation tool. If the questionnaire is badly structured so will be the subsequent documentation. Many of
the features requested by users, and which will be available in TADEQ, will require the addition of information to the
electronic questionnaires, such as natural language descriptions of routing. There will be ways to add this information at the
later stages of a survey, but, to realise the full potential of the TADEQ tool most cost-effectively, users will need to plan and
input documentation at the design stage of the survey work. In this, we see another example of the way that CAI integrates the
formerly sequential processes of survey work.
References
Anderson, S (1997) Automated Paper Documentation of Blaise III. Actes de la 4e Conférence Internationale des Utilisateurs
de BLAISE, INSEE, Paris, 1-20.
Bethlehem J and Manners T (1998) TADEQ: A tool for Analysing and Documenting Electronic Questionnaires. Proceedings
of the 5th International Blaise Users Conference, Statistics Norway
Couper M P and Nicholls W L (1998) The History and Development of Computer Assisted Survey Information Collection
Methods Computer Assisted Survey Information Collection Methods, ed. Couper M P et al., Wiley, New York
Manners T and Deacon K (1997) An integrated household survey in the UK Actes de la 4e Conférence Internationale des
Utilisateurs de BLAISE, INSEE, Paris
Nicholls W L et al (1997) The effect of new data collection technologies on survey data quality Survey Measurement and
process quality, ed. Lyberg L et al., Wiley, New York
About the Author
Maureen Kelly is a survey researcher in the Social Survey Division of the Office for National Statistics. She has worked on a
number of surveys within the division and also provides advice and support for the development of Blaise questionnaires She
can be contacted at ONS, D2/01, 1 Drummond Gate, London, SW1V 2QQ; tel 020 7533 5308; fax 020 7533 5499; e-mail:
[email protected].
Converting a Blaise2.5 Questionnaire to a Blaise4W Instrument
By
John O'Connor and Jacqueline Hunt, Central Statistics Office (CSO)
1. Introduction
The Quarterly National Household Survey (QNHS) commenced in September 1997 replacing the annual Labour Force survey
which had until then been accepted as the definitive source of data on employment and unemployment in Ireland. This had been
conducted each April/May on a biannual basis from 1975 and annually since 1983.
The QNHS was the first major survey to use Computer Assisted Personal Interviewing (CAPI) in the CSO. CAPI was introduced
to ensure an optimum turnaround time from the start of data collection to publication of results. Blaise2.5 was used to write the
questionnaire with a front end written in Microsoft Visual Basic and data productivity and quality checks written in Access2.
The QNHS field staff consists of ten regional Co-ordinators and one hundred and thirty Interviewers. Each Co-ordinator is
responsible for thirteen Interviewers. Approximately, three thousand households are interviewed each week or thirty-nine
thousand over the course of the quarter.
The sample design for the QNHS comprises 2,600 smaller areas or blocks. This set of blocks remains fixed for five years. Each
block contains, on average, 75 households, of which 15 are sampled in a quarter. Households participate in the survey for five
consecutive quarters and are then replaced. This means that, in each quarter, 20% of the households are rotated out of the survey
and replaced by new households in the same block.
Initially, the hardware in the field consisted of 200 identical Interviewer's laptops and 10 Co-ordinator's P.C.s. However, since
then due to wear and tear two other types of laptops have been introduced.
At the end of 1998 it was decided to migrate from Blaise2.5 to Blaise4W because of doubts as to the formers Y2K compliance.
This paper outlines the work involved in the move and the reaction of the developers to Blaise4W.
2.
2.1
Moving to Blaise4W
Starting the Project
We first set up a project team specifically to look at the move to Blaise4W . The reasons for using project management techniques
were threefold:
• it was a new project, we had not done a similar type of project before and we therefore lacked the requisite experience
• it was relatively complex
• there was no margin for error, we had to get it right first time.
The project team included people from the IT area, business area and field staff. Although there was a large number of people
involved, their roles and responsibilities meant that their input was not required on a full time basis for the duration of the project.
The first priority of the project team was to define the scope and objectives of the project. We felt it was important to set out the
goals from the start as it provided focus and clear objectives for everybody concerned.
The scope and objectives were to:
• rewrite the system maintaining the structure and functionality of the original system
• successfully convert our existing data collection and productivity and quality checking applications used by the
Co-ordinators and in-house CSO team.
Having agreed the scope and objectives we proceeded to draw up a project plan and work schedule.
2.2
Blaise4W Training
The first requirement was to train the development team in Blaise4W. Both of us went on a week long training course in
December 1998. The course consisted of four days Blaise4W training and an introductory day on Maniplus. We were also given
time to work with the product in order to become comfortable and confident with the software.
We then began to look at ways of addressing issues such as questionnaire design, data conversion etc. Once we started to form a
plan of what we needed to do and how to do it we brought in a Blaise4W consultant from Statistics Netherlands.
There were three reasons for this:
• to confirm our approach was correct
• to provide technical help in achieving our objectives
• to ensure best practice and efficiency.
2.3
Questionnaire
The new Blaise4W version of the questionnaire was due to go live in Quarter 4 1999. A pilot was scheduled for Quarter 3 1999.
This was to be conducted in conjunction with the usual Blaise2.5 questionnaire. The aim of the conversion was to produce a
Blaise4W version of the questionnaire maintaining the structure and functionality of the original Blaise2.5 questionnaire.
The Blaise2.5 questionnaire had been in use since Quarter 4 1997 and had evolved to its current complex structure since then. For
example, the Quarter 3 1999 questionnaire consisted of 4,447 lines of code split over sixteen files and blocks. The questionnaire
was required to accommodate up to twenty people per household which necessitated the use of a block of array type one to twenty
within a table. This type of structure was also used to handle separate questions on emigrants which was required to accommodate
up to six people.
The new datamodel was to have a similar structure to the Blaise2.5 questionnaire (see Appendix). Every block in the new
datamodel was based on a block in the Blaise2.5 version. The opportunity was taken to rename the blocks with more meaningful
names and each block was established as an INCLUDE file due to their size. The new datamodel consisted of thirteen blocks, a
procedure and a library. The procedure was a new addition and is used to perform checks on the numeric key fields. Using a
procedure allowed us to discard several lines of repetitive code. A library of answer types was also created which can be reused
every quarter.
When rewriting the questionnaire as a Blaise4W instrument the main objectives were:
• Preserving the layout to keep a familiar look and feel for the business area and field staff.
• Reducing ongoing maintenance. Every three months we release what is essentially a new system with additions and
amendments to the questionnaire. We identified and wrote the code in modules which would rarely need to be changed.
• Providing a similar level of functionality for the Interviewers from the available menu options within Blaise4W.
2.4
Handling External Files
The questionnaire accesses five different external files sources.
1.
Lookup1
Block1 : STRING[4]
WkNo1 : 01..13
Rot1 : 1..5
2.
Lookup2
Rotn2 : 1..5
Year2 : 1997..2020
Quar2 : 1..4
Rota2 : STRING[1]
Wave2 : 1..5
5.
3.
Lookup3
Year3 : 1997..2020
Quar3 : 1..4
WkNo3 : 01..13
Day3 : 01..31
Mth3 : 01..12
4.
Refquart
SDS4 : STRING[3]
Quar4 : 1..4
Year4 : 1998..2000
Previous Quarter's Questionnaire
The information on the lookup files (1 to 4) combine to give all possible reference data for each block over the entire QNHS
sample. This information relates to reference week nos., reference week dates and quarter information. The lookup files are the
same on all the QNHS laptops which allows the laptops to be moved between Interviewers and from Co-ordinator area to Coordinator area if necessary.
The fifth external file is the previous quarter's questionnaire which is accessed on all repeat calls to participating households. The
current quarter's questionnaire is required to access the previous quarter's questionnaire and bring forward any data necessary for
routing purposes.
2.4.1
Lookup Files
With Blaise2.5 it was possible to run an External File option which converted the external lookup files into a format that Blaise2.5
could access. This option generated two new file types with the extensions .dat and .idx. To access the external files in Blaise4W
the files first had to be converted into Blaise4W databases. Blaise4W datamodels were prepared based on the files’ record
description. We then used the Manipula application to convert these Ascii files into four separate Blaise4W databases.
With Blaise2.5 the record layout of all the external files had to be included in the Blaise2.5 questionnaire code. We were using the
READFILE command to access the external files which is a complex command involving the use of five parameters i.e.
READFILE (IndexFileName, Key, DataFileName, InputVariable, Result).
The fifth parameter is based on the search for the key i.e. 0 if the record was found and 1 if the record could not be found.
In Blasie4W the external files are listed in the USES section of the datamodel and in the EXTERNALS section where the read is to
take place. Blaise4W includes the SEARCH and READ statements which allows more readable code to be developed. The
SEARCH is used with an IF condition and if the SEARCH is successful the READ is done i.e.
IF BlaiseDatabaseName.SEARCH(key) THEN BlaiseDatabaseName.READ.
The overall effect was to reduce the amount of code required and the end result was more transparent, readable code.
2.4.2
Previous Quarter's Data
The Blaise4W instrument was due to go live in Quarter 4 1999. It was required to access Quarter 3 1999 data collected using
Blaise2.5 if a repeat visit to household took place. The first step in converting the Blaise2.5 data into a format that Blaise4W could
read was to produce a full file description of the questionnaire fields we wanted to access. Once we had established the file
description we used Blaise2.5 manipulas to convert the Blaise2.5 data into Ascii format. The next stage was to convert the Ascii
data file into a Blaise4W database. This was achieved by first creating a datamodel based on the Ascii file layout and then using a
manipula setup to convert the Ascii data into Blaise4W format.
Reading the previous quarter's data in Blaise2.5 had been a complex procedure. A full file description of all the fields in the
previous quarter's questionnaire had to be included in the EXTERNAL section. An external file description of the previous quarter's
questionnaire was generated using the UTILITIES option from the Blaise2.5 menu. The file description was then incorporated into
the new questionnaire.
To access the previous quarter's data the question cluster numbers had to be identified. Question clusters are created in
questionnaires where one or more blocks are declared as subfiles. Blaise2.5 creates one cluster for every question referred to as a
subfile block. Clusters are identified by sequence numbers corresponding to the order in which subfile questions are referred to in
the route paragraph at the highest level. The cluster numbers for each person within each block were identified and then used in
the READBLAISE statement i.e.
READBLAISE (External Key, External File Name, Block Name, Cluster No., Result ).
Blaise4W does not require a full file description of the previous quarter's questionnaire. We included the questionnaire in the list of
external files in the USES section of the datamodel and in the EXTERNALS section where the read is to take place. We could then
access the data using the READ and SEARCH commands as described already. To access particular fields from the previous
quarter's data we could use dot notation to identify the exact location, for example,
PrevQnhs.PersonGrid.Person[Line No].Individual.Name.
The procedure to convert the Blaise2.5 data into Blaise4W format was eventually combined as an option on the Interviewers’
Visual Basic front end menu. This enabled the Interviewers to convert the Blaise2.5 interviews from the previous quarter into
Blaise4W format in order to proceed with Blaise4W interviewing in the current quarter. They could then complete any unfinished
or late interviews as normal in the previous quarter and when complete convert the data again using the same procedure. This
option was only required for Quarter 4 1999 as from that quarter on all the data was in Blaise4W format.
The main considerations accessing the Blaise2.5 data were:
• To convert and/or drop data not required to be carried forward into Blaise4W. This was done by identifying what could
be dropped and then writing a Blaise2.5 manipula to convert the data into an ASCII file.
• Creating a Blaise4W instrument to reflect this ASCII file and then converting the ASCII file into a Blaise4W database.
• Rearranging the data in a different layout to reflect the structure of the new datamodel.
• Ease of use for the Interviewer. We set up the conversion procedure to run when “clicked on” by the Interviewer. This
option converted any Blaise2.5 data on the laptop from the previous quarter into Blaise4W format.
The biggest problem we encountered with the data conversion concerned the Blaise2.5 manipula. This manipula is a DOS based
program and would not run on the Interviewer's laptops due to an insufficient memory problem. This problem occurred because of
the amount of memory allocated to DOS based programs by Windows 95. Our solution was to reduce the size of the manipula,
however, the effect of this was to limit the amount of data it was possible to carry forward into the Blaise4W questionnaire.
2.5
Other IT Applications
Our old applications used a combination of Blaise2.5, Visual Basic, Dos and Access2. With the move to Blaise4W it was
necessary to review the use of all the other software tools.
We decided to update the front ends, written in Visual Basic, to compliment the new look of the Blaise4W screen. This was quite a
radical change as it involved moving from command buttons to drop down menus and toolbars. We were able to remove all the
DOS programs and use Visual Basic instead to connect with the Blaise4W Dep and Manipula applications. We built in additional
message boxes to provide the field staff with more information on the outcome of the procedures they were running.
The Co-ordinator and Office Applications used Access2 for productivity and quality checks on work done by the Interviewers.
After the review it was decided to upgrade the software to Access97 mainly because Access2 was not Y2K compliant. The
upgrade incorporated a redesign of the screens compatible with the new look of the Blaise4W and Visual Basic screens. The
redesign also had to handle the new AsciiRelational files created by the Manipula applications which we used for transferring data.
2.6
Data Transfer
With the old applications the data was transferred from the Interviewer to the Co-ordinator and then to the CSO. This was done by
converting the data to AsciiRelational files on the Interviewers’ laptops, sending the data to the Co-ordinator who loaded the data
to a Blaise2.5 database on their PC. The Co-ordinator then checked for productivity and quality and if satisfied sent the data to the
CSO also in AsciiRelational format. This was done on a weekly basis and only "new" and "changed" forms were sent. There was
also an option to send cumulative data by both the Interviewer and the Co-ordinator. This option would be used primarly as a
security procedure.
We needed to replicate this scenario in Blaise4W using the manipula application. This required careful consideration, as there are
subtle differences between the old convert features of Blaise2.5. and the new Blaise4W manipula application.
We used the HISTORY method to select the interviews. The result of the method is "new", "changed" or "unchanged". Using this
method we could select only the interviews that were new or had been amended. We then used the RESETHISTORY method to
mark all the interviews as "unchanged". For example,
IF (InputFile1.HISTORY = NEW) OR (InputFile1.HISTORY = CHANGED) THEN
OutputFile1.WRITE
InputFile1.RESETHISTORY
InputFile1.WRITE
ENDIF.
We also included an option to send cumulative data by both the Interviewer and the Co-ordinator. Again this option would be used
primarily as a security procedure.
3. Preparing for Live Release
3.1
Testing
From a testing point of view we regarded the applications as completely new and as such we would need to test them in the same
way as we would test any other new application. To do this we drew up test plans. These test plans were designed to provide a
structured systematic approach to testing.
Using the test plans we developed test data. Testing was first done in the IT area where each program was tested individually. We
then carried out suite tests and finally the whole system was tested. At this stage, the systems were passed to the business area for
further testing (this included both in-house and field staff). This paid off as no major bugs were found after live release.
3.2
Pilot
A pilot was scheduled for Quarter 3 1999 which was to be conducted in conjunction with the usual Blaise2.5 questionnaire.
The objectives of the pilot were to:
• assess the Interviewers’ reaction to the new applications
• identify areas of difficulty for field staff e.g. problems with layout, clarity of messages, procedures etc.
• identify any software problems from source Interviewer laptop to CSO e.g. problems with routing, data transfer etc.
• assess training requirements for the field staff.
3.3
Training Field Staff
All field staff were trained centrally in the CSO. The training course was developed based on the existing knowledge base of the
Interviewers and the experiences of the Interviewers involved in the pilot.
Groups of approximately thirty Interviewers were brought together for a two day training session. They were first given an
opportunity to see the new application and then they were brought through a number of sample interviews. They also had an
opportunity to run each procedure available on the menus.
The training sessions provided an opportunity for team building and standardisation of work practices throughout the 10 different
Co-ordinator areas. Sample applications were loaded to the Interviewers’ laptops which gave them time to practice and get
familiar with the new system at their own pace.
3.4
Live Release
The live release was scheduled for September 1999. Final training sessions took place in the10 Co-ordinator offices and the final
versions of the applications were loaded on the Interviewer's laptops. These training sessions built on the earlier training and
provided an opportunity to deal with any further questions by the field staff.
Some new laptops also being introduced at this stage resulted in an unexpected problem. The Blaise2.5 manipula would not run on
the new laptops due to an insufficient memory problem. This was due to the amount of memory being allocated to DOS based
applications on a Windows 95 machine except in this case because the machines were new they had a later version of Windows 95
which had further reduced the amount of memory available. The data conversion from Blaise2.5 to Blaise4W had to be done on
the old laptops and then the converted data was copied onto the new laptops. Unfortunately this put the trainers under pressure
having to deal with the extra workload.
4. Review of Move
4.1
Conclusions
The project began in early December 1998 with the initial training in Blaise4W. The pilot was successfully conducted from June August 1999 and the new system was released live in September 1999. A considerable effort was required to support the field staff
from the time of the live release until March 2000.
By adopting a project management approach to the development we were able to provide a less stressful environment to work in
and also provide a focus for everybody involved. It was an invaluable tool in providing an early warning system if deadlines began
to lag or problems were encountered.
A project like this needs to be well thought out and planned before the start or there is a huge potential for failure. Active
involvement by the business area and the use of “RAD“ techniques were essential in providing a system which the business area
were happy and comfortable with.
The pilot was important for a number of reasons. It provided an opportunity to assess the field staff reaction to the new
application. It helped identify training requirements and it allowed us to monitor the new applications in the live environment.
A good training programme was important to ensure that the Interviewers were both comfortable with and had a good
understanding of how the new system works resulting in relatively smooth transition from the old to the new applications.
Bringing everybody together for the training reinforced good work practices and standardised work practices countrywide.
We were also fortunate to have good support from Statistics Netherlands.
Overall the project went well in spite of some “minor hiccups” towards the end. The transition went according to plan and was
relatively smooth.
4.2
Some points worth noting from our experiences
•
•
•
•
•
•
•
•
•
•
•
4.3
"Feel good" factor of pilot Interviewers from their involvement in the project.
Attachment of Interviewers to certain features in the old system that were missing from the new system.
Information messages not as clear as we thought, different interpretations possible.
We originally used the standard Blaise4W screen, however, the Interviewers found the screens difficult to look at e.g.
background colour, font size, etc. We changed the background colour and font in the subsequent quarter.
Data transfer using the Manipula application had to be carefully thought out as there are differences between the
Blaise4W and the Blaise2.5 manipula and convert applications.
Regular occurrence of the "Hospital" error message. Blaise4W seems to be susceptible to data corruption if there is either
a hardware or software(Win95) problem on a machine. At this stage, due to the frequency of the occurrence of the
"Hospital" error we are moving to a later release of Blaise4W for Quarter 3 2000.
Mysterious appearance of .~lc and .~la files. We could not find any reference to these files in the manuals.
Different hardware. Applications working on one platform and not on another e.g. different models of laptops.
Different versions of Windows 95. The amount of memory available to run DOS based applications varies depending on
the version of Windows 95 on the machine.
Developing Visual Basic applications in a WindowsNT environment for roll out to a Windows95 environment.
Duplicate forms appearing on the Browse Option. This is still under investigation by the CBS.
Additional Benefits
•
•
New laptops unable to run large DOS based applications which resulted in Blaise2.5 falling over. This is not an issue
with Blaise4W.
Reinforce good practice during training (backups procedures etc.).
Appendix
1. Original Blaise2.5 Questionnaire Structure
Questionnaire Qnhs
Block Main1
Table Main2
Block OverAll : Array [1..20]
Block Din2
Block Res1
Block Hist
Block Age1
Block Rel
Block Header
Block Weekend
Block Q2B
Block Q2Ba
Block Q3B
Block EduMod
End Table
Block Hmod
Block Smod
Block Emig
Table Emig
Block Emig : Array [1..6]
End Table
Block Appointment
End Questionnaire
2. New Blaise4W Datamodel Structure
DataModel Qnhs
BlockMainDetails
Table PersonGrid
Block Person : Array [1..20]
Block Individual
Block History
Block Relation
Block Employ
Block Employment
Block IndOcc
Block HrsWorked
Block JobSearch
Block Education
End Table
Block Housing
Table EmigGrid
Block Emigrants: Array [1..6]
End Table
Block MakeAppoint
End Model
NASS Conversion to Blaise 4 Windows with a Visual Basic Interface
Roger Schou and Tony Dorn
National Agricultural Statistics Service, U.S. Department of Agriculture, USA
2000 International Blaise Users’ Conference – Kinsale, Ireland
Introduction
In the Fall of 1999, NASS began the extensive conversion of all its Blaise Applications from Blaise III to Blaise 4 Windows.
This major conversion had two primary areas of focus: Blaise 4 Windows ManiPlus interfaces and a Visual Baisic interface.
The Blaise 4 Windows ManiPlus interfaces were developed to provide a more interactive, user-friendly system. They also
allowed the NASS CASIC System to have more control over the forms being processed. The whole survey management
process was redesigned as it moved into a Windows environment The capabilities of ManiPlus aided in the development of a
more efficient system.
The Visual Basic interface replaced all the DOS batch files that were used with Blaise III to run the survey processes. The
Visual Basic interface also replaced a Sabre Menuing system. Using one Windows software to drive survey processes was the
most desirable alternative to other options, like using WinBatch. Visual Basic gave us the flexibility of DOS batch files to move
files, copy files, and perform all the functions on files and folders. In additions, Visual Basic provided a built-in menuing
system, with button objects and sub-forms. As processes were developed, Visual Basic was used to view and run Manipula
generated reports, ManiPlus interfaces, and provide users with other information previously not available with DOS batch files.
Because of the ease of learning Visual Basic and the availability of training, it was the Windows software of choice over other
more powerful, but more difficult, software. In NASS, job rotation can be frequent, so a software that is reliable and easy to
learn was a top priority.
System Changes
The ability to control access to the dataset with ManiPlus, while allowing both CATI and interactive editing to run
simultaneously on the same dataset, opened up possibilities for NASS to redesign the system flow of data. Since NASS is
changing platforms from DOS to Windows, and from Blaise III to Blaise 4 Windows, it was a good time to examine the current
system and improve it. NASS previously collected CATI data in the “CATI” dataset, and physically moved the completed
forms to an “EDIT” dataset for the interactive editing process. NASS suspects that the frequent deleting of forms from the
“CATI” dataset occasionally led to corruption of the “CATI” dataset. Usually, rebuilding that dataset recovered the forms.
In the new NASS CASIC system design, all the forms remain in one dataset. All records are initialized into the dataset, and the
Blaise call scheduler is used to deliver the forms. If a form is to be removed from the call scheduler, a Non-CATI transaction
can be created. A ManiPlus setup will read this ASCII file of transactions, set a switch within the dataset, and remove the
identified forms from the call scheduler.
If an interviewer needs to retrieve a specific form, a ManiPlus setup is run which prompts the interviewer for the key fields. It
gets the form and checks a field in the dataset that identifies the process for which the form is available. If the form is available
for CATI, the Data Entry Program (DEP) is executed and the form is delivered. If the form has already progressed into the edit
process, a message box is displayed to the interviewer, and the form will not be delivered.
One of the interruptions to the CATI and editing processes is the reading in of paper data. This data has been keyed using a
heads-down data entry software. Manipula is used to read this file of code data and write the data to the Blaise dataset. With
proper planning, this data may be read in during interviewer break times or during a shift change.
The interactive edit is another ManiPlus interface that again controls the delivery of forms, but this time to the statisticians
doing the editing. Forms are typically edited in batches. When a paper batch is read into the dataset, a batch number is assigned.
For forms collected in CATI, the Julian date when the forms were collected becomes the batch number for those forms. The
statistician may then retrieve forms by batch or by date collected. A special option on the dialog box allows the statistician to
choose a date, which is then converted to a Julian date, and then used to display that group of forms in a table. The dialog box
also allows the retrieval of a specific form with the same type of process checking done for the retrieval of a CATI form. Other
options on the dialog box include all completed forms and adding a form.
This one dataset concept allows the CATI completed forms to become available for interactive editing immediately. The
interruption to the CATI interviewers while moving the forms from one dataset to another no longer exists.
System Changes Effecting Interviewers
In Blaise 4 Windows, most of the changes were cosmetic. The Windows look was different, but most of the functionality was
retained. Most interviewers adapted easily to Blaise 4 Windows.
One notable exception was the procedures for making appointments. Many interviewers who weren’t skilled in computers,
experienced difficulty using the mouse and clicking to set appointment parameters. The parameters with drop-down boxes and
up/down scroll buttons were especially difficult for some interviewers. Extra time was required for interviewers to practice their
mouse skills.
Visual Basic was used to provide a simple way for interviewers to begin data collection. Buttons were added to conduct and get
live and practice interviews.
In NASS, the interviewers’ supervisors are usually given the responsibility to create the day batches and make sure practice
interviews can be done. Supervisors also sometimes run Manipula reports to check on the status or progress of data collection.
To facilitate this, a Supervisors Only button was provided that allows supervisors to run special processes.
The Supervisors Only button allows the supervisors to run CATI Management, create day batches, run CATI Specs, run
Manipula reports, Browse History, and refresh practice datasets. Since these functions are only the responsibility of supervisors
and not the interviewers, these options were password protected.
System Changes Effecting Survey Management Processes
The most significant changes to NASS’s Blaise 4 Windows Applications were with the survey processes. In NASS, the data is
analyzed in Blaise before it is processed further for more detailed analysis and summary. Statisticians analyze this data
immediately after data collection so inconsistencies can be quickly corrected. Most of this analysis is done by Interactive
Editing by the statisticians.
A Visual Basic interface was also built to provide editors with all survey processes in a simple, user-friendly format. First, the
specific survey is selected using a List View in Visual Basic, which is the control used by Windows Explorer.
After the survey is selected, the window with the CASIC interface is loaded. This interface gives editors the ability to Initialize,
or set up, a survey. It provides information about the name and period of the survey. Processes available to the supervisors are
available. Additional processes like interactive editing, deleting a form, and integral check are also available.
Having these processes available in a simple interface where they can be accessed at the touch of a button is a great
improvement over the previous menus, where some processes were 5 levels deep. As more respondent databases become
integrated, the Visual Basic interface should be able to provide editors with access to historic and detailed information from
other NASS databases.
Technical Challenges
In order to convert from Blaise III to Blaise 4 Windows, several major technical challenges had to be conquered.
In Blaise 4 Windows, the primary challenge was the use one dataset for both data collection and the interactive edit. In Blaise
III, there were two separate datasets because of the database conflicts between editors and interviewers. Having separate
databases made the two processes faster, but forms had to be moved from the data collection dataset to the editing dataset,
which sometimes caused dataset corruption when the move process failed. With a one dataset system, forms are no longer
moved from one dataset to another, but this system would have to track the process status of a form. New ManiPlus interfaces
were developed to maintain the control needed by the new system.
The primary challenge in Visual Basic was first to learn Visual Basic and then duplicate and improve the Sabre menus and
DOS batch files it was replacing. Since Visual Basic training was readily available and the language itself was intuitive,
learning Visual Basic wasn’t a very big challenge.
Technical Challenges: Visual Basic
One of the biggest challenges using Visual Basic was determining how to present the interface. Previously NASS was limited to
a menuing system, but with Visual Basic, menus, buttons, toolbars, list views and other controls were now available. These had
to be presented in a simple way so interviewers and editors would know what to do by intuition alone. Since many of the
processes were one-step, buttons were the most common control. The interface was presented in a way that best follows the
processing flow of each survey.
By designing the interface this way, all surveys would be able to “plug into” the standard interface. Some minor survey specific
changes were made, but almost all the processes were standardized throughout all surveys. That is no small accomplishment,
considering Blaise 4 Windows will be used on over 100 surveys in NASS for the year 2000. All users are automatically familiar
with a new survey. All the buttons, processes, and reports function very similarly for all surveys. This was accomplished by
command line parameters that launch the Visual Basic executables.
The commands that were used in DOS batch files had to be duplicated in Visual Basic. Commands or functions were necessary
to check if a file exists, a folder exists, copy, delete, rename, write lines to a text file, execute an executable and wait for it to
finish, and determine the drive and path of files, and viewing files. While over time NASS developers were able to find
acceptable Visual Basic code to perform these tasks, it took some initial time to learn them. However, now that developers have
learned Visual Basic, tasks much more advanced than DOS batch commands can be performed.
Surprisingly, probably the most difficult part of implementing the Visual Basic interface was distribution and setup on other
workstations. NASS has over 45 servers located in individual states with about 30 workstations on each server. All applications
had to be distributed and setups run on each workstation.
While the Visual Basic Package and Deployment Wizard was used to create a setup to distribute the application, some
additions had to be made for the setup to work correctly. Several DLL’s had to be distributed and registered on individual
workstations, and two Microsoft executables had to be run to update components. The procedures of correcting the setup were
not easy to understand. The setup would indicate it failed when the application was run, but an error message appeared. Several
separate errors had to be corrected in the setup. The errors were corrected by contacting Microsoft Technical Support and user
groups. Now these errors will be solved easier because the Visual Basic knowledge base in NASS is growing. Although
corrected problems were difficult, once the setup was corrected, it ran consistently and correctly on all workstations in NASS.
Technical Challenges: Blaise 4 Windows
Maintaining a high level of performance in both CATI and interactive editing is the most challenging part of the CASIC system.
Some of the ManiPlus setups seem like they are having an impact on the CATI interviewers’ performance while running against
the same dataset. Further testing will be necessary before we will be completely comfortable with the entire process. There are
a couple of backup procedures that we may use, but they will require loosening some control of the system. We hope to solve
the performance issues between CATI and the ManiPlus setups before going into full production, so that the system may have
the control that it was designed to have.
Another technical challenge continues to be the video resolution on the screen that affects how the form pane and info pane are
viewed. Some show fields were not visible on a lower resolution screen when the instrument was prepared with a modelib that
was acceptable with a higher resolution. Work is in progress to find the best solution to this problem.
Conclusion
The conversion to Blaise 4 Windows with the Visual Basic interfaces has been very exciting. The enhancements to Blaise 4
Windows have been an asset to the design of the new NASS CASIC system. The Visual Basic software has given the system a
much more powerful and user-friendly interface.
Session 7
Authoring and metadata in Blaise
Helping non-programmers to specify a Blaise Questionnaire
Mark Pierzchala, Graham Farrant, National Centre for Social Research & Westat
Development and evaluation of screen design standards for
Blaise for Windows
Mick Cooper – Paper Not Available
From DOS to Windows
Diane Bushnell, ONS
The TADEQ Project, state of affairs
Jelke Bethlehem, CBS
Helping non-Blaise Programmers to Specify a Blaise Instrument
Mark Pierzchala, Westat, US
Graham Farrant, National Centre for Social Research, London, UK
I. Overview
Some computer-literate researchers now specify their questionnaires directly in the Blaise language, while others who rely on
programmers to create Blaise instruments have become familiar with many of the conventions and special features of the
system. However, there are many researchers, survey sponsors, and subject matter experts who know very little of how Blaise
works, but who still need to specify their questionnaire for a Blaise programmer.
There is the potential for a great deal of misunderstanding and wasted effort if specifications of questionnaire requirements
given to a programmer do not reflect the way that Blaise works. Conversely, there can be great gain if specification writers are
aware of some of the more powerful features and development methodologies available for Computer-assisted interviewing
(CAI) questionnaires in Blaise. These aspects are covered in Section II, What the Interviewer Sees, and Section III, Source
Code. This paper then presents two complementary kinds of specification. Formal specification is concerned with codifying
the research in terms of concept, question definition, routing, checks, computations, valid values and so on. Formal
specification is treated at length in Section IV, Drafting the Blaise Questionnaire. Interface specification focuses on
presentation and usability and aims to help the interviewer to understand the questionnaire. In particular, it tries to help to
understand how to handle unanticipated events such as ad-hoc navigation. This is treated in Section V, Specifying the Blaise
Interface. We consider testing to be an integral part of specification, thus a brief treatment is given in Section VI, Testing the
Questionnaire Program. Section VII, Special Topics, gives an overview of some special topics. Section VIII, Alternative
Approaches, notes other ways to go about producing questionnaires. Selected references appear in Section IX. Appendix A
provides detailed information on navigation and ways to make it more powerful. Appendix B shows a detailed sample
specification. Appendix C covers some important details about block specification. Appendix D gives information about data
readout possibilities.
This paper constitutes a simple guide to Blaise conventions for non-programmers, to enable them to specify a questionnaire
that is rooted in Blaise efficiently, and which a programmer can turn into source code quickly. The Guide is based on
documents in use at the National Centre for Social Research in the UK and at Westat in the US. It aims to convey the key
conventions and features of Blaise rapidly, without requiring users to specify precise syntax.
1. The Intended Audience for this Guide
This Guide is intended for readers who possess little or no familiarity with Blaise or computer programming. Those who are
familiar with Blaise may still find it useful. The reader is likely to be a researcher or academic who needs to draft a Blaise
questionnaire, or a survey sponsor who needs to understand and comment on a draft. It may also help survey users to interpret
Blaise source code for an existing questionnaire.
The goal of this Guide is not to turn the reader into a Blaise programmer. Rather, the aim is :
•
•
•
To present some of what is possible with Blaise,
To introduce simple Blaise conventions, and
To explain how to achieve transparency, so that the specification is clear to everyone involved - researchers,
programmers, and sponsors.
This last aim is important. Blaise is a programming language, and a great deal of programming time and effort can be wasted
in trying to translate a poorly specified draft questionnaire.
II. What the Interviewer Sees
Before specifying in Blaise, it is helpful to know how the interviewing interface and other aspects of Blaise work, and how
they differ from paper or other systems.
3. How the Interviewer Works
When asking questions, the interviewer reads the question from the InfoPane, enters the answer in the page, and presses the
Enter key. The cursor moves to the next data entry cell in the page and the question text in the InfoPane changes accordingly.
Since the values of many questions are presented in the page at one time, the interviewer can verify that the correct response
has been typed. The normal forward movement of the interview, including skips, is controlled by the formal flow or routing
specification programmed in the instrument (see Section III for a more detailed discussion of this topic).
Navigation
An often forgotten aspect of specification is navigation. This is important because interviews do not always proceed in the way
that we plan. A respondent may wish to change a previous answer and the interviewer will need to back up to make the change.
In Blaise, it is very easy to navigate in an ad-hoc manner and to correct answers, even when it is necessary to navigate over
many pages. Thirteen (or more) methods of navigation are covered in Appendix A. It is useful to think of navigation in terms
of short-range, mid-range, instrument-wide movement, and non-linear motions. There are many ways to enhance the
understandability and usability of the Blaise instrument with these kinds of movements in mind. These enhancements are
described in detail in appendix A. The basic point to remember is that the basic Blaise paradigm solves many problems of
overview and navigation, and that you have options that can enhance the paradigm.
If the result of moving backwards and changing a response is to change the flow of the questionnaire, the new route is
immediately implemented. By pressing the End key, the interviewer will be taken to the new route if necessary to fill in the
missing details.
III. Source Code
The previous section depicted the Blaise questionnaire as it appears to the interviewer. Underlying every Blaise questionnaire
is a set of instructions called source code, written in a programming language. The source code for a survey is, in effect, the
new Computer Assisted Interviewing (CAI) equivalent of the old paper questionnaire. Source code is compiled (prepared) by
the Blaise system into a data model. The data model (or instrument) is used by the Blaise Data Entry Program to run the
questionnaire on the interviewers’ computers.
The key document in creating a Blaise questionnaire is the source code. When we are drafting Blaise questionnaires, we are
really drafting source code using the Blaise language. This can be done in any word processor or text editor. A lot of source
code in Blaise is not difficult to write or to understand. The questions and answers are described in the source code in much the
same way that they will appear on the screen. But source code has other special features and conventions that make writing it
quite different from writing a paper questionnaire. This section is merely an introduction to what source code looks like so that
you better understand how your specifications relate to the eventual source code. See Section IV for detailed guidelines.
1. Fields and Rules
Blaise fields define the instrument's data definition, while rules determine the flow of the questionnaire, edit checks for a field
or between fields, and computations (math or text manipulations). The following example shows a simple Blaise data model.
DATAMODEL FieldsAndRules "Fields and Rules"
FIELDS
Name "What is your name?" : STRING[20]
Age "How old are you?" : 0..120, RF, DK
Job "Are you employed?" : (YES, NO)
RULES
Name
Age
IF Age >= 16 THEN
Job
SIGNAL
IF Job = Yes THEN
Age <= 85
"It is unusual for people to work above the age of 85,
have I mistyped something?"
ENDIF
ENDIF
ENDMODEL
When the programmer prepares the source code above, the electronic instrument is created. (To prepare a data model, simply
press the F9 key in the Blaise Control Centre.) For this simple example, one screen is generated on which all three questions
appear. The appearance of the Blaise page and question text is determined by configuration settings that have already been
determined, either by default, or by defining your own appearance beforehand. The Blaise database is also generated. This
data model contains places for three data items. The Rules section illustrates conditional routing (Job is asked only if Age is
greater than or equal to 16). A soft check is invoked if the person has a job and is over 85 years old.
2. BLOCK and Structure Point of View
Blocks hold related groups of fields and their rules. A block can represent a section or sub-section of a questionnaire.
Following is a simple illustration.
DATAMODEL BlockDemo
LOCALS
I : INTEGER
FIELDS
Job "Are you employed?" : (YES, NO)
NumJobs "How many jobs do you have?" : 1..10
BLOCK BJobDetail
FIELDS
Employer "What is the name of the employer?" : STRING[30]
KindJob "What kind of job do you have?"
: (worker, supervisor, manager, director, other)
JobOS "Please specify the kind of job you have." : OPEN
RULES
Employer
KindJob
IF KindJob = Other THEN
JobOS
ENDIF
ENDBLOCK
FIELDS
JobDetail : ARRAY [1..10] OF BJobDetail
RULES
Job
NumJobs
IF Job = Yes THEN
FOR I := 1 TO NumJobs DO
JobDetail[I]
ENDDO
ENDIF
ENDMODEL
Blocks can be defined once and reused several or many times, as demonstrated above. Here, the arrayed block JobDetail is
called once for every job. For example, if a respondent has two jobs, the block is called twice. The reusability of blocks is an
extremely powerful feature. If they are used appropriately, blocks can greatly reduce the programming and maintenance
burden of questionnaires and reduce their internal complexity. This is because many questionnaires ask the same or similar
group of questions about different topics. Appendix C illustrates two ways of customizing details within the same block
structure to different subjects. That is, giving them different question text, edit limits, and so on, without having to reprogram
the whole thing two or more times. It also illustrates how to separate within-block concepts from extra-block concepts, which
is very cost effective for some surveys.
3. Types, Procedures, and Other Blaise Generalizations
In addition to reusable block definitions as described above, type sections (or libraries) and procedures offer a way to encode
frequently used constructions in the Blaise source code. A type is a response definition. For example. many questions allow
Yes and No as valid responses. In this situation, you can define a type definition, TYesNo, and use it in multiple places. Or,
your questionnaire might use an agreement scale many times (agree strongly, agree, neither agree or disagree, disagree,
disagree strongly) and you can define a type called TAgreeScale5. It is possible and advantageous to define each of these
responses once and use the definition throughout the questionnaire. Use of pre-defined types reduces programming time and
eases maintenance. For example, if your questionnaire all of a sudden had to be put in a second language, the use of types
allows you to specify the alternate response text in one place, instead of in many places.
A procedure provides a way to define complex computations in a reusable segment of code. This is equivalent to defining a
user function. For example, while Blaise has a RANDOM function, it does not offer a way to choose m unique elements out of
n possible elements. The programming for this is quite complex, but once done in a procedure, this code can be reused in an
instrument or between instruments.
4. Languages, Spoken and Unspoken
Blaise has long had a language capability that allows interviewers to switch between spoken languages. The LANGUAGES
declaration has also become a place for declaring unspoken languages with other uses, as shown in the following example.
LANGUAGES =
ENG "English",
FRA "French",
HLP "Help"
MML "Multimedia",
MDL "Metadatalanguage"
{spoken}
{spoken}
{unspoken}
{unspoken}
{unspoken}
In this example, two spoken and three unspoken languages are declared. Each has a 3-character identifier and a description
between quotes. The identifiers such as ENG or HLP have no meaning to Blaise, except that these identifiers may be used later
in the source code. In the developer's environment, it is possible to state which languages are spoken and which are not.
Spoken languages are available to interviewers, while they never know about the unspoken ones. A function key can be used to
toggle between spoken languages during the interview.
The unspoken languages are used for other reasons, including multimedia questions (sound, images, video), Microsoft®
WinHelp links for question-by-question help, or as a repository for additional field- or block-level metadata. See section 5
below for details.
Blaise knows which language is in use. You can state IF conditions based on a language. For example, a text fill might be
computed one way for English and another way for French.
5. The Many Uses of a Field Definition
The field is the basic unit of data definition in Blaise. There are six elements of field definition, as shown in the following
example.
FIELDS
FieldName
(FieldTag)
"FieldText" / "FieldDescription"
: FieldValue, FieldAttributes
Section IV, below, details how to explain field specifications to the Blaise programmer. Here we describe what can be done
with the six elements of fields with respect to screen display and downstream metadata description, taking into consideration
the various needs of users and data export and analysis. The point of this discourse is to allow you to specify what you want
without confusing the programming or specification.
Following are descriptions of Blaise field elements:
•
•
•
•
•
•
The FieldName is used in the rules of a Blaise program to describe routing, edit checks, and computations. It can be
displayed on the page of the Data Entry Program (DEP), and in the edit jump dialog. It can be used as a downstream
metadata identifier for the question through a Cameleon setup. Cameleon setups provided with the Blaise system use
the FieldName as the default downstream identifier. FieldName is unilingual. It is required.
The FieldTag may be displayed in the page of the DEP (and in the edit jump dialog) if the FieldName is also
displayed. In the DEP, it can be used to jump to a field through the jump dialog. It can be used as a downstream
metadata identifier for the question through a Cameleon setup. It is not used in the Rules section. FieldTag is
unilingual. It is optional.
The FieldText is almost always displayed in the InfoPane and is used as the question text. Short field text can be
displayed in the Blaise Page though this is a specialty use. Cameleon can access the value of the FieldText. It is not
used in the Rules section. FieldText is multi-lingual and can take fills. It is optional.
The FieldDescription may be displayed in the Blaise page as an alternative to the FieldName. It can also be displayed
in the edit jump dialog. This is a new feature in Blaise for Windows which started in 1999. Cameleon can access the
value of the FieldDescription. It is not used in the Rules section. FieldDescription is multi-lingual but cannot take
fills. It is optional.
The FieldValue defines valid values and is represented in the Blaise page by a data entry cell. FieldValue can be
accessed by Cameleon. FieldValue is displayed in the edit jump dialog. It is required.
The FieldAttributes include whether Don't Know (DK), Refusal (RF), or EMPTY are allowed. FieldAttributes can be
accessed by Cameleon. They are required though if you do not state anything the defaults are NODK, NORF, and
NOEMPTY.
Possible Uses of Field Elements and A Suggestion for a Field Name Convention
There can be several ways a field is known to various users of the system. For the interviewer, a readable identifier of 1, 2, or 3
words helps immensely in understanding the instrument and in navigation. The specifier, project staff, and data review
personnel may be more comfortable with a question number. Data analysts probably prefer something between a question
number and a description, but they would like to have the description too. In fact, their downstream package, for example
SPSS, may require variable names of eight characters or less but allow a label of up to forty characters. In a two-language
setting, where interviewers are not bilingual, it may be required that the interface be either totally in one language or totally in
another language, including all screen display elements. There are yet other required identifiers that may not be obvious,
including a link to WinHelp for some or all questions, and perhaps some entity identifier for a downstream relational database
system. And as discussed in Appendix C, it is desirable to not attach block-level information to a field-level name.
Given these considerations, we present a field naming convention that allows you to reconcile all these requirements including
taking advantage of new features such as descriptions in the page and use of WinHelp for question-by-question help.
An example for elementary fields (not block fields) is shown below:
FIELDS
FieldName
(FieldTag)
ENG "English Field Text"
FRA "French Field Text"
HLP "WinHelp link"
/ ENG "English Field Description"
FRA "French Field Description"
: FieldValue, FieldAttributes
Where:
•
•
•
•
•
FieldName is used in the Rules (you cannot get away from this) and it is the default downstream metadata identifier.
It is not used in the Blaise page or in the edit jump box. The interviewer never sees it in the screen configuration
advocated in this paper.
FieldTag is used for question numbers if they are specified. It is also used for selected section jump points. For
example, a household enumeration table may be given a tag of hh. Then the interviewer can jump to hh to return to
that section. For example: A to jump to section A, B to jump to section B, etc.
FieldText is used as the question text in the InfoPane for spoken languages such as English or French.
FieldText for the HLP language is used as the WinHelp link. If there is no WinHelp for a field, then this entry is left
blank.
FieldDescription is used as the interviewer identifier and additionally as a label in a downstream system for all
spoken languages. When the interviewer switches languages, everything on the screen, including the visible field
identifiers, switch to the next language too. If there is an edit, then the fields are identified by the readable
FieldDescription in the appropriate spoken language.
The following example shows block fields:
FIELDS
FieldName
ENG "English banner" {at the top of every field in the block.}
FRA "French banner"
MDL "Entity"
{if used in your survey}
: BlockDefinition
The question text defined in a block field definition can be used as a banner, appearing at the top of every InfoPane for every
field in the block. The MDL language was mentioned above as a possible repository of additional metadata. It is possible, for
example, to use an MDL FieldText or FieldDescription as an alternative downstream metadata identifier. This is an advanced
topic and requires someone that knows how to program Cameleon (or for someone to share a Cameleon script).
6. In Blaise, a GoTo is a No-No
Many paper questionnaires, and many other interviewing systems, use the GoTo statement to direct interview flow. Blaise does
not. It implements skips solely through IF conditions. In other words, you state the condition under which a field is on the
route. This is known as using gates and is also known as stating the universe of the field. It is felt by many that by eliminating
the use of GoTo (in any system) the source code is better structured, easier to read, and more easily maintained.
If your routing specification is in GoTo format, someone will have to translate it into the converse convention of IF conditions.
This can be surprisingly difficult, enormously time consuming, and prone to error. It should not be left to the programmer to do
this. The specifier, or someone else, should be the one to state flow in terms of IF conditions. This should be recognized as a
separate task. You can produce flow charts to aid the translation, and you can provide block-level scenarios to test the routing.
7. Edits are Stated in a Positive Sense (Usually)
For historic reasons, edits in Blaise are usually programmed in a 'positive' sense. That is, the edit should be stated in terms of
what should be correct, not what is incorrect, as shown in the following example:
IF Job = Yes THEN
Age >= 14 "Respondent is too young to have a job."
ENDIF
The following example is also valid, but many long-term Blaise programmers may not know this.
IF (Job = Yes) AND (Age < 14) THEN
ERROR "Respondent is too young to have a job."
ENDIF
The point is to make sure the specifier and the programmer have this straight between them.
8. Data Export, Data Structures, and Metadata Description
Blaise supports three kinds of data export. ASCII export produces one flat rectangular file as output. ASCIIRELATIONAL
export produces one data file per unembedded block, thus resulting in several or many output files. The third kind of data
export is a custom export where a Manipula program exports data according to (potentially many complex) instructions. This
custom Manipula program can either be hand programmed or Cameleon can generate it based on Blaise metadata contained in
the field declarations. There are a few issues to keep in mind in any of these options. Appendix D discusses these three options
at length. Suffice to say for now that data export is something one should keep in mind at the time of specification.
9. New Possibilities in the Windows Version of Blaise
The first Windows versions of Blaise were designed to be upwardly compatible with Blaise III, the last DOS version. It is
possible to invoke a Blaise III instrument in Windows, and execute a perfectly acceptable Windows instrument. However,
Blaise offers more features as time goes on. An incomplete list includes font size and font style possibilities; native multimedia features such as audio, graphics, and video; tab sheets and better labeling for parallel blocks; a much more configurable
interface and a tool (mode library editor) with which to do that configuration; a configurable user menu; WinHelp for questionby-question help; an audit trail; enhanced CATI management features; use of field descriptions in the page (instead of field
names); ability to tie function keys to parallel blocks, DLLs, or executable programs; enhanced use of DLLs in the rules;
identifiable checks and signals; ASCII external files and external files in memory, and edit masks for formatted data entry
(e.g., dashes in a phone number). An important new capability, that of Open Blaise Architecture, will be released after the
writing of this paper in Blaise version 4.5. This release will allow tighter integration with other Windows systems and open up
many new possibilities that are beyond the scope of this paper.
10. Adapting an Instrument
It is easy to change a Blaise data model. Probably more than in any other system, you can easily add or delete questions or
whole blocks, change the flow of interview, establish new edit limits, and so on. There is a drawback, however. Even minor
changes to the data model can result in a change in the Blaise data file definition. This can be unexpected. For example, if you
add an edit, or a response to a pre-coded question, then the new data file can be incompatible with the old data file.
It is not difficult to write a Manipula setup that can translate the data from one version of a data model to another. However,
there is an operational problem. You might have different versions of Blaise data sets lying around, and this can be difficult to
manage. For example, if one interviewer does not receive an update to a data model, then when she sends her data in, you may
try to process it with the wrong Blaise data model and the process can end abnormally.
From the standpoint of specification, let it suffice to say that it is always desirable to send a completely correct instrument to
the field. This is helped by clear specification and by knowledge of the process that produces a specification. In those
situations where a data model must be changed in the field (with resulting data definition changes) the organization executing
the field work must have procedures in place that can handle this transition in data. Such a data definition change need not be
traumatic if it is properly anticipated.
11. Capacity and Performance
It has been proven in a few Westat data models that exceedingly large data models, with hundreds of thousands of defined
fields, edits, and computations, can execute quickly even on relatively low-end computers (see for example, Frey, 2000). It
may take an expert to design such a data model, but it can be done. In both Westat data models, time of instrument
administration is not large. That is because they are well-specified in a research sense. There are a large number of potential
questions, but in any given interview, only a small proportion are actually asked.
Just because you can specify such large data models does not mean that you should. You have to consider respondent burden
as measured by the numbers of questions that are asked. It is possible to specify a large data model, have it run well, and yet be
a burden to the respondent. This is not a Blaise issue as much as it is a research methodology issue.
IV. Drafting a Blaise Questionnaire
This section covers the formal specification of the research. An example specification in Appendix B illustrates the guidelines
offered here.
1. The Early Draft
Drafting a Blaise questionnaire usually has two stages:
•
•
An early draft that follows only the most basic Blaise principles but doesn’t include any frills or detail;
A later, more developed, draft for the programmers that is more tightly specified, and which can quickly be turned
into useable source code.
At the earliest stage of questionnaire development, while the draft is going back and forth between researcher and sponsor,
there are good reasons for not writing very much that is Blaise-specific. It is inefficient to get into Blaise-related detail while
the questions themselves are still subject to amendment or deletion. And sponsors and others who may be completely
unfamiliar with Blaise conventions will find it difficult to read.
2. Designing the Questionnaire Structure
The considerations for a CAI questionnaire are very similar to those for a paper one. A questionnaire will usually divide
naturally into modules according to the question theme or topic. Within topics, the questions may break into smaller sets
according to narrower topics or sub-themes. These modules can often be programmed and tested independently in Blaise, as
mini-data models. This is an efficient use of time, since each module can be specified, worked on and tested separately.
The general Blaise term for any such group of questions - broad or narrow - is a block. So you can have broad blocks and
smaller blocks within them, For example, a block of questions on work, and a block inside on travel to work. When specifying
blocks, don’t re-invent the wheel. Programmers in survey organizations will have blocks of standard or near-standard Blaise
code that can be re-used on new projects. This is particularly so for:
•
•
•
Respondent classification section
Admin block and outcome codes
Household grids for adults and children
Talk to the programmers before starting to write a specification. They may have some off-the-shelf source code that can be
tailored to your needs. It is also useful before getting started to review the questionnaire draft for the following:
•
•
•
Common structures in the questionnaires that may form the basis for re-usable blocks.
Common answer categories that may become Blaise types.
Determine, even if in general terms, what kind of data readout will be necessary.
High-Level Descriptive Specification
When laying out the questionnaire, it is useful, and at times crucial, to describe how blocks relate to one another. For simple
questionnaires, this might be as easy as stating that Section A comes before Section B and so on. For more complex data
models, such as a hierarchical questionnaire with several respondents, you should explicitly state how the interview is to flow.
For example, should all one person's questions be asked before another, or should they be asked concurrently? Should you be
allowed to leave one person before they are finished and proceed to a second? How should job questions be linked to a row in
a household membership table? What happens if a member of the household is deleted but there are blocks of questions that
relate to that member, how should they be treated? An example of such descriptive text is given in Section 2 of Appendix B, In
the Enumeration Table, Across Member Rows.
3. Basic Specification Conventions and Getting Started
Section III above described basic Blaise terms such as fields and rules, and how they combine to make up a data model. In
Blaise source code, fields and rules are separated. For most people this is not a natural way to draft a questionnaire. For all but
the simplest of data models, drafting is more straightforward when the questions and their routing conditions are stated side by
side. We suggest a compromise, using the 'natural' method but without making too much additional work when the draft is
turned into source code.
The specifier and the programmer should agree on basic conventions for the specification. An example of how this is done is
given in the first part of Appendix B.
4. Questions (FIELDS) Within a Block
The metadata and display aspects of fields were discussed in section III, above. It is important to make explicit choices about
how the field definition elements will work for your survey, including screen display and metadata requirements. Here we
discuss their actual specification.
Question Texts
Question text (Blaise FieldText) is placed inside double quotes, and followed by a colon:
"When did you take out that pension?" :
Every question must be assigned a unique name (Blaise Fieldname), alpha or alpha-numeric:
Pen6q
"When did you take out that pension?":
Specify show cards and interviewer instructions inside the quotes (and in capitals):
Pen6q
"SHOW CARD A When did you take out that pension?
INTERVIEWER: IF IN DOUBT, REFER TO CALENDAR" :
Question Names
There are no hard and fast rules for naming questions. Some people have systems, such as, ‘all questions in section A start with
the letter A’ (See Appendix C for a discussion that discourages putting block-level meta-data as part of the elementary field
definition when a block might be reused for a different, but related, topic).
A ‘fast index’ method can be used to create names with a dual reference: First, an alphabetic reference to a module of
questions, and then to an index number within the module. So questions in a module about Education could be named
Edu1, Edu2, Edu3 {and so on}
This is a lot easier and faster than inventing, for each individual question, a distinct name that attempts to summarize the
subject matter.
One drawback with fast indexing is seen when questions are deleted or moved later on, thus breaking the number sequence; or
when extra questions are added, in which case you’ll need to insert an additional sequence letter (e.g. Edu5a, Edu5b). Another
drawback is that the name is not descriptive of the individual question, making it less useful for the interviewer and the data
analyst. If there is time to write meaningful names, this is the best option.
Many ‘downstream’ systems - SPSS being one example - allow a maximum of only eight characters for variable names, so it is
easiest to restrict the name to this length. However, there are other ways to add descriptive information. One is via the field
description, which is specified following the question text:
Pen6q
"When did you take out that pension?" / "self pension" :
The programmer can arrange for the field description to be displayed on screen instead of the name, which makes navigation
clearer for interviewers. It can also be used as a descriptive label for downstream systems such as SPSS, rather than the
default option of using the first forty characters of the question text as a label, which may not express the core intent of the
question.
Another option for keeping track of questions is to use the field tag, which is specified following the question name:
Selfpen (q6)
"When did you take out that pension?" :
Here a tag is used to show the sequence number of the question within the module. Since the tag is not referred to in the
routing, it is easier to keep up to date as drafts are amended. Tags can also be used to jump to a field or a section.
You should at least give a meaningful name to key questions that are referenced frequently in the questionnaire. Because the
question name is referenced in the rules, the source code itself will be more readable if key question names are simple and selfexplanatory (Age, Sex, Tenure, EmpStat, MarStat). A routing instruction like IF Age > 50 is clearer than IF HGrid4 >
50.
Blaise is case-insensitive, so MarStat, MARSTAT and marstat are all read as the same question. The preference is for logical
mixed case (MarStat, EmpStat).
If you use the automatic Blaise facility to set up an SPSS data set, whatever Field Names you assign your questions in Blaise
will be carried over as the SPSS variable names (including your case conventions).
5. Precoded Answers
Put each pre-code in double quotes, separated by an external comma, and put the full list of answer codes in parentheses
(brackets). For example:
Pen14
"Who contributes to this pension: you, or your employer, or both of
you?" :
("respondent only",
"employer only",
"both")
In the final source code, each answer category also must be given a name with a maximum of eight characters). For example:
(resp
"respondent only",
emplyr "employer only" ,
both
"both")
The answer name is essential to the final Blaise specification of the rules, where names are referred to directly (e.g., If Pen14
= resp). However, in drafting the rules you can get by with just referring to the answer text (If Pen14 = ‘respondent only’).
On balance it is probably more efficient to begin with answer names, rather than to add them later.
The interviewer’s screen will display the answer code text, unless no text was specified, in which case the name is shown.
Where there is a single spoken language, it is unnecessary to write both name and text if the name itself is entirely selfexplanatory. For example:
Nwarea2
"Is there a Neighbourhood Watch Scheme in this area?" :
(yes, no)
It would have been unnecessary to write:
"Is there a Neighbourhood Watch Scheme in this area?" :
(yes "yes",
no
"no")
since the screen appearance is identical in both cases. This changes for a bilingual instrument. In that case, you would have
the following:
(yes
no
"yes", "oui",
"no", "non")
It also pays to pay attention to your text conventions. If the responses yes and no are not to be read to the respondent, then use
the following:
(yes
no
"YES", "OUI",
"NO", "NON"
or, in a single language setting:
(YES, NO)
For the same field you can provide labels for some codes, but not others:
MarStat "What is your marital status?"
(single
"single, never married",
married,
divorced,
widowed)
:
6. Re-using the Same Answer Codes
In Blaise, a list of answer categories that is repeated frequently for different questions need only be specified once. They are
declared as a TYPE and given a name. When the list is next required, only the TYPE name is specified; this will have the
effect of calling up the full list. For example, the list below might be used at many different questions:
(agstr
agree
neither
disagree
disagstr
"agree strongly",
"agree"
"neither agree nor disagree",
"disagree"
"disagree strongly"), DONTKNOW
This can be specified just once as a TYPE, for instance
{TYPE: 'AGREEDIS': answer codes "AGREE-DISAGREE"
(agstr
"agree strongly",
agree
"agree"
neither "neither agree nor disagree",
disagree "disagree"
disagstr "disagree strongly"), DONTKNOW }
and then called up for different questions as required:
PolPow "Do you agree or disagree that the police have too much
power these days?" : {TYPE: AGREEDIS}
UniPow "And how about the trade unions - do you agree or disagree
that they have too much power nowadays?" : {TYPE: AGREEDIS}
Discuss this option with your programmer, who might have an off the shelf TYPE you can use.
7. Multi-Codes
Questions that allow more than one answer to be chosen are specified as SET questions, as shown in the following example:
"SHOW CARD B
What were your reasons for taking out this pension?
Please look
SET [2] OF
(morinc "To have more income in retirement",
state
oth
"The state pension may not exist by the time I retire",
"Some other reason")
Here, SET [2] OF means a maximum of two of the answers can be selected. Alternatively, omit the number (SET OF) to
allow all codes to be selected.
8. Numeric Answers
For a numeric answer, specify the range of possible entries, separated by 2 dots (..). For example:
Age "What was your age last birthday?" :
16..120
PenNum "How many pensions do you have altogether?" : 1..5
PStart "Which year did you take out that pension?" : 1930..1995
Pamt "How much money did you contribute last time?" : 0.00..9997.00
Interviewers will not be able to key numbers outside the range you specify. Note that in fourth example above two decimal
places are defined.
9. Text Answers
For some questions the interviewer can key the respondent’s answer verbatim. Blaise features two ways to record text, OPEN
and STRING.
Where the answers are to be assigned codes in a separate operation, it is advantageous to specify the question as OPEN in
Blaise. All the answers to a particular OPEN question can be exported and viewed together, and coded in one operation, the
resulting codes later being merged back in to the data set. The Blaise Data Entry Program also has an explicit review dialog of
all OPEN fields. There is no limit to the number of characters that can be keyed in response to an OPEN question.
If you want the responses to a text question to be stored and exported as part of the data record, you should specify the question
as STRING instead of OPEN. On screen, the STRING answer is entered by the interviewer in a very similar manner to an
OPEN answer. You also need to specify the maximum number of characters that can be entered, e.g.,. STRING [80]. Use of
string is indicated for short answer fields such as Name, JobTitle, StreetAddress, and so on.
A question often has an other answer category. If you want the interviewer to record that other answer, a separate question is
needed, for example:
Pen27q
"SHOW CARD B What were your reasons for taking out this pension?
Please look at this card and choose all the answers that apply." :
("To have more income in retirement",
"Because it gives me life insurance cover",
"The state pension may not exist by the time I retire",
"Because most people at work are in the scheme",
"People at work told me it was a good scheme",
"some other reason (WRITE IN)" )
OthReas
"INTERVIEWER: ENTER OTHER REASON" : OPEN
10. Date and Time Answers
If you want the interviewer to enter a calendar date – For example, 21 9 2000, specify the question as DATETYPE:
Pen6q
"SHOW CARD A
When did you take out that pension?
INTERVIEWER: IF IN DOUBT, REFER TO CALENDAR" : DATETYPE
If you want the interviewer to type in a time – For example, 7:00 am, specify the question as TIMETYPE:
Pen7q
"What time do you get up in the morning?" : TIMETYPE
See the discussion below on Windows Configuration for details on how the interviewer can enter the date and time.
11. Wording Substitutions (Text Fills)
Sometimes you want to vary the question text according to circumstances. The reason might be to save the interviewer the
effort of choosing among wording options (e.g., he/she; did you/do you; first/next; this/that) , or to make sure they read a
special insert (e.g., Thinking of just your main job, how much did you earn? How old is your daughter Sally?)
One of the strengths of Blaise is that it can set up complex substitutions (called text fills), that interviewers find helpful.
However, they are time-consuming to set up and test. The effort saved for the interviewers is time added to the tasks of
researchers and programmers. It is easy to get carried away by text fills, but often the time-efficient practice simply is to state
the options in the wording - e.g., “When did (he/she) leave that job?”; “How long have you lived in this (house/flat)?” - and
let the interviewer choose, as they would do with a paper questionnaire.
Where you plan to use a fill, in the early draft, it is quickest just to put the optional wording in parentheses; adding the ‘hat’
symbol (^), which Blaise uses to denote a fill:
"(^Thinking just of your main job) How many hours a week do you
usually work?" : 1..120
"What was the purpose of the (^first/second) visit?" : STRING [80]
"Why did your child (^NAME) visit the dentist?" :
12. Routing (RULES)
Questionnaires are divided into blocks of questions, usually according to topic. You need to think of every individual question
as being located somewhere within a block. It is common to have broad blocks (such as whole sections of the questionnaire)
and smaller blocks (short sub-sets of questions) within these large blocks.
There are rules (routing instructions) for blocks. Within blocks, there are rules for individual questions. In the final source
code, the rules are stated separately from the description of fields (questions and blocks). However, a more natural way to draft
a questionnaire is to specify, in one place, the field and the condition under which it comes on the route.
Our recommendation is to write the draft in this natural way, stating the rules next to the fields. However the rules specification
should be stated within curled brackets { }. In Blaise, any text placed inside curled brackets is a comment and is ignored by
the program. Later, the draft rules can be extracted (or copied) to form the separate rules paragraph required by Blaise.
Remember that Blaise does not use GoTo. The specifier should translate from any GoTo specification to a gate or universe
specification solely in terms of IF conditions.
Routing to a Block
In the draft, use a plain-English description of the rules, but also refer to the specific fields that determine the rules. For
example:
{now, a short block of pensions questions:
(men, Age<65, women, Age<60)}
if under retirement age
Routing from a Precoded Answer
It can help if the rules are in bold text. First, specify the routing condition in plain English. Then, if possible, add the precise
condition, referring to questions and answer codes by name. For example:
{IF respondent has a personal pension: Pen5 = haspp }
Pen6q
"When did you take out that pension? " : DATETYPE
Note that either condition stated separately would be less than optimal. If respondent has a personal pension is not precise
enough; Pen5 = haspp is not clear enough.
Routing through a Sequence
Don’t repeat routing unnecessarily. If the routing to the field has already been stated, for example, there is no need to re-state it
above each following question until the condition changes.
Routing from a Numeric Answer
If one particular numeric answer to a question determines the routing condition, state that number (e.g., If Visits = 0). If the
condition applies for a range of numeric answers, use the Blaise term IN:
Hea20
"How many times did you visit your doctor last month? " (0..5)
{IF HEA20 IN 1..5}
Hea21
"Did you receive a prescription on (this visit/any of these
visits)? "
In this example, the question Hea21 will enter the route only if the answer to Hea20 is a positive number in the range 1 to 5.
The intention is to skip Hea21 if the answer to Hea20 is none.
13. Rules for Repeated Questions
With Blaise it is only necessary to describe a set of questions once. You then use the rules to tell Blaise either to re-use a block
of questions; or to place questions in a table.
Reusable Blocks
Specifying a block of questions as re-useable is typically done when the information will be collected in different situations –
for example a series of questions that is asked several times in reference to different people (e.g., job description questions,
asked first about the respondent, then about their spouse). You should specify this type of repeated sequence as a block, and
state the conditions under which the block should be repeated, as shown in the following example.
{new block: job details. Ask for the respondent, then repeat for
their spouse / partner, if married or living as married (MarStat =
married or livemar}
Rules for Tables
A sequence of questions that would appear as a grid in a paper questionnaire would usually be defined as a table. For
example, every adult in the household may be asked, in turn, their age, sex, marital status, and when they left education. In a
paper questionnaire this appears as shown in Table 1:
Table 1
Age
Sex
Marital
status
Age left
school
Adult 1
Adult 2
Etc..to N
In Blaise this row is called
the first loop
This row is the second loop
In Blaise the row cases (e.g., adults) are said to “loop” through the question sequence, N number of times.
The exact specification a CAI table can be complex, and is best left to the specialist programmer. When you have a set of
questions that will form a table, use the terms TABLE and FOR to define what you want, followed by a single specification
(one loop) of those questions and their routing.
{TABLE:
FOR each adult aged 16+, ask Age, Sex, MarStat, TEA }
The maximum number of rows in the table is determined by the answer to a preceding question. For example, the following
code followed by one specification of the content and routing of those 3 questions.
,
PenNum
"How many pensions do you have altogether?" : 1..5
{TABLE: FOR each pension at PenNum, ask Pen6q, Pen7q, Pen8q:}
….
Here, the TABLE (of Pen6q, Pen7q and Pen8q) automatically opens a maximum of five times - or fewer, depending on the
actual answer given at PenNum.
See Appendix B for an example of how to specify a table.
14. DON’T KNOWS, REFUSALS, and EMPTY
Blaise sets aside special keystrokes for the interviewer to record a Don't Know (DK) or Refusal (RF) for a particular question.
(The default options are Ctrl+K and Ctrl+R, but these can be remapped to other keys or function keys.) Using these keys
means that DK (don't know) or RF (refusal) will be recorded as a legitimate answer. This means you have to consider these
possible answers when defining the rules.
Whether to Allow DK or RF
When you begin, you have a choice of two baseline settings. You can set your questionnaire to always allow DK (don't know)
and/or RF (refusal) at any question; or you can set it to always disallow (i.e., forbid) them. From either baseline, you can then
exempt particular questions. The always allowed setting is probably more common. The setting you choose depends on the
nature of your questions. That is, you must consider. whether a DK and/or refusal is going to be, more often than not, a likely
or legitimate response.
Under the always allowed setting, you use the Blaise terms , NODK and/or NORF to forbid these responses for a question.
This mean that the questionnaire will not accept the keystrokes for don’t know and refuse for that question. That is, these
answers are declared out of range. You might want to do this at questions which are critically important for routing, and which
are not thought to be sensitive or difficult (e.g., housing tenure).
This example forbids a don’t know at the question JobStat:
EmpStat "Are you an employee or self-employed?" :
(emp
"employee",
self "self-employed"), NODK
The following example forbids a refusal:
EmpStat "Are you an employee or self-employed?" :
(emp
"employee",
self "self-employed"), NORF
This example forbids both:
EmpStat "Are you an employee or self-employed?" :
(emp
"employee",
self "self-employed"), NODK, NORF
EMPTY
An EMPTY attribute allows the interviewer to move past a field without entering data. While not very common, they do have
uses. For example, an apartment number field may be left empty if it does not apply to a household.
Routing Conditions from Don’t Know and Refusal
If DK and Refuse are permitted answers, you need to consider carefully what the appropriate forward routing will be when
those answers are given. It is easy, but dangerous, to overlook this. For example:
Hea20
"How many times did you visit the doctor last week?" (0..5)
{IF HEA20 IN 1..5}
Hea21
"Did you receive a prescription on (this visit/any of these
visits)?"
A don’t know or refusal in an IF condition is evaluated as a 0. Thus, they will not be led to Hea21. To ensure they are
included, the correct rules specification is:
{IF Hea20 > 0 or DK or RF}
If you want, for example, a follow-up question asked only for the don’t know responses (but not refusals), use the term IN:
{IF Hea20 IN 1..5
note: including DK, not Ref}
Hea21
"Did you receive a prescription on (this visit/any of these
visits)?"
It is a common mistake to route don’t know or refusal responses to an inappropriate follow up question:
{ask all}
Hunt8
"Do you agree or disagree with the statement: 'foxhunting is
cruel'?":
(agree
"agree",
neither
"neither agree nor disagree",
disagree "disagree")
If you wanted to ask a follow-up question of those respondents who agreed or disagreed, you might think you could specify the
routing as follows:
{IF Hunt8 < > neither}
Hunt9
"How strongly do you feel about that?" :
(< > means is not equal to). However, if you did that, people answering DK and refusal at Hunt8 would be asked the followup question. This is probably not what you intended. So be sure that the specification is absolutely clear:
{IF Hunt8 = agree or disagree ONLY; Skip if DK/Refusal}
Hunt9
"How strongly do you feel about that?" :
When you are testing your questionnaire, it is useful to enter DK, then Refusal, at every question, to check that people are not
being sent on to inappropriate questions from these answers.
With some questions it may be preferable to include DK and refusal options in the list of answer codes directly available to the
interviewer, as shown in the following example:
Vote
"Which party did you vote for in 1987?" :
(NoVote
"Didn’t vote",
Cons
"Conservative”,
Lab
"Labour",
Lib
"Liberal",
Other
"Other party")
DKnow
"Don’t know",
Ref
"Refused to say"), NODK, NORF
If so, disallow the use of <Ctrl+K> and <Ctrl+R> for this question (e.g., by inserting NODK and NORF). Otherwise you may
end up with two don’t know codes and/or two refusal codes.
15. CHECKS
Sometimes you want the interviewer to be alerted to an answer that is factually inconsistent with a previous answer, or that
appears very unlikely, or is simply not possible.
Checks are triggered by a response or combination of responses. A small window appears on the screen, relaying your
message to the interviewer.
Probably the main function of checks is to catch interviewer mistakes in the-keying of answer codes, and in particular, of
numeric answers (it is easy to hold down a key too long). Aside from this, checks can allow us to query an answer directly
with the respondent, bringing some (or all) of the editing of questionnaires forward into the interview. This saves time later on
for editors and researchers. It should improve data quality, as we are checking answers with the respondents themselves.
Do not add a check just because you can. In any questionnaire you could include literally hundreds of checks. Avoid the
temptation to put in a check just because it is possible to do so, for the following reasons:
•
•
•
A triggered check brings the interview to a temporary halt, while the interviewer reads your message and acts on it.
Checks will inevitably slow down the interview.
Checks can be very time-consuming to program and test.
A check, even if not triggered, adds complexity to the program.
Where and How to Specify a Check
In the final source code, checks are included in the rules paragraph, separately from the fields. However, we are
recommending that in drafting a questionnaire, the rules should be stated alongside the fields (questions). Therefore, write the
check immediately after the question where you want it to be triggered. Later, it must be copied or moved into the rules
paragraph.
Checks are like questions in that they appear only if certain conditions are satisfied. So, in plain English and with specific
references, write an IF… condition under which the check will be triggered, followed by the wording of the check. Enclose all
this in curly brackets. (See Section III for a note on the sense of an edit.)
Writing Check Messages
If an interviewer has simply made a keying error, the check will alert him to the error, which he can amend and move on
without needing to consult the respondent. If they have the response given by the respondent, they need to let the respondent
know there is a problem with the information.
There are three possible strategies for your message:
•
Write the entire message to be read aloud.
•
Write a message to the interviewers, which they then relay to the respondent.
•
Implement a mixture of these.
The read aloud approach should be used whenever possible, as this makes the interviewer’s task easier. There are no precise
rules about what to say. Check texts should follow the standard questionnaire convention that lower case signifies material to
be read aloud, while UPPER CASE is used for messages to the interviewer, such as instructions. Some examples of check
messages are shown in the following example:
"The computer’s asking me if I’ve put that in correctly - can I
just check, your weekly rent is {^RENT7}, is that right? IF YES,
SUPPRESS WARNING AND CONTINUE"
"That’s over 75 hours a week, is that correct?"
In a delicate or awkward situation, however, it may be preferable to tell the interviewer what the problem is, and let them
decide how to handle it. The whole message should therefore be in UPPER case:
"INTERVIEWER: IT’S USUALLY NOT POSSIBLE TO WORK 30+ HOURS A WEEK
AND GET INCOME SUPPORT. TACTFULLY ENQUIRE IF BOTH ANSWERS ARE
CORRECT. IS IT 30+ HOURS? IS IT I.S. OR SOME OTHER STATE BENEFIT?
[14]"
It can be useful for testing purposes to give each check message a unique reference number – see [14] in the above example.
Be succinct. Writing a check message should be like sending a telegram when you have a lot to say, but very little money:
•
•
•
Start with a quick summary of the nub of the problem.
Use simple words and short sentences.
Re-draft check messages to cut out unnecessary material.
Hard Checks
Checks are either soft, allowing interviewers to suppress the warning and move on to the next question, or hard, requiring a
change to be made.
Use hard checks sparingly. Very few responses are impossible. The respondent can be mistaken about an answer, but may
nevertheless be quite convinced it is correct. A hard check forces them (or the interviewer) to change it. The issue is not
“could the respondent be in a situation that would trigger the check?”, but “could the respondent ever think they are in that
situation?” If the answer is “yes”, put in a soft check.
Use hard checks to pick up on impossible combinations of responses. A common example is where an interviewer makes an
error-keying from a multiple choice list, entering none of these plus another answer code. You should routinely insert a hard
check after such a question:
Ben1
"SHOW CARD P Are you currently receiving any of the benefits on
this card?" :
SET OF
(is
"Income Support",
jsa "Jobseeker’s Allowance”
ssp "Statutory Sick Pay"
smp "Statutory Maternity Pay"
none "none of these")
{HARD CHECK:
IF Ben1='none of these' AND any other answer is selected:
"'NONE OF THESE' IS AN EXCLUSIVE CODE"}
For contradictory answers, specify all question names and codes:
{HARD CHECK:
IF Ben1= smp and sex = male: "MEN CANNOT GET MATERNITY PAY"}
16. Computations
You can get Blaise to do behind-the-scenes math and text manipulations. This can be useful when you want to confirm with
the respondent a figure they have supplied. The specification for this situation is very similar to a fill.
Use COMPUTE, and give a name to the computed variable, to tell the programmer your requirements:
{ask all}
Drink2 "In the last 7 days, how many times have you visited a pub?"
: 0..25
Drink3 "And how many times have you visited a wine bar in the last
7 days?" : 0..25
{IF Drink2>0 and Drink3>0:
COMPUTE ^NUMBER:= visits to pub, + visits to wine bar:
and ask Drink4}
Drink4 "That’s a total of ^NUMBER separate visits to pubs and wine
bars in the last 7 days, is that correct?" : (yes, no)
Derived Variables
If you know which variables you will be deriving for data analysis, and if you have time, you can make room for the derived
variables in the questionnaire. The advantage is that the variables - with the correct texts and code frame - will then be in the
correct place for the analysis. (Derived variables created by SPSS are placed at the end of the data set). Also, it will enable
analysis to begin more rapidly.
Obviously, you do not want the derived variables to ‘come on route’ during the interview, so ask the programmer to keep them
off the route (using the KEEP command)
17. Page Appearance Specification
In the columnar page format you can specify where to place a label, start a new column (NEWCOLUMN), skip a place in the
column (DUMMY) or start a new page (NEWPAGE). The following shows how to state this specification.
{NEWCOLUMN}
{Blaise page label}
"Household introduction"
{DUMMY before Building type}
The effect of these instructions is shown in Figure 2 in the right-hand column. There you can see that column headed by the
label "Household information" and that there is a space in the column before Building type.
V. Specifying the Blaise Interface
There are several aspects of the interface that could or should be the subject of specification. Some of these aspects can be
declared across surveys, including: Windows configuration settings for each computer, major components of the Blaise screen
(as given in Figures 1 and 2), design of the Blaise page, including navigational issues and groups of items, and InfoPane
elements. The organization doing the fieldwork may already have defined Windows display guidelines and their interviewers
may be used to them. If there are special needs, probably the easiest, least expensive, and surest way to arrive at necessary
special displays is to define special requirements as a deviation from a known working standard.
1. Windows Configuration
Only a few important Windows configuration settings can be addressed here. These include how date and time are entered,
screen resolution, color sets, and whether the bottom task bar should be visible or hidden. It helps the organization hold down
costs if it can establish certain Windows configuration choices as standards.
Date and Time Regional Settings
Blaise inherits the format and manner of entry of date and time fields in the instrument from Windows. Thus, an American
interviewer can enter date in Month/Day/Year format while his British counterpart would enter in the Day/Month/Year format,
using exactly the same instrument. Regardless of how dates are entered, they are stored internally in Blaise in the
Year/Month/Day format.
Screen Resolution
Screen resolution refers to the number of picture elements (pixels) that are used to display information on the computer screen.
Currently there are two major resolutions to consider. These are 800 x 600 and 1024 x 768. You should know your target
resolution ahead of time, including whether you have to satisfy both (this can happen in a multi-site study). An instrument that
fits just right on an 800 x 600 screen will take up only a large fraction of a screen using the higher resolution and all the
elements on the screen will be much smaller. Fortunately, the Blaise configuration settings are held in external configuration
files. So, using a mode library file suited to 800 x 600 resolution as a preparation/compilation standard, and adapting its
settings to 1024 x 768 implemented in a runtime override, is one way of proceeding with the same instrument.
Color Sets
Not all computers have the same allowed colors. You should make sure you know the color set of the target computers. Lowend CATI workstations or laptops may not have all the color definitions of your powerful desktop machine. Make sure that any
color choices you make will work well on the target machines.
Font Size
When deciding a font size standard, keep in mind that the physical size of a character on a screen depends on four factors.
•
•
•
•
Font size.
Font style, especially proportional vs. non-proportional fonts.
Screen resolution.
Physical computer monitor size.
Readability of characters on the screen also depends on font style. Microsoft®'s Tahoma font is a good choice for clarity.
Windows Task Bar
The Windows Task Bar, usually found on the bottom of the computer screen, can be set so that it is normally hidden until the
mouse pointer is moved over that location. This gives the total screen to Blaise, removes a distraction, and allows more vertical
space for the InfoPane and Blaise page to share.
2. Major Components of the Blaise Screen
The ten major components of a Blaise screen are illustrated in Figures 1 and 2. Of the major components, only four are
required by the Blaise system. These are the Windows control buttons, the title bar, the menu, and the FormPane (page). The
InfoPane is almost always used for question text and the answer list is almost always used for response choices. Another oftenused component is the status bar. The other components are discretionary, and their use, or non-use, can be defined as part of
the general specifications. For some long question texts, or questions with a large answer list, there can be tension between the
need for space in the InfoPane and the desire to increase data density in the page. For this reason, the speed bar, the tabsheets,
and the answer info area are sometimes eliminated to provide more vertical space for the InfoPane and page to share.
Sub-Components
Most of the major components have sub-components or other aspects that can be included, excluded, or configured. An
annotated listing of all these possibilities with recommendations would take about 30 pages of space using small font size, and
thus is the topic of another paper. To give one example, it is possible to include or exclude provided Blaise menu choices, or to
add your own menu choices. For now, the best ways to learn about configuration possibilities for each major component is to
study the Blaise Developer's Guide and to explore the dialogs of the Mode Library Editor and the Menu Editor.
3. Design and Specification of the Page
The design and specification of the page (the Blaise FormPane) is often neglected but is just as important as the design of the
InfoPane. In some surveys, it is more important. The Blaise page is analogous to a page in a paper questionnaire. It organizes
and displays related data elements together. There are several features you can specify in the page that enhance the
presentation for the interviewer. The page enhancements illustrated in Figure 1 include specification of readable field
descriptions to identify each field, labels that group related questions, use of two columns in the page with eight data entry
cells in each column, and size 10 font (for an 800 x 600 display). An important new feature of Blaise for Windows is the use of
the field description in the page as opposed to the more traditional field name. The field description gives more flexibility,
since you can include spaces in the description. It also can be multilingual. You can also use the field description in the edit
jump dialog.
Thirteen Methods of Navigation
The term navigation refers to movement through the questionnaire. The most common method of navigation in Blaise is
standard normal movement from question-to-question throughout the interview. This normal movement is governed by rules in
the data model, and can accommodate complex skip patterns. However, an interview can be interrupted in many unanticipated
ways, including when an edit is invoked, the respondent changes his mind, or there is a break-off. When this happens, the
interviewer often has to navigate to other parts of the questionnaire. There are twelve other ways in which an interviewer can
navigate through a Blaise instrument in order to accommodate these situations. These are described in Appendix A.
On those occasions when it is necessary to engage in ad-hoc navigation, well-labeled and organized pages with high data
density enable the interviewer to go where needed in order to make corrections. In general, high data density is desirable. By
increasing data density, an instrument can be presented in fewer pages. This allows the interviewer to form an effective
cognitive map of the entire questionnaire. The best way to handle ad-hoc navigation is to give the interviewer as much
information as needed to go where necessary. With high data density and readable field descriptions in a page, the arrow keys
are very useful for navigating to another field within that page (short-range navigation). The Page Up and Page Down keys are
very useful for mid-range navigation between pages, especially with high data density accompanied by frequent and
descriptive labels in each page as illustrated in Figures 1, 2 and 3.
Specification of Groups of Questions (Item Types)
Given the page-based nature of the Blaise display, virtually every field (question) in Blaise can be considered to be part of an
overall group of questions (also known as an item type). For example, in Figure 1, the individual fields Street address,
Apartment no, Locality, State, Zip code, and Phone number can be considered to be part of an overall address information
group or type. Similarly, the fields Building type, Spec building, and Kind of locality can be thought of as part of an overall
building information group or type. Other kinds of multi-question types are optimally handled the same way in Blaise; that is
by including all related fields in the same page, giving them appropriate names, and by providing effective labels for all
question groups. Some of these other possibilities include quantity/unit combinations and series of similar questions.
Font Size for the Blaise Page
The size of Blaise page elements, such as size of the field description text, or the data entry cell, is based on a specified font
size. The smaller the size of the font, the higher data density, you can have. It is quite workable to specify a slightly smaller
font size for the page than for the InfoPane. In the examples used in this paper, the page font size is 10.
Field Panes and Columns
A field pane is an area where the field description, data entry cell, and other related elements reside within the Blaise page.
You can choose from several different elements to make up a field pane including space for an enumerated label and a remark
indicator. A column in the page is made up of field panes stacked up on one another. Two columns of field panes is normal in
Blaise, though it is possible to have only one column (do not do this). In one major project, interviewers chose to have three
columns of field panes because their complex survey requires a great deal of ad hoc navigation and the greater data density
facilitates that.
4. Design and Specification of the InfoPane
General layout standards of the InfoPane should be specified. These standards concern the question text display and related
components. There are options for font types, font sizes, and whether context information should be displayed. The idea is to
provide the interviewer with necessary information without making the InfoPane too cluttered or difficult to understand. The
question text should stand out from auxiliary text. The text that is displayed includes not only the question itself and context
header, but also instructions to the interviewer, lists of includes and excludes, indication that help is available, or tabular
display of previously collected data. It is possible to define a hidden frame that helps separate the question text from the upper
and left margins of the InfoPane.
Font Size and Font Style Choice
A good font size for question text (for 800 x 600 resolution) is 11, assuming decent monitor size. You can get more
information in the same InfoPane than with size 12 font, without compromising on visibility. You should consider bolded text
to be the standard for question text, as this can help in outdoor situations where there is bright sunshine. A good font style
choice is Tahoma, a special font designed by Microsoft® for readable display.
VI. Testing the Questionnaire Program
In theory, it should be possible to understand every aspect of how the questionnaire works on screen – its routing, fills, tables,
appearance, etc. – from a thorough scrutiny of the source code. But in reality, this is not a feasible option, and you need to run
the executable program and create questionnaires to check that everything is works as it should.
1. Office Testing
The most common method in the early stages, once the programmer has written the source code for the first time, is office
testing, where the researcher(s) work through the questionnaire, creating different types of household and respondent scenarios
in order to put the program through its paces. The researcher keeps written notes (this is best done concurrently with testing,
using Microsoft® Word) and the programmer uses these to make further changes.
It can be useful, even crucial, to ask the sponsor to also provide scenarios for testing, as they may have a good idea of the types
of respondents / households are of particular interest for the research study.
Testing can proceed in stages by use of mini-data models for development.
2. Interviewer Testing in the Office
Once the questionnaire is functioning as a complete instrument, it can be invaluable to bring one or two experienced
interviewers into the office for a day or two of further testing. One option is for the interviewers to work on their own, going
through the questionnaires using different respondent/household scenarios provided by the researcher, and keeping note of
problems. (See Newman and Stegehuis, (2000) for discussion of automated error reporting and error tracking.)
A better method is to have them conduct mock interviews with the researcher as interviewee. These will be stop-start affairs,
as problems are discovered and noted, and solutions are discussed.
A further improvement is for the researcher to act purely as an observer of the interview, with another researcher or other
member of staff acting as the interviewee, giving answers according to household / respondent scenarios sketched by the
researcher, and improvising thereafter. Being simply an observer and listening in on the interview can reveal new flaws and
ambiguities in questions, and problems with question sequences, that have not been seen before. (Many researchers have had
the experience of only realizing a problem exists when hearing a question spoken aloud by an interviewer during the pilot
briefing.)
The fresh perspective offered by interviewer involvement will reveal new problems and issues not found in earlier testing. The
researcher must keep note of all problems, and (either then or later) write a specification for the programmer detailing what
changes are needed.
It might also be possible at this stage to bring some ’real’ respondents in to the office and test the questionnaire on them, with
the researcher observing and making notes. However, this tends not to happen, in part because of the practical problems of
recruitment at short notice, but also because of the stop-start nature of the process.
3. Piloting
The field pilot is the traditional method for testing the survey process, including the questionnaire itself. It is particularly
valuable in bringing in ‘real’ respondents, who are in situations not always envisaged by researchers during testing.
Interviewers should be encouraged to make notes of problems during their interviews. This might be done using the Blaise
Notepad facility, or on paper. Keeping comprehensive notes in this way is not easy, and the interviewer should allow five to
ten minutes to go over their notes after each interview, fleshing them out as necessary.
Researchers and sponsors should accompany interviewers for at least one day of work, if possible, and keep notes of any
problems that occur.
The pilot comes towards the end of questionnaire development and is generally seen as the last chance to fine-tune the
questionnaire before launch. Therefore pre-pilot testing must be as thorough as possible.
4. Amending the Program and Checking Changes
Testing and amending the questionnaire is usually very time-consuming. The reason is that it is not just a matter of trying to
follow every possible course through the questions and correcting errors; it also involves sorting out problems and issues that
were unforeseen when writing the original questionnaire draft, as well as making numerous small improvements.
Work Side by Side as Much as Possible; It Saves Time.
Note that this method would not be appropriate during the first stage of program writing, when the programmer has to build the
source code from scratch, based on the paper draft. Here it would be a waste of resources for the researcher to be sitting
alongside. Also, where a subsequent change involves major rebuilding work on a complex questionnaire structure, such as an
event history or household grid, the programmer will probably prefer to do this work alone in the first instance.
However, much time can be saved if programmers and researchers work side by side when making changes to the source code,
so that fixing the code is combined with testing the results. An efficient model is for the researcher to keep notes of problems
found during testing, and to sit alongside the programmer while the source code is amended to fix the problems. Then, after
each batch of changes, the programmer compiles a new version of the program and the researcher and programmer together
run through it to test that the changes have been successful. If not, the source code is amended on the spot and the program
recompiled and tested again.
This may seem less efficient than a division of labor into respective skill areas. But in fact it works much better than the
alternative model, which is for the programmer to work alone, using the researcher’s written notes to make changes to the
source code, then supply executable programs for the researcher to test (alone). The disadvantage here is the strong likelihood
of faulty communication and misunderstandings. Some common examples of this:
•
•
•
•
•
The researcher’s notes are ambiguous; the programmer interprets them in a different way than was intended. To
discover and correct this requires a round of testing, a further written request, another amendment to the source code,
an executable file to be supplied, and a further round of testing.
Writing in haste, the researcher makes a minor error in specifying a change request. The mistake is realized when
testing the new executable program, requiring a further written request, and so on (see above process).
The programmer makes a simple mistake. This is picked up by the researcher in testing, who then writes another
change request to correct it. (See above process).
A researcher, having only an imperfect understanding of how Blaise works, spends some time writing an elaborate
request for a change that is not technically possible or is better done in other ways.
A researcher unwittingly requests a ‘small’ change that has significant knock-on effects elsewhere in the program and
requires a lot of work to implement. If they had been aware of this, the request would have been modified or dropped.
VII. Special Topics
Instrument development in Blaise can be made relatively easy even for complex questionnaires, if you approach it correctly.
This too-short section describes some approaches for instrument development.
1. Development of a Complex Data model Using a Simultaneous Bottom-Up and TopDown Approach
Large or complex instruments can be developed efficiently using bottom-up and top-down approaches simultaneously. The
bottom-up part of development refers to the use of mini-data models to develop sections of the questionnaire. The top-down
part of development means programming at the instrument (or integration) level right from the start, using stubs to represent
the various sections until they are complete. This dual approach allows work to proceed on easier block-level tasks by junior
programmers, while a more senior programmer takes care of overall instrument integration (where the complexity often lies) at
the same time. It allows for quicker development, since it is much faster to prepare a smaller data model than a larger one. This
allows for more and quicker iterations in a given amount of time.
Mini-Data Models
Since Blaise III (the last DOS version of Blaise), where constructs known as parameters were introduced, it has been possible
to develop blocks for complex data models by splitting the data model into mini-data models. Often this is done for sectionlevel blocks or other major sections of the instrument. These blocks may themselves have sub-blocks that are not constructed
in a mini-data model.
A mini-data model is one that contains the block to be developed and just the fields necessary to give the block needed
information. Values from fields outside the block are assigned through parameters to the block under development. After the
block is developed, it is inserted into the main data model. The only elements that are necessary to change are the parameter
references.
Integrated Instrument
At the same time developers are working with mini-data models, an integration programmer can be working with the main
instrument. This can be put together early in the project development with stubs for the blocks that are being developed
through the mini-data models. As the blocks are finished, they are inserted into the main data model.
2. Prototyping Challenging Aspects of an Instrument
New types of surveys that are brought into Blaise for the first time quite often have special requirements. Some examples
include the need for extreme ad-hoc navigation, many-to-many data relationships, complex data links between parts of the
instrument, or accommodating unusual displays and navigation within a table. A good way to come up with solutions for
challenging instrumentation problems is through prototyping. It is useful to separate these more challenging issues from the
more common programming tasks and assign the prototyping tasks to a two-person team consisting of a senior programmer
and a subject-matter expert. Their solutions can be shared with and implemented by more junior programmers. The mini-data
model approach to instrument development lends itself nicely to this kind of prototyping.
3. Two or More Spoken Languages
Blaise has the natural capability to handle two or more spoken languages such as English and French. The following
illustrations demonstrate this.
The Phone number field definition from Figure 1 is shown in English and French in the following example:
PhoneNum "Phone number of the home."
"Le numéro de téléphone de la maison."
/ "Phone number" "Numéro de téléphone" :
STRING[12], EMPTY, DK, RF
The field definition has two entries for the question text and two entries for the description. All other components of the field
definition are declared once.
Languages are set up in the instrument by declaring languages that are going to be used, as shown in the following example:
LANGUAGES =
ENG "English",
FRA "Français"
The interviewer switches languages either through a menu or through a function key. If the field description is used on-screen
in the page, the visible field identifier switches languages too, as does the description used in the edit jump boxes.
Specification and Implementation of a Second Language
The translation and execution of a second spoken language in a Blaise data model can be complex. In addition to the field
elements above, which are easily handled, there are texts for edit statements (in the rules), computations for text fills, and text
for response choices. All of these text locations must be found and translated. Testing of a second language can be very tedious
and perhaps done by only one or a few people fluent in the second language. When implementing a second language, you must
leave enough time to adequately program and test the translations.
VIII. Alternative Approaches
While this paper assumes that there are at lease two parties involved in producing the instrument, a specifier and a Blaise
programmer, there are alternative approaches. These are summarized.
1. Subject-Matter Experts Program the Blaise Source Code
This model has been used successfully in some organizations around the world (e.g., Manners, 1998). The block-level source
code is often quite easy to program and can be done by a subject matter specialist with a few hours of training. A harder task in
complex data models is to assemble the blocks together so that they work with each other well. A senior and experienced
Blaise programmer can do high-level integration, and from this, guidelines can be given to the block-level programmer about
how the block will integrate with the overall instrument (see Pierzchala and Manners, 1997).
An advantage to this approach is that the overall specification and development time is reduced, because the original
specification is done directly in Blaise, because there is no communication process between specifier and developer, and
because the person programming the block can immediately prepare it and test it and make repairs.
It is essential in this kind of implementation that the organization arrive at agreed-upon instrument development methodology,
programming standards, interface standards, and have standard high-level code for constructs such as kinds of tables into
which the subject matter specialist can insert blocks.
2. Iterating to a Solution
In this model, a project specifier is teamed with an experienced and senior Blaise programmer who also has extensive survey
experience. While there may be detailed field specifications and survey protocols, the way in which the instrument is put
together is arrived at through iteration. In short, the specifier may verbally, or through brief written descriptions, tell the Blaise
programmer what they are trying to accomplish. After discussion, the programmer develops appropriate prototypes (at the
block level, at the integration level, or both), and comes back. Together they discuss necessary alterations. This process repeats
until an agreed-upon instrument is produced.
With the right people, this method can work extremely well to produce high quality instruments at low cost. It can avoid the
rigidity that can accompany programming to a specification. Especially important are the qualifications of the Blaise
programmer. That programmer must understand how Blaise works best for the interviewers and other users, how it can fit into
an existing survey infrastructure, and how solutions in similar surveys have worked out. Above all, this person must be
expertly knowledgeable with the internal workings of Blaise and how to program robustly. Otherwise, you might get a mess.
3. The Paper Questionnaire as a Specification
If there is a paper questionnaire that is to be implemented in Blaise, the paper questionnaire should be a very good, if
incomplete, Blaise specification. A paper questionnaire is typically an understandable document with well-labeled sections and
sub-sections. Often there is a survey operations manual and an interviewer manual that can provide additional information. A
paper questionnaire can provide a good overview of how the whole instrument works together, and can be helpful in
identifying identical or similar data collection structures and question types. It is also helpful to talk with experienced survey
operations people and interviewers to discuss how they go about collecting and processing the data. This overview can be very
helpful in the overall design of the Blaise instrument.
Although the paper questionnaire can be a good starting point, is also an incomplete specification. It usually has question
numbers and text, but it does not include SPSS or SAS variable names, field descriptions, valid values, or an indication
whether a field can be EMPTY or can allow don't know or refusal. You can hand-annotate a paper questionnaire, noting Blaise
blocks, question types, and similar concerns directly on the paper, or mark a reference on the paper that points to additional
information in another document. This supplemental document can also provide information about text fills, edit checks, and
other information necessary for an electronic instrument.
It is also extremely instructive to work with experienced interviewers, watch them conduct real or mock interviews with the
paper instrument, and generally include them in the development and specification process.
4. Code Generation
It is possible to write a metadata collection instrument in Blaise or in a database system where a project person can state
specifications. An auxiliary program, such as Manipula for Blaise or Visual Basic on another database system, can produce
Blaise source code especially at the block level. Blaise fields are easiest to specify, while the within-block rules can be more
difficult to handle.
The advantage of such an approach is that it eliminates much of the mundane specification and programming work associated
with producing an instrument. There can be tradeoffs, however. For example, a programmer may make changes in the
questionnaire source code after it is generated. If this source code were not used to repopulate the specification database, then
the source code and the metadata database would be out of sync. It is not difficult to produce a parser to read field definitions
back into such a database. It is much more difficult to parse the rules to repopulate the metadata database (since Blaise is a
powerful fourth-generation language, it is possible to program rules in a way that metadata database does not anticipate, also
the rules can be extremely complex). It is possible to produce a metadata database system that generates fields in a source code
file that is separate from the rules, thus separating the issues associated with field metadata from the rules metadata.
The point of view of the metadata database and generation is extremely important. Many such systems have an item-based
point of view that does not fully recognize block structure and type possibilities in Blaise. A better point of view for such a
metadata system is a structure-based point of view that formally acknowledges the blocking structure of a Blaise instrument
and can drastically reduce specification and development work. The National Agricultural Statistics Service in the U.S. uses
such a point of view in a Blaise metadata database and generates over 40 complete questionnaires every quarter (Pierzchala,
1993, Schou and Pierzchala, 1993) in a highly specialized context.
The block-based point of view is illustrated in Appendix C, in the discussion of blocks and field names. In that example, if a
field name were MaizePAcres this would be a specification with an item-based point of view. If the block were named Maize
(or Soybeans) and the elementary field name PAcres, this is a block-based point of view, and this is what you should do.
IX. References
Farrant, G. and Thompson, K. (1998). How to write a Blaise-friendly questionnaire. Internal working paper, National Centre
for Social Research, London.
Frey, R (2000). Developing a Blaise Instrument for the Spanish Bladder Cancer Survey. Proceedings of the Sixth International
Blaise Users Meeting, Kinsale, Ireland, CSO Ireland.
Manners, T. (1998). Using Blaise in a Survey Organization Where the Researchers Write the Blaise Datamdoels. Proceedings
of the Fifth International Blaise Users Conference, Statistics Norway, p. 125-138.
Newman, S. and Stegehuis, P (2000). Configuration Management and Advanced Testing Methods for Large, Complex Blaise
Instruments. Proceedings of the Sixth International Blaise Users Meeting, Kinsale, Ireland, CSO Ireland.
Pierzchala, M. and Manners, T. (1997). Producing CAI Instruments for a Program of Surveys. In Computer Assisted Survey
Information Collection, Wiley Series in Probability and Statistics, Couper et. al. (Eds).
Pierzchala, M. (1992). Generating Multiple Versions of Questionnaires. In Essays on Blaise. Proceedings of the First
International Blaise Users Meeting, Voorburg, The Netherlands, CBS, pp. 131-145.
Schou, R. and Pierzchala, M. (1993). Standard Multi-Survey Shells in NASS. In Essays on Blaise 1993. Proceedings of the
Second International Blaise Users Conference, London: OPCS, pp. 133-142.
Appendix A: Navigation in Blaise
Navigation is powerful in Blaise, and the layout of the page can enhance or detract from this power. This appendix lists the
major navigation methods in Blaise, how they are used, and how they can be enhanced.
Navigation facility
Use
Programmer Enhancement
Normal forward movement
Forward movement during interviewing is
governed by RULES specifications in the
instrument.
High data density in the page allows
the interviewer to understand the
flow and content of the instrument.
Edit jump list
Lists fields in the instrument that the
interviewer can jump to in order to fix edit
failures.
Use readable field names or field
descriptions to represent fields in the
edit jump list.
Paging with <Page Up> and
Medium range navigation through sections
of an instrument. This is a major method of
navigation. <Page Up> goes back one
Blaise page (one FormPane). <Page
Down> goes forward one Blaise page. You
cannot page down past fields that have not
yet been reached in the interview.
Enhanced with forms based
approach:
<Page Down> keys
• Dense data display (important),
and
• Labels at the start of each
column or set of fields.
• NEWCOLUMN or NEWPAGE at
the start of a section.
Arrow keys
Short range navigation within a page
(FormPane). Arrow keys move one cell at a
time
Enhanced with dense data display,
column labels, and readable field
names or descriptions.
Home key
Used to jump to the first field in the
instrument.
Users often use this if they want to
review the data in a form.
Subsequent navigation is facilitated
with paging down through well
designed Blaise pages with high data
density.
End key
Interviewing: Jumps to the next appropriate
question, taking into account changes of
route based on changed data.
In interviewing, <End> skips past
questions with EMPTY attribute.
Thus do not give an EMPTY attribute
to questions you require. The End
key is one of the most important
navigation keys in Blaise.
Editing: Jumps to the last question in the
instrument.
Parallel block navigation:
• Parallel block lister.
• Parallel blocks on tab
sheets.
Breaks the linear progression of the
interview, including appointments; nonresponse; concurrent household
interviewing; or where sections are
completed by different individuals.
• Function keys to access
selected parallel blocks.
Use conditions to determine when
each parallel block is available.
Tabsheets for parallel blocks are
available with Blaise Version 4.1, as
is the ability to assign a parallel block
to a function key.
• Function key to return to
main interview.
Jump box
Use descriptions for parallel blocks
(define these in Project>Data model
Properties.)
Jumps to any field with a field tag. It is very
effective for jumping to sections where a
section label is supplied.
Use short field tags at the start of a
section. For example, for Section A,
use a field tag of (a).
The use of dense FormPanes
enhances the section review once
the user has jumped to that section.
This is especially used with paging
and arrowing, as described above.
Edit lister for multiple edits in a
form.
Allows an on-line review, where there are
multiple edit failures in a form. You can
jump to any field listed in the edit lister.
Use of meaningful name or
description for the field name.
Navigation facility
Use
Programmer Enhancement
Remarks lister
Reviews all remarks made in the
instrument. Can jump to the field associated
with any remark.
Use of meaningful name or
description for the field name.
Open field lister
Reviews all open fields in the instrument.
Can jump to the field associated with an
open.
Use of meaningful name or
description for the field name.
Mouse click
Move to any eligible field or parallel block
tab sheet.
Provide a mouse or other pointing
device. Also, high data density in the
page.
Appendix B: Example Specification, Household Enumeration Grid
This appendix illustrates a specification for a household enumeration table for a household survey. It gives the conventions
used, states what is to come before the table, how the table is to operate, what each row of the table is to contain, and what
follows the table.
1. Specification Conventions
Languages
The primary spoken language is English. A second spoken language is French. Translation from English to French will be
done after the questionnaire is programmed. For now, an indication to include French question text and French description text
is included in the field specifications below.
For some questions, help text is available through WinHelp. This is indicated in a field specification with the HLP language
indicator. The text specified for HLP is a link to the WinHelp file. The client will provide the WinHelp file and will use the
links specified below.
Pre-defined Types
Some question response definitions are used commonly throughout the instrument. The following are used in the field
specification section. French translations will be provided later.
TYesNo = (YES, NO)
TContinue = (Continue "[INT] PRESS 1 TO CONTINUE")
TGender = (MALE, FEMALE)
Blaise Page Labels
For pages of columnar display, Blaise page labels are specified. An example:
{Blaise page label}
"Household introduction"
Interviewer Instructions
Interviewer instructions are marked by all uppercase text and are preceded by an indicator as demonstrated.
[INT] ENTER 999 TO INDICATE THAT THERE ARE NO MORE MEMBERS.
Fills
The following fills are used. The ^ indicates that a text fill is specified in the question text.
Fill
^your_SP
Options / examples
[your] [John's]
^you_SP
[you] [John]
^Do_Does
[Do] [Does]
^do_does_ {note the trailing _}
[do] [does]
^Is_Are
[is] [are]
How
When talking directly to the subject,
use your. Otherwise use the first name
of the subject and add 's.
When talking directly to the subject,
use you. Otherwise use the first name
of the subject.
At the start of a sentence, when talking
directly to the subject, use Do.
Otherwise use Does.
Not at the start of a sentence, when
talking directly to the subject, use do.
Otherwise use does.
If talking to the subject, or about more
than one person, use are otherwise use
is.
"What is ^your_SP job title?
Text Enhancements
Text enhancements are given by the @A (etc.) in the question text. You can have 26 defined enhancements. These can be used
for bolding, underscore, font style, font size, tab stops, and so on. The following Text enhancements are used. The @A (etc.) is
defined for types of text. What @A (etc.) represent on the computer screen is determined by a configuration file.
Text enhancement symbol
Default (i.e., no enhancement)
@B
@I
@/
Applied to
All question text not given any other text
enhancement.
Emphasized text
Interviewers instructions
Line feed in the info pane
Appearance in this survey
Tahoma, Normal, 11 point, black
Tahoma, Bold, 11 point, black
Tahoma, Normal, 10 point, blue
The specification question text for the following:
"Have you remembered to include @Ball babies and small children@B?"
becomes
"Have you remembered to include all babies and small children?"
on the screen.
Sample Field Specification
{IF Job = Yes}
NumJobs
"How many jobs ^do_does_ ^you_Sp have?"
FRA ""
HLP "NumJobsDef"
/
"Number of jobs"
FRA ""
: 0..5
Entities
Database entities are given at the beginning of each specification section below. The following database entities are valid for
this instrument.
Entity indicator
HH
PER
EMP
LOC
DAY
TRIP
Entity meaning
Household relational database table
Person relational database table
Employer relational database table
Location relational database table
Day relational database table
Trip relational database table
Spacing indicators
The following are spacing indicators of various types in the Blaise page.
Spacing indicator
DUMMY
NEWCOLUMN
NEWPAGE
Meaning
Space in the column in the Blaise page
Puts next field at the top of the next column of the Blaise
page. If already in the last column of the page, it will put the
column at the start of the next Blaise page.
Puts the next field at the start of the next Blaise page.
DUMMY, NEWCOLUMN, and NEWPAGE are given just before the field they apply to in braces.
{NEWCOLUMN}
{Blaise page label}
"Household introduction"
Flow Specification
Flow or routing instructions are given just before or just after a field in braces.
{IF FName <> EMPTY and FName <> 999}
{ENDIF}
Hard and Soft Edit Specification
Hard and soft edit instructions are given just before or just after a field in braces.
{HARD CHECK:
NumJobs = 0 implies Job = Yes.
"[E HH01] I recorded that you have a job and that the job number is 0. Which is correct?"
FRA"[E HH01]"}
Computation Specification
Computation specifications are given just before or after the field, in braces.
{COMPUTE number of household members from the entries in the enumeration table.}
2. Household Enumeration Section
In this section we describe how to specify a table in Blaise. The example, a household enumeration grid, is something that is
commonly used in household surveys. There are many ways this can be done. The screen shot in Figure 3 at the start of this
paper is from the table produced from the following specification.
General
The sampling algorithm, and by extension the validity of the eventual statistical analyses, depends upon a complete and
accurate listing of household members. Household membership depends on criteria that have evolved over several decades
based on experience in this nation and others. These criteria are not necessarily known by the respondent. Current
methodological practice indicates that the best way to proceed is to have the respondent give information about each person
he/she believes is a member of the household, and after that list is complete, ask follow-up questions. This helps to make sure
that the list is complete by the criteria of the survey. If someone is missing, then the interviewer is to return to the household
enumeration grid and add the missing person or persons. Only when all criteria are covered, is the interviewer allowed to
signal that the enumeration is complete. At that time the sampling algorithm is executed.
Experience shows that the best way to collect household data is within a grid display with freedom of movement. Each
member is listed in a row of the grid. The interviewer can see all information about all members of the household.
Note that all information collected in the enumeration table is necessary for the proper working of the sampling algorithm that
takes into account Age, Gender, and number of jobs. Therefore these data do not allow DK or RF. If the respondent does not
know the information, or refuses to give proper information, then the interviewer is to break off the interview appropriately
(using the break off block) without antagonizing the respondent. At a later time a re-visit will be attempted.
The respondent is allowed to give a fictitious first name and to refuse the last name. However, if there are two identical first
names, such as 'John', then use the last name field to make them distinct. For example, John Jones Sr. and John Jones Jr. or
alternatively, John 1 and John 2.
Before the Enumeration Table
Entity is HH
Introduce the household enumeration section to the respondent.
{NEWCOLUMN}
{Blaise page label}
"Household introduction"
HHIntro
"I am now going to ask you for information on all the members of the household.
@/
For each member I will ask name, age, gender and whether the person has a job, and if so, how many.
@/
This will ensure that the survey is representative of the whole community."
FRA ""
/
"Household Intro"
FRA ""
: TContinue
Maintain a count of household members from the enumeration table. Do not ask for this number. Do not limit the enumeration
of members based on the number in this field.
{COMPUTE number of household members from the entries in the enumeration table.}
HHNumber
"Count of household members."
FRA ""
/
"Number in household"
FRA ""
: 0..25
In the Enumeration Table, Across Member Rows
Entity is HH.
Allow up to 25 people in the household.
The person speaking is to be the first row in the household enumeration table.
There must be at least one person in the household. If there are no valid members in the household, the interviewer should exit
the form through the break off parallel block.
The respondent/interviewer can give the information about household members in any order. For example, data entry can be in
horizontal order for one person at a time, or it can be vertical across people. In the latter, the respondent may wish to give all
first names first, surnames for all members, and so on, in that order.
To leave the household enumeration table, an indication must be given to the computer that it is finished. This is done with an
entry of 999.
Since data entry order for this table is free, it is necessary to check that all required cells are filled in. Therefore as the
interviewer leaves the table, check to make sure there aren't any holes in it. If there is a hole to fill in, the computer should give
a way to arrive back directly at the cell in the table, with an appropriate error message to the interviewer.
Make sure that first name and surname, taken together, uniquely identify individuals. For example, John Jones Sr. and John
Jones Jr. It is helpful for the proper conduct of the interview that enough information is gathered about the names in order to
make it clear to the respondent who is being talked about.
It is possible that people are listed that possibly should not be listed. By deleting the first name entry, the information in the
row shall be deleted and all subsequent rows will move up one row. If the person is later determined to really be a member of
the household, then data entry for that person will be redone (we don't want the respondent to think we're keeping data that are
apparently deleted).
In the Enumeration Table, Within a Person Row
Entity is PER.
The following specifies the composition of, and the execution of the data collected for a person.
{Note, answer required, even if 999 to indicate that enumeration is finished.}
FirstName
"What is ^your_SP's first name?
@I[INT] ENTER 999 TO INDICATE THAT THERE ARE NO MORE MEMBERS."
FRA ""
/ "First name"
FRA ""
: STRING[20]
{IF FName <> EMPTY and FName <> 999}
SurName "What is your_^SP's surname (last name)?
FRA ""
/
"SurName"
FRA ""
: STRING[20], RF
Gender
"@IASK ONLY IF NOT OBVIOUS
What is ^your_SP's gender (sex)? @I "
FRA ""
/
"Gender"
FRA ""
: TGender
Age
"How old ^is_are ^you_SP?"
FRA ""
/
"Age"
FRA ""
: 0..120
Job
"^Do_Does ^you_SP have a job?"
FRA ""
HLP "JobDef"
/
"Have Job"
FRA ""
TYesNo
{IF Job = Yes}
NumJobs
"How many jobs ^do_does_ ^you_Sp have?"
FRA ""
HLP "NumJobsDef"
/
"Number of jobs"
FRA ""
: 0..5
{HARD CHECK:
NumJobs = 0 implies Job = Yes.
"[E HH01] I recorded that you have a job and that the number of jobs is 0. Which is correct?"
FRA"[E HH01]"
{ENDIF}
After the Enumeration Table
Entity is HH.
The following questions will be asked to ensure that no one has been missed. If any of the following are answered No, then
move the interviewer back to the table, at the next appropriate row, in order to fill in the missing person(s).
{Blaise page label}
"Household verification"
RemChild
"Have you remembered to include @Ball babies and small children@B?"
FRA ""
/
"Remember children"
FRA ""
: TYesNo
RemBrdr
"Have you remembered to include @Bany boarders@B? "
FRA ""
/
"Remember boarders"
FRA ""
: TYesNo
RemPrnt
"Have you remembered to include @Bparents who may be living with you@B?"
FRA ""
/
"Remember parent"
: TYesNo
RemRel
"Have you remembered to include @Brelatives who are staying here@B?"
FRA ""
/
"Remember relatives"
FRA ""
: TYesNo
RemFrnd
"Have you remembered to include @Bfriends who are staying here@B?"
FRA ""
/
"Remember friends"
FRA ""
: TYesNo
When all questions above are answered Yes, then invoke the sample algorithm.
Once the sample algorithm is invoked, close off access to the household enumeration table and following questions. Leave the
household introduction question available to the interviewer (it’s a landmark to them).
Appendix C: Modifying a Block for Related but Differing Topics
This appendix illustrates two ways of using the same block definition, but adapting it for different topics. The two methods are
compared and some guidelines are given on when to use which. Other methods of efficiently specifying related blocks are also
given.
The most important point to remember about blocks and structure point-of-view is that it pays to separate within-block
concepts from between-block differences. For example, if you specify crop fields as MaizePAcres, SoybeansPAcres, and so on,
you redefine (and cause the programmer to reprogram) the same structure (but with different field names) several or many
times. This latter practice, by itself, can increase the programming and maintenance burden by an order of magnitude or more
in many instruments. In specification, it is crucial to recognize the parts of the code that can be generalized.
1. First Method, Standard Block with Variable Text and Edit Limits
To give an example from agriculture, one group of questions concerns crops. This example has questions PAcres (planted
acres), HAcres (harvested acres), and Yield. The field Production is derived from HAcres and Yield. Its value will be shown on
the screen for the interviewer's benefit, but it cannot be changed there. It could be hidden entirely.
Example
BLOCK BCrop
PARAMETERS
IMPORT
UpperLimit : INTEGER
Crop : STRING
AUXFIELDS
Label : STRING[20], EMPTY
FIELDS
PAcres "How many acres of ^Crop did you plant?"
/ "Planted acres" : 0..100000, RF
HAcres "How many acres of ^Crop did you harvest?"
/ "Harvested acres": 0..100000, RF, DK
Yield "What was your yield for ^Crop?"
/ "Crop yield" : 0..1000, DK, RF
Production : 0..100000000, EMPTY
RULES
{Within block}
Label := Crop
Label.SHOW
PAcres
IF PAcres > 0 THEN
HAcres
CHECK
HAcres <= PAcres
"Harvested acres must be less than or equal to planted acres."
IF HAcres > 0 THEN
Yield
IF (Yield > 0) AND (Yield = RESPONSE) THEN
SIGNAL
Yield < UpperLimit
Production := Yield * HAcres
Production.SHOW
ENDIF
ENDIF
ENDIF
ENDBLOCK
Notice how this structure is the same for different crops; for example, maize and soybeans. This can be programmed in Blaise
through block reuse by giving the block two (or more) different names as shown below.
Example
AUXFIELDS
UpperLimit : 1..100000
Crop : STRING[30]
FIELDS
Maize : BCrop
Soybeans : BCrop
{Define block Fields in terms of one
block definition}
RULES
NEWCOLUMN
UpperLimit := 130
Crop := 'Maize'
Maize(UpperLimit, Crop) {Call the Maize instance of the crop
block and pass in a specific edit limit
and a custom text element.}
NEWCOLUMN
UpperLimit := 55
Crop := 'Soybeans'
Soybeans(UpperLimit, Crop)
{Do the same thing for soybeans.}
While the concepts of planted acres, harvested acres, yield, and so on are the same for both maize and soybeans, there are
differences in the question text, value definitions, edit limits, and downstream variable names. In the example, the parameters
Crop and UpperLimit customize the same block structure for the different crops. The soft edit using a parameter UpperLimit is
defined in a general way in the block but its value is changed before each instance of the block is called in the rules.
Two instances of the block were declared using block field names, one for maize and one for soybeans. Thus at the block level,
it is possible to state additional metadata that can be used in conjunction with field-level metadata within the block. For
example, Cameleon can be programmed to concatenate Maize and PAcres into MaizePAcres and also SoyBeans and PAcres
into SoyBeansPAcres to uniquely identify field elements to downstream processes without destroying the reusability of a block
definition. This is another advanced use of Cameleon.
The block can be arrayed. In the block below there are 10 instances of the same block or structure.
Example
FIELDS
Crop : ARRAY [1..10] OF BCrop
2. Second Method, Different Fields Sections, Same Rules Sections
Sometimes the method considered above is not powerful enough. This can be the case where, for reasons of metadata export,
you need to have more specific field-level metadata available. On the other hand, you do not wish to reprogram the rules for
different metadata identifiers. This section describes an alternative that allows you to be more specific with specification at the
field level, while allowing you to program the rules only once. Consider how the example of Blaise could have been
implemented using the Blaise INCLUDE statement.
BLOCK BCrop
PARAMETERS
IMPORT
UpperLimit : INTEGER
IMPORT
Crop : STRING
AUXFIELDS
Label : STRING[20], EMPTY
INCLUDE "BCrop.Fld"
INCLUDE "BCrop.Rls
ENDBLOCK
{Include the fields section.}
{Include the rules section.}
The example below shows how the fields section can change, but the rules section (the hard part) can stay the same.
BLOCK BMaize
PARAMETERS
IMPORT
UpperLimit : INTEGER
IMPORT
Crop : STRING
AUXFIELDS
Label : STRING[20], EMPTY
INCLUDE "BMaize.Fld"
INCLUDE "BCrop.Rls
ENDBLOCK
{Include the fields section.}
{Include the rules section.}
and
BLOCK BSoyBean
PARAMETERS
IMPORT
UpperLimit : INTEGER
IMPORT
Crop : STRING
AUXFIELDS
Label : STRING[20], EMPTY
INCLUDE "BSoybean.Fld"
INCLUDE "BCrop.Rls
ENDBLOCK
{Include the fields section.}
{Include the rules section.}
Where BMaize.fld is the following:
FIELDS
PAcres (101) "How many acres of maize did you plant?"
/ "Maize planted acres" : 0..100000, RF
HAcres (102) "How many acres of maize did you harvest?"
/ "Maize harvested acres": 0..100000, RF, DK
Yield (103) "What was your yield for maize?"
/ "Maize crop yield" : 0..300, DK, RF
Production : 0..100000000, EMPTY
And where BSoybean.fld is the following:
FIELDS
PAcres (201) "How many acres of soybeans did you plant?"
/ "Soybean planted acres" : 0..10000, RF
HAcres (202) "How many acres of soybeans did you harvest?"
/ "Soybean harvested acres": 0..10000, RF, DK
Yield (203) "What was your yield for soybeans?"
/ "Soybean crop yield" : 0..100, DK, RF
Production : 0..100000000, EMPTY
Note that in both BMaize.fld and BSoybean.fld the FieldNames are the same but that the FieldTag, FieldText, FieldDescription,
and FieldValue have all changed. For both field sections, the rules structure, as held in BCrop.Rls, is the same.
RULES
{Within block}
Label := Crop
Label.SHOW
PAcres
IF PAcres > 0 THEN
HAcres
CHECK
HAcres <= PAcres
"Harvested acres must be less than or equal to planted acres."
IF HAcres > 0 THEN
Yield
IF (Yield > 0) AND (Yield = RESPONSE) THEN
SIGNAL
Yield < UpperLimit
Production := Yield * HAcres
Production.SHOW
ENDIF
ENDIF
ENDIF
Methods 1 and 2 are two different ways of accomplishing almost the same thing. In the first, the block is more generalized but
there is less flexibility in handling of field-level metadata. In the second, the fields section is different between the two crops,
but the rules section is the same. One point is that there is a big payoff if you can specify in generalized terms to reduce the
amount of programming and maintenance. A second point is that there are many different ways you can be creative in Blaise in
order to cut down on the amount of specification, programming, and maintenance.
3. Specifying Variations on a Theme
Methods 1 and 2 above show different ways of adapting the same block structure to different situations. However, there can be
blocks with similar structure. It is possible to specify one block as a variation on an already-defined block. Consider the block
definition of BCrop above. This has fields PAcres, HAcres, Yield, and Production. A similar but larger block would have the
fields PAcres, HAcres, Yield, Unit, and Production, where Unit is needed for some crops because there are alternate units of
production (e.g., for Maize, tons versus bushels). Instead of specifying the whole blasted thing from scratch a second time, the
specification for the second block can be based on the first "insert Unit between Yield and Production" and then give additional
rules specifications that determine how to calculate the value of Production, based on yield and the unit given.
4. Super Blocks
For the two kinds of crops mentioned in 3 above, the only difference was that a field Unit was specified for one of the block
types. An alternative approach is to define one block type for all crops, but where the Unit field is not needed, just route around
it, with appropriate specification for computation of Production. This 'super block' will be more complex internally than either
alternative mentioned in 3 above. On the other hand, there is now less code to maintain. This method should not be used very
often.
5. Specifying in Terms of a Prototype
When there is a new and difficult data collection challenge, the best approach may be to construct several prototypes to see
what the possibilities are. This is an iterative process, but when you arrive at a solution, one method of specification is to say,
"program the table for topic X just like prototype 5". This will give your documentation people conniption fits, but they can
document from the prototype the same time the programmer is implementing your survey in Blaise.
6. Specifying Commonly Used Structures
It is possible that a measurement block can be used several or many times in a survey. For example, Frey (2000) discusses the
construction of 6 'time-spent' blocks that between them are used several thousand times in a data model. Each TimeSpent block
contains several fields that measure how long a person was doing something. If you have such a situation, it may be possible to
specify in the following way:
Exhaust "Were you exposed to exhaust fumes on your job?" : TYesNo
{IF Yes}
{Topic = Exhaust, Phrase1 = 'exhaust fumes'}
{Call TimeSpent1}
This way you can avoid having to repeat the specification of many fields and can be as efficient in specification as the
programmer can be in the source code. Caution, this is such a powerful method of specification that it is easy for the specifier
to define a much too large questionnaire without realizing it.
Appendix D: Data Export Possibilities
This appendix discusses the three options for data export, and advantages and disadvantages of each. It also mentions Open
Blaise Architecture that will give another option or options soon.
1. ASCII Export
ASCII export is suitable for small or medium sized data files of less than 32,000 characters in width. It produces one
rectangular flat file. The Manipula program that does the export is just a few lines of code that can be constructed in a few
minutes with a Manipula wizard in the developer's environment. The ASCII file description can be easily generated with
standard Cameleon setups for SAS or SPSS from the Blaise field-level metadata. On the other hand, this simplest and easiest
export method will not work for large data files. If there are arrayed fields (or arrayed blocks of fields), then Cameleon must
make the field names unique in the output description. It does this by truncating the field name to 5, 6, or 7 characters and adds
a number to the end (such as Phone1, Phone2). If the Blaise data model is large, or if its structure is not suited for flat file
export, then you'll need either to ASCIIRELATIONAL output or a custom output. If you use ASCII export for a highly
structured data model, you'll likely get a sparsely filled in data set. (Note, starting with version 4.5 of Blaise, there will not be
any limit to the ASCII record readout length. Version 4.5 has not been released at the time of writing this paper.)
A partial example of a downstream metadata description in SPSS for a small data model is given below.
TITLE
'NCS07'.
FILE HANDLE Ncs07
/NAME='Ncs07.ASC'
/LRECL=14380.
DATA LIST
FILE = Ncs07 /
Region
Stratum
SampleNu
1 3 7 -
2
6
10
596 606 618 -
605
617
618
. . .
PostCode
PhoneNum
KindHome
(A)
(A)
VAR LABELS
Region
Stratum
SampleNu
'Region'
'Stratum'
'Sample number'
PostCode
PhoneNum
KindHome
'Zip code'
'Phone number'
'Building type'
KindHome
1
2
3
4
5
. . .
. . .
VALUE LABELS
'Single family unit'
'Townhouse or duplex'
'Small apartment building'
'Large apartment building'
'Other kind of dwelling'/
2. ASCIIRELATIONAL Export
The Blaise ASCIIRELATIONAL export generates several or many ASCII files according to the pattern of embedded and
unembedded blocks in the data model. The EMBEDDED keyword, when used in a block declaration, means that Blaise will
store that block's data with those of its parent block. In ASCIIRELATIONAL export, every unembedded block's data will be
exported in a separate ASCII data file. The Manipula program that does this is simple; the only difference between this setup
and the one for ASCII export above is that the word ASCIIRELATIONAL is substituted for ASCII.
Generating metadata descriptions for each ASCIIRELATIONAL output file is more complex and more time consuming. The
idea is that a sub-data model has to be constructed for each unembedded block. Cameleon can in fact produce these sub-data
model definitions. Recent improvements to this process has automated this step (before, there was still considerable handwork
that had to be done in order to prepare (that is, compile) each sub-data model). Once each sub-data model is
prepared/compiled, then an SPSS or SAS Cameleon script has to be run on each. When that is done, then each output file will
have a metadata description. As mentioned, this whole process can now be automated, but for a very large data model, the
automated process can take well over an hour on a fast computer.
There are a few issues with ASCIIRELATIONAL export. There is a wide class of data models where ASCIIRELATIONAL
export more or less approximates a true relational representation of the data in a relational database sense, and thus this method
of export is suitable. However this is not always the case. In a relational database, there are entities and there is usually one
database table per entity. In a transportation survey, entities may include Household, Person, Work Place, Location, Day, and
Trip.
Let us consider the Person entity. It is possible, that for considerations of methodology and operability during data collection,
that person-level data are collected in several blocks, each of which is unembedded (which is proper). In this example, you can
have several export files that logically belong to one entity. In ASCIIRELATIONAL export for this data model, you have
several different export files for this entity. A conclusion that you should draw is that the database structure that is suitable for
data collection does not always have the same structure of the desired study database. When this is true, then the data model
specification and programming should anticipate this difference.
Another issue with ASCIIRELATIONAL export is the way that linking is done internally in the Blaise proprietary database.
Blaise uses downward pointers to link blocks, that is, the parent block points downwards to child blocks. This is not the way
that relational databases do their linking. So there has to be a translation step if the data are to be imported into a true relational
database. On the other hand, the method of Blaise linking may not make a difference if other downstream packages are used.
One way to handle linking when exporting data to a relational structure, is to explicitly declare links between blocks within the
data model, and use the data model's rules to assign appropriate (upward pointing) links to these fields within blocks. This is
true for hierarchical as well as many-to-many data relationships.
3. Custom Export
A custom-built Manipula setup can be used when the structure of the Blaise data model does not correspond well to that of the
output data files. This must be done on a block-by-block, or worse, on a field-by-field basis. For a data model of any size, the
instructions to handle this translation can number in the hundreds or thousands of lines. Such a program can be developed by
hand. This is the hard, prone to error, and is difficult to maintain. For example, if the data model definition changes, then
someone must adapt the hand-programmed export setup as well.
A better way to produce the required custom export programs in Manipula is to let Cameleon generate them, based on
metadata specification in the Blaise data model. This is what the National Agricultural Statistics Service does. As noted in
section VII, 4 above, this organization generates over 40 CATI and Interactive Editing Blaise instruments every quarter based
on a metadata specification. In addition to the generated instruments, the surrounding Manipula infrastructure for data import
and export is also generated, using Cameleon, based on the generated data models. This is a high-level advanced technique,
however it is worth considering where ASCIIRELATIONAL export does not suffice. See Pierzchala (1992) for details.
In order to enable this specialized technique, you have to consider how the field-level metadata should be stated, and someone
has to write a generalized Cameleon setup that can interpret the Blaise metadata, in turn producing the required custom
Manipula programs. If this is executed correctly, there are huge benefits. First, no one has to program huge Manipula setups.
Second, if the data model changes, you just re-execute the Cameleon scripts to re-generate the Manipula programs and you're
off and running. This is an example of letting the Blaise metadata drive the downstream processing. It is an enormously robust
method of operating.
4. ASCII representation of Don't Know and Refusal
Where DK or refusal is a permitted response, Blaise extends the permitted range of answers to allow for them. So if you have
five substantive answer categories (or a numeric range 1..5), Blaise will reserve code 8 for refusal and 9 for DK. If you have
specified 9 as the top limit for the substantive answers, Blaise will reserve 98 and 99. If you use, say, 1..120, it will reserve
998 and 999. So the DK and Refusal codes are always the final two digits of whatever range you specify. When exporting data,
the Cameleon generated data descriptions always take into account extended field length due to DK and RF specification. For
numeric questions, a common practice is to reduce the top number by 3 in order to avoid extended field lengths on output. For
example, if 10,000 is an upper limit, then for all practical purposes, you can specify 9,997 as the upper limit. If it is possible
that 9,997 will be exceeded, then it is possible that 10,000 would be too, and that the original specification is too low.
5. Open Blaise Architecture
A new capability called Open Blaise Architecture (OBA) will be released in version 4.5 sometime after the writing of this
paper. OBA will have a new option or options for data export. You should check on these options when that version is
released.
From DOS to Windows: Usability Issues for Interviewers
Diane Bushnell
Abstract
Social Survey Division (SSD) of the Office for National Statistics (ONS), UK employs approximately 700 interviewers at any
time. The interviewers use laptops and computer-assisted interviewing for the vast majority of data collection. Since the late
1980s we have been using the Blaise software as our questionnaire development and interviewing tool, and all interviewing
and support systems have been DOS based.
With the increasing use of Windows and Windows-based software, ONS are now at the stage of considering a move to the
Windows operating environment for interviewing. This paper looks at the issues around a move to Windows, in terms of its
usability by interviewers. It discusses new possibilities and constraints of using Windows-based software; interviewer views on
usability; and training options for interviewers.
Keywords : Usability; Windows; Interviewers; CAI
1. Introduction
The majority of surveys carried out by the Social Survey Division (SSD) of the Office for National Statistics (ONS) are
completed using computer-assisted interviewing (CAI). CAI, using Blaise software, was introduced for the Labour Force
Survey in 1990 and for the majority of its other surveys from 1994.
The Windows operating system has been the ONS office standard for some time but the systems used for carrying out surveys
remain DOS based for various reasons. A Windows version of Blaise, Blaise 4 Windows (B4W), has been available since the
beginning of 1999. It has now been thoroughly tested and is used for survey data collection in Europe and in the USA. For the
last few months we have been considering whether to move our interviewing systems to the Windows environment and if so,
which issues need to be addressed.
In considering an impending move, ONS carried out a brief review of the move from Blaise 2 to Blaise III. This revealed some
unanticipated problems at the time of the move, not particularly with the Blaise software, but mainly concerned with coordination of all the interviewing systems and with the amount of change occurring. Although we had thought that the
transition would have little effect on interviewers, as there were only minor changes in the Blaise interface, in fact they were
affected a great deal.
Two valuable lessons learnt from this exercise were that
•
the implications of change must be considered for the whole interviewing process and not just for the part which is
changing;
•
interviewers’ needs must be considered a high priority: the quality of our data is dependent on their ability to work
with the interviewing systems.
These two points appear repeatedly in research on usability of CAI systems. Rather than reinventing the wheel, we thought it
would be useful to work with usability guidelines and testing techniques when contemplating any further changes to
interviewing systems.
This paper reports on the early stages of an ongoing project to manage the introduction of Blaise 4 Windows in Social Survey
Division.
2. Why Move to Windows?
Over the last year, ONS has been evaluating the pros and cons of a move to the Windows environment for interviewing, and in
particular a move to Blaise 4 Windows. Upgrading to new software is often thought to be rather straightforward and not worth
worrying about. However, significant changes to software can sometimes lead to large costs in reprogramming and/or
retraining. Unless the benefits from an upgrade are substantial then there may be good reasons not to change: after all, if
something works why change it?
A paper presented at the 1998 International Blaise conference (Bushnell, 1998) discussed the costs and benefits of upgrading to
new CAI software and the tools and strategies which could be adopted to facilitate an upgrade, reviewing the move from Blaise
2 to Blaise III and looking forward to the move to B4W.
Blaise 2 to Blaise III
Several years ago, the team at Statistics Netherlands responsible for producing Blaise decided that Blaise should move to a
Windows environment but survey organisations using Blaise did not have the appropriate infrastructures for such a move.
Improvements to Blaise 2 were long awaited so the Blaise team developed Blaise III as an interim measure. Blaise III was
intended as a stepping stone to a Windows product: it is DOS based but was written so that it could be easily converted to
Windows and the ‘look and feel’ was very similar to Windows applications.
Although the costs of moving to Blaise III were fairly large (substantial changes had to be made to every CAI questionnaire),
the benefits were also large: the ability to build very large questionnaires, increased functionality in programming language,
improvements in dealing with data external to the interview (e.g. lookup tables or coding files), improvements in movement
through the questionnaire, new data formats for recording times, dates and verbatim responses to name a few.
Blaise III to B4W
A move to B4W would not net as many gains as the move to Blaise III, but the costs should be a lot lower. B4W and Blaise III
were designed so that programs and data are fully compatible between the versions: i.e. a questionnaire written in Blaise III
can be run in B4W and vice versa. The first version of B4W was intended to have exactly the same functionality as Blaise III
so that it could be released quickly. However, in the end, some new features were included: vastly improved multi-media
capabilities and a built in audit trail.
A move to the Windows operating system itself seems rather more problematic than the move to B4W. As well as considering
the CAI software, we must also consider the surrounding support systems, such as case management and transmission systems.
All our existing systems are DOS based and would need to be rewritten. In addition, the interviewers’ laptops would have to be
upgraded to cope with the increased demands of Windows applications.
The main costs and benefits of a move to B4W are summarised below.
Benefits
Costs
New features of B4W: the multi-media changes
1
would allow us to use Audio-CASI and the audit
Interviewers’ laptops must be upgraded or
replaced
trail would enable us to reconstruct lost or
damaged data
Improved developer’s environment:
Interviewing support systems must be rewritten
questionnaires can be written and tested more
easily and quickly than in Blaise III
Maintain or improve competitiveness in survey
Potential for data quality to be jeopardised while
research market
interviewers get used to new system
Interviewers must be trained in new interviewing
systems
Conclusions
Our first impression was that the benefits of upgrading to B4W were outweighed by the large costs involved. However, a
review of software looking at Year 2000 compliance revealed that one of the components of the interviewing support systems
would have to be rewritten. A decision was made to rewrite the system as a Windows application and so this meant that all the
support systems would also have to be rewritten for Windows. In addition, routine replacement of interviewers laptops was
already scheduled and these new laptops would have to be suitable for use with the new Windows support systems.
Since two of the major constraints on the B4W upgrade were effectively removed, and the cost of upgrading to B4W itself
would be minor compared to replacing laptops and rewriting support systems, a decision was made to move to B4W as soon as
practicable, subject to further evaluation of the impact on interviewers.
3. Usability
Couper (1994) notes the potential interviewers have to impact the data collection process but the minimal training they receive
in the computer hardware and software and the diversity of their computer skills and knowledge.
The interviewer should therefore be considered an important, if not the most important, user of a CAI system since they are our
primary link with the data source, the respondent.
In 1994, Couper proposed the idea of using research from the human-computer interaction field to evaluate CAI instruments.
Since then studies have been carried out on particular aspects of CAI questionnaires, both for interviewers in standard CAI
surveys and for respondents in self-administered survey instruments (e.g. Hansen, Fuchs & Couper, 1997; Hansen, Couper &
Fuchs, 1998; Caspar & Barker, 1999).
1
It is thought that the increased privacy resulting from the use of Audio-CASI (Audio computer-assisted self interviewing) can increase
reports of sensitive or socially undesirable behaviour. The respondent is able to listen to a recorded voice playing through headphones and
can enter responses directly into the laptop. Audio-CASI may also be used for populations with low levels of literacy where normal
computer-assisted self interviewing would not be feasible.
Definitions of the usability of a system include
•
“the focus of our attention turns from the system to the user. This means person-centred design rather than systemcentred design” (Couper, 1994)
•
The ability of users to “perform required use, operation service and supportive tasks with a minimum of stress and a
maximum of efficiency (Woodson, 1981)
•
“users can work with the application to easily and quickly achieve their goals” (Caspar and Barker, 1999)
•
“how easy or difficult it is for users to interact with their CAI instruments and systems” (Hansen, Fuchs, Couper,
1997).
Our aim is to ensure that the transition to B4W is as easy as possible for our interviewers, rather than to look at the usability of
Blaise as a CAI system. With that aim in mind, we have started to identify usability issues for a move to Windows and B4W;
we will ask interviewers what usability means to them and we will use usability testing techniques to evaluate alternative ways
of working, screen designs or training methods. In Sections 4 and 5, I will outline some of the work we have done to date. In
Section 6, I discuss work planned for the coming months.
4. Usability Issues for a Move to Windows
Issues to consider when moving to Blaise 4 Windows fall naturally into two components: those issues arising from a change to
a Windows environment and those particular to B4W.
Windows specific issues
1.
Mouse or keyboard
One of the principal considerations for a move to Windows is whether interviewers should use a mouse for moving around the
questionnaire or whether they should continue to use the keyboard, as in DOS-based applications.
The Windows environment is based primarily on using some type of pointing device, such as a mouse or trackball. Although
key combinations can be used to achieve the same result, they are often very cumbersome and not always easy to discover. It is
fairly obvious that using a mouse whilst interviewing will not be particularly easy: the interviewer may be holding the
computer on his/her lap or on the arm of a chair so there may be no suitable place to use a mouse. Interviewers work in a wide
variety of household situations where they have little control over the environment. In poor lighting conditions the interviewers
may have trouble locating the cursor on the screen: in this case a trackball will be no better than a mouse.
Ultimately, the interviewer is only interested in interviewing and recording the answer given by the respondent and does not
want to be distracted by searching for the cursor or trying to minimise or move windows about the screen. We have decided,
since there are no clear advantages to using a mouse, that interviewers will continue to use key presses for moving around the
questionnaire and accessing Blaise functions.
2.
Ability to easily swap to other Windows applications
Although it may be useful for interviewers to have access to wordprocessing packages or email, the drawbacks are many. The
ability to swap applications may also lead to accidental swapping out of the CAI software. For maximum gain from working
with Windows, we would need to train interviewers to cope with opening, closing and swapping windows, recovering from an
accidentally closed window and so on. This would greatly increase training costs. Moreover, it does not seem desirable to train
interviewers to recover from problems caused by the software which have nothing to do with the interviewing process: it seems
to detract from their task of interviewing.
3.
Ease of loading new software
Software loaded by interviewers onto laptops could cause all sorts of problems with viruses or simply with incompatibility of
applications. It would make the task of resolving queries from interviewers more difficult if we do not know the exact
configuration of their laptops and software. Some survey organisations in Europe permit interviewers to load personal software
onto their laptops as long as it is checked by headquarters staff first. In ONS, this is simply not an option: we would not be
willing or able to find resource for checking interviewers’ software. We also need to know that all the interviewers are using
the same methods for collecting and coding the data: we do not want interviewers to experiment with alternative applications.
4.
Consistency of screen design and functionality across applications
Consistency across Windows applications can be very useful for everyday computer users. However, CAI software has a very
particular purpose and specialised users. Interviewers are not likely to have access to other Windows software, especially if we
decide to limit access on interviewing laptops, and so it is of little importance whether B4W looks and behaves similarly to
other applications.
5.
Ability to customise worktop, e.g. change colours, fonts, add icons etc.
The flexibility of Windows and the ease with which users may customise their workspace allows users to feel they have some
control over their environment, and with respect to usability in general, is a desirable property of most software. However, we
must remember that the aim of interviewing is for all respondents to receive a standardised interview. If each interview has a
different look and feel to their questionnaire then interviews may no longer be standardised.
Changes to the font size may cause problems with questions ‘falling off’ the bottom of the screen so that the interviewer misses
part of the question, instructions or response list or the font may be so small that it is difficult to read in some situations.
Changing colours may mean that some parts of the screen cannot be seen properly or that parts of the question are
unintentionally highlighted (or not highlighted when they are supposed to be).
So, it appears that the usual advantages associated with using Windows applications are not particularly relevant when using
CAI software, and in some instances, these ‘advantages’ may actually be a disadvantage.
B4W specific issues
1.
Consistency of key mapping
Generally, ONS’s policy is to use the defaults provided by Blaise wherever possible unless there is a very good reason not to
(e.g. in the move from Blaise 2 to Blaise III the default action attached to the function key F2 changed from <Save Data to
disk> to <Delete case> – we decided there was serious danger of interviewers (or developers) deleting data if we used the new
key mapping so we reverted back to the original). Blaise provides the possibility for questionnaire developers to change the
defaults for function keys, menus, screen layout and some navigational functions but this can be a rather time consuming job.
There is also scope for the introduction of errors if these changes are not passed on to the interviewer correctly. In order to take
advantage of some of the flexibility in Blaise but to ensure consistency over all surveys, standard settings and configurations
are provided for both developers and interviewers (Manners, 1998).
A continuation of our policy of using defaults will mean that interviewers will have to be trained in the new function keys and
navigational behaviour, for no particularly good reason, other than that it is easier for questionnaire developers. Consistency
over time is interrupted and may result in a brief increase in errors made by interviewers.
Another drawback of using the Windows compatible functionality is that it is more complicated than the previous DOS
behaviour. The keystrokes are more complex, nearly all requiring two key presses, e.g. Ctrl-S, instead of using a single
function key, e.g. F2. Interviewers are also required to act more often than in Blaise III, that is, in Blaise III they may only
have to press Enter to accept the default choice whereas in B4W they often have to use press one or more keys. This drawback
seems to imply that the usability of the software will decrease rather than increase.
2.
Screen layout and design
B4W allows more flexibility with using colours and fonts for question text, instructions and so on, than Blaise III. Within the
Blaise application, restrictions can be imposed so that only questionnaire developers may make changes and not interviewers:
this ensures consistency across all the interviews but allows us to take advantage of improved screen layouts and designs. The
default font size in B4W is rather small so it is very likely that we will pick a larger, more legible font. We are also likely to
allow some use of different colours to distinguish between different parts of the screen, e.g. interviewer instructions, question
text and so on. Any changes to fonts or colours will be standard across all surveys and questionnaire developers will not be
permitted to add their own customisations without making a specific case. We do not want interviewers to be bombarded with
lurid screen designs nor to be confused about what particular colours signify.
We have found, when introducing colour for some telephone unit interviewers, that there can be problems with certain colour
combinations, either inducing headaches or migraines or with people who are colour blind. We therefore plan to test some
colour schemes before making a final decision. We may be able to allow interviewers to select from a small choice of colour
schemes, but the disadvantage of this is that developers would have to check their questionnaire in all the schemes to make
sure that questions were appearing as intended.
5. What Does Usability Mean to Interviewers?
Brown (1988) comments “One of the most useful design philosophies for developing user-oriented human-computer interfaces
considers the computer system simply as a tool to aid the user in performing tasks”. Usability, by definition, is all about usercentred design. It seems sensible, therefore, to ask the interviewers, the users of the CAI systems, what usability means to
them.
To get some initial ideas, I consulted a group of five interviewers with varying degrees of expertise in interviewing and in
computing. After an initial introduction, I asked the interviewers:
•
What are the goals you are aiming to achieve?
•
What will enable you to reach those goals easily and efficiently?
•
What can be done in the move to B4W which will make life easier?
•
How should any training for the move be carried out?
The Goal of Interviewing
Interviewers considered their goals were:
•
to collect accurate information, quickly and easily AND
•
to transfer information accurately and quickly into the Blaise questionnaire.
As well as interviewing, ONS interviewers also complete some work at home: they may complete coding (e.g. of occupation
and industry); enter paper diaries (e.g. travel diaries for all members of the household); complete administrative details (e.g.
the outcome of the call, number and timing of calls to the household); or submit pay claims.
Therefore, it is important to consider the work done by interviewers at home as well as interviewing completed in the
household.
What Enables Interviewers to Reach Their Goal Easily and Efficiently?
The most important issue for the interviewers was that rapport should be maintained with respondents throughout the
interview. Anything which detracted from concentrating on the interview was undesirable. Interviewers felt that
•
the software should not demand so much attention that eye contact was restricted
•
movement around the questionnaire should be straightforward and fast
•
it should be relatively difficult to delete data (either at questions or whole interviews)
•
there should be a clear differentiation between question text (which is read to respondents) and interviewers
instructions
•
it should not be possible to switch the laptop off by mistake (this followed from a problem with a particular make of
laptop)
•
there should be a clear reason why questions are asked (sometimes questions are apparently replicated and
interviewers are confused by this)
•
there should be more training in the laptop systems (e.g. using modems, case management systems) rather than a
concentration on the questionnaire
•
training instructions and help desk replies should be in plain English, without making assumptions of interviewers
experience or knowledge of computers
•
function keys should be the same in all the laptop systems (e.g. the mechanism for making a note should be the
same in the questionnaire as in the case management or pay claim systems)
Moving to Blaise 4 Windows
The interviewers discussed a variety of issues under this heading. The two issues generating most discussion follow were:
a. Function keys
One of the main decisions to be made in moving to B4W concerned the mapping of functions, such as adding interviewer notes
to the data file. Since using a mouse or pointing device of some sort has been ruled out for the moment (see Section 4) the
interviewers must continue using function keys or key combinations for a variety of situations. I asked the interviewers
whether they would prefer to keep the key functions the same as they are now in Blaise III; move to the new B4W defaults
which are Windows compatible; move to a new system especially devised to be as consistent and logical as possible; or move
to a menu-based system.
My hypothesis was that the interviewers would prefer as little change as possible. In practice, the interviewers thought that the
existing key functions were not particularly easy to remember or use and were not especially attached to them. The majority
liked the idea of a menu-based system, which they had some experience of from the case management system. They thought
menus would be particularly useful for working at home: they would not have to remember every function – only the ones used
most often in interviewing.
Most of the interviewers were also keen on moving to Windows-based function keys. They thought that the office should keep
up with progress rather than staying with the past.
The interviewers’ reactions were somewhat surprising, although the explanations they gave for choosing these options were
very logical. Without actually consulting the interviewers, we may have ruled out these options without trying them. We will
test the practicalities of these options later in the year.
b. Screen customisation
Some of the interviewers thought that it would be useful to use colours more in designing screens. They thought it would
enable distinctions to be made more easily between question text, interviewer instructions, question help and so on. None of
the interviewers were particularly interested in customising their own colour combinations and could see that this might cause
problems.
Interviewer Training
Options available for B4W training are:
•
personal training
•
home study
•
no training.
Personal training could be presented by headquarters staff or by local field managers. Home study could comprise video or
audio presentations, an on-line tutorial, comprehensive paper notes, short notes on basic changes or some combination or these
options.
Personal training is a very expensive option, especially when carried out at headquarters (HQ) office in London. The time
spent producing, presenting and receiving the training, as well as interviewers’ travelling costs and time must be paid for.
Local training by field managers would reduce some costs but would also require that field managers receive extra training.
This could result in variation in the training received by interviewers, depending on the extent to which the field managers are
able to master the training themselves, and on their abilities to train others in computing issues. The advantage of personal
training, of course, is that each interviewer is guaranteed to receive a standardised training package and that they will complete
the training. There is a possibility with home study that interviewers may stop part way through or miss some sections. With
personal training, the trainers can cater for all levels of expertise and can ensure that any interviewers with problems are
followed up.
Home study is much cheaper: time will be spent preparing the training and interviewers will be paid study time but there are no
costs of travelling or subsistence. However, with home study it is more difficult to get the right message across and to cater for
individual needs; it is not possible to see where interviewers are getting stuck and, as mentioned above, interviewers may not
complete the training programme. On the plus side, apart from costs, interviewers can proceed at their own pace and at their
own convenience.
A combination of personal and home study may be the best option: interviewers could complete some home study and be
assessed by field managers or by completing a ‘test’ questionnaire, interviewers requiring further training could receive extra
tutorials. However, this is also likely to be the most expensive option and as such, the least feasible.
The option of providing no formal training at all is, on the face of it, the cheapest option of all. Interviewers could be sent some
training cases for the surveys they are currently working on and left to figure out the changes on their own. However, this
could lead to interviewers losing confidence in the interviewing system and in their own ability to conduct a high quality
interview. In the worst case, it could lead to interviewers making mistakes in data capture and therefore to a decrease in data
quality: these are costs we would not be prepared to disregard.
When asked which training presentation they thought would work best all the interviewers preferred home study. Their
preferences for training methods were:
•
video training – although this could prove fairly expensive one interviewer had the idea that each local field
manager could receive a video and arrange to loan the tape to individual interviewers in his/her area. S/he could
then find out how they had got on with the training and any problems they were having
•
on-line tutorial – a tutorial could be written in Blaise itself and presented on the laptop
•
brief notes outlining the basic changes, combined with a template which they could carry around with them,
perhaps followed later by more sophisticated instructions once the basics were mastered.
6. The Next Stage: Usability Testing
In the next few months we will be consulting more interviewers about usability, talking to field management staff and carrying
out some experiments to test various ideas.
Windows
In Section 4 above, I discussed the various issues surrounding the use of Windows for interviewing. Our initial reaction is that
the safest way forward is to restrict access to Windows as much as possible. There are all sorts of aspects to the Windows
environment which are likely to cause interviewers problems and which we feel would detract from the interviewers task.
Ideally, we would like to replace the Windows default shell (desktop) with our own interface so that when the interviewers
switch on their they will go straight to the case management system. We will switch off access to a pointing device and prevent
interviewers closing or minimising windows.
In future years we would like to incorporate access to wordprocessing software or other windows options into the case
management shell so that the interviewers can use some Windows applications but under controlled conditions.
Blaise 4 Windows
We plan to carry out some usability trials based on comments made by the interviewers: we will compare different colours and
font sizes in the screen design and look at whether choosing from menus can be used during the interview and at home.
We will need to check that the decisions made on function keys, fonts etc. made for B4W are also carried through in the
surrounding laptop systems, such as the case management system.
When decisions have been made on the various options, standard configuration files will be constructed and these will be used
by all questionnaire developers to ensure consistency for all interviewers and surveys.
Interviewer Training
In the next few months we hope to carry out an experiment to compare different training methods and materials with small
groups of interviewers. Depending on the resources available we would like to compare groups receiving
•
No training, and
•
Basic training – template of function keys; short note on changes
against one or more of the following
•
On-line tutorial
•
Audio tutorial
•
Video training package.
After completing the training at home, the interviewers would complete a mock interview (via audio or video tape or over the
telephone, as yet undecided) and the resulting interview would be transmitted back to the office. B4W has the facility to allow
an audit trail of the interview so that the keystrokes and functions that are used by the interviewer can be recorded and
analysed. The length of the interview and time spent in various sections of the interview or using certain functions can be
examined; also whether particular functions were used and how successful interviewers were in using them. The outcome
measures proposed by Shneiderman (1992) may be used.
Ideally, these interviewers would then be invited to headquarters so that they could complete some more interviewers and be
examined in person, or even videoed so that further analysis could be completed later and interviews compared.
By comparing interviewers who receive no training, basic training and some more complex training package we can evaluate
the outcomes against costs and ask interviewers which methods they prefer. We may find that interviewers are able to pick up
on changes to the software with no training at all but that it has an impact on confidence or that interviewers receiving
advanced training show no difference in outcomes from those receiving basic training (at much less cost).
7. Summary
Despite applying usability principles and guidelines on rather a modest scale in comparison to some other organisations, ONS
has already found them to provide a valuable framework for evaluating the move from a DOS to Windows based environment
for interviewing.
In the next few months, we will proceed with our evaluation and carry out some small scale usability trials. We hope also to
expand our testing to include the whole interviewing system, rather than just B4W. It is of little relevance to interviewers to
know that they are using three or four different software applications in order to complete their interviewing task: they are
simply using a laptop and software to carry out an interview and enter data.
It is our task to make the interviewing process as easy as possible for interviewers: we hope to achieve that task by continuing
to be guided by usability principles.
References
Brown, C (1988) Human-Computer Interface Design Guidelines. Norwood, NJ: Ablex Publishing Corporation
Bushnell, D (1998) A View on Blaise 4 Windows. Presented at the International Blaise Users’ Conference, Norway 1998,
Published in the International Blaise User Group Newsletter, Vol. 12, May 1999, 22-27
Caspar, R A & Barker, P (1999) Usability Testing for Self-Administered Survey Instruments: Conversion of the National
Household Survey on Drug Abuse as a Case Study. In Proceedings of the Third International ASC Conference, Association for
Survey Computing (at press).
Couper, M P (1994) What Can CAI Learn from HCI? Discussion paper presented at the COPAFS Seminar on New
Directions in Statistical Methodology, June 1994.
Dumas, J & Redish, J (1993) A practical guide to usability testing. Norwood, NJ: Ablex Publishing Corporation
Hansen, S E, Fuchs, M, Couper M P (1997) CAI instrument Usability Testing. Presented at the annual meeting of the
American Association of Public Opinion Research, Norfolk, VA May 1997
Hansen, S E, Couper, M P, Fuchs, M (1998) Usability Evaluation of the NHIS Instrument. Presented at the annual meeting
of the American Association of Public Opinion Research, St. Louis, MO, May 1998
Manners, T (1998) Using Blaise in a survey organisation where the researchers write the Blaise datamodels. In Proceedings of
the International Blaise Users’ Conference, Norway 1998.
Shneiderman, B (1992) Designing the User Interface: Strategies for Effective Human-Computer Interaction (2nd ed.) Reading,
MA: Addison-Wesley
Woodson, W E (1981) Human Factors Design Handbook: Information and Guidelines for the Design of Systems, Facilities,
Equipment, and Products for Human Use. New York: McGraw-Hill, 1981
About the Author
Diane Bushnell is responsible for a small team of researchers, survey computing specialists and field managers working on
CAI methodology and quality issues in Social Survey Division (SSD) of the Office for National Statistics (ONS). She has
worked mainly in survey methodology over the last ten years and has recently become the project manager for the UK
National Travel Survey. Her areas of particular expertise are occupation and industry coding, computer-assisted coding,
computer-assisted interviewing applications (especially Blaise) and data analysis. She can be contacted at ONS, D1/23, 1
Drummond Gate, London SW1V 2QQ, UK; Tel. 020 7533 5378; Fax. 020 7533 5300; email. [email protected]
Statistics Netherlands
Division Research and Development
Department of Statistical Methods
P.O.Box 4000
2270 JM Voorburg
The Netherlands
The TADEQ Project, State of Affairs
Jelke Bethlehem and Anco Hundepool
Project number:
BPA number:
Date:
Remarks:
The views expressed in this paper are those of the author and do not necessarily reflect the policies of
Statistics Netherlands.
RSM-RSM
24 March 2000
THE TADEQ PROJECT, STATE OF AFFAIRS
Summary: National Statistical Institutes, research institutes, and commercial
marketing research organisations are more and more using computerassisted interviewing (CAI) systems for collecting survey data. The growing
possibilities of computer hardware and software have made it possible to
develop very large, and complex electronic questionnaires. Unfortunately, it
also has become more and more difficult for developers, interviewers,
supervisors, and managers to keep control of the content and structure of CAI
instruments. The TADEQ Project aims at developing a tool to make a
readable and understandable documentation of an electronic questionnaire.
This contribution presents an short overview of the project, and describes the
current state of affairs.
Keywords: Electronic questionnaires, Documentation, XML
1. Introduction
National Statistical Institutes, research institutes, and commercial marketing
research organisations are more and more using computer-assisted interviewing
(CAI) systems for collecting survey data. They replace paper questionnaires by a
computer program that guides respondents through the questionnaire and checks the
answers on the spot. The growing possibilities of computer hardware and software
have made it possible to develop very large, and complex electronic questionnaires.
Unfortunately, it also has become more and more difficult for developers,
interviewers, supervisors, and managers to keep control of the content and structure
of CAI instruments.
The TADEQ Project aims at developing a tool to make a readable and
understandable presentation of an electronic questionnaire. TADEQ stands for Tool
for the Analysis and Documentation of Electronic Questionnaires. It is a Fourth
Framework Research Project of the European Union. Institutes from five different
countries co-operate in this project: Statistics Netherlands, the Technical University
of Vienna (Austria), the Office for National Statistics (UK), Statistics Finland, and
the Instituto Nacional de Estatística (Portugal).
TADEQ will be an open tool. It will offer facilities to create interfaces to various
computer assisted interviewing systems. However, the focus is on Blaise. The open
approach requires a neutral way to describe how an electronic questionnaire is
executed. For this purpose the Questionnaire Documentation Language (QDL) has
been developed. It is based on XML.
The documentation tool must be able to produce human-readable documentation
both in paper and electronic form. On the one hand, this tool must be able to show
1
the global structure of the questionnaire, and on the other, it must provide means to
focus on the details of parts of the questionnaire. A particular challenge of the
TADEQ project is to display the routing graph of large and complex questionnaires.
Due to the limited size of a sheet of paper and a computer screen, this is not a simple
task. It must be accomplished without affecting the readability, so a lot of attention
must be paid to layout issues.
Questionnaire documentation will be used by different people involved in the survey
process. Examples are the questionnaire developer, who wants to document his
work, the survey manager who has to give a formal approval for carrying out the
survey, and the interviewers, who want paper documentation of the questionnaire to
help them in the preparation and execution of their fieldwork. Different users mean
different formats of the questionnaire documentation. So, a proposed documentation
tool must be flexible. Users of this tool must have some control on adjusting the
documentation. Research must be used to show what is required by whom.
The TADEQ project aims at developing a documentation tool that is at least capable
of generating two types of documentation. In the first place, there will be textual
documentation. It focuses on giving detailed information on all questionnaire objects
(questions, checks, computations, etc). Routing information will be taken care of by
attaching a condition to each questionnaire object. The questionnaire object will
only be executed in situations in which the conditions are satisfied. A good example
of this approach is the BAD system developed by the Office for National Statistics in
the United Kingdom, see Andersen (1997).
The second type of documentation to be produced by TADEQ is a representation of
the routing structure in graphical format. This type of documentation focuses more
on the routing structure, and less on the details of the questionnaire objects. A
limited amount of textual information can be displayed in the graph. Depending on
the CAI system used, there is a choice: question identification names/numbers,
question text (possibly in different languages), specification of the type of accepted
answers, etc. The available amount of space in the graph is too limited to display all
this information. Moreover it might affect readability. Therefore, a documentation
tool must provide means to select the information shown, and possibly also means to
display information in different ways, e.g. adjacent to the graph.
Some more information about the TADEQ project can be found in Bethlehem
(1999).
2. The Questionnaire Documentation Language
To be able to describe what can happen during the execution of an electronic
questionnaire, it is important to distinguish the different types of events that may
occur and the conditions under which they occur. Examples of events are:
•
Asking a question;
2
•
Checking a relationship;
•
Carrying out a computation.
The conditions under which these events happen are defined in the routing structure
of the questionnaire. Depending on the type of computer assisted interviewing
system, two approaches can be observed:
•
GOTO oriented routing. These routing structures can either be unconditional (if
attached to the answers to closed questions) or conditional (if attached to the
outcome of logical expression). An example of such a CAI system is CASES.
•
IF-THEN-ELSE oriented routing. This is more structural approach. The execution
of blocks of questions depends on the value of a logical expression. An example
of such a CAI system is Blaise.
The Questionnaire Definition Language (QDL) must be capable to cope with all
possible events and routing structures. QDL is based on XML (Extended Markup
Language). XML can be seen as the future successor of HTML, the language that is
used to make web sites. HTML has the disadvantage that it is a mix of describing
structure and layout. Moreover, the language is not extensible. XML is much more
powerful. Users can define their own language elements, and structure is separated
from layout. It is becoming more and more clear that XML is not only a powerful
language for designing web sites, but that it is also very useful for defining the
structure of data files. See also Boumphrey et al. (1998), or Morrison et al. (2000).
The XML language allows for the definition of the different events one might
encounter in the execution of an electronic questionnaire. In QDL such events are
called questionnaire object. Examples of questionnaire object are questions (various
types), checks, computations, route instructions, sub-questionnaires, etc. Each object
has a number of attributes, like a question text (for questions), logical expressions
(for route instructions and checks), and arithmetical expressions (for computations).
TADEQ expects the questionnaire definition to be in QDL format. Because QDL is an
XML application, the information can be processed in various ways. One way is to
make use of an XML parser offered by Microsoft. This parser comes for free with
the Internet Explorer 5.0 browser. It is a DLL-file (called MSXML.DLL), which can
be used in a C++, Delphi, or Visual Basic program.
For textual documentation, another way is to make use of style sheets. They offer a
means of defining layout for an XML document. One way of doing this is using XSL
(Extended Stylesheet Language). The advantage of a style sheet is that it is fairly
simple for users to define their own layout formats. However, style sheets have their
limitations. The approach of creating a dedicated layout module using the XML
parser offers more possibilities. TADEQ will only offer some basic examples of XSL
style sheets. Of course, users can always create their own XSL style sheets.
To illustrate how TADEQ works, we will use a simple example of a Blaise
questionnaire. The data model for this example is presented in figure 2.1. It contains
a number of nested IF-statements and a check.
3
Figure 2.1. The Blaise data model
DATAMODEL Commuter "The Commuting Survey"
FIELDS
Sex
Age
MarStat
"What is your sex?": (Male, Female)
"What is your age?": 0..120
"What is your marital status?":
(NeverMar "Never married",
Married "Married",
Divorced "Divorced",
Widowed "Widowed")
Work
"Do you have a paid job?": (Yes, No)
DistWork
"What is the distance to work?": 0..300
TypeWork
"What type of work do you have?": string[40]
LookWork
"Are you looking for a job?": (Yes, No)
School
"Are you still going to school?": (Yes, No)
DistSchool "What is the distance to school?": 0..300
Activity
"What is your main activity?": string[40]
RULES
Sex Age MarStat
IF Age < 15 THEN
School
IF School = Yes THEN
DistSchool
ELSE
Activity
ENDIF
MarStat = NeverMar
ELSE
Work
IF Work = No THEN
LookWork
ELSE
TypeWork DistWork
ENDIF
ENDIF
ENDMODEL
To be able to process the metadata, TADEQ must translate the data model into QDL.
It should be realised that QDL not meant to mimic the Blaise language or the
authoring language of any other CAI system. The objective of QDL to describe what
can happen during the execution of an electronic questionnaire. So it is a description
of the events that can happen and the conditions under which they can happen.
The basic building block of QDL is the Questionnaire Object. Examples of
Questionnaire Objects are question objects (various types), navigation objects (IFTHEN-ELSE, GOTO, Loop), computation objects, check objects, etc.
Figure 2.2 contains an example of a question object. It is a closed question with two
possible answers. Each Questionnaire Object has a unique name and sequence
number. In this example there is only one question text, but QDL allows for more
than one. The attribute max of the <closed> tag indicates how many answers are
allowed. For each possible answer the specification contains an <item> tag. Note the
use of CDATA to specify plain text. This prevents special symbols in the text to be
interpreted as XML tags.
4
Figure 2.2. A question object in QDL
<qobject number="1" name="Sex">
<question>
<text><![CDATA[What is your sex?]]></text>
<closed max="1">
<item code="1" name="Male">
<text><![CDATA[Male]]></text>
</item>
<item code="2" name="Female">
<text><![CDATA[Female]]></text>
</item>
</closed>
<status><![CDATA[ask]]></status>
</question>
</qobject>
Figure 2.3 shows how an IF-THEN-ELSE structure is specified in QDL. Such a
structure is identified by means of a <split> tag. The logical expression to be
evaluated can be found between the <condition> tags. If the expression turns out
to be true, part of the questionnaire between the <if_true> tags is executed, and if it
is false, the part between the <if_false> tags is carried out. Note that a <text> tag
will be included after the <condition> tag if an explanatory text is added to the
condition.
Figure 2.3. An IF-THEN-ELSE structure in QDL.
<qobject number="4" name="Condition">
<split>
<condition><![CDATA[Age < 15]]></condition>
<if_true>
<qobject number="5" name="School">
<question>
. . .
</question>
</qobject>
. . .
</if_true>
<if_false>
<qobject number="10" name="Work">
<question>
. . .
</question>
</qobject>
. . .
</if_false>
</split>
</qobject>
A final example of a QDL object is the check specified in figure 2.4. The attribute
type of the <check> tag indicates whether this a hard check or a soft check (signal).
Although this example does not show it, a list of involved questions can be included
in the specification. Also an explanatory text can be included.
5
Figure 2.4. A check in QDL
<qobject number="9" name="Check">
<check type="hard">
<condition><![CDATA[MarStat = NeverMar]]></condition>
</check>
</qobject>
The questionnaire specification in QDL forms the input for TADEQ. The
subsequent sections describe what TADEQ can do with this input.
3. The architecture of TADEQ
TADEQ must be able to produce textual and graphical documentation both in
electronic and paper form. Starting point always is the electronic version of the
documentation. The users can interactively set display and layout settings, and fold
or unfold sub-questionnaires. If they are satisfied with the result, they can instruct
the program to print the documentation. Figure 3.1 below summarises the current
architecture of TADEQ prototype.
Figure 3.1. The architecture of the TADEQ prototype
Blaise system
Other CAI system
BMI file
XML file
TADEQ
Text
Tree view
Graph
TADEQ accepts two types of input:
•
A Blaise metadata file. For the Blaise system, there is a direct link between
TADEQ and Blaise. TADEQ is able to read a Blaise metadata file (a so-called
BMI file). Internally, TADEQ converts the BMI file into a QDL file using the
Blaise API.
•
A questionnaire specification in the form of a QDL document. This is an XML
document satisfying the syntax rules specified in the TADEQ Data Type
Definition (DTD).
The second type of input will serve all CAI packages, with the exception of Blaise. It
means that for all these packages a conversion tool must be offered capable of
6
transforming the dedicated questionnaire definition format into an QDL document.
This will be the responsibility of the developers of these packages.
Whatever the source of the information (Blaise or another CAI package), TADEQ
will store the information always in an XML-document. Consequently, all parts of
TADEQ producing output are able to read XML.
Microsoft has made available a DLL containing routines for parsing and processing
XML files. The name of this file is MSXML.DLL, and it is available for free in the
Internet Explorer Version 5 environment. This DLL can be used in a C++, Delphi,
Visual Basic, Java, or Java Script program. TADEQ has been written in C++.
After reading in a QDL file, or reading a Blaise BMI file and transforming it into an
QDL file, TADEQ will present the information on the screen in the form of a tree.
See the left hand side of figure 3.2 for an example.
Figure 3.2. TADEQ screen with the questionnaire tree
Each questionnaire object is represented by a small icon and a name. The various
branches of the execution tree are indicated by means of indentation. Sub-branches
may be collapsed (i.e. closed so that they are temporarily invisible) or expanded (i.e.
opened so that the become visible). The tree can be used to navigate through the
questionnaire, expand or collapse branches, and focus on specific parts of the
questionnaire.
For the right hand side of the screen, the user can make a choice between two
alternatives. The first one is object information panel. This panel displays all details
of the object which has the focus in the tree on the left hand side. The right hand side
7
of figure 3.2 shows the information displayed for the question object MarStat. All
tag and attribute texts of the question object can be found by scrolling through the
panel.
An alternative for the right hand side of the screen is the complete questionnaire
documentation panel. A choice for this panel will produce complete questionnaire
documentation in HTML format. See the right hand side of figure 3.3 for an
example.
Figure 3.3. TADEQ screen with HTML documentation
The user can scroll through this panel to see other parts of the document. If a
questionnaire object contains a reference to another questionnaire object, the user
can jump to that object by means of hypertext links.
Each object description starts with a list of conditions under which it will be
executed. For example, the question School in figure 3.3 is only asked of people of
age less than 15.
TADEQ has numerous display options. The tool supports multilingual questionnaire,
so one can set the language of the documentation. It is also possible to set a filter
controlling the type of object to be displayed (question, check, computation, etc).
Another option allows the user to see only the last condition leading to the current
object, or to display the complete list of conditions from the start of the
questionnaire leading to this object.
The HTML documentation can be saved in a file for later use, like e.g. printing. The
layout of the documentation is determined by a Cascading Style Sheet (CSS). By
editing the CSS file, the user can change the appearance of the information in the
files (font, font size, font colour, etc).
8
The HTML output of TADEQ can be read by MS Word. Once available in this word
processor, the information can be easily turned into printable documentation. Note
that MS Word sees object names as section headings. This allows for the creation of
a table of contents with one mouse click.
To get more insight in the routing structure of the questionnaire, TADEQ can
generate graphical output. For this it makes a call to a graph drawing routine
(QDRAW). This routine uses the QDL file for input. Figure 3.4 shows an example of
such a graph.
Figure 3.4. TADEQ screen with graphical output
The rectangle denotes a question. The hexagonal shape represents an IF-THEN-ELSE
object where the left branch is followed if the condition is true and the right one if
the condition is false. The oval shape denotes a check object.
The user will have a choice for displaying two types of information:
•
A more technical and compact representation uses question names and
mathematical expressions in the flowchart symbols;
•
A more non-technical and readable representation will use question texts and
explanatory texts in the flowchart symbols.
Like in the tree view, one can by simple clicking collapse or expand branches in this
flow chart.
For this simple example, the graph fits on the screen. For larger questionnaires one
can scroll through the graph. The small navigation in the upper left corner of the
screen gives the user the possibility to quickly move to a different part of the graph.
9
The graph can be printed. Since the size of a sheet of paper is finite, printing poses
special problems. Algorithms will be implemented in TADEQ to divide the graph
over a number of sheets in a neat way, without cutting too many lines. Also, special
reference symbols will be included, so that users can quickly find the spot on
another sheet where a specific line is continued.
4. Future developments
TADEQ is still in development. One of the things that will be added is a number of
analysis functions. With these functions one can obtain more insight in the structure
of the routing. Several types of functions are considered.
There will be basic statistics, like frequencies of occurrence of the various types of
questionnaire objects. Also, there probably will be statistics on the (weighted or
unweighted) lengths of the various paths through the questionnaire. If the weight is
the expected time to ask and answer a question, this may provide information about
expected duration of interviews, and the variation in interviewing length.
More thorough analysis is possible if information is available on the frequencies
with which questionnaire objects are encountered in interviews. Such information
can be generated in two ways: (1) before the field work starts by randomly
generating interview data that satisfy the routing conditions, and (2) after the
fieldwork has been completed by processing the data file. Research is been carried
out whether it is possible in a simple way to include such information in the QDL
file. It implies every questionnaire will get an extra <freq> tag. It is probably not
too difficult to fill the this tag for question objects, but more interesting analysis can
be carried out if this tag can be filled for the decision objects (IF-THEN-ELSE,
GOTO).
Another interesting function could be to evaluate all expressions encountered on a
path through the questionnaire. This gives information about the characteristics of
persons following this path. And it may even turn out that no one will be able to
follow this path, because conditions contradict one another. Thus, this type of
information would help to develop more balanced questionnaires. Unfortunately,
this asks for developing a complete expression evaluator, which comes more or less
down to re-building Blaise. One may wonder whether this is worth the effort.
Another complication is that some expressions are impossible to evaluate because
information is required that is not available at the time of testing (like values from
external files).
Another the analyse the routing structure could be to reduce questionnaire tree to
only those objects that play a role in routing decisions. This would result in only
displaying the decision objects and the questions determining the value of the
routing conditions.
10
5. References
Anderson, S. (1997), Automated Paper Documentation of Blaise III. Actes de la 4e
Conférence Internationale des Utilisateurs de BLAISE, INSEE, Paris, pp. 120.
Bethlehem, J.G. (1999): The Routing Structure of Questionnaires. Proceedings of
the Third ASC International Conference, Association of Survey Computing,
Chesham, United Kingdom, pp. 405-418.
Boumphrey, F., Direnzo, O., Duckett, J, Graf, J., Hollander, D., Houle, P., Jenkins,
T., Jones, P., Kingsley-Hughes, A., Kingsley-Hughes, K., McQueen, C., and
Mohr, S. (1998): XML Applications. Wrox Press, Birmingham, UK.
Morrison, M., Boumphrey, F. and Brownell, D. (2000): XML Unleashed. Sams
Publishing, Indianapols, USA.
11
Papers Submitted but not Presented
Displaying a Complete Call History to Interviewers
Linda Anderson, Iowa State University
Central and Local Survey Administration through communicating data systems
Philippe Meunier, Insee
Displaying a Complete Call History to Interviewers
Linda L. Anderson
Statistical Laboratory, Iowa State University
Introduction
Interviewers and supervisors at the Iowa State University Statistical Laboratory prefer to have a complete call history
available before dialing, particularly in studies where respondents are difficult to find and tracking of phone numbers is
necessary. Although it is possible to display the dial results from CatiMana on the dial menu, only the results from the first
call and the last four calls are available. For difficult studies, a paper Record of Calls is often kept so that all call attempts
can be viewed, rather than using the autoscheduler available with Blaise.
In an effort to provide interviewers with a complete call history, two approaches to this problem were explored. The first
reads the history (.~th) file into a Blaise external file. This approach is not ideal because the external file can be updated
only periodically, and information from the most recent dial attempts is not available to the interviewer. The second
approach makes the call history part of the main data model, updating it after each dial. Both approaches display the call
history for the case, together with details of the last appointment (from CatiMana) and other information in the appointment
block, on one of the first infopanes.
In this paper, the two approaches are described. Details on programming statements are outlined to facilitate
implementation.
Dial screen and call history screen
So that interviewers will view the history screen before dialing, Questionnaire was left as the only dial result option on the
dial menu. After viewing the information on the dial screen, an interviewer enters the questionnaire, views the information
on the call history screen, then moves to the introductory screen. Information displayed on the dial screen includes
completion status of the interview, telephone, case ID, name, address, some personal information, and a possible comment
from supervisors or interviewers. On the history screen (Figure 1), information displayed includes general information (case
ID, name of respondent, address, and telephone number), appointment information (appointment type and time, with whom
the interviewer spoke, and remarks), and the call history (date and time, who called, and dial result, starting with most recent
dial). At the introductory screen, interviewers can choose one of the dial results, which are available as parallel blocks in tab
format.
Figure 1. Call history screen (HistLook).
External file approach
Since the history (.~th) file, containing the complete call history, was already available, the first approach was to read it into
an external file. Normally, these data may be viewed in the Blaise history viewer sorted by interviewer or date, but not by
case. Reading it into an external file makes it possible to view all history records relating to a case when a form is opened.
The case ID, DialDate, DialTime, CallNumber, DialNumber, WhoPhoned, and DialResult fields from the history (~.th) file
are read into the external file. Case ID, CallNumber, and DialNumber make up the primary key for the external file.
DialDate and DialTime are the secondary key. The SEARCH and READ external file methods are used to find all records
relating to a case.
A Blaise external file must have the Intranetware file properties of read-only and sharable. To update this file the read-only
property must be changed to read-write and changed back after the ascii file is read in. If this is attempted while interviewers
are working, the Blaise external file becomes unreadable. The history file must be updated while interviewers are not
working (probably between shifts), and all dial attempts made during a shift will not be shown to the interviewers during
that shift. This process could be put on a scheduler to run late at night, but during interviewing times it is not feasible
because there is no set time for a shift to end.
Data model approach
The second approach of including all call history data as part of the data model ensures that the call history is always up-todate and eliminates the read-in process. The data structure used for this is a nested array. In Blaise, a call is usually the set of
all dial attempts made in one day. The block BDial stores information from the most recent dial attempt in fields
DialNumber, WhoMade, DialTime, and DialResult. The block BCall stores information from all dials in one call, using the
field DialStore, a nine-dimensional array of BDial. Finally, the field CallStore stores information from all calls as a 25dimensional array of BCall.
This information is obtained from the Blaise CATI block CatiMana, which stores the results of the last four calls and the
first call in the array CatiMana.CatiCall.RegsCalls. The most recent dial attempt information is in
CatiMana.CatiCall.RegsCalls[1], which is overwritten on the next dial attempt in the same call.
Each new dial result must be stored in the proper instance of BDial within the proper instance of BCall. To prevent
overwriting an instance of BDial which contains data from a previous dial, data are written to that instance only if the
DialNumber field of BDial is empty or if it is equal to CatiMana.CatiCall.RegsCalls[1].NrOfDials. If DialNumber is empty,
then nothing has been written in that instance of BDial. If DialNumber is equal to
CatiMana.CatiCall.RegsCalls[1].NrOfDials, then the information in that instance of BDial is a busy dial, which by itself
does not constitute a dial. A set number of busy dials constitute one dial. If one busy dial is made, and the next dial is no
answer, the no answer dial will have the same dial number as the busy dial and will overwrite the busy dial. The fields
WhoMade, DialTime, and DialResult within the block BDial are assigned the corresponding values from
CatiMana.CatiCall.RegsCalls[1]. The DialNumber field is assigned the value of
CatiMana.CatiCall.RegsCalls[1].NrOfDials after the other fields are written.
Similarly, the CallNumber field in BCall prevents writing current dial results to an instance of BCall which contains data
from a previous call. CallNumber stores the value CatiMana.CatiCall.NrOfCall. If CallNumber is not empty and it is less
than CatiMana.CatiCall.NrOfCall, then that instance of BCall contains results from a previous call. The import parameter
Sgnl in BDial is set to 0 for all nine elements of DialStore in that instance of BCall to prevent writing current dial results. If
CallNumber is empty or it equals CatiMana.CatiCall.NrOfCall, then that signifies that either this is the first dial of a new
call or it is another dial of the current call. The import parameter Sgnl in BDial is set to 1, allowing it to write the new dial
information in the first empty instance of BDial for the current call. CallNumber is then set to CatiMana.CatiCall.NrOfCall.
The following statements from the RULES section of BDial illustrate how DialNumber and the parameter Sgnl determine
whether information will be written to an instance of BDial. The KEEP method (WhoMade.KEEP) saves information that is
already stored in a field. DialNumber.KEEP makes that information available for use in the following IF statement.
Information will be written if this instance of BDial pertains to the current dial of the current call.
RULES
DialNumber.KEEP
IF ((DialNumber <> EMPTY) AND
(DialNumber < CatiMana.CatiCall.RegsCalls[1].NrOfDials)) OR (Sgnl = 0) THEN
WhoMade.KEEP
DialDate.KEEP
DialTime.KEEP
DialResult.KEEP
ELSEIF Sgnl = 1 THEN
WhoMade := CatiMana.CatiCall.RegsCalls[1].WhoMade
DialDate := FirstDay +(CatiMana.CatiCall.RegsCalls[1].DayNumber) +(-1)
{*** to prevent empty time field showing as 12:00 AM ****}
IF CatiMana.CatiCall.RegsCalls[1].DialTime <> EMPTY THEN
DialTime := CatiMana.CatiCall.RegsCalls[1].DialTime
ELSE DialTime := EMPTY
ENDIF
DialResult := ORD(CatiMana.CatiCall.RegsCalls[1].DialResult)
DialNumber := CatiMana.CatiCall.RegsCalls[1].NrOfDials
ENDIF
In the block BCall, a FOR..DO loop uses the statement DialStore[I].KEEP(0) to set the parameter Sgnl to 0 for all instances
of BDial in a previous call. For the current call, looping from 1 to the current NrOfDials sets the parameter Sgnl to 1,
allowing information to be written. The statements above prevent overwriting previous dials in the current call.
BLOCK BCall
LOCALS I : INTEGER
FIELDS
CallNumber : 1..25
DialStore : ARRAY[1..9] OF BDial
AUXFIELDS
NrOfDials : 1..9
RULES
CallNumber.KEEP
IF (CallNumber <> EMPTY) AND (CallNumber < CatiMana.CatiCall.NrOfCall) THEN
FOR I:= 1 TO 9 DO
DialStore[I].KEEP(0) {**** prevent writing in previous call****}
ENDDO
ELSEIF (CallNumber = EMPTY) OR (CallNumber = CatiMana.CatiCall.NrOfCall) THEN
IF CatiMana.CatiCall.RegsCalls[1].NrOfDials > 0 THEN
NrOfDials := CatiMana.CatiCall.RegsCalls[1].NrOfDials
FOR I := 1 TO NrOfDials DO
DialStore[I](1)
ENDDO
CallNumber := CatiMana.CatiCall.NrOfCall
ENDIF
ENDIF
ENDBLOCK
Displaying call history information on infopane
To represent the values for the enumerated field DialResult (from the external file) and AppointType and DayOfWeek
(from CatiMana) as text on the infopane, three VAR arrays were created, with a text value for each element of the array
assigned in the RULES section. The numerical value of the field, returned by the ORD function, was used as the index of
the array to assign the proper text value.
For example, ApptFill is one of the VAR arrays. There are four possible values for AppointType, so ApptFill has four
elements, each of which is assigned a text value. If the code for AppointType = 2, it is stored temporarily in the auxfield
ApptType as ‘Date and Time:’. This is illustrated in the following statements.
VAR
DialRFill : ARRAY[0..8] OF STRING[17]
ApptFill : ARRAY[1..4] OF STRING[30]
DayFill : ARRAY[1..7] OF STRING[9]
RULES
ApptFill[1] := 'No Preference'
ApptFill[2] := 'Date and time:'
ApptFill[3] := 'Period:'
ApptFill[4] := 'Day of week:'
ApptType := ' ' + ApptFill[(ORD(CatiMana.CatiAppoint.AppointType))]
All information is combined in temporary string auxfields, which are inserted as fill in the text of the auxfield HistLook.
ApptType, ApptTime, and Days are auxfields holding information from CatiMana.CatiAppoint. Info is an array with one
instance for each call number. Nested FOR..DO loops concatenate information from each dial within a call into one instance
of the array, with line breaks between each dial.
FOR C := 1 TO CatiMana.CatiCall.NrOfCall DO
Info[C] := ''
FOR D := 1 TO 9 DO
IF HistKeep.CallStore[C].DialStore[D].DialTime <> EMPTY THEN
Info[C] := '@B' + DATETOSTR(HistKeep.CallStore[C].DialStore[D].DialDate)
+ '@B' + '@|' + TIMETOSTR(HistKeep.CallStore[C].DialStore[D].DialTime)
+ '@|@|' + HistKeep.CallStore[C].DialStore[D].WhoMade + '@|' +
DialRFill[ORD(HistKeep.CallStore[C].DialStore[D].DialResult)] +
'@/ ' + Info[C]
ENDIF
ENDDO
ENDDO
Each instance of the array is then used as fill in the text of the auxfield HistLook, starting with the last or most recent dial,
and is displayed on the infopane for HistLook.
Conclusion
Interviewers and supervisors believe they are better prepared to make a call when they have the complete call history of a
case. It is helpful to know, for example, that a large number of no answer dials have been made, or that more than one
appointment has been made in the past, or that none or few dial attempts have been made. Comments from interviewers on
the external file approach have been very positive. The call history has given them the security of understanding the context
of each call, which increases both their comfort level and their ability to handle the case appropriately.
So far, only the external file method has been put into use. When a case with a hard appointment comes up fifteen minutes
after the scheduled time, it is useful to know that it was tried at the scheduled time and it was busy. With the external file
method, that information will not be available. We plan to put the data model method into use so that the freshly updated
information can be viewed by interviewers.
Acknowledgements
I would like to thank Mark Pierzchala of Westat for his suggestion of making the call history part of the main data model
and Jim O’Reilly of Westat for suggesting a method of presenting the value of an enumerated field as a string. Thanks also
to Dianne Anderson, Jan Larson, Allison Tyler, and Karen Fliehler for their comments and for help in testing the software
and to Sarah Nusser for her comments.
CENTRAL
AND
LOCAL
SURVEY
COMMUNICATING DATA SYSTEMS
ADMINISTRATION
THROUGH
SUMMARY
Like any new data processing system, CAPI, which is used for household surveys at INSEE (Institut National de la
Statistique et des Etudes Economiques - the French national institute of statistics and economic studies), has
significantly changed the work of the various people involved: survey designers, survey administrators and
interviewers.
The purpose of this contribution is to present INSEE's reflections regarding the organisation of the work of
survey administrators following the reduction in data cleaning tasks linked to the introduction of CAPI. It
involved evaluating the possibility of centralising data cleaning at the national level.
Some 150 administrators are employed in INSEE's 18 regional offices (RO) in Metropolitan France who manage a
network of household interviewers (the 2 overseas regional offices have a specific organisation of their own). Their
task is to organise the collection of data, manage the interviewers and clean the data collected at the questionnaire
level.
The two main advantages of CAPI, compared to a questionnaire in hard-copy form, are data capture and
verifications at source (on the interviewer's laptop).
The staff who were previously responsible for these two functions in the regional offices have either seen their
activity disappear as far as data capture is concerned, or in relation to checking the data collected have seen a
significant change in their work.
As the checking process now mainly takes place at the level of interviewers, the survey administrators' task relating
to checking and correcting data from the questionnaires – data cleaning - has become extremely limited.
In the case of the administrators employed in the regional offices, data cleaning using CAPI consists in checking the
data on the questionnaires collected from the households by the interviewers and correcting the data, where
necessary. Each statistician-survey designer defines the checks to be carried out for his survey. They may be
carried out mainly by means of:
- non-blocking checks confirmed at the time of collection;
- supplementary checks carried out on the administrator's workstation (with a different data model than the one on
the collection device);
- "don't knows" or "refusals to answer";
- average interview time;
- the interviewers' comments attached to the questions, or a general comment attached to the questionnaire.
In the case of certain surveys, a second-level data cleaning, carried out by the statistician who designed the survey,
is implemented in respect of certain questionnaires selected on the basis of predefined criteria. A third variant of the
data model may be necessary if the checks are different from the ones to be used by the administrators.
Thus INSEE's first idea was to centralise this work at the national level (or in some regional offices), which would
only consist of dealing with complex problems that had not been resolved by the checks on the interviewer's laptop.
This work would necessitate a limited number of specialised staff. This organisation was expected to engender
operational savings and improvements in quality (due to the skill of the personnel and the increased uniformity of
the processing). The survey administrators in the regional offices would have at their disposal statistical tables for
each interviewer for monitoring the collection and the quality (number of questionnaires answered, refusals to
answer, questionnaires out of scope,...; average number of inconsistency messages ignored and unanswered
questions, ...; average interview time, ...). They would not have access to the questionnaires, which would be
transmitted directly to the national centre by the interviewer.
The heads of the regional household survey departments and statisticians-designers were consulted about this
proposed new organisation of the work.
The results of this consultation revealed that the survey administrators' two main tasks - monitoring /evaluating the
interviewers and checking data - were closely intermingled: data cleaning is an indissociable component of
monitoring the interviewers' work. Through data cleaning, the administrator evaluates and checks the quality of the
collection work. The administrator can then authorize the payment of the questionnaire.
The consultation showed that nationally centralised data clean would not spare regional administrators the
necessity of checking some questionnaires, and would in fact lead to the duplication of work that is often closely
1
related: the opening and analysis of questionnaires, at the national level for the checking and possible correction of
data, and at the regional level for monitoring the interviewer's work (particularly by means of accompanying
interviewers during the survey and by a posteriori checking with the interviewees, by post or telephone). If the
administrators could not have access to the questionnaires, then a system for returning information to them would
be necessary, and this would be complex and expensive. Lastly, the administrator's access to the questionnaires
and his knowledge of the interviewer's errors is an essential part of human resource management. The interviewer
knows his administrator, who is nearby (thus precluding administration at national level) and he goes to that
administrator for support and advice. The administrator therefore needs to be in a position to monitor and know
about the whole of his work. INSEE took the view that this was essential for preserving and enhancing the quality of
data collection by its network of 850 interviewers.
XXX
The results of the study are set out below. These present firstly the problems raised if nationally centralised data
cleaning is implemented in place of the current decentralised system divided between the regional offices. The
second section compares the two systems, and shows that centralised data cleaning cannot be brought into general
use for all types of surveys.
The plan used is as follows:
I. - THE PROBLEMS RAISED BY CENTRALISED ORGANISATION OF DATA CLEANING
1. - 1 The need for the regional collection offices (RO) to be able to consult and keep all the questionnaires
1.- 2. The needs for return of information from the data cleaning centre to the collection RO
1.-3. Contacts between the data cleaning centre and interviewers for data cleaning purposes
1. - 4. Contacts between the data cleaning centre and the collection RO
11 - COMPARISON OF THE TWO DATA CLEANING SYSTEMS: CENTRALISED OR DECENTRALISED
II. - 1. Data cleaning as a factor of monitoring the quality
II- 2. Data cleaning at the heart of survey management tasks
II - 3. Quality of the checking and correction of the data collected
II - 4. Diversified organisation of data cleaning depending on the survey concerned
2
I. - THE PROBLEMS RAISED BY CENTRALISED ORGANISATION OF DATA
CLEANING
I. - 1. THE POSSIBILITY FOR THE COLLECTION RO TO CONSULT AND KEEP THE
QUESTIONNAIRES
It seems essential for the questionnaires to be transferred to the collection RO, and kept there, in parallel with their
transmission to the data cleaning centre, to ensure that the interviewers' work is monitored and for getting them
to correct their errors during the survey - as soon as possible after the start of data collection. It is necessary for the
questionnaires to be available in the collection RO to enable interviewers to be accompanied and the a posteriori
checks to be carried out. It should be noted that organisation of a centralised data cleaning process would preclude
the collection RO from modifying the questionnaires.
IT development work necessary would remain limited, and would be directed towards sequential transmission, with
the collection RO receiving the questionnaires several hours after the site RO. Transmission after data cleaning is
excluded, which although it would reduce the burden on the circuits would nonetheless result in the loss of a
significant factor by preventing the RO from having the questionnaires as soon as they were transmitted by the
interviewers.
I - 1.1. The quality indicators, necessary for pinpointing the questionnaires that need to be checked, might not
eliminate the need to consult questionnaires for more detailed analysis. Moreover, the RO should be able to
read any comments attached to the questions and the general comment, which generally denote a problem. The
comments system in CAPI must be used fully by the interviewers. Its aim is to inform the administrators of their
difficulties and their choices, for monitoring and data cleaning purposes.
In the "Assets" survey, the reason for a particular interviewer's short average interview time was explained, after his
questionnaires were opened, by the fact that he was conducting his interviewing in HLM (social housing), where
there were few positive replies regarding the holding of financial assets. In the "Journeys" survey (regional and
paper-based, not in CAPI) an indicator of the mobility rate appeared low in the case of one interviewer in
comparison with the average: after consulting the questionnaires, it emerged that a large proportion of retired
people with a lower mobility rate than the average of the population, lived in this district. An indicator of a quantity of
"don't knows" in reply to important questions makes it essential to consult the questionnaires, as does a quantity of
non-blocking ignored checks.
A widespread custom in the regional survey departments - often on the instruction of the statistician-designer - is to
analyse each interviewer's first three questionnaires, which he has to transmit rapidly, except where applicable in
the case of recurrent surveys. This method is used to ascertain that the training has been assimilated and to correct
any errors very quickly, particularly in the case of interviewers who have shown difficulties during the training. This
analysis is the (or a) determining factor for deciding which interviewers to accompany at the beginning of the data
collection. The experiences derived from actual cases will be kept for use in future training programmes (in the case
of periodic surveys).
I 1.2. The availability of the questionnaires in the collection RO is also important for its relations with the
interviewers. The interviewers need to know that they can obtain advice there. They may need to discuss certain
questionnaires or certain problems encountered, over and above the comments procedure. More generally, it is
important for the interviewers to know that their collection RO receives the product of their work. It is the ROs that
manage them and supervise them. This consideration also has to be taken into account by the administrators.
I.1.3. In an organisation with a centralised data cleaning process, we have shown the need for the RO to be able
to consult the questionnaires. But they would not be able to modify them - a task that would be carried out by
the national centre(s).
Many of the people consulted think that this separation of the tasks is a factor of demotivation for the administrators
in the regional survey departments. Opening the questionnaires, possibly spotting errors in them without being able
to correct them themselves can be frustrating and may finally discourage them from consulting them. Moreover, the
discovery of errors in the questionnaires should be notified to the national data cleaning centre.
In fact we are faced with what may appear to be duplication: the collection RO and the national data cleaning centre
will each open questionnaires that raise problems, the former for monitoring the interviewers, and the latter for the
3
possible correction of data. One person consulted has devised a substantial range of monitoring and quality
indicators to preclude the collection RO from opening the questionnaires. But would not this amount to installing a
parallel system, using up equivalent resources?
Another suggestion is to consider that the consultation of questionnaires is different in character: general in the
case of the collection RO, and highly targeted (on the variables to be checked) in the case of the national centre.
I. - 2 RETURN OF INFORMATION FROM THE DATA CLEANING CENTRE TO THE
COLLECTION RO
I. - 2.1. The return of information is considered to be just as essential as the transmission of the
questionnaires and for the same reasons, which relate to monitoring the interviewers' work and quality. It
must comply with strict management rules establishing regular returns, especially at the start of collection, to enable
reaction with the interviewers. The accumulation of knowledge resulting from the data cleaning will also be used for
subsequent training programmes: in the case of the "Employment" survey, the collection ROs use lists of anomalies
from the previous year (imprecise profession, incorrect adress of the firm, etc.) for the current year's training
programmes. The administrators rely on cases encountered during data cleaning. One RO estimates that a quarter
of the training time is devoted to examining and correcting errors committed the previous year.
This return of information might be done in the form of standardised detailed tables, each having a single objective
(rate of data cleaning per interviewer, questions raising problems, etc.) and enabling comparison with other external
data (e.g. division of the population by sex). But if the information is subtle, the administrative workload would be
heavy for the national centre. Lastly, the fact that the RO would only have the original of the questionnaires (before
any modifications made in the course of the data cleaning process) may be a disadvantage, for example for a
posteriori checks.
The definition of these specifications would be a difficult task (the quality monitoring indicators would certainly have
a subjective component), as would the IT developments necessary. The data transfer circuits would be encumbered
by these returns to the RO, especially if there are several national data cleaning centres.
Lastly it would also be necessary to take into account in the RO's workload, the transmission to the national centre
of errors that the RO have discovered during the consultation of the questionnaires, since they will not have been
able to modify them.
The notion of data cleaning shared between the national centre and the collection RO, for example by having easier
cases processed locally and complex cases by the centre, has not been envisaged. Apart from the difficulty of
assessing the nature and importance of each of the cases, the complexity of the IT circuits to be implemented
would rule this idea out altogether.
I. - 2.2. It should also be possible to standardise the necessary, final information return phase to the
interviewers to a certain extent. The present situation differs from one RO to another. Some publish tables
detailing each interviewer's errors. Further, the centralised organisation of the data cleaning process and the
necessary return of information to the local centre would lead to increased saturation of the circuit from national
centre - via collection RO – to interviewer, and this problem would have to be solved.
I.- 3. CONTACTS BETWEEN THE NATIONAL DATA CLEANING CENTRE AND THE
INTERVIEWERS FOR DATA CLEANING PURPOSES
The consultations reveal that direct dealings between the national centre and the interviewers would be
detrimental to the smooth running of the survey network, which is based on the unique relationship
between the collection RO and the interviewer.
The collection RO should be the interviewer's one and only contact for relationship-related reasons on the one
hand, and for reasons of organisation and efficiency of the work, on the other hand.
I. - 3.1 ASPECTS CONCERNING CONTACTS WITH THE INTERVIEWERS
It is essential that it is the individuals who have usual direct personal contacts with the interviewers who get in touch
with them for the needs of data cleaning, in other words the person in charge of the survey or their direct
4
administrator, that is the unit that manages them. An interviewer can only receive instructions from someone near,
that he knows. At present problems with interviewers result from lack of proximity. And proximity procures better
quality.
Only the collection RO can ensure that requests for information are accepted by the interviewers, since the RO
knows them, it trained them and it pays them. It is their immediate superior. Not to abide by this principle would
represent a risk for quality, by weakening the team spirit built up between the collection RO and its interviewers.
There is a strong psychological component in the relationship with the interviewers. It is necessary to know how to
talk to them, to know their character and personality so as to avoid upsetting them. The national centre would
simply look like a controller, and receiving criticism from such a person would be a bad experience for the
interviewer. He would also be disconcerted by these two levels of administration and would wonder by whom and
how his work is to be judged.
Moreover, direct contacts by the national centre with the household are not considered desirable. It has to
be the interviewer who calls the household because they know each other already and relationships of trust have
been established. Otherwise, it would have to be the RO to which the interviewer was attached, because the
national centre is distant and can engender suspicions on the part of the household. Moreover, the interviewer as
well as the collection RO would be bypassed.
I. - 3.2. ORGANISATION AND EFFICIENCY OF THE WORK IN THE NATIONAL CENTRE AND IN THE
COLLECTION RO
Independently of the reasons set out above, direct contacts by the national centre with the interviewers would result
in the national centre achieving lower productivity in its work of collecting information from the interviewers than the
collection RO achieve:
- as the centre does not know the interviewer, it would have greater difficulty in obtaining satisfactory
replies;
- it does not know the interviewer's timetable, hence when he can be contacted - the RO already have
difficulty in contacting their own interviewers;
- as interviewers often work on several surveys at a time, they would experience an increase in the number
of people contacting them that they would not know;
- the answers to the questions asked of the interviewer might perhaps have been obtainable from the
collection RO.
The interviewers' relationships with the collection RO would also be distorted, thus damaging the quality of their joint
work: on the one hand, the RO would lose their "power" over the interviewers, while on the other hand, the
interviewers would tend to consider the national centre as their only contact.
The interviewers would accordingly be naturally prompted to build up a single relationship, as was seen in the RO
when they applied directly to the RO's computer services department for loading the applications: they stopped
visiting the survey department. The collection RO would then run the risk of having no return of information. It would
have no knowledge of conversations between the interviewer and the national centre, and would no longer be able
to monitor the interviewer correctly.
I.- 4. RELATIONSHIP BETWEEN THE NATIONAL DATA CLEANING CENTRE AND THE
COLLECTION RO
We have just seen the negative consequences of possible direct dealings between the national centre and the
interviewers. Unless it is decided that data cleaning must be done solely in the office, in other words autonomously
within the national centre, the centre will have to obtain the necessary information from the collection RO - we have
already seen the disadvantages of direct contacts with the interviewers, or even the households - , with the RO
having the task of contacting the interviewer (or the household) where necessary.
The consultation has shown that such relationships would be complex, posing the question of the benefit
procured by centralised organisation of data cleaning, and that they would run the risk of rapidly ROying
up, culminating in fact in data cleaning in the office at the national centre.
The data cleaning process in CAPI is significantly reduced in comparison with traditional data cleaning, because the
checks are integrated into the collection procedure. However, while the problems posed at the time of data cleaning
are few, they are more complex. The national centre will have to find the relevant contact in the RO, who will not
always be available (absent, part time, busy, etc.).
5
II - COMPARISON OF THE TWO DATA CLEANING SYSTEMS, CENTRALISED OR
DECENTRALISED
As has been already pointed out in the previous section, the tasks grouped together under the word "data
cleaning» have two functions: on the one hand to check and correct the data; and on the other hand, to
monitor, evaluate and correct the work of the interviewers. These two functions are aimed at a single
objective, quality.
The monitoring of interviewers can only be done at the level of the collection RO, because it calls into play human
relationships that call for reciprocal knowledge and proximity. This point has also been referred to above.
With centralised data cleaning, the national centre provides for the first function alone, sometimes with recourse to
the collection RO. The regional office provides the second function, if there is a return of information.
It seems that we end up with an alternative: time saving versus quality. Indeed, in order to guarantee quality, the RO
must be able to consult the questionnaires and exploit returns of information. In other words virtually do data
cleaning work.
But data cleaning can be organised in more than one way and be adapted to the particular features of each survey,
while at the same time an arrangement can be set in place that is as simple as possible, for reasons of rationality, in
particular concerning IT developments and maintenance.
II. - 1. DATA CLEANING AS A FACTOR OF QUALITY MONITORING
For the collection RO, consulting the questionnaires pinpointed by the monitoring table indicators and comments, in
fact boils down - at least in part - to carrying out a data cleaning task, except that they cannot modify the
questionnaires. This work would continue during the exploitation of the returns of information in the case of
centralised data cleaning.
In CAPI traditional data cleaning is reduced. But at the level of the collection RO, good interviewer monitoring
necessitates consultation of the comments and confirmed checks, which will also be used as part of the content of
subsequent training programmes (periodic surveys). Data cleaning enables malfunctions to be spotted in the course
of collection so that the interviewers can then correct them. "One becomes aware of the quality of the interviewers
when one cleans data ". When an interviewer is being accompanied by an administrator from the survey
department (for the purpose of advice and evaluation), the administrator already has an impression of the
interviewer's work, which he has been able to evaluate during the data cleaning process.
II. - 2. DATA CLEANING AT THE HEART OF SURVEY MANAGEMENT TASKS
Data cleaning is the last phase in the process of preparation, carrying out and monitoring a survey entrusted to an
administrator. This process is a comprehensive whole which makes it possible to follow a survey operation from A
to Z, right up to the supply of the data files to the designer. For the administrator, centralised data cleaning
would represent an amputation of part of his work, which would mean that he would no longer be able to clearly
appreciate the whole picture, and which would dispossess him, deprive him of responsibility and demotivate him.
The reduction of the data cleaning tasks linked to CAPI might lead to increased diversity of the administrators'
tasks, which would be enriching and in the long run beneficial for the RO. Conversely, centralised organisation
would be like assembly line work, with repetitiveness of tasks - especially in the case of ongoing surveys.
So far as training programmes in data cleaning are concerned, centralisation would reduce the costs of this.
However, should one not take the view that training for a survey is a whole, and that data cleaning aspects answer
questions that all the survey's administrators need to know, for advising and monitoring the interviewers?
II. - 3 QUALITY OF THE CHECKING AND CORRECTION OF THE DATA COLLECTED
Some of the people consulted consider that, in the case of those surveys that are still in the form of paper
questionnaires, decentralised data cleaning outside CAPI in the various RO (for most surveys), results in
disparity in the quality of corrections, and in saying this they are not calling into question the competence of the
6
personnel concerned. Centralised data cleaning would guarantee uniformity of processing, and would perhaps
ensure a more rigorous follow-up of the data cleaning instructions. It should concern only difficult cases: significant
number of inconsistency messages ignored, where a variable far exceeds the relevant threshold (e.g. rent > FRF
10,000), etc. Such cases might call for a very specialised skill, which all the RO might not have for all types of
surveys.
Conversely, data cleaning in CAPI automatically imposes a strong uniformity of processing, hence fewer
discrepancies in quality between the RO. On the other hand, a higher ranking administrator would be needed for
supervising the work of the RO, for example the statistician-designer or a specialised RO, who oversees several
hunROeds of questionnaires during the collection process (e.g. looking at how the RO processed the "don't knows"
during data cleaning).
The section relating to the consultation of questionnaires by the RO (§I.-1) has shown by means of examples, the
importance of proximity for better monitoring of the interviewer's work. This also applies to data cleaning as such. In
a survey on household living conditions, where an interviewer has collected data on attacks and thefts incorrectly and even if he appeared reliable when accompanied on the survey - this is only likely to be discovered by the local
administrators, because they know the district where the interviewer operates. Likewise in the case of data relating
to rent.
In return, the RO should pass on any problems of correction they have encountered to the designer, so that
everyone benefits from the experiences of cases already dealt with.
II. - 4. DIVERSIFIED ORGANISATION OF DATA CLEANING DEPENDING ON THE SURVEY
CONCERNED
Beyond the general views on data cleaning presented above, the consultations with certain survey designers have
highlighted differing opinions, which can be explained by the particular characteristics of their surveys.
This leads to the concept of different data cleaning arrangements depending on the survey concerned.
In the opinion of the designers of the "Household assets" surveys and ongoing surveys of living conditions, the data
cleaning process should be done at local RO level.
The designer of the "Rents and charges" survey is in favour of centralised data cleaning. His reasons seemed
linked to the specific characteristics of that survey:
- Depending on the regional office concerned, the survey is run either by the survey department or by the
prices department, which have different constraints. This leads to lack of uniformity in data cleaning which
would be eliminated with centralisation.
- The deadlines are short, linked to the production of the rents - and prices - index every three months,
leaving no time to go back to the interviewer to inform him of his errors, at least for the survey wave in
question. The interviewer takes the comments into account for the following quarters. Occasional telephone
calls are made by the administrators to ask for details. Moreover centralised data cleaning would
undoubtedly save time, a fundamental aspect for the designer concerned.
- The (quarterly) survey takes place over one month, with 300 interviewers. Half of the interviewers have
fewer than twenty questionnaires. Hence the monitoring is only done on a small number of
questionnaires. It should be noted that provision would be made for consultation of the questionnaires by
the RO.
- In small regional offices there is only one administrator for the survey, on account of the small number of
questionnaires and the light workload that each represents. This poses the problem of the minimum staff
and workload required.
- Lastly, data cleaning is humdrum work, of less interest to administrators than, for example, the ongoing
survey of living conditions, part of which is different each quarter. Moreover, after the interviewers' CAPI
apprenticeship period (rent bill posts), they will do very little data cleaning, and the designer will take charge
of it.
XXXXXXX
7