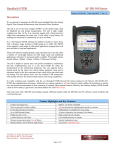
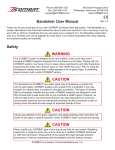
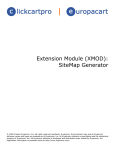
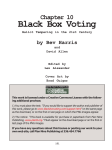
1
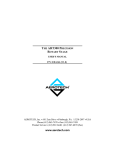
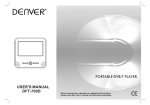
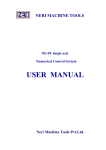
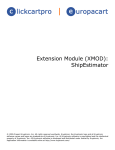
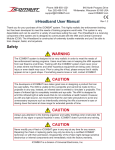
DR-500 Series Handheld OTDR PC Software User Manual Reflect.exe © 2010 Advanced Fiber Solutions, Inc. All rights reserved. 19 Norfolk Ave * Easton * MA * USA * 02375 - Phone: 508.238.7100 * Fax: 617.507.0784 1 Table of Contents I 1. Software • Software Installation • Functional Description • Trace Screen 2. Menu & Icon Tool bar • File Menu • Measurement Menu • Mode Menu • Compare and Trace Menu • Zoom Menu • Setup Menu • Utilities Menu • Windows Menu • Help Menu • Markers Icon 3. Trace • Trace • Parameter Panel • Measurement Parameter Properties Window 4. Taking a Measurement 5. Measurement Modes • 2PT Attenuation Mode • LSA Attenuation Mode • Splice Loss Mode • Reflective Coefficient Mode • Optical Return Loss 6. Refractive Index 7. Auto Trace Analysis 8. Events Table • Events Tab • Section Tab • Event Move © 2010 Advanced Fiber Solutions, Inc. All rights reserved. 19 Norfolk Ave * Easton * MA * USA * 02375 - Phone: 508.238.7100 * Fax: 617.507.0784 2 Table of Contents II 9. Compare and Trace Function • Shift Trace 10. Trace Information • General Tab • Supplier Parameter Tab • Measurement Parameters Tab • Analysis Parameters Tab 11. Preference Tab • General Tab • Trace Tab • Start & Exit Tab • Windows Integration Tab • General Options 12. Colors Setup • Elements 13. Connecting to Reflect.exe via Windows Mobile Device Center 14. Trouble Shooting 15. Warranty © 2010 Advanced Fiber Solutions, Inc. All rights reserved. 19 Norfolk Ave * Easton * MA * USA * 02375 - Phone: 508.238.7100 * Fax: 617.507.0784 3 DR-500 Series PC Software “Reflect” Reflect.exe is a Windows based application and is compatible with a Windows ™ operating system. The software is capable of displaying, storing, reading, printing and analyzing several traces at the same time. Reflect.exe is capable of controlling the operation of the DR-500 series OTDR via a USB cable and windows mobile device interface AcitveSyn if desired by the OTDR operator. Software Installation 1. Insert CD in PC 2. In CD drive open SetupAFS_eng 3. Allow PC to run installation Functional Description Trace Screen Table 1.0 Trace Title Menu Drop Downs Active Trace Information Panel Menu Icons Active Trace Panel Displayed Section Trace Parameters A Trace screen on the Reflect software is illustrated above © 2010 Advanced Fiber Solutions, Inc. All rights reserved. 19 Norfolk Ave * Easton * MA * USA * 02375 - Phone: 508.238.7100 * Fax: 617.507.0784 4 Menu Tool Bar File Menu Table 2.0 Shortcut File Drop Down Menu Open - Open a saved trace Close - Close the current trace window New - Open a New screen Recent Files - List recently open files Save As Save - Save the current trace Save As – Save the current trace under another name Save Report As… - Save trace Report as a .pdf file Print Setup - Print options Print Preview - Preview print Print - Print the current trace Exit Measurement Menu Table 2.1 Shortcut Measurement Drop Down Menu Start Config Start (Average) - Run a normal measurement with Averaging Start (Live) – Run a measurement in the real time mode Stop – Stops the measurement process Config - Parameters setup and USB/DR500 Series connection configuration © 2010 Advanced Fiber Solutions, Inc. All rights reserved. 19 Norfolk Ave * Easton * MA * USA * 02375 - Phone: 508.238.7100 * Fax: 617.507.0784 5 Mode Menu Table 2.2 Shortcut Mode Drop Down Menu 2PT LSA Splice Reflect Co 2PT attenuation – Attenuation between two points LSA attenuation – Attenuation by straight line approximation Splice Loss – Attenuation of an OF event using the 5 marker method Reflection Coefficient – Reflection measurement mode ORL – Optical return loss measurement ORL Ref Index Trace Info Refractive Index – Enables adjustment of the RI Backscatter Coefficient – Enable adjustment of the BC Trace Info – Trace details Insert Marks Delete Marks Events Table Analysis Filter Insert Mark – Inserts section or events between the two marker into the Events Table Delete Marks – Deletes section or events between the two markers from the Events Table Events Table – Opens the Events Table Analysis - Performs Auto Trace Analysis Thresholds – Enable adjustment of Auto Trace Threshold values Filter – Enables adjustment of trace filtration level © 2010 Advanced Fiber Solutions, Inc. All rights reserved. 19 Norfolk Ave * Easton * MA * USA * 02375 - Phone: 508.238.7100 * Fax: 617.507.0784 6 Compare and Trace Menu Table 2.3 Shortcut Compare Drop Down Menu Copy Trace Paste Trace Delete Trace Copy Trace – Copies trace to clip board Paste Trace – Insert trace from clip board to current trace Delete - Deletes inserted trace Shift Trace - Enable shifting of the trace vertically Quick Paste – Enable a shortcut to paste previously opened traces Create Template Apply Template Create Template – Stores current trace as template Apply Template – Applies template to trace Delete Template – Delete template Copy Image – Copies image to clip board © 2010 Advanced Fiber Solutions, Inc. All rights reserved. 19 Norfolk Ave * Easton * MA * USA * 02375 - Phone: 508.238.7100 * Fax: 617.507.0784 7 Zoom Menu Table 2.4 Shortcut Zoom Drop Down Menu Horizontal Zoom In Zoom Out Vertical Zoom In Zoom Out Select Horizontal Zoom Factor – Select a zoom factor (x1.1, x1.3, x 2, x5, x10) Horizontal Zoom In – Zoom in Horizontally Horizontal Zoom Out – Zoom out Horizontally Restore Horizontal Scale – Restore H scale Select Vertical Zoom Factor – Select a zoom factor (x1.1, x1.3, x 2, x5, x10) Vertical Zoom In – Zoom in Vertically Vertical Zoom Out – Zoom out Vertically Restore Vertical Scale – Restore V scale Restore Scales - Restore both scales to default settings Setup Menu Table 2.5 Setup Drop Down Menu Preferences – Software preferences setup Colors – Element color selection Utilities Menu Table 2.6 Utilities Drop Down Menu Device (ActiveSync) File Manager – Enables DR-500 series file management © 2010 Advanced Fiber Solutions, Inc. All rights reserved. 19 Norfolk Ave * Easton * MA * USA * 02375 - Phone: 508.238.7100 * Fax: 617.507.0784 8 Windows Menu Table 2.7 Windows Drop Down Menu Cascade – Cascade active traces Tile – Tile active traces Arrange Icons – Manually arranges all minimized windows Window List – Lists all open traces Displays Active List Help Menu Table 2.8 Help Drop Down Menu Help – Reference Manual About – Software Information Markers Icon Table 2.9 Markers Icon (Shortcut) Moves active Marker Left Markers Icon Selects all Markers Moves active Marker Right Selects Left Marker as active Marker Selects Right Marker as active Marker © 2010 Advanced Fiber Solutions, Inc. All rights reserved. 19 Norfolk Ave * Easton * MA * USA * 02375 - Phone: 508.238.7100 * Fax: 617.507.0784 9 Trace Table 3.0 A Trace is a visual representation of a fiber optic link. The beginning of the fiber optic link is located on the left side of the trace. The slope or attenuation of the fiber link can be seen as the trace moves to the right. There are two “active” markers, the information containing the location of the markers is located on the left side of the screen at shown above in Table 3.0 The screen also displays several numbers that correspond to measurement values (attenuation, attenuation loss at an event, distance to an event and Optical Return Loss (ORL), These values are the measurements from the Automatic Trace Analysis that the OTDR performs. Automatic Trace Analysis will be covered in a later section. The testing parameters for the active trace are located below the trace window (in the gray area). All parameters are preset (by operator) prior to running a test. See the measurement parameters section for more information. © 2010 Advanced Fiber Solutions, Inc. All rights reserved. 19 Norfolk Ave * Easton * MA * USA * 02375 - Phone: 508.238.7100 * Fax: 617.507.0784 10 Parameters Panel Table 3.1 X - Shows the location of section begin and section end and the scale of the distance on the horizontal axis Y - Shows the top end and low end value of the dB loss for entire trace window and the scale of the loss per division on the vertical axis 1st box - Identifies the fiber type (multimode or single mode) and the wavelength N - The Refractive Index of the fiber Lmax - Distance Range Tp - Duration of the Pulse Width Nav - Number of Averages L1 - Distance from the beginning of the fiber to the beginning of the section measured L2 - Distance from the beginning of the fiber to the end of the measured section The parameters properties window is accessed by selecting the Config icon or Config option under the measurement drop down menu. A dialog box will appear as shown in table 3.2 allowing the technician to modify or change the specific testing parameters in the appropriate box. For more accurate measurements, it may be necessary for the Technician to adjust certain testing parameters for the specific fiber under test. The operating parameters should be set according to the fibers being measured. For short fiber runs, shorter pulse widths and fewer averages are optimum. With longer fiber runs, longer pulse widths and more averages are best. The values chosen by the user are dependent upon the testing requirements and there are tradeoffs that are sometimes necessary. © 2010 Advanced Fiber Solutions, Inc. All rights reserved. 19 Norfolk Ave * Easton * MA * USA * 02375 - Phone: 508.238.7100 * Fax: 617.507.0784 11 Measurement Parameter Properties Window Table 3.2 Manual – Enables manual Parameter setup Auto – The unit perform an Auto test to determine the appropriate parameters for cable under test Wavelength – Select at which wavelengths to test *1 Apply to All - Apply active table parameter to all wavelengths Backscattering Coefficient – (BC) Values of the optical pulses in dB that are scattered back to the OTDR from the optical fiber being tested *2 Refractive index (n) - The optical fiber’s refractive index can be adjusted in increments of 0.00001 *3 Distance range (Lmax) – Distance setting for test fiber *4 Section Begin (L1) - Defines the location of the left marker *5 Section End (L2) - Defines the location of the right marker *6 Resolution (dL) - Selects the measurement sampling distance Pulsewidth (TP) - Selects width of output pulse *7 Measuring with Averaging – Average using time parameter *8 Measuring with Averaging – Average using 4096*Nav parameter *8 Live Mode - Defines the screen refresh rate Analysis Thresholds – *9 1 Event loss – LT 2 Reflectance - RT 3 End-of-Fiber – ET 4 Fiber loss – CT High resolution – Increases measurement bandwidth Low Laser Power - Decreases pulse power Individual parameters for each wavelength maybe selected within the appropriate wavelength tab. © 2010 Advanced Fiber Solutions, Inc. All rights reserved. 19 Norfolk Ave * Easton * MA * USA * 02375 - Phone: 508.238.7100 * Fax: 617.507.0784 12 *1 If two (or more) Single Mode or both Multimode wavelengths are selected then Lmax, L1, L2 and dL become common parameters for the selected wavelengths. *2 Default BC values -82 dB for SM at 1550 nm -77 dB for SM at 1310 nm -76 dB for MM at 1300 nm -68 dB for MM at 850 nm *3 For an exact index of refraction value of the cable, contact the fiber optic cable manufacturer. Default RI values 1.4682 for SM at 1550nm 1.4675 for SM at 1310nm 1.486 0 for MM at 1300nm 1.4900 for MM at 850nm *4 Available values in km: 2, 5, 10, 20, 40, 80, 120, 160 and 240 *5 L1 marker can be placed anywhere from 0 to L2 in the trace window. *6 L2 marker can be placed anywhere from the L1 to the Lmax in the trace window. *7 Shorter pulses are generally used for shorter distances and higher resolution. Longer pulse widths are required for longer fiber runs. The allowable pulse width is determined by the distance range- Lmax. *8 Number of Averages (4096*Nav) This defines the number of allowable trace averages when the OTDR in the “RUN” mode. Nav may be set to any of the following values 1, 2, 4, 8, 16, 32, 64, 128, 256 Averaging Time (min: sec) The user also has the option to set the time range that they would like for a particular measurement. © 2010 Advanced Fiber Solutions, Inc. All rights reserved. 19 Norfolk Ave * Easton * MA * USA * 02375 - Phone: 508.238.7100 * Fax: 617.507.0784 13 *9 Threshold values for Automatic Trace Analysis The parameter menu contains the threshold values that the OTDR compares with the actual trace values when operating in the Automatic Trace Analysis mode. These values are inputted by the OTDR operator and are used to compare expected measurement values to actual measurement values. The measurement values are displayed on the events table and if the expected parameters are not met – the results will be indicated by an asterisks “*” in the events table. Event Loss (LT) - Threshold of the event attenuation value in dB. Events with attenuation value that exceeds the threshold value will be shown in the Events Table. Reflectance (RT) - Threshold of the event reflectance value in dB. The reflected event having a reflectance higher than the threshold value are shown in the Events Table. End of Fiber (ET) - Threshold of the event attenuation value in dB for defining the fiber end. The first event with an attenuation exceeding the threshold value is defined during the automatic trace analysis as an optical fiber end. All subsequent events will be ignored. Fiber Loss (CT) – Attenuation coefficient threshold value of the section in dB/km. Exceeding the attenuation coefficient threshold value will mark the section with an * in the Events Table. If the threshold are exceeded, the coefficient value will be marked by an asterisk “*” in the marks table. This cannot be construed as certification – as true attenuation loss, according to the standards (EIA/TIA) are only determined by a power meter and a source. Default values of Fiber Loss 0.25 dB/km for Single Mode at 1550nm 0.4 dB/km for Single Mode at 1310nm 1.0 dB/km for Multimode at 1300nm 2.0 dB/km for Multimode at 850nm © 2010 Advanced Fiber Solutions, Inc. All rights reserved. 19 Norfolk Ave * Easton * MA * USA * 02375 - Phone: 508.238.7100 * Fax: 617.507.0784 14 Taking a Measurement Table 4.0 Measurement Options Start (Averages) – Start a measurement with averaging *10 Start (Live) – Real Time Mode *11 Stop – Stops the measurement process *12 *10 Start (Averages) - The measurement mode with averaging is designed for measuring and analyzing all of the parameters of the fiber optic cable. When using this feature, the measurement average counter is displayed on the bottom of the main screen. The OTDR displays a progress bar (Nav=Number of Averages) at the bottom of the screen. This indicates time elapsed verses total measurement time. The software will beep when the total measurement is completed. *11 Start (Live) – In the Real Time mode the OTDR will continue to run measurements according to the preset parameters. *12 Stop – Both an Average reading or a Live reading maybe stopped by this function at any time in the measurement process. © 2010 Advanced Fiber Solutions, Inc. All rights reserved. 19 Norfolk Ave * Easton * MA * USA * 02375 - Phone: 508.238.7100 * Fax: 617.507.0784 15 Measurement Modes Table 5.0 Measurement Modes 2PT Attenuation *13 LSA Attenuation *14 Splice Loss *15 Reflectance *16 ORL – Optical Return Loss *17 *13 Measuring Attenuation between two marker points - (2 PT) In this markers mode values are shown at the left side of the screen in the information panel. The measurement values are based upon where the left hand marker (L) and right hand marker (R) are positioned on the trace screen. The (L,km) field indicates the distance of the L marker while (R,km) field indicated the distance of the right hand marker on the trace. (R-L,km) indicates the distance between the left and right markers. The dB field in the information panel displays the attenuation between the left and right hand markers, while the dB/km field displays the attenuation co-eff. 2PT Attenuation Table 5.1 L,km - Left marker location R,km –Right marker location R-L, km – Distance between R & L dB – Loss between R & L dB/km – attenuation coefficient © 2010 Advanced Fiber Solutions, Inc. All rights reserved. 19 Norfolk Ave * Easton * MA * USA * 02375 - Phone: 508.238.7100 * Fax: 617.507.0784 16 *14 Measuring the Attenuation by Approximation - (LSA) The attenuation measurement by approximation mode is used to measure “non-event” sections of the fiber optic link. This mode increases the accuracy of the attenuation measurement between the two markers by using a straight line to approximate the measurement. The approximation straightline measurement values are shown on the left side of the screen in the information panel. The measurement values are based upon where the left hand marker (L) and right hand marker (R) are positioned on the trace screen. The (L,km) field indicates the distance of the L marker while (R,km) field indicated the distance of the right hand marker on the trace. (R-L,km) indicates the distance between the left and right markers. The dB field in the information panel displays the attenuation between the left and right hand markers, while the dB/km field displays the attenuation coefficient. LSA Attenuation Table 5.2 L,km - Left marker location R,km –Right marker location R-L, km – Distance between R & L dB – Loss between R & L dB/km – attenuation coefficient © 2010 Advanced Fiber Solutions, Inc. All rights reserved. 19 Norfolk Ave * Easton * MA * USA * 02375 - Phone: 508.238.7100 * Fax: 617.507.0784 17 *15 Attenuation Measurement of an “Event” – (Splice Loss) Using the “Five Markers” method the OTDR measures the attenuation of a specific event. The “five marker” method works as follows: The left marker (L) and right marker (R) are placed on either side of the event, as close as possible to the edges of the event, without touching the event itself. The two outermost markers (Lx and Rx) are used to calculate the straight line approximation of the fibers on both sides of the event and the fifth marker (C) is used to locate the begining of the event. The measurement results are displayed in the information panel. The (L,km) field indicates the distance of the L marker while (R,km) field indicated the distance of the right hand marker on the trace. (R-L,km) indicates the distance between the left and right markers. The Spl, dB field in the information panel displays the attenuation of the event while the Spl, km field displays the distance to the event being tested (middle marker C). Splice Loss Table 5.3 L,km - Left marker location R,km –Right marker location R-L, km – Distance between R & L Spl,dB – Splice loss Spl/km – Distance to splice event location © 2010 Advanced Fiber Solutions, Inc. All rights reserved. 19 Norfolk Ave * Easton * MA * USA * 02375 - Phone: 508.238.7100 * Fax: 617.507.0784 18 *16 Reflective Coefficient Measurement - (Reflection) This marker method is used to measure the reflection coefficient of a specific connector event. Place the right marker (R) on the peak of the reflected event. Place the left marker (L) on the base line of the trace directly before the event. The measurement results are displayed in the information panel. The (L,km) field indicates the distance of the L marker while (R,km) field indicated the distance of the right hand marker on the trace. (R-L,km) indicates the distance between the left and right markers. The Refl, dB field displays the reflective coefficient between markers L and R while the Refl, km field displays the left (L) marker and location of the base of the connector. Reflective Coefficient Table 5.4 L,km - Left marker location R,km –Right marker location R-L, km – Distance between R & L Refl,dB – Reflective value Refl/km – Distance to reflective event location © 2010 Advanced Fiber Solutions, Inc. All rights reserved. 19 Norfolk Ave * Easton * MA * USA * 02375 - Phone: 508.238.7100 * Fax: 617.507.0784 19 *17 Optical Return Loss - (ORL) This marker method measures the Optical Return Loss of a partial fiber section or the whole fiber link. Place the left (L) and right (R) markers on the fiber link that is being tested. The measurement results are displayed in the information panel. The (L,km) field indicates the distance of the L marker while (R,km) field indicated the distance of the right hand marker on the trace. (R-L,km) indicates the distance between the left and right markers. The dB field in the information panel displays the attenuation between the left (L) and right (R) hand markers while the ORL, dB field displays the ratio (in dB) of the optical power entered into the fiber link verses the power which is returned to the beginning of the fiber for the marked section. ORL Table 5.5 L,km - Left marker location R,km –Right marker location R-L, km – Distance between R & L dB – dB loss between R & L ORL/dB – Ratio in dB between inputted optical power and returned optical power © 2010 Advanced Fiber Solutions, Inc. All rights reserved. 19 Norfolk Ave * Easton * MA * USA * 02375 - Phone: 508.238.7100 * Fax: 617.507.0784 20 Refractive Index Table 6.0 Refractive Index Distance to left marker Distance to right marker Refractive Index *18 *18 The Refractive Index box enables the user to adjust the refractive index setting according to the specific fiber under test. If the refractive index value is unknown but the fiber length is known, then the refractive index can be estimated by comparing the index of refraction with a known value from a previous trace. © 2010 Advanced Fiber Solutions, Inc. All rights reserved. 19 Norfolk Ave * Easton * MA * USA * 02375 - Phone: 508.238.7100 * Fax: 617.507.0784 21 Auto Trace Analysis Distance to Events Table 7.0 Connector Losses Attention of fiber link and fiber sections Splice Losses When the OTDR takes a measurement it also performs an automatic trace analysis (if preset). Once the trace analysis is completed, the OTDR will determine the following, the distance of the fiber link and distance to events, the attenuation of the fiber link and of fiber sections, the ORL, the splice losses and the connector losses. Once the OTDR completes the test, the OTDR displays the results on the trace screen, as shown in table 7.0. The results are also displayed in the Events Table. The OTDR will establish “marks” with the “⊥ ⊥” symbol. From these marks, the OTDR determines the appropriate values. The event distance(s) is represented vertically on the trace. Fiber attenuation values are displayed as dB/distance (unit measurements). Optical return loss is displayed as a single value (no unit measurements). In the auto mode, the OTDR compensates for the “Dead Zone” of the fiber link and calculates the attenuation from the end of the dead zone. © 2010 Advanced Fiber Solutions, Inc. All rights reserved. 19 Norfolk Ave * Easton * MA * USA * 02375 - Phone: 508.238.7100 * Fax: 617.507.0784 22 Events Table R = Event with reflection Table 8.0 S = Event without reflection The Events Table lists the measurement values of the data points (marks, ⊥) on the particular fiber under test. The Events Table (table 8.0) has two fields, the “Events” field and the “Sections” field. © 2010 Advanced Fiber Solutions, Inc. All rights reserved. 19 Norfolk Ave * Easton * MA * USA * 02375 - Phone: 508.238.7100 * Fax: 617.507.0784 23 Events Tab Table 8.1 Event Tab Columns No. – Events in numeric order Event Type – R = reflective S = non-reflective Distance – From beginning of fiber to the event Reflectance Reflective co-eff in an event (if any) in dB Splice loss– Attenuation of an event (if any) in dB Event Codes A = Added by the user M = Relocated by the user E = End of fiber F = Found by software O = Out of range without finding the E-O-F D = Modified end of fiber OF loss - Attenuation coefficient of a nonevent in dB/km Cumulative loss Total attenuation from the beginning of the fiber under test to the next event in dB The “Delete” Button will delete the highlighted marks from the trace window and the corresponding data from the Events table. (Note* it is impossible to remove the pre-established markers from the beginning and the end of the fiber trace.) When in the events table, the “Markers” button, when pressed, will jump to the appropriate marks on the trace window related to the highlighted data. The “Move” button allows the user to adjust the markers position incrementally back and forth around the highlighted event in the trace window, allowing the user to adjust any measurements made by the automatic trace analysis. Please see Table 8.3 below. © 2010 Advanced Fiber Solutions, Inc. All rights reserved. 19 Norfolk Ave * Easton * MA * USA * 02375 - Phone: 508.238.7100 * Fax: 617.507.0784 24 Section Tab Table 8.2 Section Tab Columns No. - Events in numeric order Begin - Distance to the left red box on the trace screen End - Distance to the right red box on the trace screen Loss - Complete attenuation between the marked sections OF Loss - Attenuation coefficient of the marked sections Chosen sections will be highlighted on the events table. Pressing the “Markers” button will move the vertical markers in the trace window to the location indicated by the highlighted section in the events table. To delete a section simply highlight that particular section and press the delete button. The Reflect PC software allows the user to measure a specific section of the fiber under test by inserting marks ⊥ on the trace. To insert a set of markers, place the left vertical marker and the right vertical marker at each side of a section to be measured and press the “insert marks” button. © 2010 Advanced Fiber Solutions, Inc. All rights reserved. 19 Norfolk Ave * Easton * MA * USA * 02375 - Phone: 508.238.7100 * Fax: 617.507.0784 25 Event Move (Manually adjust an Event) Table 8.3 Additional left – adjust LSA left most marker Left – adjust left (main) marker Central – Adjust center marker Right - adjust right (main) marker Additional right – adjust LSA right most marker Change event type – enable the user to change event type between R(reflective) and S(nonreflective) © 2010 Advanced Fiber Solutions, Inc. All rights reserved. 19 Norfolk Ave * Easton * MA * USA * 02375 - Phone: 508.238.7100 * Fax: 617.507.0784 26 Compare and Trace Function (Please refer to Table 2.3) For a fast analysis of a multi-fiber optic cable with many events, the Compare and Trace function becomes a very useful tool. With the Compare and Trace option, the user can transfer marks and parameters on one fiber to another by simply pressing one key. Selecting the create template allows the user to save data points of the marks on a trace to a buffer allowing the user to transfer those points on to a different trace for evaluation. The Compare drop down menu will now activate the functions Apply Template and Delete Template. The template is the analysis calculations related to a particular trace. The data stored in the template buffer can be erased and written over by repeating the above procedure. Each trace is displayed in its own separate window. However, if desired the user may insert several traces in one window for data comparison. To insert a trace from one window into another window simply follow the below procedure Open the trace window to be copied Select CompareCopy By selecting CompareCopy, the trace will be saved in the buffer displayed in the information panel. The Compare and Paste functions will now become active. Note: They may have already been activated from a previously saved trace. Open host trace window Select ComparePaste The names of the inserted traces will appear in the information panel under Traces (The host trace name will appear at the top of the list.) It is possible to insert up to seven traces at the same time. © 2010 Advanced Fiber Solutions, Inc. All rights reserved. 19 Norfolk Ave * Easton * MA * USA * 02375 - Phone: 508.238.7100 * Fax: 617.507.0784 27 Only one trace at a time is active in the host window. This is indicated by the symbol “^” beside the file name in the traces window of the information panel. Using the vertical markers it is possible to measure the length and attenuation of each active trace. To make a trace active simply double click on its name in the information panel. Pressing keys CTRL+SPACE when it is highlighted will also activate the trace. CTRL+PAGE UP and CTRL+PAGE DOWN will allow the user to scroll up and down through traces in the information panel. To remove an inserted trace from the host window, select and highlight the trace then press the icon or press the CTRL+DEL keys. Shift Trace Table 9.0 Shift trace vertically Shift up – move trace up vertically Shift down – move trace down vertically Restore Position – restore to original position It is also possible to shift the inserted trace vertically in the host window. Highlight the desired trace to shift and select the menu item Compare → Shift Trace. On the inserted trace it is possible to place vertical markers for specific measurements or enter explanatory information and apply it to the function "model.” © 2010 Advanced Fiber Solutions, Inc. All rights reserved. 19 Norfolk Ave * Easton * MA * USA * 02375 - Phone: 508.238.7100 * Fax: 617.507.0784 28 Trace Information – General Tab Table 10.0 General Tab Date/Time – displays time and date of recorded trace Cable ID – enables the user to enter a cable ID Fiber ID – enables the user to enter a fiber ID Fiber Type – enables the user to select a fiber type Originating Location – enables the user to enter a originating location Terminating Location – enables the user to enter a terminating location Condition – enables the user to select the fiber condition Trace Type – enables the user to select the fiber trace type Operator – enables the user to enter the operators information Comment – enables the user to enter the additional comments The Technician can input specific information about each fiber link that is being tested. This includes cable/fiber ID, fiber type, fiber location, termination location, fiber condition, the fiber optic test technician and any applicable comments. © 2010 Advanced Fiber Solutions, Inc. All rights reserved. 19 Norfolk Ave * Easton * MA * USA * 02375 - Phone: 508.238.7100 * Fax: 617.507.0784 29 Trace Information – Supplier Parameter Tab Table 10.1 Supplier Parameter Tab Supplier Name – OTDR’s suppliers name OTDR Mainframe ID – OTDR’s mainframe ID OTDR Mainframe S/N – OTDR’s mainframe serial number Optical Module ID – OTDR’s modules ID Optical Module S/N – OTDR’s module serial number Software Revision – Software revision number Other – numbers other module This information tab shows the OTDR’s mainframe characteristics. © 2010 Advanced Fiber Solutions, Inc. All rights reserved. 19 Norfolk Ave * Easton * MA * USA * 02375 - Phone: 508.238.7100 * Fax: 617.507.0784 30 Trace Information – Measurement Parameters Table 10.2 Measurement Parameters Tab Actual Wavelength – Precise value of wavelength used for this trace Refractive Index – Refractive index set for this trace Distance Range (Lmax) – Distance set for this trace Section begin (L1) Defines the location of the left marker for this trace Section end (L2) - Defines the location of the right marker for this trace Resolution (dL) – Measurement sampling distance for this trace Pulse-width (Tp) – Pulse width for this trace # of Averages (4095*nav) – Number of average set for this trace High resolution – Indicates if high resolution was set for this trace Low laser power – Indicates if low laser power was used for this trace This Information Window shows the initial measurement parameters tab that the user sets to take the OTDR measurements. These values are inputted during the initial measurement parameters setup. © 2010 Advanced Fiber Solutions, Inc. All rights reserved. 19 Norfolk Ave * Easton * MA * USA * 02375 - Phone: 508.238.7100 * Fax: 617.507.0784 31 Trace Information – Analysis Parameters Table 10.3 Analysis Parameter Tab Backscattering Coefficient – BC value for this trace Event Loss (LT) - Threshold of the event attenuation value in dB for this trace Reflectance (RT) Threshold of the event reflectance value in dB for this trace End-Of Fiber (ET) Threshold of the event attenuation value in dB for defining the fiber end for this trace Fiber Loss (CT) Attenuation coefficient threshold value of the section in dB/km for this trace This information tab shows the threshold values selected by the Technician for the automatic trace analysis. © 2010 Advanced Fiber Solutions, Inc. All rights reserved. 19 Norfolk Ave * Easton * MA * USA * 02375 - Phone: 508.238.7100 * Fax: 617.507.0784 32 Preference – General Tab Table 11.0 General Tab Distance unit - Change the measurement value. Km, m, Ft, Kf and Mi are the available options Language - Change the language options. English, Spanish or Korean Autonumbering of file names - Auto number the traces in the order the measurements are taken Extended Save As Provides the user the option of changing the file root Color print - Printing with or without color Use extended Print Enables the user to use the extended Print option Apply a Filter on all new traces Apply the “Automatic” Analysis mode on all traces Copy the trace information with template Apply “Zoom” option on new traces Note: The user can modify or change the appearance of the OTDR software depending upon operation, measurement, or operator preferences. Some of the items the user can modify are as follows: The trace screen, measurement parameters, (i.e. km to ft) or change the language. Maximize the trace window Sound at end of measurement Use Click for Marker Jump Notify when opening multiple related traces © 2010 Advanced Fiber Solutions, Inc. All rights reserved. 19 Norfolk Ave * Easton * MA * USA * 02375 - Phone: 508.238.7100 * Fax: 617.507.0784 33 Preference – Trace Tab Table 11.1 Trace Tab Show grid - Turn on or Turn off the background grid Show event bar - Show the bottom marker bar, highlighted in Red Show events info on trace - Turn-on or turnoff the automatic analysis measurement Bind to trace when scrolling horizontally Change the starting point of horizontal scrolling Show grid marks – show position marks on the grid Zoom relevant to Left corner Center Right corner Scrollbar Marker speed Usual Accelerated Acceleration delay The marker speed can be changed to varying degrees The Trace tab in the preferences window allows the user to setup different parameters related to the trace grid, event bar, events information on trace, scrolling, zooming and markers speed. © 2010 Advanced Fiber Solutions, Inc. All rights reserved. 19 Norfolk Ave * Easton * MA * USA * 02375 - Phone: 508.238.7100 * Fax: 617.507.0784 34 Preference – Start & Exit Tab Table 11.2 Start & Exit Tab Initialize the Device Automatically check the device connection when software is launched Confirm Exit - Confirm exit when closing program Ask about saving file Ask if the operator would like to save the trace upon closing Save - Window size and position Save working folder – Save in last working directory The Start & Exit tab in the preferences window allows the user to setup different parameters related opening the program and exiting the porgram © 2010 Advanced Fiber Solutions, Inc. All rights reserved. 19 Norfolk Ave * Easton * MA * USA * 02375 - Phone: 508.238.7100 * Fax: 617.507.0784 35 Preference – Windows Integration Tab Table 11.3 Windows Integration Tab Register extensions now– enable the user to click on a *.sor file which will then open the OTDR software (if not already opened) and load the associated trace when the - Associate known file types is checked Create a shortcut to the PC or Laptops desktop Enables the user to drag a file onto the trace window where the software will then open General Preferences Window Options The “OK” button accepts any changes. The “Reset” button resets default values. The “Cancel” button cancels all the changes. © 2010 Advanced Fiber Solutions, Inc. All rights reserved. 19 Norfolk Ave * Easton * MA * USA * 02375 - Phone: 508.238.7100 * Fax: 617.507.0784 36 Colors Setup – Elements Table 12.0 Element Colors Elements – Selectable Elements Left marker Right marker Subsidiary markers Central marker Grid Approximation line Selected event boarder Events info Sections info Trace Background Grid Marks Change – Change highlighted element This option enables the user to change the color scheme of the Reflect software elements by changing the color palette. Highlight the specific “element” Select Change. A standard windows “Color” window will appear Select the colors you wish and press OK Do this as necessary. To store changes and return to software press OK or press Cancel to quit without changing any colors. © 2010 Advanced Fiber Solutions, Inc. All rights reserved. 19 Norfolk Ave * Easton * MA * USA * 02375 - Phone: 508.238.7100 * Fax: 617.507.0784 37 Connecting DR500 Series unit to Reflect.exe via Windows Mobile Device Center Table 13.0 Windows Mobile Device Center Download Windows Mobile Device Center to PC Open Mobile Device Center Application Turn off OTDR – make sure all data is saved before power down. Connect the supplied USB cable between the OTDR and the PC Note:The Mini USB connector attaches to OTDR and the USB connector attaches to the PC Turn on OTDR – The PC will load the drivers for the OTDR and connect through the Mobile Device Center application Connection to Reflect Software Table 13.1 Connection and Parameters Panel Once a connection has been established between the PC and OTDR the Reflect.exe application has the ability to setup parameters and activity OTDR measurements © 2010 Advanced Fiber Solutions, Inc. All rights reserved. 19 Norfolk Ave * Easton * MA * USA * 02375 - Phone: 508.238.7100 * Fax: 617.507.0784 38 Troubleshooting Software does not load correctly System needs to be Win 98 or more recent, at least 16MB of RAM and a processor that is 75Mhz or better PC or Laptop does not recognize OTDR The PC and the OTDR communicate via Window Mobile Device Center please verify that this program is correctly installed on Laptop or PC For further assistance contact AFS © 2010 Advanced Fiber Solutions, Inc. All rights reserved. 19 Norfolk Ave * Easton * MA * USA * 02375 - Phone: 508.238.7100 * Fax: 617.507.0784 39 Warranty Certificate Advanced Fiber Solutions, Inc warrants that its products sold by it to purchaser will, upon delivery to purchaser, be free of defects in workmanship or materials and will conform and function in accordance with the specifications for the product as published by Advanced Fiber Solutions, Inc and in effect at the time of delivery. Should any failure to conform to this warranty become apparent during the oneyear period after date of delivery of the product to purchaser, AFS will, upon prompt written notice form the purchaser, correct such non-conformity by repair or replacement at AFS’s Boston, Massachusetts facilities, shipment to such facility to be at purchaser’s cost and repaired or replaced components to be shipped to purchaser FOB AFS’s facility in Easton, Massachusetts. Correction in the manner provided herein shall constitute a fulfillment of all liability of AFS with respect to the quality of any products sold by it to purchaser. THE FORGOING WARRANTY IS EXCLUSIVE AND IN LIEU OF ALL OTHER WARRANTIES OF QUALITY, WHETHER WRITTEN, ORAL OR IMPLIED (INCLUDING ANY WARRANTY OF MERCHANTABILITY OR FITNESS FOR PURPOSE). THE REMEDIES PROVIDED HERIN SHALL BE THE PURCHASER’S SOLE REMEDY FOR ANY FAILURE OF AN AFS PRODUCT TO COMPLY WITH THE WARRANTY PROVISIONS HERIN, WHETHER CLAIMS BY THE PURCHASER ARE BASED IN CONTRACT OR IN TORT, INCLUDING NEGLIGENCE. In no event will the AFS product warranty extend to non-conformity in the performance resulting from: improper or inadequate maintenance performed by any person other then AFS; failure of performance or function caused by or attributable to any associated or complimentary equipment not supplied by AFS; modification of any AFS product or connection therewith or supplementary equipment not supplied by AFS or not produced by it; operation of the product or its use other then as provided by AFS; accident, disaster, transportation or neglect or any other circumstance, agency or event beyond AFS’s control. IN NO EVENT SHALL AFS BE LIABLE FOR SPECIAL OR CONSEQUENTIAL DAMAGES SUCH AS, BUT NOT LIMITED TO, DAMAGE OR LOSS OF OTHER PROPERTY OR EQUIPMENT, LOSS OF PROFITS OR REVENUES, LOSS OF USE OF EQUIPMENT, COST OF CAPITAL, COST OF PURCHASED REPLACEMENT, OR CLAIMS FOR SERVICE INTERUPTION. The remedies of the purchaser set forth herein are exclusive and the liability of AFS with respect to any contract or anything done in connection therewith, such as the performance or breech thereof, or from sale, delivery, repair, or use of any AFS product, whether in contract, in tort, on strict liability or otherwise, shall not exceed the price of the equipment or part thereof on which such liability is based. © 2010 Advanced Fiber Solutions, Inc. All rights reserved. 19 Norfolk Ave * Easton * MA * USA * 02375 - Phone: 508.238.7100 * Fax: 617.507.0784 40 Advanced Fiber Solutions, Inc. 19 Norfolk Ave, Easton, Ma, 02375, USA 508-238-7100 800-556-9313 Fax:617-507-0784 Issue 1.0 Copy right Advanced Fiber Solutions, Inc © 2010 Advanced Fiber Solutions, Inc. All rights reserved. 19 Norfolk Ave * Easton * MA * USA * 02375 - Phone: 508.238.7100 * Fax: 617.507.0784 41