1
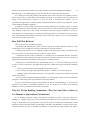
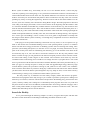
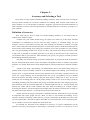
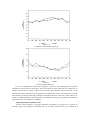
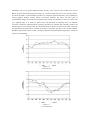
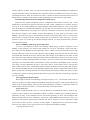
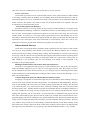
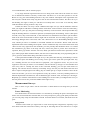
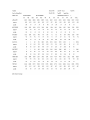
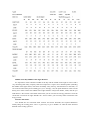
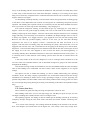
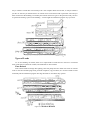
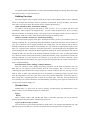
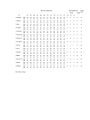
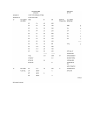
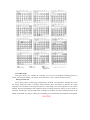
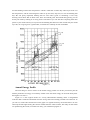
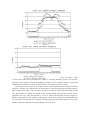
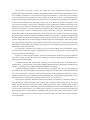
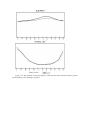
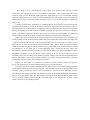
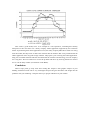
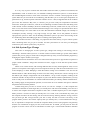
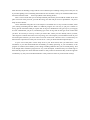
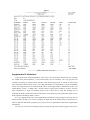
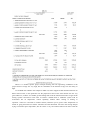
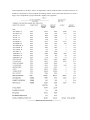
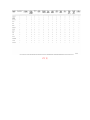
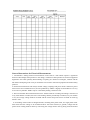
Figure7-12.
First, let's look at the graph more closely. One thing that should jump out is that there is hardly
any increase in the electric use in the summertime, whereas in most buildings we'd expect to see a
fairly large peak in the summer months from the air conditioning. Next, the gas graph reveals that the
variation from summer to winter is small (summertime use is 50% or more of the winter use per
month) and the summertime use is quite large. Both of these facts should give you some ideas about
the building and/or its HVAC systems.
These profiles are likely due to the following:
• one possibility is that the building is equipped with a gas-fired air conditioning system,
perhaps a gas or steam-fired absorption chiller
• another possibility is that this is an industrial building where only a portion of the building is
electrically air conditioned and there is a large process heating load which is in use year 'round
• finally, and this is the most subtle possibility, this building may have a reheat air conditioning
system where there is a lot of reheating going on all year 'round and the air conditioning is fighting the
heating all year 'round as well—giving us not much of a peak in our summer air conditioning and high
gas use in the summer