1
Computerized Building Energy Simulation Handbook
by James P. Waltz
Dedication
This book is dedicated in memory of my father, Bob, a genuine American hero and
veteran of Bari, from whom I received the gifts of patience and service, in memory my mother,
Lenore, from whom I received the gifts of curiosity and originality, and to my family, Mary Jane,
Mike,Julie and Alice, who have shared the toilsome trail along the way.
This book is also dedicated in reverent honor of my brothers who have braved harm's
way in the service of their country and made their shatteringly profound installment on the
price of peace—especially those who also wore that raucous eagle blazon upon their sleeve.
Table of Contents
Dedication
Preface
Chapter1:Introduction
Chapter2:Building Simulation Myths
Chapter3.Accuracy and Selecting a Tool
Chapter4.Determination of Existing Conditions
Chapter5.Building Survey Case Studies
Chapter6.Constructing the Model
Chapter7.Critiquing Output and Model Calibration
Chapter8.Modeling Energy Conservation Measures
Chapter9.Building Simulation and Performance Contracting
Appendices:
Simulation Program Database
Standards for Performing Energy Audits
Pre-Survey Checklist
Field Survey Data Gathering Checklist
ECM Work-Up Sheet
Project Pricing Checklist
Building Model Checklist
Forms
Rule of Thumb Values
References and Bibliography
Index
v
ix
1
7
15
27
69
83
109
133
157
163
209
211
Preface
The truth is, I have a hard time with conventional wisdom. As I have begun to mature (no, I'm not
going to reveal my age), it seems that about half of the conventional wisdom I encounter about how
the world works seems to be exactly backwards from the way things really are. Yet the world at large
seems to largely continue believing the conventional wisdom, apparently without a clue as to the real
truth. A (hopefully) quick example, perhaps, will make my point clear. Most people believe, I think
that people and businesses without insurance are at a great risk and get "destroyed" when an
"accident" happens and they don't have insurance to pay for the damages they have caused. However,
in my personal experience in performing expert witness services, it is only the people with insurance
that end up paying the bill when a lawsuit is initiated. What happens is what I call the "nose count."
When a settlement conference is held with the defendants in a case by, say a Special Master, on cases
I've seen, all the defendants and their counsel come together in a big conference room. The Special
Master will say something like, "well, we have a million dollar claim, there are 10 defendants in the
room, that means that you are each 'in' for $100,000." Then the special master will ask who doesn't
have insurance coverage. Perhaps five defendants will raise their hands, and the special will say
something like, "you can go.'' After half the room has cleared, the Special Master will clear his throat
and then say, "OK, now you are each 'in' for $200,000"—and the conference will continue. I swear,
this, or something very much like it, has happened on almost every one of my cases. It seems, in civil
suits, that the ability to pay is the only thing that determines whether you're culpable. The obvious
conclusion is that carrying insurance, in many circumstances, is like hanging a sign around your neck
that says "sue me"—and that the only sensible course is to not carry insurance—which runs contrary
to the "conventional" wisdom.
Well, in the field of building simulation, I feel like the same thing is true. It seems like most of the
world's conventional wisdom is to treat building simulation like it's sort of an academic exercise and
as though it really doesn't make any difference whether the model of a building accurately reflects
reality, just as long as it looks good.
A specific experience in this regard stimulated the creation of the seminar we teach for the
Association of Energy Engineers, which is the basis for this book. We do consulting for a wide range
of people including utility companies. Not too long ago we did a review of a study that had been done
by a design/build contractor. They had done a computer simulation of a building and estimated savings,
and turned it in to the utility company for a rebate. The utility company thought the documentation
looked "fishy" and asked that we review the project. In reviewing that project it became apparent that
the contractor knew very little about how to do building simulation and yet this was the foundation for
their request for a rebate and funding for a project. We ended up re-doing the model for that particular
building and it turned out that the contractor's estimated savings were about twice what it should have
been. In other words, a realistic savings figure was about half of what the contractor had told the
customer and the utility company. We concluded that the problem wasn't intent, as the energy services
company doing the work really did intend to do a good job—but they just didn't have the skills to
tackle the task—yet this was their "stock in trade"! What we also realized was that you can go to the
Trane Company, or perhaps Carrier or perhaps some consultants that teach the DOE-2 program and
you can learn all about their a particular software product. However, you don't learn very much about
what it takes to make the whole process of building simulation work. To create real, viable, and
meaningful (read "useful'') computerized building models is what this book is all about—everything
about building simulation but software.
Finally, I would like to acknowledge those who have encouraged me to undertake my first book,
including Bill Payne, Milt Meckler, and Al Thumann. When you're already working more than full
time, it takes a bit of inspiration to eke out the (amazingly extensive) time out of your life that it
requires to undertake such an endeavor. Thank you, gentlemen, for your inspiring support!
Chapter 1—Introduction
When teaching a seminar on this subject, one of the attendees explained that he was attending
because he felt that his consultants were submitting "B.S." models to him. He went on to say that he
didn't believe that they had any real idea what they were doing, that they were just going through the
motions, and that he wanted to learn about the process so that he could better manage his consultants.
We related well to this and explained that our view was that the "process" of building simulation was
the key topic, not the "tools."
What This Book Is about
Indeed, what this book is about is pretty much everything but software.
While software is the principal "tool" in the process, the focus of the book will be on the data
needed to build a model, how to build a model, examining the results, diagnosing problems with a
model and calibrating them to reality. Our approach will be, if anything, extremely down to earth and
pragmatic. This probably stems from the author's "grounding" in the energy services business in the
early 1980's where projects succeeded or failed based upon a realistic estimate of savings and there
wasn't a lot of extra time to develop the projects in the first place.
This is very much in contrast with some other approaches you may have encountered, such as the
ASHRAE building simulation "Shoot Out" which was conducted a few years ago. While we intend no
malice towards its proponents, we could see no practical sense to the exercise. The "shoot out"
consisted of giving the modelers a small amount of real data for a real building (about three month's
worth) and then having the modelers see if they could predict the rest of the year's energy use. It
seemed to us that this exercise was more like a bunch of folks going to the target range with a pistol,
putting on blindfolds and then shooting. While someone might hit the target, declaring them a
"marksman" hardly seems sensible, yet this is what the "shoot out" did (my sincere apologies to those
who thought the process meaningful).
Similarly, for example, our local utility decided not long ago that in their customized rebate
program only the DOE-2 program or TRACE may be used to get credit for demand savings. They
apparently believe that TRACE and DOE-2 give you a correct answer for estimating demand savings.
They don't, any more than any other program, because they all use "average" weather, and average
weather is not real weather. Even the TRY (test reference year) tapes and TMY (test mean year) tapes
prepared by NOAA are not real weather. They are all amalgams of a year's worth of weather. So there
is a lot of foolishness that goes on in this business that is presented as though it is precision—when in
fact it is not (referred to by at least one of my colleagues as "precisely inaccurate").
If you are trying to model an existing building, you'll have a much better idea of what's going on
in the building than when modeling a new building. New buildings are not hypothetical, they are
going to be occupied. If you have a lot of experience in existing buildings, then you start to understand
where and how energy is actually used in buildings and you can look at a new building and say, "You
know, the way this building is probably going to be occupied and used is going to be in this fashion."
Now you can do a realistic model of that building based on sage experience of real buildings.
For the last two decades we have observed engineering society literature, newsletters,
symposiums, forums and the like, and have listened to people bemoan their inability to get their
computer models, especially of existing buildings, to agree with the utility bills. We have concluded
from our observations that the conditions that led to the dismal simulation job mentioned in the
preface (and documented in detail in the paper entitled "Computerized Building Simulation . . . ,A
DSM Strategy?" in the bibliography) are far too much the norm rather than the exception.
In an attempt to solve that problem, both because such a lack of expertise in an industry seems a
shame, and because we firmly believe that building simulation is, or should be, the tool of choice for
energy services performance contracts, we have set about to document and organize a set of
procedures and approaches to doing computer models that allow the reader to stay within the "curbs"
on the building simulation "highway."
In addition, we want to help create a bias for healthy skepticism for computer output—to look at
the output and to ask, "Does this make sense? Can I really save 90% of the fan energy by using inlet
vane dampers on this fan?" The answer is probably, "NO!" The energy simulation is wrong, or
something else is wrong. Perhaps you measured something wrong or you modeled it wrong or you just
don't understand how the building is operating. Those are the sorts of points of view we are attempting
to inculcate in readers of this book.
How Will This Be Done?
This book will cover the following topics:
• explaining and dispelling the "myths" that have sprung up around computer simulation—most
of which just serve to muddy the water and confuse those new to the business
• defining what accuracy is in a building simulation and helping the reader to understand what
level of accuracy is required and what tools might serve those needs
• explaining how the existing conditions in a building can be determined and how accurately
determining the existing conditions can make the entire process easier and more accurate—and how to
prepare the preliminary model, which is the real key to modeling success
• sharing some real world experience from building surveys—to show how challenging it can be
at times to ferret out the truth—and again reinforcing how valuable having the truth about a building
can be
• how to go about actually constructing the mode, piece by piece
• how to critique the output and calibrate the model—to within 5% of actual energy use
• modeling energy conservation measures—an activity that is much more complex than would
appear at first blush
• a review of how important building simulation is (or should be) to the turn-of-the-millennium
resurgence of the energy services performance contracting industry
If you've been frustrated trying to build faithful models of existing buildings, or have become
skeptical of the efficacy of building simulation, or are just trying to do a better job simulating
buildings, I assure you that this book will be a lot of help!
Why Do We Do Building Simulation—Why Not Just Take a Guess or
Use Manual or Spreadsheet Calculations?
In our building simulation seminar, the question was asked, "Couldn't we just use "norms" for
buildings, i.e., Btu per square foot per year and dollars per square foot per year and rules of thumb for
energy savings?" This was a good question. After all, we know for example that a bad hospital is a bad
hospital no matter what the climate (good hospitals run 200 to 250,000 Btu per square foot per year,
and bad hospitals run 450 to 600,000). In addition, an experienced retrofit engineer can walk a
prospective building and develop a shopping list of retrofit measures, including rough savings and
costs, and be very close to the truth. So what's the point? Well, I believe that the following represent
some very good reasons for doing building simulation:
• To get retrofit work funded. Someone's got to make an estimate of savings or energy retrofit
most likely won't be done, since the whole purpose is to save money. No estimate of savings = no
investment.
• to take a risk as a third party. If you're an ESCO (Energy Service Company) you're about to
take a big risk and make an investment that you hope will pay back—you need some confidence that
your risk will be rewarded.
• To raise the level of confidence. Manual calculations are fine, in fact Honeywell produced a
landmark book back in the 1970's ("Conservation with Comfort") that was a great reference—and we
used it for many years. However, estimating savings out of context can get you in trouble. So, the
main reason for doing building simulation is to check your knowledge of the building and what goes
on in it by "assembling" the building's energy use piece by piece—and then checking it against what
we know to be reality—the utility bills. If it doesn't agree, then we know that we don't understand
what's going on in the building—and until we account for all of the sources and uses of energy in a
facility (an energy balance), then we cannot say with any real certainty what the savings will be from
any individual retrofit measure that we are contemplating.
• To see that the homework has been done. In our seminar on performance contracting, we
strongly suggest to building owners that having some "proof" that the homework has been done is far
more valuable than a guarantee. One way to ensure that the work has been done is to insist that
building simulations be done and that all the data input to the simulation be documented, since it is,
after all, the baseline conditions for the facilities against which the future performance of the facility
will be measured—or adjusted should the user make unanticipated changes that are not under the
control of the ESCo, or for which the ESCo is at risk (depending upon how the contract is written). By
this method the "bogus," sales-oriented "simulation," developed just to lull the customer into
proceeding can be avoided as well.
Why the Contents of This Book Might Be Meaningful
It is a great frustration that so many seminars and books have so little information of value in
them. As a result, it is often helpful to the prospective attendee/reader to know something about the
source of the information being offered. Should you disagree with this notion, then the following
description of the author and the author's firm will appear to be nothing more than egotistical bombast.
If you agree, then the following will provide some insight into the basis for the information offered
and why it may have value.
Basically, our company is mechanical, electrical and controls engineers, about 15 strong, founded
in 1981. We work exclusively on existing buildings and do no new construction design at all, nor do
we work for architects. All our key staff has worked for a design/build contractor at some time in their
careers, many of these firms being independent controls contractors as well. The result of this is that
we tend to take a very practical and down-to-earth approach to our projects, especially when working
with or overseeing contractors. Another result is that, unlike traditional consulting firms, we do
detailed control system design including point-to-point wiring diagrams, materials lists, etc. In
addition, for select clients we actually build control panels, install them, make final terminations of
contractor-installed control wiring, fire up the controls, commission them, program the systems and
even prepare the operator terminal graphics for the systems being controlled.
While the firm began life working exclusively in the energy field (starting with the creation of the
performance contracting business unit for a Fortune-500 temperature controls firm in the early 1980's),
we do both building systems and energy projects. For example we recently designed an 1100 ton
chiller plant for a large medical center in northern California that had virtually nothing to do with
energy conservation. Many companies in the energy consulting field tend to specialize on feasibility
studies, however, we believe very strongly that if you don't know how to design HVAC systems
you've got no business analyzing them for retrofit.
Finally, because we have done so much work in the energy retrofit field and have found the
available tools frequently inadequate, we have occasionally created our own software tools and have
made them available for sale to the public, including our building simulation tool.
As a result of all the above, we don't call ourselves "consulting engineers," but rather an
"engineering services company" instead.
In short, we've been there and done that—and we believe that this should give you some
confidence that what we have to say in this book might just be worth listening to.
Chapter 2—Building Simulation Myths
A sort of mystique has formed over the years which surrounds the practice of building
simulation. Indeed, it is a considerable undertaking to develop a functional computer model of a thing
so complex as a large building—and this deserves respect—but not awe, as this tends to obscure the
reality and cloud our sensibilities when dealing with building simulation. Better models of buildings
can be made if the "fear" of simulation is dispersed and the practice and tool of building simulation
dealt with like any other mundane tool.
It Must Be Right, It Was Done by a Computer
As a facilities engineer at a DOE national lab, I would have consulting engineers come in to me
and say, "Here's a TRACE output, here's your answer to your building"—the implied statement being:
"it's has to be correct, we did it on a computer." (And you know, if you're not smiling right now, we're
worried about you.) This of course is a lot of "baloney," which is used to advantage in the consulting
business, because to have a final report that most of the people will accept, the more computer
printouts that are in it, the more readily the report is accepted. In truth, that's kind of silly, and if you
want to do good models of buildings you should be smart enough and astute enough to realize that just
because it went through the machine, doesn't mean that everything is correct. The computer printout is
only as good as the engineer that created it.
Only "Certified" Programs Can Be Trusted
Another misconception is that only "certified" simulation programs can be trusted. For example,
at one point a large utility company took the position that you could only use a program certified by
the State Energy Commission to prepare energy savings calculations for their rebate program. The
problem with that was the fact that most simulation programs and the processes of certifying the
programs are oriented towards new construction. Unfortunately the retrofit world is entirely different
from new construction! A program that does a good job for new construction will not necessarily do a
good job for retrofit. To be specific, whatever program you're using, BLAST, DOE-2, TRACE or
whatever, it cannot possibly model in an "automatic" and precise way all the possible temperature
control variations that you can run into in a real building, whether the variations are designed in or
have occurred by accident. One building we encountered had an HVAC air-side system that was a
combination of multi-zone, variable volume and high pressure induction—all in a single air handling
system! Just try to look this one up in the user's manual for your simulation program and you can be
sure it won't be there.
So from my point of view, every program that's out there is flawed. There are no good programs.
They're all terrible. At the same time, I think they're all great because I think you can do a good
computer model with literally any piece of software that you use, if you understand the program, and
if you understand the building and you critique the output. That's what this book is all about.
As a final point, because the results achieved with any program are so strongly dictated by how it
is used, I believe that a very strong case could be made against the entire concept and process of
"certifying" any programs. In truth, the certification of building simulation programs is very possibly
(likely?) a manifestation of government agencies naively and ignorantly attempting to eliminate risk in
for their energy efficiency funding programs whereas "risk" cannot actually be eliminated by
regulation. This is a bit like the M&V programs developed for the various utility DSM programs that
were also "feared" to not produce actual savings—so a "safety" net had to be (foolishly) developed.
Computer Simulation Is a "Joke"—
It Can't Predict Actual Energy Use, It Can Only Indicate the
Difference in Use between Different Building Design Scenarios
It's a lot of work to gather the needed information (as we'll see later on) and build critique and
calibrate a good building model. The problem, I think, with this is that it is enough work that many
(most?) people doing building simulation are inclined to short-cut the process. An indication of this
are the trade and technical association articles of the past which compared programs and/or various
practitioners simulating the same building side-by-side—with the outcome of widely varying results.
The conclusion generally drawn was that the whole process is extremely unreliable and capricious,
and that it therefore could not be trusted. (this is sort of the opposite of the "marksmanship" revealed
by the ASHRAE "shoot out" mentioned in the Introduction).
Compounding this is the fact that the programs were mostly developed to simulate new buildings
where an absolute result was not expected and only comparative results were expected.
The truth is, very accurate models of new and existing buildings can be developed, but need to be
done with that intent in mind and using the sorts of techniques described in this book.
Furthermore, comparative studies are an important use of building simulation, particularly energy
retrofit), but these are not valuable if the "base" model is grossly inaccurate. If the base model
estimates twice the energy use for cooling than is realistic, then a comparative simulation will likely
show a reduction that is also twice what is realistic as well.
So, building simulation is only a joke if you as a practitioner make it a joke.
Only Programs That Use 8760 Hours of Weather Data Can Be
Trusted
Here's another good one, "Only programs that use 8,760 hours of weather data are valid." If you
look into the NOAA (National Oceanographic and Atmospheric Administration) TRY (Test Reference
Year) tapes and TMY (Test Mean Year) tapes, you'll discover that a lot of people using these weather
tapes with the DOE-2 program don't actually know what the tapes really contain. The users frequently
believe that they are real weather data. However, what they really are is amalgams of many years of
data. For example, the TRY tapes are actually 12 individual months of real data, but they are 12
months from potentially 12 different years! That's not really a "year's" worth of data. As I understand
it, the way they build the TRY tapes is to take many years of data, and look at the month of January,
then throw out the warmest and the coldest, throw out the warmest and the coldest, etc.—and what
you're left with is a mean month for the month of January, February, etc. The result is that the process
just eliminated the extremes of cold and hot. So, having 8,760 hours of data is a false security. The
TRACE program, like many other, uses a typical 24 hour weather profile for each month of the year. I
think that is as accurate of a method as you need.
As further discussion, when doing energy analysis you're really not worried so much about
design conditions as you are concerned about average conditions, because a ''design" day only occurs
a couple times during the year. When doing energy analysis we are concerned about all those
intermediate days that make up the bulk of the year. Those are the hours that you have to figure out
how to save energy. For example; double-duct air handling systems waste a lot of energy, not on the
coldest day of the year, nor on the hottest day of the year, but all the days in between. So doing energy
analysis is really an average process, and that's real good, that's why the NOAA tapes were created.
But having someone like a utility company take the position that goes: "Well, we've got this real 8,760
hours of weather data, so therefore we can trust that to give us an accurate kW demand number," in the
terms of calculating savings, is a very false conclusion to draw. It is also important to remember, that
in the energy analysis process, we are trying to predict the likely annual energy savings to be achieved
by a retrofit project. Since we cannot predict what the future weather will be, the very slight possible
advantage that 8760 hours of weather data might provide will be to no avail since we cannot predict
what the future weather will be. As will be discussed in the next chapter, the question "how much
energy are we going to save?" is probably a 5 to 10% question, and only needs a 5 to 10% answer, not
a 1% answer!
Again, the design process is different than the energy analysis process. If you design a HVAC
system, you've got your engineering company's financial liability on the line to provide adequate
cooling and heating on the worst day of the year. When I wear my "design hat," and I'm putting in a
new HVAC system, versus wearing my "energy engineering hat," I have two different problems that
I'm dealing with. When I wear my "design hat," I sometimes create some small energy problems,
because I know that if the customer isn't cool one hundred percent of the year, that he'll be mad—and
possibly sue. Sometimes I wish I could come back and visit my own projects a couple of years later
and say, "Would you mind paying me a little more money and I'll take out all that excess power that I
put into your water pump because it's costing you too much energy, because you wouldn't pay me
enough money to do that while I was in the design process?" We try to blend energy engineering and
design engineering both together but it's not always possible. You work with pre-established budgets
when you're building a system. And when you're doing energy retrofit you are essentially creating the
budget. If you can find the opportunity to save energy, you can probably get the money to do the
retrofit.
One of the "traps" inherent in this natural "conflict" between the objectives of design and energy
engineering is that the energy engineer stands to lose credibility when they ignore or bypass energy
efficiency opportunities when doing design-oriented work. Indeed, energy engineers must be very
light on their feet when going back and forth between the sub-disciplines, because clients sometimes
assume that when the energy engineer is doing a design job, they are automatically doing an energy
analysis. That's not necessarily the case. Energy engineers have to communicate very carefully with
their clients and tell them: "We want you to understand that there are some things that we're not going
to do here because you are not willing to take some risk and want to only pay for an ordinary design."
It's real important to communicate in this situation and the energy engineer is facing a big potential
drawback when doing ordinary "design" work.
Weather-Dependent Loads Are "Critical"
Another very prevalent myth is that the "weather-related envelope loads are critical." People
like utility commissions and state energy agencies are concerned about making buildings more energy
efficient. And if you look at a small simple building, like a single-family residence, the envelope has
to be dominant because the internal loads are not that great, and the HVAC systems are not that
sophisticated. But most of the readers of this book are not going to go out and retrofit private homes,
because there is virtually no money in it. There's just not enough bucks. Throughout most of the U.S.
we can't even get residential air conditioning designed when it's being first built, let alone go in and
retrofit a residence. If you look at just about any set of plans that comes out of any residential builder,
you'll find say 50 sheets in it for three models that they are building, of which thirty-five sheets will be
architectural, 10 sheets of structural, and you'll find a couple of sheets of the different elevations that
they'll sell you for the building. In addition, you'll probably find one sheet of electrical for each "plan"
that shows where the outlets go and you'll usually find zero mechanical sheets in that set of plans.
Everybody's worried about the roof, the walls, windows, doors, sheet rock, toilets and the sinks, etc.,
but we can seldom get the architects to hire anybody to do HVAC design in residential construction.
So there's no money in residential. If you get into bigger buildings, (which is what we're going to be
dealing with mostly in this book) we're talking about buildings that have high internal heat gains
because they've got computers and lights and processes going on in them, and they probably have very
sophisticated HVAC systems which basically can run amok and cause energy consumption to go
through the roof. In buildings like that, the envelope is really almost unimportant. It is the rare larger
building, where the envelope load is critical.
Unfortunately the large majority of the folks who are involved in regulating the energy efficiency
of buildings are, for the most part, very ignorant about what really happens in buildings as regards
actual energy use. Sorry if your bureaucratic "ox" is being gored here, but the people who actually
want to see things happen don't take jobs in government, they actually work in the field.
Compounding this problem is the fact that the energy commissions, utilities, etc. who "manage" a lot
of the regulatory side of building efficiency hire their research and development "experts" in their own
image and wind up in a situation where the "expert"'' is simply feeding back results which "match up"
with the regulators' notions of reality. Sorry that this may be insulting to some readers, but we've been
there on both sides, and this is the way it almost always is, be it Federal, state or local regulators
and/or administrators. It seems that Dilbert isn't kidding after all.
Furthermore, there are folks in the research side of the building simulation business that think
that doing an hourly simulation isn't good enough—that we ought to cut it down to thirty minutes or
fifteen minutes because we're not simulating those envelopes load quite right. That might by okay, for
the energy commission to worry about weather-dependent structures such as residences, but for bigger
office buildings or hospitals or something like that, forget it. The envelope loads are not that critical in
these facilities.
Residential New Construction Design Mythology
In our building simulation seminars we've been asked why it doesn't make sense to put money
into residential design and/or retrofit. In truth, this is almost like a cultural or historical question. We
consult with a mechanical contractors' association as the association's technical advisors. Most of their
members are sheet metal contractors who do residential heating and air conditioning, and they don't
even design the systems, even when they put them in themselves. I think this is just been a tradition in
the business. Building single family homes 10 or 20 years ago was simple enough. Every home had a
big crawl space, a nice generous attic, and the mechanical contractors back then could adequately size
the equipment and lay out the duct work without actually going through a formal design process to do
so. Price wasn't as big an issue and construction cost wasn't as big an issue 10 to 20 years ago. Since
that time, our experience is that developers have become sort of crazy about cost. They will spend
money on a marble countertop because they know they can sell that to a customer. By contrast, the
HVAC system is hidden away, and nobody can see it. I've seen builders choose a "mom and pop"
contractor, operating out of their garage, over a professional mechanical contractor to do the HVAC in
a half million dollar home because there was fifty dollars difference cost between one contractor and
another. And if they are worried about fifty bucks in direct construction cost, they won't even consider
spending any money on doing the engineering. We have sat down with at least three builders over the
last five years who said they were interested in doing HVAC design. We made proposals to them and
said, "Okay, we'll design your HVAC, but we want to be there in the beginning with the architect." But
to a man these builders insisted that they couldn't afford to do the work this way, that we had to start
with the finished architectural plans. We've had architects hand us finished architectural plans on a
project ready to go into construction that actually showed the water heater flue coming up through the
middle of the upstairs bathroom, and they said: ''Oh, we'll work that out during framing." Our response
was: "You've got to be kidding?," and as a result, we've never gotten a single builder to actually take
the design of their HVAC systems seriously, even though they complained of excessive homeowner
complaints and lawsuits.
And trying to fix the problem following construction isn't any easier, as it's too expensive to go
back in and retrofit most residential buildings. Even a bad operating HVAC system in a residence
doesn't use that much energy, because the air handling systems don't mix heating and cooling, static
pressures (and resulting horsepower) on the fans are not very high, and many homeowners in may
parts of the country leave their air conditioning off when they go to work and then come home at the
end of the day flip it on, run it for three or four hours and that's it for the day. The problem is that
there's not much savings you can generate for the amount of capital you have to have to do the retrofit.
It's kind of like asking a brain surgeon to trim toenails. The economics don't match up. Now the
residential market could change, but it would have to change from the very highest levels. You would
have to go and meet with the National Association of Home Builders, talk to their president and say, "I
think you guys are missing the point. I think you could sell upgraded high energy efficiency, high
comfort HVAC systems, but you'd have to design it, and you'd have to test it after it was installed."
And so far there hasn't been any interest in doing any of that kind of stuff. We haven't found a builder
yet that wants to have their HVAC system designed in any way, shape or form, or who wants to do any
commissioning or testing or any certification of their HVAC systems at all.
The only small "ray of sunshine" has been utility company rebate and incentive programs.
There have been programs where they will give you a rebate if your duct system passes a leakage test
where they use a blower, and come into the house and pressurize the building, they pressurize the duct
system, and they actually run a leakage test. Unfortunately these programs have been very weak and
they have tend to be short lived. In addition, Fannie Mae offers and "energy efficient mortgage," but it
takes a really astute builder, in league with an astute HVAC contractor to make this work—but such
builders and relationships are few and far between.
Search for Reality
As we proceed through the following chapters we will try to bypass these myths and deal with
the down-to-earth truth about real buildings and building simulation and how to do it.
Chapter 3—
Accuracy and Selecting a Tool
Just as there are many myths surrounding building simulation, there is similar lack of consensus
about just what constitutes an "accurate" simulation of a building. Most of these notions tend to be
pretty academic, so we will attempt to establish a pragmatic, practical and functional definition of
what constitutes "accuracy" and assist practitioners in deciding what level of accuracy is apropos in a
given situation.
Definition of Accuracy:
Now we'll tell you what we think an accurate building simulation is. We believe that it's
comprised of a number of parts.
• Number one, your model annual energy use ought to be within 5% of the actual recorded
consumption, as established by invoices from the utility company, or measured energy use. For
example, if you're at Utah State University and you're studying one building on campus, you might
have a steam condensate meter (because they have a central steam system at Utah State) and maybe an
electric meter on the building. Now, during your simulation, if you can't get within 5%, your probably
not a very good building modeler. Now if your in a hurry, and you know you don't have time to make
it right, 10% is probably an acceptable goal. But, if your going to take the time to do a model well,
you should be able to get within 5%. That should be your goal if your going to consider yourself a
good building simulation practitioner.
• Secondly, your seasonal energy use profiles should match. If you plot out month by month for
the year, the kilowatt hours, therms of gas consumption, and pounds of steam, or whatever, this profile
should be very similar. We'll discuss some detailed analysis of these profiles later in the book (Chapter
7).
• Third, if your doing a big building, you should take the time to see that the daily energy use
profiles match. If you're modeling a little 10 or 20 thousand square foot building, your certainly not
going to have 15 minute demand interval record printouts from your utility company. However, If
you've got a larger building, say 50 thousand square foot on up, you probably can get a demand
interval record from the utility company that goes back maybe a whole year or more. Or you can
install your own recording meter for a short period, perhaps a week or two. If you're doing a good job
of building modeling, your hour-by-hour daily energy use profiles that show when the people come in,
when the HVAC starts up, when the lights turn on, when the lights turn off, etc., will match quite well
between the model and the actual recorded data. This detail of modeling, for example requires
answering the question: "Do the occupants turn the lights off or do janitors turn them off?" Usually it's
the janitors more often than not—or, perhaps they don't get turned off at all!
• Fourth, the end-use energy consumption is faithfully allocated. Sometimes this may seem like
an impossible task. Some people will say, "Well, you know I can't monitor the building, it's too
expensive and time consuming." Others will say, "I've got to instrument the building for a year so that
I can do a good model." The truth is right in the middle. As we'll discuss later, even a single data point,
say for a chiller, can be used to calibrate the model quite well.
To conclude our discussion of the definition of accuracy, it's good to additionally put the
question of accuracy into perspective. Specifically, I don't think you need a 1% answer to a 10%
question. Frequently I will look at a situation where I am doing some sort of a calculation to either
size a pump, or size a power supply or something like that, and rather then spend a half a day or four
hours doing a bunch of calculations, I'll ask myself, "Well, what is the range of the possible answers?
Is it a one inch pipe, a two inch pipe or a four inch pipe, or something like that?"
I'll just try a couple of quick hypothesis which defines the range of possible outcomes. It may
turn out that no matter which hypothesis I use, it produces the same end result, such as needing to use
a four inch pipe, because a three and a half is not available and the three inch is so much smaller that a
four inch pipe is needed because all the possible answers "fit" the four inch pipe solution. So
sometimes you really need to look at what the question is that you are trying to answer, and what is
the appropriate solution. As a simple example, some practitioners in the field of building simulation
"look down their noses" at anything less than a DOE-2 simulation—as though anything less is just not
acceptable. However, sometimes there just isn't enough time in the project to build an exquisite
DOE-2 model, nor is that level of ''accuracy" needed at times.
As will be discussed in some detail later, we have used a spreadsheet simulation model with
very good effect. In one case we modeled a 100,000 square foot office/ R&D/ manufacturing facility,
based on field survey data from the service contractor and a 1 hour walk thru. The task included
building and calibrating the model, simulating three different retrofit measures, writing and publishing
a modest report on the effort. The total elapsed time from start of the modeling to mailing the report
was 5 man hours! This was a fairly complete model that agreed with the utility bills within 5% on
electric and 10% on gas. You can't even do the input for a building in DOE-2 in five hours.
Picking the right tool that matches the question means that if you have a big building, you
probably want to do a TRACE or a DOE-2 run. If you've got a building that your thinking about
putting a lot of money into, you will want to do a lot of field survey measurements as well. But if the
project involves six small pre-fab structures at a school district facility, it may be that you want to go
through and do a much less rigorous analysis that will facilitate a quick decision on the part of the
owner.
It's hard sometimes to make those decisions regarding the rigor of a study and which type of
simulation tool to use, but it is an important decision to be made in the process of doing a building
simulation and it's best not left to default. Management and execution of the process is what this book
is all about.
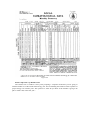
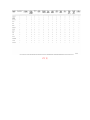
Finally, Figure 3-1 is an accuracy checklist, which can be used while working on a building
simulation as a reminder of the various accuracy checks which can be made. This checklist will be
discussed below in some detail.
__ Building Survey adequate knowledge of building occupancy & use?
__ adequate knowledge of building occupancy & use?
__ adequate knowledge of HVAC function & use?
__ measured/ accounted for all electrical demand?
__ Simulation Program
__ adequate documentation?
__ adequate experience/ knowledge of program?
__ Output Critique
__ thermal loads check?
__ annual energy use checks?
__ annual profile checks?
__ hourly profile checks?
__ retrofit simulations make sense?
__ overall savings level is plausible?
Figure 3-1
Accuracy Checklist
Accuracy Checklist
In order to achieve an "accurate" simulation, numerous steps must be taken. These are identified
in the accuracy checklist and will be discussed briefly as follows:
Building Survey
The building survey is number one. If you don't know the building, you can't possibly model it.
You can't model a building you don't know personally, and to trust in somebody else's survey data is
risky at best. If you do use someone else for the survey, you better know the person and understand
their weaknesses and limitations. We've had supposedly expert survey technicians, for example, go out
on a survey who we later learned did not understand how to put an ammeter on a piece of electrical
wire to take a reading. They really didn't understand what they were doing, so the data they gathered
was worthless. From the building survey we gain knowledge of the occupancy and use of the building,
how it is constructed, what types of HVAC systems are in use and how they are operated, other
building operations, such as cafeterias, print shops, computer rooms, etc.
Simulation Program
The simulation program is one of the three parts we need to be concerned about when
considering accuracy. Do we have enough information on the program itself and have we used it
enough that we can actually make it work? This is a key point as I would rather have an engineer
model a building using a spreadsheet that he knows well rather than force him to use something like
the DOE-2 program that he has never used before, because I would get a lousy result. So one of things
you've got to be careful about, if you are creating standards for consulting engineers to work on your
facilities for example, is that if you make them use a tool that they are unfamiliar with, you might need
to share in the responsibility if the final results are not so good. Again, this book is about the process,
not software.
Output Critique
Briefly, we need to check the thermal loads (peak heating and cooling loads), check the total
annual energy use, check the annual energy use profile and hourly energy use profiles, and check
retrofit simulations (to see that they make sense). Overall, we need to see that we are not predicting
that after the retrofit work is done, the computer thinks that we'll be "sending energy back to the utility
company" (don't laugh, later in the book we'll discuss Fortune 500 ESCos who have made this exact
mistake!). In other words, after we finish our retrofits is the building still using a reasonable amount of
energy for the type of building that it is? It's real easy to over "cook" your estimate of savings and say
you're going to save a lot of money and it turns out that you've got this high-rise office building that's
never going to get down to thirty thousand Btus per square foot per year—though an elementary
school might.
Picking a Simulation Tool
It is likely that a wide range of opinion exists in the energy engineering field as to what
constitutes "building energy simulation." Our view is a rather broad one and encompasses a wide
range of calculational strategies as being appropriate to specific project goals and project
environments.
"Mainframe" Programs
The high end of the practice are programs that have traditionally run on mainframe (or mini)
computers. Both proprietary and public-domain programs of this type are in common use. The
availability of such programs to run on high-end personal computers has become virtually universal.
In general these programs have similar, if not common, ancestry and are founded in hourly heating
and cooling load calculations that are then applied to the HVAC systems and plant equipment
described to the program. These programs are very powerful simulation tools in that they allow for
detailed input of both the envelope and the lighting and HVAC systems employed in the building, and
produce excellent results (as shown in Figures 3-2 and 3-3). In addition, these programs also provide
extensive output data for use in output critique. While very powerful, these programs require
significant engineering labor to prepare the data necessary for input (often 40 to 80 engineering labor
hours) and are sometimes too costly for use on smaller buildings or for use in the qualification of sales
prospects in the energy retrofit business. To meet the need for less costly simulation methods, we
developed some spreadsheet-based simulation tools that have proven to be very effective.
Complex Spreadsheet Simulation Tool
One of the spreadsheet-based tools developed is a complex spreadsheet that allows time-related
loads to be scheduled by hour, by three day types (Weekday, Saturday and Sunday/ Holiday), by type
of energy used, or by type of functional energy use (cooling, fans, lighting, etc.). In addition, the
calendar of day types for the model year can be customized to cover virtually any situation. With
respect to weather-related loads, the model takes a totally different approach than "mainframe"
programs. In this case, the program accepts peak loads as inputs and distributes the loading over the
period of a year according to the differential between the modeled ambient temperature and user-input
"no-load" temperatures for heating and cooling. Other variables include heating and cooling lockout
temperatures, minimum loads, and daily and seasonal operating schedules. The model calculates
hourly ambient temperatures for application of the loads by using a near-sinusoidal model and varying
the temperature up or down from the average temperature by half the average daily range. The model
utilizes as input degree-days and average daily range by month, or average maximum and minimum
temperatures by month. The model provides hourly heating and cooling loads for typical day types
each month and hourly time-related loads for typical day types each month.
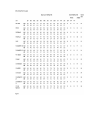
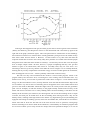
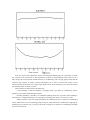
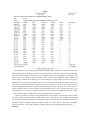
Figure 3-2
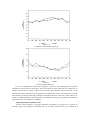
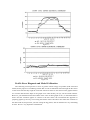
Courthouse/Admin. Bldg. Electricity
Figure 3-3
Courthouse/Admin.Bldg. Gas
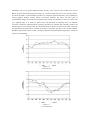
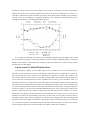
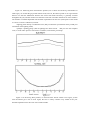
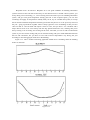
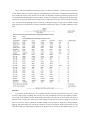
As can be concluded from observation of Figures 3-4 and 3-5, this modeling tool can produce
simulations of high accuracy and requires only a few hours for input generation and model runs. In
addition, because there is great control over the model, many different retrofit measures can be
modeled and custom simulations can be produced by modifying the code or extracting output from the
base building model and performing subsequent calculations thereon. This tool is most effective on
smaller or simpler buildings, where a high level of confidence in energy-savings figures is desired but
engineering costs must be kept to a minimum.
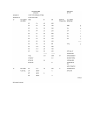
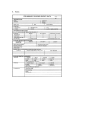
Simple Spreadsheet Simulation Tool
Another tool developed is a one-page simulation spreadsheet. Its purpose was to provide an
extremely quick and inexpensive simulation tool for use where limited accuracy is acceptable and
simulation costs are of greater importance than accuracy. Two versions of this model exist, one for
HVAC systems that mix heating and cooling (e.g., terminal reheat) and one for non-mixing systems.
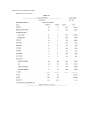
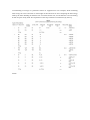
As shown in Table 3-1, this simulation tool has very simplistic input and basically views a building as
having lighting, heating, cooling, HVAC accessories, domestic hot water, and two types of
miscellaneous energy use (electrical and heating fuel). Inputs are generally in units per square feet
(e.g., lighting input is in watts per square foot) and percentage of operating hours. In addition,
provision is made for reduced summer operation (primarily for schools) and "off hours" loads in all
functional areas. Time-related loads are calculated based on "hours on" times input loads, similar to
the spreadsheet described above, without the ability to customize day types or the annual calendar.
Weather-related loads assume a linear, directly proportional relationship with degree-days, which are
input to the spreadsheet.
Figure 3-4
1777 Electricity
Figure 3-5
1777 Natural Gas
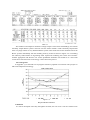
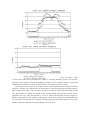
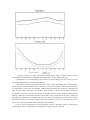
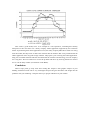
Table 3-1.
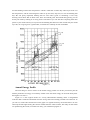
This model was developed to simulate a college campus of more than 100 buildings, all of which
had fairly simple HVAC systems. This tool was also used to model a small community hospital that
had a very large number of very different HVAC systems. This model was used to simulate each of the
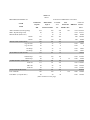
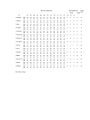
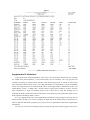
HVAC systems individually with the modeling accuracy results as shown in Figure 3-6. Considering
the relatively small amount of engineering effort required for modeling, the results were excellent.
Another appropriate and attractive use of this spreadsheet simulation tool would be as a first-order
conservation assessment tool in the energy conservation sales process.
List of Programs
In Appendix 1 you will find a list of programs which we prepared in connection with a project we
did for the Department of Energy.
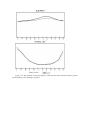
Figure 3-6
Hospital Model Validation
Conclusion
As will be developed more fully throughout the book, the real issue is not the software tools
employed, but rather the professional practices put to use to determine existing conditions, construct
and calibrate the model and employ it to evaluate retrofit options. Whether one uses a "full bore,"
machine or a "pocket rocket," is a matter of the facility being evaluated (simple or complex) and the
end purpose in mind (a guaranteed multi-million dollar project or a quick sales presentation). By
employing a variety of tools the sage energy engineer can select and employ the tool which provides
the greatest value for the demands of the situation.
Chapter 4—
Determination of Existing Conditions
Having surveyed more buildings than I can recall, and having developed a set of practices and
procedures which regularly produces first-run models within 10% of the actual energy use, and within
5% on final calibrated models, I have concluded that thorough on site surveys are the most critical
factor in preparing accurate simulation models of existing buildings. So, what this chapter is mostly
about is on-site surveys.
Purpose of On-Site Surveys
All things considered, there are six basic purposes for conducting on-site surveys, as discussed
in the following.
Determine Building Occupancy and End-Use
The first thing that you should be looking for if you're going to do an on-site survey is
determining the building occupancy and end-use. You go out into an office building and if you don't
know that there is a ''big eight" accounting firm as a tenant and they're running three shifts a day
during three months of the year, you're going to miss a whole bunch of energy use. You may find out
that there's some small data centers. In one building we surveyed, the location of which shall remain
unknown, had a very special tenant in the building, namely the IRS. The IRS, without asking
permission from the building owner, was hiring contractors to come in and tap the electrical bus-riser
going up through the building, hanging transformers right and left and powering up computer rooms
and all kinds of equipment! The building owner was very reluctant to go back to the IRS and say,
"You know, you're violating your lease." This one tenant was using about $60,000 a year above
"building standard" energy use and the owner could do nothing about it—or was unwilling to do
anything about it out of fear. You've got to know if there is a computer room in the building. You've
got to know if there's a parking garage that's part of the building. One energy services company that I
am aware of did a study of a county government center, a complex of buildings in a very well known
city, and they said, "Boy this place is an energy hog, man it's using all this energy, and we've got the
retrofits and all this stuff to fix this place up." When they got to the end of the first year of operation of
the retrofit project they discovered that there was another building that was on the meter that they
didn't realize was part of that bill! The buildings weren't nearly as energy wasteful as they thought
they were. They ended up writing checks to the owner. So, you need to know what's going on in the
building.
Determine Architectural Configuration and Details
You need to look at the architecture of the building. Initially, your going to have some as-built
drawings that you're going to be reviewing, but you need to know first hand whether they've added
reflective film to the windows, whether they have replaced single pane windows with double, or
whether they've put a whole new skin on the building. We did a study at the University of Texas,
Austin They have a dorm there called the Dobie Center, on which they had put a whole new skin. The
original drawings didn't show it, nor were there any drawings in the files relating to this project. You
can't know unless you look.
Determine Electrical/Lighting Configuration and Features
We also need to know what's going on with the electrical and lighting systems' configuration
and features. I've gone into buildings where the lighting has already been retrofitted. It would be kind
of foolish to recommend a lighting retrofit when in fact, you open up the fixtures, and there are
already reflectors in there. Also, we've gone into places like the Penzoil Headquarters building for
example in Houston where two different sets of as-builts showed two different sets of bus risers going
up through the towers. Only one of them was correct—and the locations at which the electrical survey
measurements would have been made were entirely different for each of the sets of drawings.
Determine Mechanical System Configuration and Features
Questions here regard mechanical system's configuration and features. Did they put in that
double duct system that was shown on the drawing? Has it been "cobbled up" by someone trying to
convert it? In one county building the original designer had included Mitco air valves at the reheat
coils. Now these were installed for balancing only, but they are one of the best VAV control dampers
available. It looked like it was going to be a relatively inexpensive retrofit since the most expensive
part, the VAV dampers, were already in place! Unfortunately, at some point in the history of the
building, someone was trying to increase airflow and they removed the Mitco valves to reduce static
pressure losses. It didn't solve the airflow problem, but it sure made the VAV conversion a lot more
expensive! Again, if you don't go out into the building and look, you won't realize that the system has
been retrofitted already.
Observe Building and Energy System Operation
It is very, very important to observe the building and the energy systems in operation. In one
building in San Francisco we observed that outside air was 65°F. The HVAC system first had a
pre-cooling coil that dropped the air temperature down to about 55°F. Downstream they had a high
pressure induction system serving each exposure of the building. Each exposure had it's own reheat
coil which then warmed the air up to around 70°F. Then finally, at the induction unit itself, we had
these little coils in the induction units that would cool the air back down to about 65°F. In other words,
the system was cooling, reheating and then re-cooling—all to arrive at the exact same temperature and
humidity as we started with. When I described this system's operation to the building owner, who was
a bit "salty," he said, "Well that's the s#its!" And I said, "Yes sir, you're exactly correct." The sale was
made in that instant in time. A half-million-dollar retrofit went ahead, because he knew that we knew
more about his building then he and his operating engineers did. And he couldn't believe that he had a
HVAC system that was doing this kind of mixing of heating and cooling. Nothing will make you look
so much like a genius as having observed that which everyone else has been overlooking or ignoring
for years. Nothing.
Take Appropriate Measurements
Knowing the character of the building is not quite enough. As we will see later in the book, we
need a lot of data to actually establish the building's baseline and properly construct and calibrate the
model of the existing building. Except for the most rudimentary of studies, a significant number of
measurements will need to be taken—as will be discussed in more detail below.
Types of Surveys
While it might seem that a survey is a survey. However, considering the risks involved for, say,
an ESCo, who is about to invest potentially millions of dollars in another party's building, there are
potentially as many as five different surveys that should generally be done. The description that
follows assumes more or less a "maximum" scenario for a large building, that's worthy of a very, very
exhaustive and rigorous engineering evaluation and survey. Projects of lesser importance might
receive fewer of these surveys, or surveys of lesser depth—as appropriate to the risk involved. Each
and every one of these surveys may be critical to your particular building, including:
• existing document review
• operator interviews
• observational survey
• middle-of-the-night survey
• measurement survey
Existing Documents
"As-Built" Drawings
This one is fairly obvious. I think everyone realizes that it's good to look at the drawings that
were used to construct the building. We have, however, probably done ourselves all an injustice by
creating the term "as-built" as I have yet to see a set of actually as-built drawings. When I worked at
Wright Patterson Air Force Base we had a building once where there were actually three sets of
originals in the drawer and all three were stamped, "as-built"—yet they showed three entirely different
means of constructing this building. They were still all stamped, "as-built"!
Remodel Drawings
A lot of times buildings have been remodeled or they've added wings on. The Alameda County
Courthouse in Oakland, California, had some light wells that went down through the building. Some
senior administrator for the County evidently made the observation one day saying, "Just put a roof
over that and we can add some more office space." So they did. They also added some air conditioning
equipment and a bunch of lighting and the next thing you know there was more square footage and
more electrical and natural gas consumption. So you've got to watch out for remodels.
Equipment Submittals/Catalog Cuts
Sometimes the equipment submits and catalog cuts can be very valuable if you're messing
around with changing pumps to variable speed, or you want to change a fan to variable speed so, you
might want to get the catalog cuts out and see what the actual submittal was on that fan or that pump.
In particular, for example, if you are going to convert a pump to variable flow, you need to know what
the head is on that pump, and you need to know what the close-off capacity is on the control valves. If
you go to variable flow one way to do it is to close the bypass balancing valves on the three-way
control valves and you now have a two-way control valve. But since the control valve was designed
for three-way operation, the actuator may not be strong enough. Specifically, the spring in the actuator
may not be strong enough to close that valve against pressure head produced by the pump. The pump
head can actually push the valve open and cause flow through the valve even though you didn't intend
it. So, if you're going to do a variable flow conversion, you might have to replace the valve or you
might have to replace the actuator. In one case we had butterfly valves upstream, so we put an actuator
on the butterfly valve and just disconnected the control valve. We turned the butterfly valve into the
control valve. The bottom line is that if you don't have the original submittal on the valves, it may be
very difficult to determine their close-off pressure capacity and you may have to replace valves that
are perfectly fine—but you can't tell because you don't have the needed information.
Test and Balance Reports
Those are almost as good as some of the computer simulations that we get. Too many of them
have been "penciled in" over the years. Sometimes there is valuable information in them if you know
the test and balance company that did the work and their reputation is good. Knowing the airflows for
all the fans, might be very valuable when doing the simulation, particularly when considering a VAV
conversion (see Chapter 8 for more discussion).
Equipment Inventory, Name Plate Data
Some organizations have very good data on their equipment. If you get a computer printout, and
you can trust it because you know the chief engineer has done a good job of putting the data together,
then this can save you a lot of time out in the field. Otherwise you'll need to gather this data from all
the major equipment in the building.
Utility Company Invoices
One of the very first things that you should be doing in a building survey (and we've talked
about this a little bit already in the discussion about accuracy in Chapter 3) if not prior to the survey in
the process of deciding whether or not to study the building, is to prepare energy use and energy cost
indexes. You can't do this without the utility bills. You may not have them until you get to this point in
the process, however, so now is the time.
Sub-Meter Data
Frequently building owners will install sub-meters to monitor the energy used by large tenants,
computer runs, etc. For example, the Penzoil Headquarters building has a huge computer room in their
side of the building. It's electrical energy use is worth something like $72,000 a year. The meter is read
every month and is a valuable piece of the energy information you need to know to properly model
that building. We've also found sub-meters that were not being read correctly (see Chapter 5).
Tenant "After-Hour Air" Requests
Gerald D. Hines Associates, one of the largest property owners and managers in the U.S., for
example, is one organization that bills back their tenants for after-hour use of the HVAC systems.
What they do is they have a building standard, like a 7:00 a.m. to 6:00 p.m., for operation of the
HVAC systems. If you as a tenant want "after hours air" (i.e., HVAC operation outside the building
standard hours) you have to request it in their buildings. So it might be very helpful to find out how
many months or days per years and how many HVAC systems in the building are running extra hours
beyond the "default" schedule. Every building simulation program that I know assumes that the
HVAC runs to a fixed schedule. The reality is that the schedule might change every day. If you don't
get this data about after-hour air requests, or some other information, you're going to be doing a lot of
guessing. Sometimes, however, guessing is all you can do.
Demand Interval Data
While the use of mag-tape meters is declining over time, in many larger buildings, the utility
company will have a demand interval printout from their mag-tape meter, showing the actual electrical
demand for every 15 minutes for the past year or two. This record can show exactly when the building
is occupied, when the HVAC systems come on and when the lights go off. If your building doesn't
have such data available, it may be wise to set your own temporary meter, even if only for a few days
or a week (see discussion on measurement surveys below).
Automatic Temperature Control Drawings
Sometimes these are real helpful because they tell you what somebody thought the temperature
controls were supposed to do and maybe it will tell you what pieces and parts are there (or were there
at one time). Sometimes they're helpful, sometimes they're not. They're better then not having any
information at all on the control system.
Building Automation Systems Point Logs/Historical Data
Generally building automation systems can provide you with a log of all the points on the system,
and provide you with a history on some or many points, say perhaps the chilled water supply
temperature for the past six months. This sort of information can often be of varying quality. If
nothing else, the point logs will possibly tell you how many HVAC systems there are in the building.
And if you're going to improve or upgrade the building automation system, it will give you some data
to work with to go in and say, "Okay, I've already got all these temperature sensors that are wired into
somebody's control panel, can I reuse them? Can we upgrade this manufacturer's product to a better
product?" But mostly it's going to give you an idea about what is already under the control of the
existing automation system, with the result that this information may help you to establish retrofit
costs more accurately (by taking into account what's already installed/ reusable).
Operating Logs
Operating logs can vary in quality and informational value as well. If you've got operating
engineers that take good logs, that watch the chillers, that record run hours, etc., this can be very
helpful. I've actually used this data to calibrate my chiller plant modeling on a hospital where the
operating engineers recorded the chiller run hours on a daily basis. I looked at the monthly logs to see
how many hours each chiller ran. Next I did a simulation of the building and analyzed the load profile
to determine how many chillers the simulation said would be running, and converted this into
operating hours per month for each chiller. I then compared this to the hours logged by the operating
engineers and was able to conclude that I had a very faithful model of the chiller plant operation—just
from comparing modeled to actual chiller operating hours per month. What was critical in this
example, was that the simulation program did not provide an output of operating hours per month, but
the output was easily converted by hand to such a format—which could be compared to reliable
factual data.
Operator Interviews
I think it's always good to talk to the building operators. Just like the temperature control
drawings tell you what somebody thinks the temperature controls are supposed to do, the building
operators will tell you what one person thinks the whole building is doing. These "operators," by the
way, consist of a number of people who "operate"the building.
Building/Facility Manager
You can talk to both the building or facility manager. You'll find out about things like
"over-time-air" requests from tenants, special facilities (computer rooms, cafeterias, etc.), sub-meters,
special operating conditions (three shifts during tax season, etc.) and that sort of thing.
Operating/Maintenance Engineers
Talking to the operating engineers will tell you what they're doing with things like time clocks in
the building. Maybe they forget to reset them when daylight savings starts, maybe they pull the pins
for the months of January and February and let everything run 24 hours. If you were showing up in
June and you heard that from the operating engineers, you'd probably trust that because that's an
over-action they are taking. That's some good information. Sometimes you get some bad information.
I always talk to the operating engineers, and I always listen to what they have to say—and then I
always go out and verify it for myself. They kind of point the way to the issues that you need to be
concerned about, even if the information they provide is sometimes unreliable in and of itself.
Janitorial Supervisor
The Janitorial supervisor can tell you if they control the lights in the building. If they turn out the
lights at the end of the day, they can give you a good idea of when their crew goes off duty. When I do
my nighttime surveys, I like to go outside the building and look at the building periodically during the
evening to see overall how much of the lights seem to be controlled by the janitorial crew. Sometimes
it surprising. Sometimes everything stays on until 2:00 in the morning and then the lights will all turn
off at once. And you wouldn't know if you weren't there to see for yourself!
Service Contractors
Occasionally you'll find a service contractor that will have some good records on a chiller rebuild
or one thing or another about the building. In one building where the chillers had been let go and not
maintained properly, the service contractor knew about it, and was able to tell us information about the
chiller, and said, "This chiller is not viable, it really can't be used and needs to be replaced." That was
an important part of that particular project.
Tenant Office/Operations Managers
Sometimes you'll have very large tenants in large commercial office buildings. An example is the
Penzoil Headquarters Building, in Houston. Gerald Hines Interests ran the building, Penzoil occupied
the one tower, and the Zapata Corporation occupied most of the other tower along with a few other
smaller tenants. In essence, two very large tenants operated and lived in that building. So it's real
important to understand what those tenant people thought was going on and what their demands and
expectations were. Then again, some of this information is not necessarily "solid," but it can be very
helpful to have and may explain other information you gather from other sources.
Observational Surveys
I think that a lot of people think of a building audit as gathering data. By contrast, I tend to think
of a survey as being primarily observational—to be kind of like Sherlock Holmes who is snooping
around just listening to things, watching things, walking into the building at 2 o'clock in the morning
and saying, "Why do I hear air moving when the chief engineer told me that he shuts everything down
at 6:00 p.m.?" In one building, the rushing air noise that I heard was a "white noise" sound system. In
other buildings it was the HVAC that was still operating even though it wasn't supposed to be
according to the operating engineer.
Building Familiarization/Confirm Floor Plans and Architecture
Generally, to accomplish this task we just do a walk around the place. We get the chief engineer
and/or the building manager to give us a tour so we can figure out how many floors there are, where
are the mechanical rooms, the electrical rooms, etc., etc. And part of that is confirming the floor plans
and the architecture. Is the building built according to what is shown on the as built drawings—or is it
built in some other fashion.
Confirm Single-Line Electrical and Plan Electrical Measurements
Frequently it is important to confirm the single-line power distribution in the building so that you
can later come back and take electrical measurements. I've mentioned the Penzoil Building. We did a
study on that building and in the process we ended up taking 6,000 electrical readings. We measured
every electrical panel, every motor control center, ultimately including about 95% of the power that
was being used in that building. While we felt that we needed the data for our building simulation, it
was very valuable for the energy services company that we were working with because they weren't
making their guarantee and we came back a year and half later to troubleshoot the project and did
those same 6,000 readings again. We were able to confirm, for example, that we achieved 97% of our
projected lighting reduction as identified in the original feasibility study. We also noticed that they had
a 25% increase in things like plug loads, computers, personal computers and copy machines. That was
very valuable. And given the size of the building, it didn't take that long to take those readings. It did
take a little of bit of time to figure out where to take those readings in the first place. So understanding
the single-line power distribution, if your going to take detailed readings like that, is very valuable.
Inventory HVAC Systems and Confirm Location, Layout and Type
It is necessary to inventory the HVAC systems, come up with a count, and find out what parts of
the building they serve. I always like to get 8-1/2-by-11 floor plans of the building, and start
color-coding the floor plans according to which HVAC systems serve that area. Sometimes you find
out that the operating engineers don't know which system serves which areas. I refer to these as
building ''road maps." They are valuable and I always carry some highlighting pens in my briefcase so
that I can do that sort of thing at a moment's notice. And usually I end up with a spread sheet that says,
"Okay, I've got 23 HVAC systems in the buildings and six of them are VAV and six of them are double
duct and six of them are whatever, and what's the fan horsepower, is there a return fan, etc., etc.?"
Once you have that table, now you can start to get a grasp about what's going on in this building
regarding the HVAC systems and you have a ready reference to use in discussions with the operating
engineers—and it should go into the final report. In many of the buildings we've been in, we are the
first persons to prepare such highlighted maps and tables. We frequently provide copies to the
operating engineers and find them on the walls of the engineers' offices still there years later!
Inventory Central Plant Equipment and Confirm Location, Layout and Type
Do you have an electric chiller or a gas-fired absorption chiller.
Maybe you have both, but which ones do they use? In one building the absorption chiller was
dead and they couldn't use it. It's important to know that because the remaining electric chiller was
unable to carry the building and restoring full cooling capacity to the central plant was the most
important priority to the building owner—even though the operating engineers thought that it wasn't
important because the owner hadn't fixed it yet. It seems the owner was looking for something just
like our combined energy retrofit and infrastructure renewal project to do the job! Needless to say, we
sold that project in a hurry. As an additional example, it's also good to know what type of refrigerant
the centrifugal is using, as many owners are moving to abate CFC type refrigerants. Likewise, it
would be a blunder to not have noticed that the old R-11 chillers have already been converted to
R-123—and you wouldn't know unless you happened to noticed the data plate on the chiller saying
that it had been converted.
Inventory Heating and Cooling Distribution Equipment and Confirm Location, Layout and
Type
Many of the best retrofit opportunities exist in the distribution equipment. In fact, with most of
the large thermal storage projects we have knowledge of, the savings from converting the chilled
water distribution to variable flow was equal to the savings from the actual thermal storage system
itself. So, the size of the pumps, whether they are headered together or piped directly to the machine,
whether there's a backup pump, how many pumps are kept in operation when only one chiller is on,
etc., etc., are very important.
Inventory Control Systems and Observe/Exercise the Function
We were up on the roof the other day of a Holiday Inn and there was a whole bunch of roof-top
air conditioning units, with enthalpy economizers. I have yet to find one of these that works. But I
don't like to assume that they don't work. So we looked at all the thermostats, set them to cooling and
went up on the roof when it was 50° outside and all the condenser fans were operating meaning that
the compressors were operating as well. So we knew the economizers were all dead in that building.
Now that was a very quick study that we were doing on that building—a preliminary study at best. But
even for a preliminary study, within twenty minutes, we knew how many of those economizers were
functional, and essentially none of them were functional—and having that information added
immeasurably to the value of our report.
Temperature controls (in my opinion) are where you "separate the men from the boys," if you
would. For example, if you've got a double duct or a multi-zone and you have an outside air
economizer on it that has a mixed air controller, then you're in a sad state of affairs. This is because
when it's really cold outside you're now sending 55° mixed air down your hot deck and you have to
heat all that cold mixed air. Some buildings will lock out the economizer when the outside air
temperature gets that low because they don't want to have that problem. But maybe that lockout is
missing. Maybe that mixed air control is set real low. Those are the kinds of things that you need to
observe. Actually, it can be very time consuming. But you won't be able to do a good model of the
building if don't understand how the temperature controls function. This is a particular weak point for
most consulting engineers because the control industry has intentionally kept the consulting industry
ignorant of the details of controls by essentially doing their design work for them. In addition, to really
understand what controls are doing you have to have a working knowledge of them and not be afraid
to reach into the control panel and fool around with the controls to see how they are actually operating
(which is usually much different that the original designer intended). Again, usually only design-build
engineers or people with HVAC service or controls contracting experience will know how to do this.
If there is anything in the observational survey that is in my opinion is really critical, it is the
control system manipulation and observation.
Plan Mechanical and Electrical Measurements
The final thing you need to do in your observation survey is to plan the measurements that you're
going to take. This should be done while your observations of the building are fresh in your mind and
should include what measurements you want to take, where they are to be taken and what type of
measurements are to be taken (instantaneous, recording, etc.). If nothing else, writing all this down
will give you a checklist to look at before you finish the survey portion of the job and head back to the
office to start "crunching" data.
Middle-of-the-Night Surveys
I've coined this term "middle-of-the-night" surveys. I continue to be fascinated by what I discover
in the middle of the night when I go into buildings. I always find something that is completely
different then what I have been told. At Lawrence Livermore, I'd go out to survey some of the trailers
(they call them trailers there, they are permanent buildings that come in on wheels). They'd put two or
three trailers together to form a sizable office. They would have two or three air conditioning units
since there were two or three trailers that made up the office. But, the result often was that they would
end up with a large room with multiple thermostats in it. Well, one thermostat would be set on full
cooling, and the other would be set at full heating. It was like in symphonic music, "point and
counterpoint." One heating and air conditioning unit would crank up and do a bunch of heating, then
the other thermostat would say, "Time to do cooling!" and it would crank up and do a bunch of
cooling. I stood there one night for nearly an hour just watching the thermostats go back and forth—it
was like a symphony. And you would never know if you weren't there to watch it—and it's not
something you could do during the daytime when everyone was in the offices working away.
9:00 P.M. to 1:00 A.M. Time-Frame
I like to go in late evening, 9 o'clock to 1:00 a.m. I've actually gotten to meet the local sheriff
doing that too, because not everybody knows your supposed to be there and they sometimes call the
cops on you, so you should watch out for that.
Check HVAC
I like to walk around and look at every HVAC system by going into every mechanical room and
see is it running, or is it off? Usually you just open the door, and it's deathly quiet—then, fine, it's off.
Half the time, however, you open the door and everything is running—even though somebody told
you it was supposed to be off. Also checking control modes is good. You may have an outside air
economizer you're trying to check, and it's a little too warm in the daytime to check. So you come
back in the middle of the night and if the system is running, you can see what the outside air
economizer is doing. That will tell you abut the problems that are occurring during the daytime as
well.
Building-Wide Lighting Survey
To tell the truth, you should only check light levels in the middle of the night when the sun is down.
Otherwise on all perimeters areas and even some core areas that have some access to the perimeter
will be influenced by ambient light. So any lighting guy that tells me he took sample light level
readings during the daytime, I don't trust that information. At night you can spot check fixture types
and lamps and light level readings. You can climb on top of peoples desks and make a temporary mess
of their desk when they are not there to complain about you. You can flip things like the HVAC on and
off so that you can see what's going on. We've actually run tests where we wanted to see if we could
do a cheap conversion of a double duct system to a cooling-only VAV. One way to do that is to put in a
damper that blocks off the hot deck completely after building warm-up has been concluded early in
the morning (this only applies to larger office buildings that need cooling nearly all year 'round.) You
can do a test in the middle of the night by throwing some cardboard against the heating coil in the air
handler (on a built-up unit that you can walk into—big building, remember?) and then walk around
the building and see how things are working. When you're done you can shut down the unit and
remove the cardboard. You can get away with that in the middle of the night, but you couldn't do that
in the daytime. You can also check things like the lighting controls. How are the lights being
controlled? You can flip lights on and off, switch contactors off and on and do all sorts of things that
people would start yelling at you for if you did it during the daytime. Tests and procedures that make
noise too, you can get away with those at 10 o'clock or 11 o'clock at night.
Observe Custodial Schedule
You can observe when the custodians are in the building and how they control the lights.
Typically they have the "keys to the kingdom" as regards the control of the lights and this is the time
to find out what they actually do.
Observe Building Occupancy
You should observe building occupancy at night as well. We did a job at the San Jose Mercury
News where they wanted to put lighting controls in the pressroom. The chief of maintenance said they
had people in there all the time maintaining the press equipment. Well we went into the building on
two or three different nights and we never saw a single human being in the pressrooms late at night.
And, to our ultimate good fortune, the big boss happened to bump into us one night when we were
surveying the building. We didn't know who he was at the time, and he "locked our heels" and
interrogated us and found out what we were doing and finally he let us go. A month later, we came in
for the big meeting to sell the project, he was sitting at the head of the table. His people continued to
insist that their maintenance folks were in that pressroom all night long working on stuff and we
respectfully told them we had looked at it several times and never saw anybody in there. And he
believed us—he didn't believe his own people. Because we spoke with authority, we had that real hard
core irrefutable data, and we sold the project.
A very large financial organization that we were doing some work with in the eastern U.S. did a
lot of international business and they worked some odd hours. So it was their practice to run the
HVAC in every part of the building 24 hours a day. The "cultural" assumption in the organization was
that everyone worked these really long hours due to their international business. We did a survey in
that building one night at 10:00 p.m. and there was nobody there. It was clear to us that they didn't
need their HVAC running 24 hours a day at all.
Another last little "war story" about "middle-of-the-night" surveys and the difference between
what you might be told about a building and the actual truth. At the Lawrence Livermore Laboratory,
Building #113, years ago, they had a seismology laboratory on the first floor which required that they
keep the building HVAC in continuous operation (a 100,000 square foot building, with a 1,000 square
foot lab). Now, they removed the lab, so that meant that we should have been able to put the HVAC
back on the time clock and shut it down at night and on week ends. So I was being a good guy, I was
the Energy Manager there at that time, and I sent a little memo over to the Building Manager which
said, "Would you like to re-establish a reasonable schedule for the HVAC? Please check with the
department heads in the building and respond." About a month later they sent a memo back which said,
"We're in here every night and on the weekends, you can't possibly shut the HVAC down." So I called
the maintenance guy down at the shop and said, "Cancel our plans to put the time clock back in
operation, these guys need it 24 hours.'' He said, "Well, I put that time clock back in operation a month
ago!" Those people didn't need that HVAC, but their micro-culture that they were perpetuating did. So
you've got to be careful about taking information at face value.
A final point about middle-of-the-night surveys. They don't take that long. Individually, I've done
half a million square foot building in an evening. You've got to hit it quick with your light meter. Say
it's a building that has two levels that have equipment, (two equipment rooms). So you hit one
equipment room and you look at 12 air handlers, ride the elevator up and get 12 more handlers and
since every floor is virtually the same in this one-tenant building, you can spot check floors for
lighting. You ride the elevator and stop occasionally and go out and you walk around the floor and
take a couple of sample light levels reading, hop on a desk open up a couple of fixtures. Since all the
floors are the same, you cover a lot of ground in a hurry. By contrast, a one story building with lots of
different departments and functions, with 25 different types of HVAC units, will take you a bit longer.
Hopefully you took the characteristics of the building into account when you budgeted the survey in
the first place. Just be sure you do the middle-of-the-night survey!
Measurement Surveys
This is where we get what I call the "hard data." I think that there are things that you should
monitor.
Power Monitoring
You should look at an instrument where it is continuously recording the power consumption. We
tend to use an instrument like a Dranetz 808, it's a fairly inexpensive, pretty good quality machine that
you can rent pretty cheap for about $400 a month. A Dranetz 8000 is even better, but about twice the
price.
Refrigeration
And the kind of loads you might want to watch are things like refrigeration, especially if you
have chiller loads that seem kind of funny. You slap an Advantage 808 on and watch it for a couple
days or a week. Even a week's worth of data will tell you a lot.
Risers
If you want to know what's going on in a building, use that 808. If you've got some feeders that
go up through the building and you can find a big switch down in the basement and can open up the
panel and throw some current transformers on there, just that data for a couple of days will give you a
lot of information about what's going on in that part of that building. You may even (on a small
building) watch the entire building. That is the equivalent of getting a 15 minute interval demand from
the utility company. You can create your own.
Unusual Loads
I've gone into buildings and gone down into the parking garage and found a print shop built on
the lowest level of the parking garage with a 25 ton air cooled air conditioning system. It wasn't shown
on any drawings, and the building manager didn't think to tell me about it because it was "just
tenants." The tenants owned the print shop. It was a huge load. They did their printing in the middle of
the night just like Kinko's does and if you missed that you would have a mistake in modeling that
building.
Whole Building
Then again, you can do the whole building if you want if it's a small building.
Instantaneous Electric Loads
I like to do a lot of instantaneous electrical loads. In fact we recommend that you read 90% or
more of the total building load this way. These readings are made with, hopefully, a digital power
factor meter, reading volts, amps and power factor for every load. See Appendix 8 for our data
gathering form and instructions for taking readings. You'll note that we treat all loads as though they
are single phase loads. It keeps the math simple and avoids confusion in the field. If a wire has voltage
on it compared to ground, we read it.
Lighting Panels
Let's say you're studying an office building. If you go through and basically do your readings on
lighting panels from 8:00 a.m. to 5:00 p.m., you will pretty much catch the panels at full load. It would
be nice if you had one guy go ahead and pull the covers off the panels and then the next guy comes
along with an instrument and you just read them and go back through and put all the covers back on.
Power Panels
If you go down into the basement, and find the main switch and there is this power distribution
board, you can read each one of those panels. And again, part of the idea of modeling is to apportion
energy properly into it's various uses. You may find in buildings that use 480 volt power, that the
lighting is all 277. And then perhaps they will have segregated the lighting to the floor lights, so they
will maybe have a lighting riser that goes up and feeds a whole bunch of lighting panels, one per floor,
then they will have another riser that feeds 120 volt transformers on every floor or every other floor.
Well then, you can go down in the basement and in five minutes take two readings and find out what
the "plug" load is versus your lighting load. Two readings and you now have a big piece of that pie
that your trying to put together.
Motor Control Centers
I think it's great to flip open all the doors on a motor control center and just go through and read
every one of the motors. What you will find about induction motors is that the power factor can
change dramatically depending upon how much the motor is loaded. If you watch the amps on a
centrifugal chiller, you will find that they never go below about 40% full load amps. Because with no
load on that chiller, the power factor so bad it's still pulling 40% amps even with virtually no load at
all on the motor. That doesn't mean it's doing 40% of it's work, it's doing no work, so if you only
measure amps on rotating equipment you're going to be very inaccurate with your readings. With
lighting fixtures you're okay. Even with fluorescent fixtures you'll have a .98/.99 power factor, so
measuring amps alone would not introduce much error.
Computer Rooms
All the computer guys used to tell me, "Oh, we power down at night." I started putting a
recording meter on every computer room I could find. I never saw one of them power down. Big
computer rooms just run steady. If you want to you can put your power monitoring instrument on the
computer room, or you can just go take an instantaneous reading. An instantaneous reading is
probably just as good as anything you'll get.
Other Process Loads
You know that print shop? You may want to put monitoring equipment on the print shop power
supply to see just what it's operating schedule is really like and how much power it's consuming. At
the Chronicle and Examiner in San Francisco, we found that the air compressors in one small room
used more energy than any other function in the building—it was quite amazing and makes the case
for monitoring odd process loads. If they're power consumption is fixed and the schedule is well
known, then an instantaneous reading will suffice.
Mechanical Measurements
There are many mechanical parameters that need to be confirmed in order to build a proper
model of a building.
Airflows
If it is a big building, you may actually want to measure airflows on larger air handling systems. I
have found in large buildings that the air side systems are frequently oversized. I had a little conflict
once in this regard when I was teaching some in-house seminars for an energy services company. They
had their own in-house air balance specialist, and I mentioned that most of the buildings that I have
surveyed were "over-air" and he quickly objected saying, "You couldn't be more wrong, most
buildings are under-air." It turned out we weren't in disagreement, he just mistakenly assumed that I
used the term in exactly the same way he used it. He was comparing his readings to what the design
drawings said. He never found an air handling system that produced the air that it was supposed to
produce according to the drawings. What I was comparing was actual airflow readings versus what the
building really needs. I have found that very frequently large buildings, especially older buildings,
were over designed, and were pumping out 1.7 cfm per square foot and only needed maybe 1.2 cfm.
Talk about a VAV opportunity! Imagine the "magic" you can create in a building like that! So in bigger
systems, it might be very helpful to take some airflow readings. If you've got a good test and balance
company they can come in do this kind of stuff for you rather quickly, reading out total airflow, fan
and motor nameplate data, fan speed and static pressures—they can even check total airflow under
return and 100% outside air modes of operation. Again, it's not something you do on a 10,000 square
foot building.
Temperatures
Just take some thermometers with you, and put them in the ducts. For example, on reheat HVAC
systems, I'll go to the air handler and I'll measure a supply air temperature, say 62°. Then I'll go out
and I'll spot check four or five offices, hopping up on a chair and putting the thermometer in the
discharge grill to see what the supply air temperature is after the reheat coil. If there is some
opportunity to save energy, what you'll find is that the temperature reading at every zone you check
(even a zone that is on the South side of the building that should be calling for maximum cooling) is
well above the temperature at the air handling unit, meaning that all the zones are reheating and the
supply air temperature could be reset upwards. A few little spot check readings like this can tell you a
lot about what's going on with a mixing air handling system.
Pump Heads
Things like pump heads might be important, especially if you are considering a variable flow
retrofit and the pump head may significantly exceed the close off pressure capacity of the control
valves.
Recording Meters (Events, Temperatures, etc.)
Instantaneous readings while you have the system or process under observation are usually very
adequate. However, while you run the risk of being buried in data and experiencing "paralysis of
analysis," sometimes it is helpful to install a data logger or other recording device and monitor the
operation of a system.
An anecdote may be illustrative. While not directly related to energy conservation, we did an
expert testimony job recently, and were trying to relate the strength and direction of the wind with
heating use in a building. So we installed a magnehelic gauge that had a 4-20ma output, and we
monitored the wind pressure against the side of the building using a data logger. The building had a
real problem with it's exterior skin, it was very leaky. While monitoring the wind pressure, we also
monitored the operation of the heat pumps. We discovered that when the wind blew, the heat pumps
ran. When the wind didn't blow, they didn't run. The "clincher" was that when the wind was strong the
heat pumps ran continuously and still were not able to maintain space temperature! This was with an
ambient temperature of 55°! We couldn't imagine what would have occurred at 30° ambient.
Survey Instruments
Not long ago we assembled brief database of survey instruments which we prepared in
connection with a project we did for the Department of Energy. There are all kinds of devices
available, large and small, some of which will fit in your shirt pocket. This mini industry has evolved
dramatically in the last few years, with more and more user-friendly and relatively inexpensive
logging and monitoring devices, coming on the market all the time, many of which can ultimately
become a permanent part of a building automation system.
Cautions Regarding Data Logging
I will caution you that you can overload yourself with data to the point where you can't get the
study done—because you are trapped for weeks cranking on your computer massaging the data. One
of the utility companies that we are acquainted with is doing an R & D program demonstrating
retrofitting of buildings using the highest possible technology that they can come up with. They are
gathering all this data and at last we heard they've got two years worth of data that they haven't even
had time to crunch, and they've got two guys that are working full time just crunching data. So, if
you've got a piece of equipment or a situation where you think that the momentary or short term
reading won't tell you the full story, one of theses little data loggers might be very, very handy.
There is also the caution regarding trying to make sense out of nonsensical data. Sometimes the
sensor gets put in the wrong spot or the building gets turned off for a few hours, or something else
happens that you are not privy to. Yet you've got the data and the loggers don't lie, so it's up to you to
make sense of the data—right?? I don't think so. I always keep coming back to the question: "does the
data make sense"? I believe that it was the movie "War Games" where they had the "whopper"
computer and it decided to launch missiles against the Soviet Union. Finally the Ph.D., who had
regretted the fact that he wrote the software, came in and turned to the General in charge and said:
"But does it make any sense?" And the General pulled the plug on the computer. Don't be afraid to
"pull the plug on the computer" now and then when the data is taking over the project.
Seasonal Interpretations of Data
In most cases there is not sufficient budget or time during a feasibility study to observe the
building under more than one season of operation. I get a little frustrated, for example, when I've been
asked to do surveys of school districts during the summer months. It's bad enough to only observe a
building's HVAC systems during only one season of operation, but it is even more difficult if you
cannot even see buildings while they are occupied. Sometimes you have to be what I will call, an
"astute implicator." This is being able to observe the way things work in one season and then implying
the way they will work in other seasons. Sometimes what I have done is gone in and manipulated the
controls to simulate a winter condition on a building that I am studying in the summer. But you have
to be a good controls person to do that, and not everyone is. Short of being an astute implicator, you
will need to find other sorts of data to corroborate what you think you know, such as multi-year utility
data, operating logs, attendance histories, etc., etc.
What to Do with Survey Information
So, you've gathered all this data. Now, what do you do with it? A whole bunch of things, in fact.
Prepare a Preliminary ECM List
The very first thing you should do, since you've just spent either two hours or four hours or four
days in the building, is to sit down and "drain your brain" as regards the opportunities to save energy
that you've just seen—before it all goes stale and your enthusiasm has waned.
Tabulate & Analyze Survey Data
You've been in the building for days or weeks gathering name plate data, making lists of
equipment, tons of instantaneous readings, and all that data from recording instruments and data
loggers. You'll be overwhelmed and you won't be able to employ the data in the study unless you
organize the data. Besides, all this information will form the baseline for the building should you be
contemplating a performance contract. It won't stand muster if it isn't well organized.
Prepare a Preliminary Building Model
And you can start to prepare what I call a "Preliminary Building Model." You thought there was
only going to be one model? Wrong. We do more than one.
Preliminary ECM List and ECM "Mini" Plans
This is really two tasks, that should flow one into the other. The first is to sit down and just list
the ECMs you think have any promise at all. I would number them and simply list them by name. Try
to keep the names unique and descriptive, such as:
• AHU 6, VAV
• AHU 9, VAV
• Convert Chilled Water to Variable Flow
• Add OSA Economizer to AHU 7
• Install Cogeneration Unit
• Install Digital Controls
Next, you should examine Appendix 8, which includes all the survey forms. The "ECM Workup
form" is the one we'll use for preparing the mini plans for each ECM.
ECM Title/Description
Every ECM needs a name and a little description. Use the same names from above and try to
keep the descriptions focused on the essence of the measure. For example a name like ECM #1,
AHU-6, VAV, and a description of "convert air handling unit #6 to variable air volume" is what we're
looking for here.
Outline Scope of Work
Do an outline scope of work needed to physically implement the measure. Keep this simple as
well. We're doing this right after the survey and we've not had time to do any preliminary engineering,
so your best guess is just fine at this stage of the game. It ought to be something like:
• Install VFD on fan motor
• A static pressure controller
• Minimum ventilation air controls
• Modify all the double duct boxes, including:
— an extra pneumatic actuator on every box
— new thermostats
— maybe a velocity controller on each box
Outlines will work. Just use simple concepts, not developed in detail yet—just the essence of
the retrofit. If you can't list the work required in about three to five items, you're going into too much
detail at this stage of the game.
Identify How Energy Is to Be Saved
I think you should identify how the energy is going to be saved. What is it about this ECM that
is going to save energy? Again, this is really a great time to start doing this, right after you've done the
survey. You put on the form: "I'm going to convert the chilled water distribution system to variable
flow. Its going to save energy because it is constant flow now and existing chilled water flow capacity
is excessive since there is a 300 ton chiller that the operating engineer says he only ever sees loaded to
about 200 tons." You've got a nice opportunity now for a variable flow chilled water system. It's
oversized. Put the VFD on the pump, convert the valves to two-way flow, install a differential pressure
control system and you'll probably never see the pump at full speed again. And at your maximum
speed in the future the pump will probably only be using something like 25% or 30% the peak
horsepower that you were using previously.
Identify Systems/Areas Affected
You should identify what equipment has to be modified and the parts of the building affected.
''Air Handling Unit #6, which serves the East wing of the building" will get the job done on the form.
Outline How Will Savings Be Estimated
Another important thing to think about is how are the savings going to be estimated? Are you
going to use a "back of the envelope" calculation? Are you going to simulate it on your TRACE
computer program? Maybe it's an ECM that you can not simulate on a program and you have to come
up with some other way of estimating the savings. This is a good time to think about this, as you will
need this information when you start to build the simulation model.
Identify Information/Data Needed to Estimate Costs or Savings
Let's say that you have a double duct system that you want to convert to variable volume, but you
don't know how many boxes there are because you've got an original construction as-built and you
have four remodel as-builts as well. Well, one of the things that you need on this item to be able to
estimate costs or savings, is a good count of the number of boxes to be retrofitted.
Remember, at this point in the study you've just surveyed the building and you've got ten
different ECMs "rolling around" in your head. This is the time you need to stop and do just a little
planning for each ECM. Then you can let go of nine of them, and work on just one, then work on the
next one, then work on the next one. If you don't get your basic thinking down on paper right away
and allow yourself to get "buried" in the details of one ECK, you'll lose it on the rest of them—I
guarantee it.
Tabulate & Analyze Data
While doing a bit of planning of the ECMs is the first thing you do after the survey task is
complete, the very next thing is to get busy organizing your survey data. There are a couple of steps
involved.
Create HVAC System Table
It seems that mechanical engineering and systems are the least "structured" in the construction
business. The building codes define things like power and plumbing fairly precisely, but HVAC
systems are more of a "free for all"—and as a result, the HVAC systems end up being the most
disjointed and confusing. Therefore, it's usually a good idea to create an HVAC System Table, similar
to the one shown in Table 4-1, including the following information:
System Name/System Type/Fan Horsepower(s)
Put the name, the type, the horsepower. Maybe you only have a supply fan, or you may have a
supply fan and a return fan. Maybe there's a supply, return and exhaust fan. Perhaps the system has an
outside air economizer, it may have to have a building pressurization relief fan added to it.
Outside Air Control Type
It's real important to know how the outside air is controlled. Is it a fixed minimum, is there an
outside air economizer, or is it 100% outside air?
Other Features/Comments
And any other features or comments. The fact that the heating coil control valve is stuck open or
there is a run-around-coil system, etc., etc.
Organize Electrical Data
Organize your electrical data. You have taken a whole bunch of electrical readings out there in
the field. Here's what to do:
Calculate kW(s)
For example, we use a form for taking electrical readings. When we go out and take electrical
readings we record the name of the load and the time we read it, we usually take an average voltage
because voltage doesn't change very much, and then line by line (i.e., conductor by conductor),
especially on three phase loads which is most of what we are dealing with, you record the amps and
the power factors for each leg. We do all of our readings single phase. We look at a three phase load
and we say, "We're too stupid to remember what the square root of three is" but then one day we
realized that we're smart enough to know that we didn't need to remember it because if we measure
voltage line to neutral, it doesn't make any difference if it's one phase or three phases, we treat
everything like it"s single phase. The power kW is "volts x amps x power factor" if it's three phases,
you jut add up the results of that calculation for three phases. But you've got to remember you've got
to only read line to neutral not line to line. I used to have to instruct technicians out in the field, and
they were always confused with which voltage should they read and what do they should do in "this"
situation. So they finally asked me, ''Is there a way you can make this simple?," and there is. See
Appendix 8 for our electrical reading forms and instructions. Also see Table 4-2 for an example of
tabulated electrical data.
Table 4-1.
PRINCIPAL HVAC SYSTEMS
Sys. No.
Bldg. - Floors
Department(s) Served
System Type
Ventilation
SF-1
EAST - G
Kitchen
Single Zone (H&C)
100% Outside Air
SF-2
EAST - B
Kitchen
Single Zone (H&C)
100% Outside Air
SF-3
EAST - G
Conference Rooms, Bothin, Reheat (H&C)
100% Outside Air
Library
SF-4
EAST - G
SF-5
EAST
Dining
Reheat (H&C)
100% Outside Air
- Engineering, 1,2,3,4 East
Reheat (H)
100% Outside Air
-
Reheat (H)
100% Outside Air
B,1,2,3,4
SF-6
OPR
Outpatient Clinics, Medical
1,2,3,4,6,7
Research
SF-7
OPR - G
Housekeeping
Reheat (H)
100% Outside Air
SF-8
EAST - B
Power Plant
Single Zone
100% Outside Air
SF-9
EAST - B
Power Plant
Single Zone
100% Outside Air
SF-10
OPR - 5
Medical Research Labs
Reheat (H&C)
100% Outside Air
SF-11
A-3
Operating Rooms 4 & 5
Reheat (H&C)
100% Outside Air
SF-12
NORTH - 1 & 1,4 North
Reheat (H)
100% Outside Air
B-B&G
Central Supply, Accounting & Reheat (H)
100% Outside Air
N-2&3
Finance, Gift Shop, 2 & 3
4
SF-14
North
SF-18
B-G
Generator Room
SF-19
A - B,1,3,4, & Matl. Management, (former) Reheat (H& Partial 100% Outside Air
5
Pediatrics,
B - 1,2,3 & 4
Respiratory
Single Zone
100% Outside Air
Surgery, C)
Therapy,
Lab,
Obstetrics
SF-20
A-5
Orthopedics
Reheat (H&C)
100% Outside Air
SF-22
A-2&3
Labor & Delivery, Surgery
Reheat (H&C)
100% Outside Air
SF-23
H - 1,2 & 4
Administration,
Medical Reheat (H&C)
100% Outside
Air
SF-24
Records, Obstetrics, 4 H Wing
(has RA capability)
H - B,G,2 & 3
Physical Therapy, Pharmacy, Reheat (H&C)
100% Outside
A-2
Radiation Therapy, Nuclear
(has RA capability)
B-3
Med.,
ETR,
Lobby,
Non-Invasive, Administration,
Obstetrics, ICU/CCU
SF-25
NBICU - 2
Newborn ICU
Reheat
(H&C) 100% Outside Air
(dedicated chiller)
SF-26
A-G&1
Radiology, (former) Pediatric Reheat (H&C)
100% Outside Air
ICU
SF-27
EAST - B
Power Plant
Single Zone
100% Outside Air
SF-28
B-1
Pediatrics Office Suite
Reheat (H)
100% Outside Air
SF-29
OPR - 1
Material Management Office
Reheat (H)
100% Outside Air
DP-1
A-B
Data Processing
Self-contained Unit
Return Air Only
DP-2
A-B
Data Processing
Self-contained Unit
Return Air Only
DP-3
B-B
Telephone Equipment Room
Self-contained Unit
Return Air Only
AC-3
B-B
Mail Room
Packaged
Unit Return Air Only
(H&C)
HV-1
2-2
Medical Offices
Reheat (H)
100% Outside Air
HV-2
2-1
Central Supply (vacant)
Reheat (H)
100% Outside Air
HV-3
2-2
Kitchen & Dining (vacant)
Reheat (H)
100% Outside Air
HV-4
2 - 3,4,5 & 6
Hallways,
Station, Reheat (H)
100% Outside Air
offices,
Nurses'
clinics,
etc.,
3'rd
through 6'th Floors
AC-1
2-1
Out Patient Surgery
Multi Zone (H&C)
AC-2
2-3
ICU
Reheat
100% Outside Air
Packaged 100% Outside Air
Unit (H&C)
HV-1A
1-1
Laboratory & offices
Reheat (H)
100% Outside Air
HV-2A
1-1
Medical Imaging
Reheat (H)
100% Outside Air
AH-39-01
1-1
Medical Imaging
Packaged
Unit Return Air Only
(H&C)
AH-40-01
1-1
Medical Imaging
Packaged
Unit Return Air Only
(H&C)
AH-41-01
1-1
Medical Imaging
Packaged
Unit Return Air Only
Air
(H&C)
AH-42-01
1-2
Nuclear Medicine (vacant)
Packaged
Unit Return Air Only
(H&C)
AH-45-01
1 - 2,3
Breast
Health,
Surgical Reheat (H)
Patient Rooms
100% Outside
Air
(has RA cap)
Segregate and Total by Type (Fan, Pumps, Lighting, Process, etc.)
It's important then to segregate and total by type. Answering the question, "How much is the
lighting?," this is where you come up with how much is the lighting in this building. How much are all
the fans, how much are all the pumps?
Process Mechanical Measurement Data (Calculate Cfm, Gpm, Btu, Etc.)
You should also then process your mechanical measurement data. Calculate your CFMs, your
gallons per minutes, Btus, that sort of thing, If you were watching the performance of actual
equipment you need to be concerned about Btus—for example on a preheat coil or heat recovery coil
or something similar.
Summarize and Gather Field Observations by System/Functional Area
I think it's real important to sit down and take your field observations and go through your notes
and clean them up, even rewriting them entirely if need be. I find that when I am in the field I'm in a
hurry. Sometimes I use little abbreviations, and I have little arrows going one way or another on my
notes and if I let that go for more then a couple of weeks, I'll come back to it and I can't figure it
out—even though I wrote it myself.
Plot Recorded Data (Use Common Scale)
If you've done things like use a recording meter or a data logger, it's time to plot out that data. It's
also helpful at this stage of the game to look at the graphs and to start to get a feel for the values
associated with what you have been observing going on in the building and with the various building
systems—like, "yes, the chiller does carry a load all night long, just as I suspected." Perhaps the data
shows some things that don't make sense and you may need to go back and find out what's going on,
because what you think you observed doesn't seem to make sense when compared to the data
collected.
The common scale idea is very valuable as well. While it is fairly common practice (most
spreadsheets default to this practice) to plot data such that you use a range on the axis that goes from
the smallest data value recorded to the largest. The problem with this is that it tends to distort the
variations in the data and causes disorientation when comparing data from time periods where the
maximum values are grossly different (see Figures 7-5 and 7-6 for examples of this technique). I
believe that it's important that if the peak chiller tonnage is 2,000 tons, that all graphs of tonnage use,
say, 2,500 tons as the maximum value and that the range on all graphs be from zero to 2,500 tons. By
doing this there is virtually no way that you can accidentally confuse a fall day with a summer day
when looking at the graphs. This may seem silly and/or trivial, but I believe that there are enough
ways to mess up this very complicated process already, so why not try to eliminate a few by adopting
some simplifying procedures.
Table 4-2. Power Measurement Form—Petro Towers
LOAD
Time Avg Volts
L-1
P.F.
DATE: 12-14-83 to
RECORDED BY. JPW, JLH,
1-12-84
MFS, RW
L-2
P.F.
L-3
P.F.
kW
Remarks
Note:
—North Tower—
0
0.00
0
0
——
0.0
Floor 31
is at
bottom
30 PNL 30A
1000
267.89
115
0.99
91
0.98
88
0.96
77
30 AHU 30-3
"
267.89
19
0.84
19
0.91
17
0.91
13.1
30 PNL 30AA 2
"
267.89
3
0.82
5
0.63
9.9
0.88
3.8
30 Window Washer
"
267.89
0
0.00
0
0.00
0
0.00
0.0
30 PNL AA30
"
267.89
8
1
9
0.81
3
0.81
4.7
30 AHU 30-4
"
267.89
15
0.81
17
0.82
17
0.73
10.3
WMR
@
30 PNL 29AA 2
"
120.09
9
0.93
11
1
23
1
5.1
Bottom
of 30AA
2
29 PNL A29
1000
267.89
129
0.99
95
0.96
85
0.98
81
29 AHU 29-3
"
267.89
23
0.83
23
0.75
21
0.83
14.4
29 AHU 29-4
"
267.89
19
0.77
17
0.83
19
0.85
12
29 PNL AA 29
"
267.89
19
0.88
23
0.52
11
0.98
10.6
28 PNL A28
0945
267.89
141
0.97
93
0.94
99
0.94
85
28 AHU 28-3
"
267.89
27
0.88
29
0.81
25
0.86
18.4
28 AHU 28-4
"
267.89
19
0.62
15
0.65
17
0.76
9.2
28 PNL AA 28
"
267.89
3
0.72
3
0.99
7
0.82
2.9
————
0
0
0
0.00
0
DATE:
0
RECD
0.0
28 PNL 28AA 2
"
267.89
3
1
11
0.83
10
0.64
5
27 PNL A27
0930
267.89
103
0.97
71
0.96
81
0.95
65.6
27 AHU 27-3
"
267.89
21
0.84
23
0.76
19
0.82
13.6
27 AHU 27-4
"
267.89
19
0.78
16
0.83
14.9
0.89
11.1
27 PNL AA 27
"
267.89
3
0.85
5
0.87
7
0.93
3.6
27 RADIO
"
267.89
0
0.00
0
0.00
0
0.00
0.0
"
120
17
0.96
17
1
10
1
5.2
27 PNL 27AA
2—West
West
Room
Read @
27 PNL 26AA
2—West
"
120
9
0.96
15
0.71
9
0.97
3.4
Bottom
of
27AA2
26 PNL A26
0915
267.89
133
0.99
90
0.97
65
0.97
75.6
26 AHU 26-3
"
267.89
19
0.87
19
0.78
17
0.82
12.1
26 AHU 26-4
"
267.89
19
0.76
15
0.81
18
0.83
11.4
Preliminary Building Model
Then we move into what I call the Preliminary Building Model. This particular step may seem
sort of wasteful and perhaps even inane—until you try it on one of your projects. I consider it the most
important step in converting as-built and field-measured data into the actual simulation model. In fact,
I believe that if you can't build the preliminary model correctly, you'll never build the actual
simulation model correctly either. This is a bold statement, but one that is reinforced by my experience
teaching a one-day version of our building simulation seminar in Atlanta. Ordinarily the seminar is a
two-day seminar and the attendees actually build a simulation model of a real building with real field
data on the second day. It is a very satisfying process, as many of the attendees have never done this
before, or have wrestled with TRACE or DOE- 2 with great frustration. Well, in the one day seminar
we didn't have time to do a full model, so we tried the preliminary model instead. So we took the
2-day seminar class exercise building survey data and assigned teams among the attendees to tackle
lighting, plug loads, air-side equipment, central cooling equipment, miscellaneous loads, etc. After 20
minutes of reading the survey data and doing some calculations and analysis, the class built a
preliminary electrical model of the building. Leading the class through the exercise I did not provide
the right answers, but only asked pointed questions, etc., and used the team's values for the various
loads and equivalent full load operating hours. After about 40 minutes of working through the
numbers, we totaled everything up and discovered that the class had built a preliminary model that
was within 10% of the building's actual annual kWh and peak demand! What was the most impressive
thing about the experience wasn't that the class had succeeded, because I knew they would. What was
impressive was how astounded they were at how easy it was to build such a model in so little time.
The idea of this model, then is to build a fairly simple and quick energy balance for the building,
using all the data that has been gathered and tabulated. This energy balance is our estimate of the
energy the building is using—balanced against the actual energy use data from the utility bills. Refer
to Tables 4-3, 4-4 and 4-5, and the form in Appendix 8.
Electrical Demand Only
When you look at energy use in buildings, the electrical energy use is the one that is problematic.
This is because electrical gets consumed for end uses like cooling (which is related to things like
occupancy and outside air temperature) and for end uses like computers, lights, circulating pumps and
fans that are pretty much unrelated to weather and occupancy. So, if all these end uses are all mixed
together it can be very confusing trying to sort it all out. On the thermal side, gas, steam, etc., these
sources of energy are largely used only for space heating, and a little for domestic water
heating—unless of course you're in a medical center that may have significant process loads like
sterilizers, a laundry, or whatever. So, this is why we usually just focus on the electrical side of the
question for our preliminary model.
And here is how we do it.
Table 4-3
Table 4-4.
Sheet 1
PRELIMINARY MODEL OF:
SOLANO COMMUNITY COLLEGE
LOAD
TYPE
AREA LIGHTS (Inside Lighting)
NOMINAL
ADJUSTED
SUMMER
ALT
ANNUAL
EQUIP.
EQUP
Peak
KW FOR
KW
CAPACITY KW
KW
KWH CALC
MODEL
KWH
834
834
550
MISC. EQUIP (Plug Load)
68
68
68
3744
255777
SPACE HEAT (Boiler Aux.)
?
10
10
2000
20000
Chiller
383
383
383
800
306400
Chiller
383
170
170
400
68000
766
553
553
Clg Twr Fan
30
27
27
1296
34805
Cig Twr Fan
30
27
0
1296
0
CW Pump
30
27
27
1296
34805
CW Pump
30
27
27
1296
34805
119
107
81
CHW Pumps
187
169
169
HW Pumps
88
79
0
275
248
169
313444
AHU SF
371
371
334
4150 1385685
AHU RF
96
96
86
4150
4150
SPACE COOL SUB-TOTAL:
HEAT REJECT SUB-TOTAL:
PUMPS & MISC. SUB-TOTAL
83
83
75
VENT FANS SUB-TOTAL
AHU EF
550
550
495
EXT. LIGHTS
160
160
0
40
40
40
EXT MISC. (Computer Rm.)
(table continued on next page)
667
HRS/YR
3744 2497254
374400
104416
79
1296
218404
1200
95040
358560
310005
2054250
160
2400
384000
8760
350400
Middle of the Day/Middle of the Night Demand
It's important to look at both the middle of the day and the middle of the night as well. I find it
very interesting that utility company folks will respond to a request for a demand profile (including
the middle of the night values) with some incredulity. They will say, "The demand is in the book," or
"It's in the account history that I already gave you." I'll reply, "Yes, the peak demand is in the account
history, but I want to know the middle of the night demand." They'll ask further, "Well, what do you
need that for?'' The answer is that that's often where you can save the most energy, because a lot of the
"stuff" that is turned on at night shouldn't be—and it's where you can really make some bucks with
energy retrofit.
Summer and Winter
You should also be concerned about summer and winter demands, the expected difference
usually being the cooling plant—and is a great way to get a "handle" on what the total electrical
demand of the cooling system is.
Enter Instantaneous kW Readings and Values
As you can see in Tables 4-3 and 4-4, you need to enter (into your spreadsheet) the electrical
demand for each of the end uses of electricity that you identified during your review of the as-builts
and your on site survey and instantaneous measurements. In a large number of cases you will have to
make an educated guess at what the middle of the night or minimum demand is for each load.
Add in Recorded kW Data
In addition to the instantaneous values, you need to add recorded data (from recording power
meters or data loggers) from the loads you put a recording instrument on. For these loads, you should
have some actual data to indicate what the middle of the night load is, so you can enter it directly from
your recorded data.
Total and Compare to Actual Demand
And you want to compare it all to the actual demand. You can't build a simulation model by
putting data into it unless the data that you are about to put in is at least a good approximation of
reality. By doing this preliminary model you have a chance to check this before you even start
building your model.
To compare to actual annual kWh usage, you also need to come up with a good rough guess at
what the equivalent full load operating hours per year are for each connected load.
As you can see from Tables 4-3 and 4-4 we have been able to account for electrical energy use,
even in just this preliminary fashion, to a high degree of completeness and accuracy. Table 4-3 is an
example from a project (the County Civic Center mentioned in Chapters 3 and 7) employing the
Carrier HAP program. Tables 4-4 and 4-5 are from a community college campus study using the
DOE-2 program, Table 4-4 being the preliminary model, and Table 4-5 being the End-Use energy
report from the actual DOE-2 simulation model. Readers will note that the format of the preliminary
model for the DOE-2 model was arranged so as to mimic the output report from the program, so that it
could be used to cross-check the DOE-2 model as regards the peak demand of the various end uses
(see discussion about checking for completeness of input in Chapter 6, Section 6.5).
Comments on the Preliminary Model
Now, you may be thinking that it's not too hard to get the right answer to a question when you
already know what the answer is. Well, that is all a matter of how you go about it. In order to add
value and quality to the process, it is our practice to build the preliminary model without filling in the
answer first. We fill in all the data, take our best guesses at hours and middle of the night values, total
it all up—and only then fill in the answers. Frequently we are within 10% on the first go 'round. While
this might seem surprising (and it is the first few times you do it), in fact it shouldn't be surprising. If
you've done a thorough job of identifying all the connected loads and either directly measuring them
or developing an educated estimate of their values, it shouldn't be a surprise that your first estimate is
very close. It is true, however, that some fine tuning usually needs to be done, but this is usually a
refinement of numbers that were kind of soft in the first place, and only serves to add veracity to the
estimate. Once you've done a number of buildings this way, if you have any skill at all, you should hit
the target almost every time—just as the one-day seminar attendees did (as mentioned above).
While you can get good at making very educated and accurate "guesses" of loads in an office
building or a school, industrial facilities will need direct measurement of loads for sure. For example,
we did a study at the Chronicle and Examiner (the San Francisco Newspaper Agency, actually) a
number of years ago, and everybody in the building thought that the printing presses were the biggest
load in the building. In terms of connected load they were. However, it turned out that the presses only
used about 9% of the total electricity. They had an air compressor room, over in the corner of the
building, that was about the size of one of a guest room at a hotel. It had 4 rotary vane compressors in
it that were out of control, just running like crazy all the time. It turned out that that little compressor
room used 12% of the annual electric use. You would have never guessed it walking through the
building. In fact we almost missed it ourselves. . . , "Oh, that little room over there, is there something
in there?" While the presses had a very large electrical demand, they run only a few hours to put out
an edition of the newspaper. The air compressors, because they had no automatic controls (or manual
controls with someone watching), ran all the time. Combined with a tremendous number of leaks in
the distribution piping and the end use equipment, they used a tremendous amount of energy.
This particular anecdote also points up another reason for doing the simulation model in the
detail that we do it. That is to "test" our knowledge of the building and what's going on in it. If we
honestly add up everything we know about and it doesn't equal reality, it means that we've missed
something. Now, if you're not honest with yourself, of course you can just "fiddle" the numbers (raise
them all by the % that you're short) until you get it all right. But if you are honest with yourself, you'll
revisit your data, perhaps visit the building again, until you find what you missed. Our survey case
studies in the next chapter will make it clear what the value is here. For now, let me simply say that
you can cover up an error with "fiddling," or you can find out the truth—and chances are, the truth
will lead you to a golden opportunity for savings, because the thing you missed is very likely
something that is out of control or not needed. So by "cheating'' at doing the model, you will likely
only cheat yourself.
68 页缺
Chapter 5—
Building Survey Case Studies
So, what is all this survey stuff in Chapter 4? Why can't we just use the as-builts, it's an awfully
lot easier and it's just as good, isn't it? Hopefully that's not what you are thinking. However, some
people do look at all this survey stuff and say, "Can't we just use the as-builts?" And what I intend to
do for the next few pages is to just share with you some of my personal experience doing surveys in
buildings—things that I wouldn't have discovered if I hadn't have been what I would call an "HVAC
Sherlock Holmes."
C.Z. Building (San Francisco)
This is a very good example. This is a building in San Francisco on Market Street, where we did
a TRACE study back in 1980.
I was cruising around the building late at night and I was watching the graphic control panel in
the basement in the watch engineer's office. They had an old pneumatic graphic display panel that
showed all the temperatures and other parameters of the HVAC systems throughout the building. Well,
I was kind of taking notes, looking at the panel, recording temperatures and that kind of thing, and I
looked up from my note pad, and all the temperatures were changing, all the dials were moving—kind
of like being in a submarine that was diving—I half expected a klaxon alarm to sound. It was
fascinating, and I realized that while I had my head down writing notes, that the watch engineer had
happened to walk through the room. He didn't even really stop, he just came through the room. So I
went around and I found him and I said, "Did you do something when you came through the room?"
He was real sheepish and said, "Oh, yeah." So I said, "Well, what did you do?" He said, ''Well I put the
outside air back on automatic." I inquired, "Why did you put it back on automatic?" he said, "Well,
'cause I put it on manual earlier" (it was clear that progress was going to be a rare commodity in this
conversation). Okay, I said, "Why did you put it on manual?" To make a long story even longer, it
turned out that the supply air for the basement (which is where the engineers' office was), was return
air from the lower four stories of the building. Basically, they pumped air that was being thrown away
into the parking garage and into the spaces that were occupied down there (I don't believe that the
engineers' office even existed in the original design of the building). They turned the chillers off at 6
P.M., but they left the interior terminal reheat system serving the core of the building in continuous
operation, and the engineers' office would get warm because the entire building got warm, what with
the lights still on for the janitors. John, the watch engineer, had discovered, ten years or more prior,
that if he manually put the outside air economizers on full outside air, that all night long while he was
there, the typical 50°-year-'round nighttime air in San Francisco was too cold for the reheat coils
upstairs to keep up with, and the temperature in the entire building (half a million square feet) would
drop three or four degrees, and in turn it kept his office a little cooler! So, by understanding this
"daisy-chain" of circumstances, we determined that this was going on every night of the year
whenever John wasn't on vacation. As a result, we modeled this building at an average of 70%
minimum outside air. The result was that our computer model was within 5% of the actual energy
bills—on the first run! We couldn't have done that without knowing that John was messing with the
controls. The solution to the problem, by the way, was to put in a small split-system air conditioning
unit in the engineers' office, so John wouldn't have to try to heat all the ambient air in San Francisco
every night. That's one.
C. Plaza Building (San Francisco)
Another building in San Francisco (half-million square feet). We're talking to the operating
engineer, and he's got this "patch" panel in his Chief Engineers' office, that's almost like a telephone
switchboard, the kind where you pull the cords out and plug them in. It was their "fancy" energy
management system that had four or five or six time clocks in the panel, each constituting a ''channel"
for time control. You could take the cords from any air handling unit, for example, pull them over and
plug them in to which ever time channel you wanted that air handler to be on. For a 1960's design, that
was a pretty neat idea actually. The Chief Engineer advised us that they started the building at 7:00
A.M. then turned it off at 6:00 P.M., i.e., that's when all the air handling equipment started and
stopped.
As part of our study, we got the demand interval record from the utility company. We checked it
out and noticed that something was not right. The demand interval data showed a big load coming on
line at 6:00 A.M. and off at 7:00 P.M.! Not at all like the Chief Engineer said. We went back to the
building and looked more closely at the "patch" panel. It seems there was one clock that was set for
7:00 a.m. to 6:00 p.m. and right below it was a clock that was set for 6:00 a.m. to 7:00 p.m. Same
numbers, they were just in the opposite sequence. Well, it turns out that the Chief had everything
plugged into the wrong "channel." He thought that the building was running a certain way—and it
wasn't at all. This was the guy that was in charge, and really should have known, but he didn't.
So, he had an extra two hours of operation that he didn't need, (nobody was there at 6 o'clock in
the morning). We were able to get that model right because we modeled the operating hours correctly,
not as we were told. In addition, we were very confident that our operating hour savings would net us
a certain 15% savings (2 hours/13 hours)! That's two.
B.A. Building (Pasadena)
A quarter of a million square foot office building in Pasadena.
Here's another chief engineer situation. I was surveying the building and I talked to the chief
and I said, "Do you guys do anything to turn the equipment on and off, that sort of thing?" Well, this
was a building where they had no wall switches for the lighting (an early 1970's building). All they
had was breaker panels and the Operating Engineers were in charge of going around and turning the
lights on and off. The building was made up of 50,000 square foot floors, each floor being two mirror
image 25,000 square foot pieces. The electrical panels were similar, with matching panels on opposite
sides at one end of the floor. All the HVAC ducts, all the power wiring and everything was mirror
image. So, as the Chief explained, they had an "energy management program" which was manually
implemented. The operating engineers would go around and they were supposed to turn off the
lighting at the end of the work week (they worked three shifts a day in this building, but they didn't
work weekends).
So, we modeled the building according to what the Chief told us. When comparing the model to
the actual, however, and we couldn't get them to match. We were missing like a million kilowatt hours
per year.
To investigate this discrepancy, we pulled out the 15-minute demand interval data and started
looking at it. What we discovered was that on the weekends they weren't turning the lights off. After
further investigation, interrogation of the Chief Engineer, he reluctantly said, "Well, yeah, we used to
do that, but we discovered the 300 ton Trane Centravac chiller we were running in the middle of the
night to support the 30 ton computer room load would cycle off if the lights weren't on." This was on
low refrigerant temperature, and the chiller had a 30 minute timer so it wouldn't start back up again.
By the time the chiller restarted, they'd lose temperature control in the computer room. The easy
solution was just leave the lights on—a quarter of a million square feet of lights. It was a nice solution,
it kept that Centravac running just smooth as silk. And that's the kind of things that chief engineers do.
He told me, by the way, that he'd asked management for a new low-load chiller for years (all he had
was two identical 300 ton machines), but they'd never listened to him. He even showed me a quotation
he had gotten for a new small chiller from a vendor (of course the quote didn't include installation, and
no one had calculated the savings it could achieve).
So, we revised the lighting schedule and we got the model to come out just right—with only this
one change. Of course the retrofit project we sold included a little reciprocating chiller to run at night
to take care of that 30 ton computer room load and a lighting control system so that we could get the
lights shut off (along with override buttons in the hallways, so the occupants could override if needed).
That's three.
A.S. Building (Houston)
Here's a 100,000 square foot office building in Houston.
Talking to the building manager, we mentioned that we had noticed that his building and the
building next door were diagonal to each other, and in the spot between the two buildings, was a
parking garage. We asked if it was their parking garage, and they said "Yes and no, we share it with
the other building." So I asked who was paying for the lights, and he said, "Well, half the lights are on
our circuits and half are on theirs." Of course my "antennae started quivering,'' realizing that such an
arrangement was not one that any respectable electrical engineer would ever allow.
So, we went out in the middle of the night, got the parking garage security guys involved and
shut off the big circuit breaker in the main switchboard of our building—and the whole garage
"disappears." No elevators, no lights, no nothing—one breaker.
We helped that building manager renegotiate a relationship with the neighboring building who
was getting to use half of the parking garage at no expense. The problem was that the other building
was built after the building with the parking garage and everybody was assuming they were sharing
the cost. But they weren't sharing the cost at all.
Needles to say, our model wouldn't have been correct if we had not identified that little problem.
That's four.
A.S. Building (Houston)
Same building in Houston.
The building looks like an energy hog based on the utility data. Btu per square foot is high,
dollars per square foot per year is high. It looks bad (well, good, actually).
We find out that they have a computer room in the building and that they are submetering the
computer room and they are charging that department for the cost of the power (this is an
owner-occupied building). They were letting the Management Information Department or what ever
they called them, pay for the cost of running the computer room out of their budget. A good idea.
As part of our survey of the building we wanted to perform a quick check on the submeter. So we
stuck an instrument on the service going to the computer room and watched it for a day or two and we
also got these monthly internal invoices that they were sending off to the Management Information
Department. The two didn't seem to agree. Well, it turns out the meter was installed by a local
electrical contractor and he forgot to pencil in the meter constant. Depending on what kind of current
transformers you install with the meter, you get a different constant. The constant can be 1 or 10 or 20
or 30 or 40. They were reading the meter wrong from the day it was installed. The correct meter
constant was 20, while they had assumed it was 10. It turned out then that the computer room didn't
use 25% of the building's total electrical use, it used 50%! It was a very, very energy intensive
computer room. So we changed our electrical loads that we modeled in the computer, and we got the
model right.
Unfortunately, however, there was not a project in that building. When you took out that
computer room and its air conditioning from the building, the building itself was actually a very
energy conservative building. In that case we didn't discover this until we were essentially finished
with the detailed study. It was embarrassing but it was a lesson that if there's any reason to stop a study
you better had stop sooner rather than later because it's embarrassing to spend a bunch of money doing
a detailed investigation, and then publish a report that says, "Sorry, dry hole." Our standard practice is
to stop at the end of the field survey and regroup and make a specific, considered decision whether or
not to continue the feasibility study.
That's five.
P.Z. Building (Houston)
Here's another good one. A 1.8 million square foot office building in Houston.
We were looking at the gas bills and 15 minute demand interval data from the utility company
and what we discovered was two things.
First, looking at the demand interval records we observed that there was a huge electrical load in
the middle of the night for no apparent reason. We spoke with the operating engineers to find out why.
The reason was they had a small data center in the building, but their smallest chiller was 1,500 tons in
capacity. In order to keep the chiller on line the operating engineers would run an extra twenty air
handling units all night long to keep some load on the chiller.
Second, the natural gas bills over the previous three years were $50,000, then $100,000, then
$50,000 again. Upon investigation, we learned that over the three year period there were two different
Chief Engineers. One guy went away for year and then came back, and the guy that was there in
between didn't know the building all that well, so he let the boilers run way too long. In Houston you
only get about maybe a month to two months of weather that really need serious heating. In a lot of
the buildings in Houston, the operating engineers only run the boilers a little bit in December, all of
January and some of February. The guy who was there in the intermediate year was afraid of having
comfort problems, so he ran the boilers for nearly six months, doubling the gas bill.
In response to this information we first had to decide which year we were going to use as our
base year. Complicating the situation was the fact that the energy service company we were working
for had a very aggressive sales person who didn't want to use our conservative computer simulation
results, and guaranteed the customer $150,000 a year in gas savings. You know, it's real hard to create
$150,000 in savings out of $50,000 or $100,000 in costs. The ESCo (a Fortune 500, by the way) ended
up in a "world of hurt" on this project. They also ended up asking that Sales Engineer to leave the
company—who had grabbed his commission on the sale and hustled to an office in another state, but
was still working for the same company. He discovered, much to his chagrin that, as the saying goes,
"You can run, but you cannot hide."
Because we found out the information we did, we were able to model the building very
accurately (especially with the 6,000 electrical readings we took and the monitoring of overnight
chiller loads as well—500 tons in the middle of the night—in the winter). We modeled an average of
the three year's gas use as being "characteristic" of the base period and used a three year average for
our baseline condition. There were good retrofits to do, including lighting, better time control on air
handling units (they grouped units in groups of 10) and a nighttime chiller of 500 ton capacity for light
loads.
However, the sales engineer didn't like our conservative estimates of savings, especially with
respect to digital HVAC controls (there really wasn't any mixing that digital controls could correct), so
he substituted his own calculations for ours and passed off the final report as ours to his management.
Unfortunately, given the large bureaucracy that they are, no one at their headquarters happened to call
us to discuss "our" report, nor did they happen to notice that the guaranteed gas savings was twice the
three-year average total cost. They did start to pay attention after the first year's saving were far short
of the guarantee, and we did get the (slight) satisfaction of getting to do the expert testimony on this
project, including a post-retrofit audit of the entire project. It was subsequent to our audit report that
the sales engineer in question was asked to leave his employer.
That's six.
D.M.D. Building (San Mateo)
This building is a very interesting case study regarding temperature controls in an
85,000-square-foot office building in northern California.
This building was the two-day seminar class exercise building (the class exercise materials are
available from the author for those who might be interested).
From observing the building, it was clear that this building was suffering from what we refer to
as the "zero maintenance syndrome." There was literally no money being spent to maintain the HVAC
systems in this building. In addition, the energy use was something like 165,000 Btu per square foot
per year—almost as high as an acute care hospital.
In talking with the maintenance man (you really could not in justice call him an operating
engineer), it was clear that he was having a lot of trouble maintaining comfort in the building. In
particular, he complained that he had to start the building earlier and earlier in order to get the building
warmed up for morning occupancy—and still the tenants were not happy. In addition, he said that he
could not keep the sunny side of the building cool in the afternoons without freezing the shady side of
the building.
Part of the problem, we learned from examining the HVAC system, was that the building was
equipped with an odd, single, air handling system which was a combination multi-zone, variable
volume, high-pressure-induction system! The main air handling system was a double duct unit with
field-fabricated mixing dampers right at the unit (making it a multi-zone unit), with one zone serving
the core of the building (which was equipped with Carrier Modu-Line VAV terminals—making that
portion variable volume) and three zones serving three exterior zones of the building (which was
equipped with under-window high pressure induction terminals—making that portion high pressure
induction). Certainly this would not be an easy system to operate under the best of circumstances.
In observing the building operation one afternoon, I noticed that the refrigeration compressor was
running and the boiler was cranking along at a good pace as well. Interestingly neither the supply
temperature to the interior zone was particularly cold, nor was the supply temperature to the perimeter
zones very warm, even though the dampers for each of the zones was in full cooling and heating
respectively. I promised the maintenance man that I'd keep his tenants happy the following day.
At 4:30 A.M. the following morning, I found the heating and cooling both going full blast—and
only 68 degree air going down the perimeter zones. It's very hard to heat a building to 70 degrees or so
with 68 degree air. Adjusting the refrigeration controls, I got the compressors to shut down. Now the
heating had a chance to work and we got 100+ degree air down to the perimeter. I continued my
survey of the building and also discovered that the Modu-Line VAV terminals were filthy dirty and as
a result, many of the terminals were stuck about half open, resulting in over-cooling of the spaces
being served. In the key complaint areas I worked the terminal controls a bit to free them up and they
began to function once again.
As the building warmed up that day, I reset the boiler controls and got the boiler circulating pump
to shut down. I also adjusted the refer controls a bit and got the air conditioning compressors back in
operation. The building had a partial outside air economizer, but this had been disabled since there
were no provisions for removing air form the building—only bringing it in.
Even with the compressor running, we still could not get very cold supply air—only about 65
degrees—which was not good enough by midday with a lot of solar load on the south side of the
building. Inspecting the zone dampers, it became clear that the dampers themselves were incredibly
sloppy and leaky, even when fully in one direction. In addition, the damper linkages were so worn as
to barely stay together. As a stopgap measure, I jury-rigged the core zone into full cooling mode.
However, this still only produced slightly colder air to the zone, yet the cold deck discharge
temperature was close to 55 degrees! Curious, I measured the hot deck and found it at 85
degrees—with the boiler circulating pump off! Examining the pump I discovered that it was not
equipped with a check valve, and I could feel heat in the piping at the heating coil in the hot deck.
Suspicious, I valved off the heating hot water and discovered that the hot deck cooled right off, and
the supply air to the core zone dropped as well. It seems the boiler was thermosyphoning, or
circulating naturally due to the different densities in the water at different locations in the system—as
is commonly done in solar domestic water heating systems where the tank is mounted above the
collector.
A few more tweaks on the core zone dampers to see if we could get 100% cold deck air to the
core zone. This was somewhat effective, and we had about 60 degree air going to the VAV terminals
throughout the building.
After all this messing around, the maintenance man was astounded that both the sunny and shady
sides of the building were comfortable. Too bad I had to return all the equipment to it's original
settings.
The upshot was that to model this building you had to model unbelievably poor operating
conditions. In fact, the utility company representative who reviewed the model used for the savings
calculations was unwilling to believe that a savings percentage as high as we were projecting was
possible. His problem was the he didn't realize how horribly inefficient the existing system was. After
all, it ran all night long mixing heating and cooling so the building could still be uncomfortable all day
long!
That's seven.
V.F. Center (San Jose)
Here's another real good case study, focusing on temperature controls as well.
This building in San Jose. It was a real high energy user. The Btu per square foot per year was
real high, something like 150,000, and the cost was real high as well.
The operating engineer was telling us that he couldn't get the building warmed up for morning
occupancy. He kept setting the time clock earlier and earlier and earlier. Another interesting case,
indeed.
At 2 o'clock in the morning I was standing outside the building at the entrance to the elevator.
Now, even though I was outside and it was 42 degrees out, I was "toasty" warm! Very strange. Now,
what was interesting about this building was that the elevator lobby was outdoors. What they did when
they built the building was to basically cut a hole through he first floor so that you could walk up to
the elevators from outside. What this meant as well was that the stucco ceiling above your head when
waiting for the elevators was really the bottom of the ceiling plenum on the first floor. Feeling all
toasty warm, I realized that the warmth I was feeling was coming from over my head—from a grill in
the stucco over my head!
Investigating this curious phenomenon, I discovered that the building had been retrofitted with
outside air economizers about ten years prior. It was a simple installation with a modulating mixed air
controller and a high ambient lockout as well. The installers were also smart enough, when they put
the economizer in. to put in a return air low temperature lockout as well. When the return air was
below 68°, they locked out the economizer. And that probably wouldn't have been too bad except that
the economizer either failed or was adjusted so that it went to 100% outside air whenever it was
working. So the reason that they couldn't get the building warm was the fact that the building would
start to warm up, the return air would reach 68 and the economizer control would go out of lock up,
and the air handler would pump 100% of 42° outside air into the building. Next the building would
cool back down below 68° return temperature because the reheat coils in the ducts just weren't
powerful enough to fight 42 degree air, then the economizer lock out control would energize again,
locking out the economizer and the building would warm up to 68° once again. The building would go
through this warm up and cool-down cycle about every 30 to 45 minutes all night long—with the
building never getting any warmer than about 68 degrees!
Of course the operating engineer, rather than diagnosing the problem, said if the building is not
warm, we must need to start it earlier. We normally would start it about 7 o'clock in the summer so he
moved it up to six, moved it up to five, moved it up to four, moved it up to three, moved it up to two,
moved it up to one, and finally moved it up to midnight. Basically, he had the building running from
midnight on, with the control system that kept the building at 68° for eight hours before
occupancy—just grinding away using fan power and boiler energy.
If you hadn't talked to the operating engineer to find out what he was doing, and if you hadn't
observed the controls and happened to be standing there beneath this flood of hot air coming out of the
building at 2:00 in the morning, you wouldn't have been able to figure all this out—and your computer
model would be junk—no matter how good a modeler you might be. This is not the kind of data you
can get from the as-built drawings.
Comments on the Survey Case Studies
Now you know, a lot of what we found in these case studies are simply byproducts of the human
infrastructure operating the building. Some might say that the real solution in many cases was to fire
the stupid operating engineer who was messing up. We tend to believe, however, that operating
engineers exist to operate the machinery we give them, and that they're operating buildings instead of
designing them for a reason—and that many design engineers wouldn't be a whole lot better operating
them either (if you know what I mean). So, rather than "shooting" the "guilty" parties, we believe in
creating a building system infrastructure that institutionalizes good practices and works with the
human infrastructure, rather than against it. After all, a one ton split system in the engineers' office is a
cheap way to get their "buy in" on a million dollar project. We believe that in the long run this strategy
will achieve the best and most persistent results.
As a corollary to the comment above, we have found that it is also a good practice not to turn an
energy retrofit feasibility study (or "audit," if you would) into a "witch hunt." It is very easy to fall into
the (egotistical) trap of using the audit to show how "smart" the auditor is and how "dumb'' the
operating engineers (or building designers) are. A lot of operating engineers suspect that this is exactly
what an energy audit is likely to be, and "clam up" as a result. As mentioned elsewhere in the book,
the operating engineers may not always know the right information, but they do know the "facts"
about problems and idiosyncrasies of their building, and they most always lead the way to insight into
the potentially enigmatic aspects of the building. Besides, the job of the operating engineers is to
operate the building, not re-design it—and it's a minor miracle they can keep some buildings they're
given running at all! A successful strategy that we have found is to ask the operating engineers for
their "wish list" with the promise to see what we could do to find the funds to implement their good
ideas—ideas that management has likely been ignoring for some years (after all, who's going to listen
to a "janitor with a screwdriver"?). Indeed, this strategy has paid dividends more than a few
times—and won a lot of allies in the process.
As a final comment on site surveys, it is our policy not to do a survey of the building unless we
get a set, usually two sets, of master keys. And if we have to leave them at the building, and sign them
in and out at a security desk, we don't mind doing that. I almost without exception will not allow the
building owner to require that we have an operating engineer accompany us on our survey, because we
don't get anything done in that case. The one time we allowed the building owner to require that the
operating engineers accompany us it was because they didn't want to sign out keys. When you've got
to wait on the operating engineer you're stuck, because they're on call and they will keep abandoning
you with the comment, "I'll be right back." So 45 minutes later, when you were done in five minutes,
he finally shows up again. What building owners also don't realize is that in a good survey you may go
back and forth numerous times to the same locations to re-check information or observe the current
status of a piece of equipment. In 20 years we've only failed twice to get master keys. On one occasion
we refused to do the project without the keys. So we get in everywhere—with a few exceptions. If
there's a vault or some other area that is highly secure, we're not going in there because we really don't
want to and probably because there's not much to see anyway. Computer rooms usually have some
kind of a key code or your need a badge. We're always getting people to give us badges in the
buildings, and then we try to make friends with the people. And usually, if they have seen you around
there for a couple of days, they know you haven't stolen anything yet, and they can see that you are
doing your job—they start to relax a little bit. Locked doors can be a problem and they can prevent
you from getting your job done during a survey.
82 页缺
Chapter 6—
Constructing the Model
The following chapter will likely be a bit tedious for those who have a modicum of experience in
actually constructing simulation models of buildings. This chapter will walk the reader through the
process of actually constructing the model, with emphasis on planning the process and what data must
be input to the simulation program. Much of the material is mundane, but important for the novice
simulation practitioner, though there are numerous tips and insights that the more tutored reader
should find interesting.
Planning the Model
Overall Building Characteristics
The level of effort and rigor that we want to employ in doing a study of a building, including a
simulation, is related to the type of building that we're looking at. As we see it, there are two principal
groups of buildings as simulation goes.
Simple, External-Driven Versus Complex, Internal-Driven
If you have a small building that is physically simple, and is driven by external loads rather than
internal loads, you might be able to model such a building in a much more rapid and shortcut fashion
than a building that is physically complex and/or driven by internal loads. You might also decide to
use a different modeling tool as well, depending upon the overall building characteristics.
One of the things that you want to look at is the complexity of the building. Size really isn't
important. If you have a large building that has a huge single terminal reheat air handling system, it
can be modeled simply. Or if you have a building that has 25 packaged rooftop HVAC units, and they
are all functioning in much the same fashion (i.e., they all have outside air economizers, operate on the
same time schedules, have the same control sequence, etc.), you can model this building in a
simplified fashion as well. The thermal influences upon the building also lend to its simplicity or
complexity. Buildings without much internal heat gain, such as residential buildings, don't have a lot
of "conflicts" going on within them, such as the interior needing cooling while the perimeter is
needing heating. Because of this, such buildings would be considered simple buildings. If you have a
simple building, you can probably use a fairly structured, quick, and simplistic computer model.
If you have a hospital, however, you don't want to use, say, a spreadsheet model, unless you're
willing to do a model for each and every air handling system individually, and then aggregate the
results of the various models. We have done this before, putting together a composite model where we
ran 15 different models using a spreadsheet, then added them all together and compared the results to
the utility bill to calibrate the model. These buildings are driven by internal loads as well. For example,
a nurses' station in the middle of a floor will need cooling practically all the time, regardless of the
season of the year, meaning that a more sophisticated simulation model is needed to calculate the
actual loads on the space and understand the control mode of the HVAC system to figure out whether
heating, cooling, or both are needed at any given point in time. So, if you have a big complex building
you probably are going to want to use something more like the DOE-2 program, TRACE or something
similar.
Anticipating Retrofit Simulations
The purpose of doing a model of an existing building is to be able to analyze changes to the
building that are being considered. Sometimes, you have to change the way you build the model so
that you can do a proper analysis "down-stream," so you really need to know where you are going to
arrive before you start the trip. For example, you want to make sure you make areas where, say,
lighting control is planned, separate zones from areas where no lighting control is planned. This may
seem sort of like saying that you need to know the answer before you ask the question, but we have
found time and time again that preparing a list of likely retrofit measures immediately following the
site survey (as has been suggested in Chapter 4, and then constructing the model to accommodate the
ECMs planned for analysis, is the only rational way to tackle the task..
Zoning
You also have to decide things like zoning—how you are going to "cut up" the building to feed it
to the computer. Zoning can be based on a number of different things.
Thermal Loads (Type, Interior-Perimeter)
Interior and perimeter kind of spaces need to be separated. You don't want to mix them together
because the influence of weather (external forces such as the sun and ambient temperature) are
different on internal spaces versus exterior. If you treat two spaces, one of which needs cooling all the
time (interior) and one which frequently needs heating (exterior) as a single space, the computer will
combine their thermal needs and conclude that neither heating nor cooling is required—whereas they
actually are both needed.
Occupancy (Type and Schedule)
If you have an area that has a unique occupancy schedule, it needs to be treated separately. Say
it's occupied by an accounting firm, and you have an air handler per floor and the accounting firm
operates two shifts a day for many months of the year. Now, if they occupy three floors, you may want
to group those three floors together and model that area as though it is served by as a single HVAC
system and is a single (or very few) zone(s) of the building.
Lighting (Type and Schedule)
Some buildings are very uniformly occupied and may have one lighting fixture that has been
used nearly everywhere in the building. Sometimes, however, if a space has been remodeled or special
lighting has been installed, you actually need to create a separate zone in the model in order to model
that type of lighting versus the type of lighting used throughout the rest of the building.
Simplification and "Paper Dolls"
We don't have unlimited time to build our models, so you have to find ways to simplify. When I
look at a building, I try to take some 8-1/2" × 11" floor plans (or in this case shown in Figures 6-1 and
6-2, there were no 8-1/2" × 11" floor plans and we had to hand sketch footprints of the building) and
locate which portions of the building were served by each of the air handling systems. These figures
are for the building described in Table 4-3, and as can be seen in the figures, certain of the areas of the
building operate on a 24 hour basis. In addition, as you can see from the figures, this building has
about seven different levels and was a very complicated building to model. If you didn't' have (or
create) a "road map" (or "paper dolls") like this, you'd get completely lost.
Multiple Realities
One of the problems that building modelers face is the need to hold multiple realities in your
head simultaneously. The process, as a result, can be "mind bending" in a vary real sense.
You have the physical reality of the building itself to deal with. You have the reality of the
simulation program that you are using and all of it's limitations and capabilities. And then you have
the reality of the retrofit measures, which you may or may not be able to actually implement. It is very
easy to model a retrofit that can't actually work. The computer doesn't know that, it will just model it
just fine. It will tell you that the heat in an interior zone can be shared with a perimeter zone and you
don't need to heat the building. In actuality that interior heat never gets to the perimeter and you have
to operate the heating system in the building—even thought the simulation program says you don't.
Types of Loads
As we are building our model, there are a couple kinds of loads that we need to be concerned
with. Loads that are related to weather, and loads that are time-related.
Time-Related
Time-related loads are things like lighting, fans and pumps that are under time-clock or manual
control. This also includes plug loads, personal computers, copy machines, etc. For these loads we will
essentially tell the simulation program how big the loads are and when they operate.
Figure 6-2.Weather-Related
As regards weather-related loads we need to deal with both heating and cooling. While this might
seem fairly obvious, it is not necessarily so.
Building Envelope
We need to define in the computer model the envelope of the building. While we have indicated
earlier in the book that envelope loads are generally not dominant in larger buildings, that doesn't
mean that we can ignore them. We need to tell our computer the following:
Walls (Insulation, Mass, Orientation, Shading)
We need to tell the program what kind of walls we have—if it's a program that does load
calculations. Some programs use empirical data—you tell it what the peak load is. If you are using
TRACE or DOE-2 or something similar, you're going to tell it what kind of walls you have, what sort
of insulation, what sort of mass, where do they face and what the shading is like.
Windows (Number of Panes, SC, Orientation, Shading)
You need to tell the program about glass. What kind windows you have, the number of panes, the
shading coefficient, etc. An interesting thing about shading coefficients that I discovered a number of
years ago is that they can be roughly measured with a light meter. On one project I had no data on
shading coefficients for the windows in the building. So, I got a bunch of sample pieces of glass, solar
films, etc., and I did some field tests. Using the light meter, I measured light levels through the film
and not through the film. It turned out that the light meter reading, the ratio of through the film and not
through the film, was real close to the shading coefficient in almost every case. So what I determined
was, when left with no other option but doing a field measurement, using a light meter to measure the
shading coefficient of a piece of glass is not a bad way to go. It will get you in the "ball park," which
is generally sufficient particularly, once again, because the envelope loads are not the critical loads in
larger, complex buildings.
Roof (Insulation, Mass, Shading, Ceiling-Ventilation)
The roof, insulation, mass, shading and ceiling ventilation can be kind of important. You may
think that you are getting a positive benefit from the roof insulation. But, if in fact if they are
ventilating the space between the ceiling and the roof, which sometimes they do, you may not have
dead air space to work with, meaning that the roof insulation is actually providing very little value
since the temperature of the attic space is the same as the ambient temperature- and it may only be a
false ceiling that is separating this hot air from the occupied space. This may seem far-fetched, but
we've actually seen such circumstances in actual buildings (reinforcing, once again, the value of the on
site survey discussed in Chapter 4)!
Weather Data
Weather data is a great issue for various opinions and discussions and disagreement in this
business. There are lots of different types of weather data.
Types
Hourly
There is hourly weather data, like the TRY Tapes or the TMY Tapes that you can get from the
National Oceanic and Atmospheric Administration (NOAA).
Typical 24-Hour Profile by Month
You can also have typical 24 hour profiles by month. This is, for example what TRACE uses. The
TRACE program uses 288 (24 × 12) hours of weather data, meaning that this is average data.
Average High/Low
You can also get things like average high and lows, also from NOAA, or other sources. ERA's
simulation program, BEST, generates a 24 hour profile from average high and low temperatures each
month (or from degree days and average daily range).
Monthly Heating and Cooling Degree Days and Daily Range
You can also get monthly heating and cooling degree days and average daily range. This data,
heating and cooling degree day and daily range is fairly easy to get, from NOAA or many local
sources, such as utility companies. It can be quite useful in doing simulations.
BIN Data
There is also BIN weather data. We feel very strongly that programs using BIN data are
exceedingly weak because BIN data is sorted into hours during a few daily time windows within
certain temperature range "bins." This data, originally developed by the Air Force, was created was
because computers didn't exist decades ago and design engineers needed a fairly simple way to
analyze weather data. Well, we have computers now, and you can do a much better job by simulating
hourly temperatures from average highs and lows than by using bin data.
Sources
Places you can get weather data from include:
NOAA
See Figure 6-3 and 6-4. Figure 6-3 is the cover page to the "Selective Guide to Climatic Data
Sources," December, 1988. You can get this document for free by simply writing or calling them and
asking for this document. Figure 6-4 shows just one of the great types of data they can provide, in this
instance, "Local Climatological Data."
State/Local Agencies
The City of San Jose has an Office of Emergency Services; they keep very good weather data.
There is no National Weather Service for downtown San Jose, and it is data that is easy to obtain as
they will send you that report every month, if you just send them self-addressed stamped envelopes.
We also get one from Concord; they keep a weather station in Martinez or somewhere. We get that
weather data every month. So there are all kinds of sources.
Utility Companies
Most of the utility companies we have encountered provide real good weather data for their
service territories. Figures 6-5 and 6-6 show one example. This document is out of print, and while
deregulation of the electric industry may make such data harder to get, archive copies of many
documents like this are frequently available.
Figure 6-3
Selective Guide to Climatic Data Sources
Figure 6-4
Relative Importance of Weather Data
The bottom line on weather is that you're preparing a computer model that you are going to
calibrate within 5% of the actual annual energy use. You are building this model in order to predict or
project energy use in future years. The question is: ''How do you know if the weather is going to be
plus or minus 10% in the next year."
Figure 6-5.
The answer is: "You don't know." So trying to come up with a 1% answer to the question of
weather data for simulation is like trying to solve a 10% question with a 1% answer. You don't need to
do that. Anybody that insists upon 8,760 hours of real weather data doesn't understand what the
question is. They've got the answer, but it's the answer to the wrong question.
As further discussion, you may have noted that the examples shown in the figures immediately
preceding do not include wet bulb temperature. Now, if you are pumping a lot of ventilation air into
the building you are simulating, and humidity in the building's climate is dramatic, then wet bulb
temperature could be very important to your simulation. In that case you might want to go and get a
TRY Tape or a TMY Tape and run the DOE-2 program—as opposed to doing something that is more
simple, such as a spreadsheet-based simulation. You have to use your own judgment about what is
important in the building you are modeling. If you choose to do a model that is simplistic, recognize
where it is weak and don't overstate the savings. Finally, while we have not yet explored the concept,
you can probably generate a wet-bulb profile from a dry-bulb profile if you assume that the ambient
air reaches dew point every night. Most climates do indeed reach dew point every night and if your
daily range is 20°, your wet-bulb range will be about half of that. Since the dry bulb and wet bulb both
start at the same minimum temperature each day, if you want to generate a really quick estimate of wet
bulb temperature, you can probably do it by adding about 1 degree of wet bulb rise from the overnight
low temperature for every 2 degrees of dry bulb rise in temperature. We would not be surprised to find
that such a profile would be within a few percent error on average against actual average temperature
data—and it's veracity could be easily checked by looking at a bit of real data for the site being
studied.
Time-Related Loads:
Lighting
We've measured our lighting by going to each lighting panel and directly measuring the
connected load. Now we're going to put it into the building model, either as watts per square foot
(dividing our measurement by the area served by the panel we measured), or watts directly, or
whatever the program needs. Now, these measurements have already taken burn outs into account. If
you are constructing a model based on as-built data or from a lighting inventory, burn outs do affect
your calculations, and you should take them into account to reduce the actual estimated connected
lighting load. Interestingly, I find that virtually all lighting retrofit contractors over estimate hours of
use and connected loads. Because they assume that every bulb is lit and that all the fixtures are
operating a lot of the time. I frequently downgrade or discount lighting contractor estimates of
connected load and burn hours by 10%, 15% or even 20%.
"Plug"—Miscellaneous
We do the same thing with the plug loads—measure and then apply as watts per square foot or
watts, as required or available as an input format in the simulation program.
Process—Electrical/Thermal
You can have electrical process loads, and you can also have thermal process loads. For example;
you may have autoclaves in a portion of the hospital which you'll need to take into account. Generally
this is input as a thermal load in Btu per square foot in the space. In one project we did for the central
processing department for a hospital we had to install small dedicated air conditioning because the
workers in the space are dressed in surgical gowns, and even though we are maintaining temperature
in that space, they are very uncomfortable and unhappy. Alternatively, the operating engineers have to
turn on the chillers and make very cold supply air so that 1000 square feet of an area served by a
100,000 cfm air handling unit will be comfortable!
Internal Vs. External
Again, internal versus external is a concern. Parking lot lighting, is part of your model, it's on the
bill, but it's not in the building causing heat gain to the occupied space and affecting the thermal loads
in the building. If you're going to match the utility bill, you better get that electrical use into your
model. In TRACE these loads are called "base utilities," for example. Other programs call them by
other names.
Cross Check Data Entry to Preliminary Building Model
You're finished taking all the lighting, plug loads, etc. and have put them into the model as watts
per square foot. Before you're done, you need to take all the "square foots" you've working with and
all the watts per square foot, and multiply it out by hand and see if you get the same kW that you
started with in your preliminary model. You might not, meaning that you might have forgotten a
portion of the load or used the wrong square footage in a given calculation. So cross check your data
by going back and looking at it and making sure that the load you thought you were putting into the
model actually got into the model! You'll never know if you don't check.
"Rules of Thumb"
Figure 6-7 is provided as a ready guide to checking that your data entries are in a reasonable
range, and can be a great help when doing very quick preliminary models when on site survey data is
unavailable or inappropriate (such as a preliminary model done for sales or marketing purposes to
show a prospective customer where the power is likely going in his building).
HVAC Characteristics/Controls
In the business of modeling buildings, the "rubber hits the road" and you "separate the kids from
the adults" in the area of HVAC modeling. In particular, looking at the temperature control drawings is
absolutely worthless because jury rigging and manual overrides and disabling of controls is endemic
in the industry. If you don't know that "Joe" has stuck a screwdriver into the controls, you won't be
able to model the building right (read Chapter 5 if you haven't already).
Mixing/Non-Mixing
The most important discrimination with respect to HVAC air-side systems is whether they are
mixing or non-mixing. Non-mixing systems tend to be very energy efficient systems, whereas mixing
systems are the ones that tend to get used in big buildings, such as double duct, reheat, multi-zone, etc.,
and are very, very inefficient.
Air Mixing (Dd, Mz, Ddvav, Etc.)
These systems make hot and cold air at the air handling unit, and then mix these two air streams
to satisfy the needs of the space.
"RULE OF THUMB" VALUES
PARAMETER
VALUE
UNITS
APPLICATION
HEATING CAPACITY
15–20
BTU/SF
NEWER
BUILDINGS,
LOW
VENTILATION RATES
20–30
BTU/SF
OLDER BUILDINGS OR HIGH
VENTILATION RATES
40–50
BTU/SF
VERY OLD BUILDINGS OR
VERY HIGH
VENTILATION
RATES
COOLING CAPACITY
250±
SF/TON
CONFERENCE ROOMS, VERY
HIGH EQUIPMENT LOADS
400±
SF/TON
TYPICAL OFFICE SPACE
600±
SF/TON
RESIDENTIAL
AIRFLOW
400±
CFM/TON
ALL SYSTEMS
CHILLED WATER FLOW
2.5±
GPM/TON
ALL SYSTEMS
CONDENSER WATER FLOW
3.0±
GPM/TON
ALL SYSTEMS
REFRIGERATION
1.2±
KW/TON
AIR
COOLED
RECIPROCATING
0.9±
KW/TON
WATER
COOLED
RECIPROCATING
0.6±
KW/TON
WATER
COOLED
CENTRIFUGAL
VENTILATION
0.05 CFM/SF
INFILTRATION OR CLOSED
DAMPERS
0.1±
CFM/SF
CODE MINIMUM
0.2±
CFM/SF
ASHRAE STANDARDS
0.4±
CFM/SF
NURSING
HOMES,
LABORATORIES
LIGHTING LOAD
.5–2.0
CFM/SF
HOSPITALS
.5–1.0
WATTS/SF
LOW - HALLWAYS. VERY
EFFICIENT BUILDINGS
1.5–2.0
WATTS/SF
MEDIUM - TYPICAL OFFICE
BUILDINGS
2.5–3.5
MISCELLANEOUS OR "PLUG" .3–.5
WATTS/SF
HIGH - LABS, TESTING, ETC.
WATTS/SF
LOW
POWER
-
OLDER
OFFICE
BUILDINGS - VERY FEW P.C.'S
.5–1.0
WATTS/SF
MEDIUM - TYPICAL OFFICE
SPACE
1.0–1.5
WATTS/SF
HIGH - DENSELY OCCUPIED
OFFICES - EVERYONE WITH
A P.C.
SUPPLY FAN HP
.25–.5
HP/1000CFM LOW - LOW-RISE OFFICES
WITH FAN-COIL UNITS OR
SMALL ROOFTOP A/C UNITS
.75–1.25
HP/1000CFM MEDIUM
LOW-RISE
-
TYPICAL
OFFICE
BUILDINGS WITH CENTRAL
AHU'S
1.5-UP
HP/1000CFM HIGH
BUILDINGS
-
HIGH-RISE
WITH
LARGE
CENTRAL AHU'S
Figure 6-7
Sequential Heat/Cool (Trh, Vavrh, Induction, Pre-Heat, Etc.)
These systems tend to produce one temperature of air and then reheat (or sometimes recool) that
same air downstream using a heating or cooling coil in the ductwork.
Control Issues (Sar, Min Cfm, Lockouts, Etc.)
The amount of mixing that takes place in these systems is absolutely dependent upon control
features like supply air reset, for example. At least one of the best known simulation programs has
been emasculated by virtue of the fact that the program's ability to simulate supply air reset based on
outside air temperature has been disabled. While this program can still simulate the types of supply air
temperature control used in most new buildings, it has lost most of its ability to simulate existing
buildings with old pneumatic (or manual) supply air reset.
Number of Systems
As shown in Figure 6-8, it will very frequently be necessary to simplify the model by combining
air side systems, otherwise the model will take forever to run (at least it will seem like forever—we
have had models that took 6 hours to run on a fast P.C.). In the example in the figure, 25 systems were
modeled as though they were 7 (with the excellent accuracy shown in Figure 7-3).
Air Flow
Modeling air flow rates can be very important for certain retrofits.
Actual CFM Vs "Design" (Sat, Vav, Etc.)
The question of whether a building really is a good candidate for variable air volume conversion,
and whether you might solve some real nasty comfort problems at the same time, can be determined
by knowing the actual airflow and what is really needed by the building. Our experience has been that
almost every variable air volume system that we have done and every variable flow chilled water
system that we have installed, has ended up not only saving energy, but also solved significant comfort
problems at the same time. Because now the air or the water goes where it is needed. If you need the
cooling, you get the cooling. Large air handling systems, over 10,000 cfm, should be measured in the
field and the actual airflow input to the simulation program. In one convention center we studied, they
didn't have any money for maintenance so they didn't replace the filters, so they would wash them out.
Bag filters get like cardboard after you wash them out. So eventually they didn't have any filters at all.
Well, it seems they did Tractor Pulls inside the convention center and there was all this dust flying in
the air as a result. We opened up the air handlers, and the coil looked like somebody had glued felt to
the surface of the coil, there was that much dirt on the coil. The actual airflow (miraculously) was only
half what the as-builts called out.
Air Flow Control (Dampers, Speed Drives, Multi-Speed, Fan-Cycling, Etc.)
The devices that provide air flow control need to be carefully input to the program. Is your inlet
van damper is hanging up and preventing the fan's capacity to be controlled. Do you have variable
speed drives on the fans, or are they multi-speed motors? Are the fans cycling? A lot of smaller air
handling units use fan cycling for temperature control and you need to get that into your computer
model.
Economizers
Economizers tend to be a lot of trouble in modeling too.
Air Side Economizers (% Capacity, Return/Exhaust Fans?, Building Pressurization, Lockouts,
Functional Enthalpy Controls?, Etc.)
Does it really work? Are there return/exhaust fans? Maybe there's an exhaust fan, but not a return
fan, and it only comes on when the economizer is wide open—as opposed to a return/exhaust fan that
runs all the time. If you have a low rise building that's only two or three stories tall, you may not have
a true return fan, you may only have an exhaust fan. Perhaps there is no return or exhaust fan, and the
economizer has been disabled because the building gets pressurized. So there's an outside air
economizer on the drawings, but it no longer works (see Chapter 5 if you haven't already). If you
model an economizer off the as-builts, your model will never be right.
Run-Around Coils (Effectiveness, Lockouts, Pump kW, Etc.)
Run-around coils are frequently found in hospitals in 100% outside air HVAC systems, and use a
fin-tube coil in both the exhaust and outside air airstreams. These coils are piped together with a
circulating pump to move the water and they exchange heat between the two airstreams—summer and
winter. If you model a 100% outside air system, and you fail to notice that there is a run-around coil,
and it's actually very effective, your model will never be right.
Heating/Cooling Sources
You will also need to deal with things like heating and cooling sources, such as chillers and
boilers, etc.
Availability (Manual?, Schedule?, Lockouts?, Etc.)
As mentioned in Chapter 5, the new chief engineer manually locked out the boiler. If we don't put
that into the computer properly, you'll have a bad model.
Auxiliaries (Power Draw, Control, Sequencing, Etc.)
You also need be concerned with auxiliaries, on chillers primarily, but boilers as well. Programs
such as TRACE and DOE-2 automatically estimate certain auxiliaries based on capacity. This may not
be anywhere close to what is actually installed, so you'll need to look at the output and confirm that
the ''automatic" input is reasonably correct. DOE-2, for example grossly overestimates boiler
auxiliaries.
HVAC Equipment Scheduling
You need to schedule all this junk. This is usually done similar to time-related loads such as
lighting.
Air Handling Systems/Pumps
Just because your air handlers are running, doesn't mean that the pumps are running.
Primary Equipment
You need to schedule primary heating and cooling equipment so that you are essentially enabling
and disabling it. It may be scheduled for a certain period of time and it may have an outside air
lock-out on it as well. So you may have to do both a time schedule and some sort of
temperature-related lockouts for equipment like boilers and chillers.
Unique Schedules
One of the things that are very difficult for most programs to handle are things like extreme
weather conditions. I've gone into many buildings where I find that when it's real hot and it's real cold,
the Chief Engineer will pull the pins on the time clock or override the automatic controls and run
everything 24 hours a day. You've got to recognize that if it's occurring in the building you're
investigating. If you can simulate that in the model, that's great. However, if the simulation program
doesn't have such capability, you have to say, "I can't model that, so my existing model is going to be a
little bit low on energy use. However, when I go to do my retrofit installations, I'm probably going to
save some of that energy waste with my building automation system. So I'm going to be a little more
aggressive in modeling my building automation system as a result." You may not be able to handle it
in your computer model but at least you know that you're not handling it, and you know where the
model's weakness is, you know which direction the error is in, and you can gauge the size of it. You
see, the question isn't whether you are going to have errors or not, as every simulation program is
imperfect. There is no simulation program that does a perfect job—they are all wrong. The question is,
"How wrong are they"? Your job is to have a good sense of where the errors are and how big they are
and in which direction they are. Are they in your favor, or are they against you? Are they going to get
you into trouble, or are they going to keep you out of trouble? We tend to keep our computer models
of existing building a little bit low compared to the actual energy use. Then our savings calculations
from simulations of the retrofits are probably a little bit conservative also, because we're effectively
"cutting out a piece of the pie" with the retrofit, and if the entire "pie'' is a little conservative, than the
retrofit "piece" is also going to be conservative.
Annual Calendar
Day Types
Virtually all the programs utilize the concept of day types. What this means is that unique
operating schedules can be created, say for lighting, for each different day type. The TRACE program,
for example, employs three day types: weekdays, Saturdays and Sundays/ holidays.
Sample Calendar
Figure 6-9 shows a typical annual calendar. What it basically shows is how many weekdays,
Saturdays, Sundays and holidays you have per year. Most programs allow editing of the calendar to
modify it to control the number of days of each type that occurs in the simulation year.
Figure 6-9.
Use of Day Types
Day types can be very valuable, for example; you can have two different weekday types for a
school, one for when school is in session, and one when it is not in session (summer recess).
Energy Units/Costs
Since saving money is what energy engineering is all about, it is important to simulate the cost of
the energy being used fairly accurately. Most programs have the ability to describe the utility
company's rate schedule to the program and this is becoming even more important as the electric
industry becomes deregulated. The California Power Exchange observed, during it's first month in
operation, that the price of power bid to the exchange was actually zero (that's $0.00 per kWh) in the
middle of the night. So, doing a careful job of inputting rates will enhance the usefulness of the model.
108 页缺
Chapter 7—
Critiquing Output and Model Calibration
We've covered building the model (what you need to know about the building, how to put all this
information into the model) and that you need to know how your simulation program "thinks" about
systems and designs and interactions between zones so that you can describe the building and it's
various energy using systems to your computer program correctly. I find that a lot of the model
creation (data input) gets done fairly well. However, what frequently gets missed in the process is
critiquing the output.
When the simulation output comes out of the machine there is a strong tendency to accept it as it
is. After all, you spent weeks preparing it, you don't want to think that it is wrong, you want to believe
that it is right, you've spent all this time and energy, and you're a smart person, you know how to do
this computer simulation stuff, you're almost a genus because you can do this simulation stuff in the
first place (there's some people in your office that think so!), and who wants to do the job twice?
What this book is here to say is that, well, you better do it twice. You better check the output
because it can be telling you something that is completely wrong but it can look very right in many
ways. One example may serve to make the point rather dramatically. I worked at Lawrence Livermore
years ago, and they had these consultants coming in and generating computer models of our new
buildings in design, but they didn't even bother to look at their own results. On one particular model
that I was critiquing, the TRACE program was calculating something like a 2000°F return air
temperature. The reason was that there was very little air being delivered to the space and we were
assuming that virtually all the heat of the lights was going into the return air, but because we were
exhausting some of that air, almost all of that 2000% air went out of the building as exhaust. In
essence we were throwing the lighting load away, and we therefore didn't have to air condition that
space at all—according to the computer. Remember this was with the TRACE program, which is
about as good as anything that is out there right now.
So looking at the output is very important, and we will spend a lot of time on some very specific
ways to look at output to determine whether or not you are in the real world or not. Then you can go in
and calibrate the model to bring it in line with reality.
Ckeck Thermal Loads
Cooling and Heating Loads
Check your heating and cooling loads. If you know the chief engineer has been logging the
chillers and the boilers, and you have two chillers in the building, and he never runs the second chiller,
your going to have a "benchmark" on your peak cooling load. The building may have two or three
boilers, and the chief engineer may leave the boilers off except for one, thereby giving you a
"benchmark on the peak heating load as well. This is a particular area where using the "as-builts'' will
get you in big trouble because buildings are very frequently over designed and even grossly over
designed.
Check Points
So at what conditions exactly are you going to check the loads?
Worst Day
Well, If you can go out and watch the building during a peak load period (a "design" day), that
would be lovely. However other conditions can be revealing as well.
Intermediate Day
Even an intermediate load period can help you to calibrate your model. If you can go in to the
building, and on a given day it is 83°F outside and it looks like your carrying 235 tons of load on your
chiller (plus or minus), that's a good data point that you can use to go into your computer model and
look at a period where it is simulating the building at that same temperature, and see what load it is
calculating. If it's not around 235 tons, then you are probably mis-modeling the building.
Best Day
You can check the worst day, you can check an intermediate day, and you can the best day as well.
That's the day when there's not supposed to be any cooling going on. You know the chiller doesn't run
at all in the month of January. However, if you go in to the computer model and it indicates that you've
got 68 hours of chiller operation in January, your model is probably wrong.
Middle-of-the-Night
Solar loads are gone at night, so any load that's left is going to be limited to internal loads and
limited to air handling systems that operate around the clock (if any). Middle of the night checks can
sometimes be very informative.
Control Function
This may seem like an odd check point. However, if you know you've got outside air
economizers, and you go into your computer output and it's 55° outside, it's a big building, lots of
internal heat gain and you're looking at an air handling unit that serves the interior part of the building,
and it shows that you've got cooling in operation, you know the model is incorrect. You shouldn't have
the cooling on, you should be using free cooling instead. So you can check control functions in your
model to see that you're modeling thermal loads (heating and cooling) correctly.
So, as we can see, there are a lot of ways that thermal loads can be checked against what we
know to be reality. While cooling and heating loads might seem to be something that is hard to get
your "hands" around—after all, you can't just take a one-time measurement and be done with it, like a
constant speed motor—it really isn't that difficult. When I was taught how to design heating and air
conditioning systems in the early 1970's, a very simplistic algorithm was proposed. See Figure 7-1.
The transmission load, at the bottom, is directly proportional to the temperature differential between
the outside of the building and the inside. When the building is occupied you have the people load,
you have a lighting load, and those are pretty constant, as shown. Now, the only summer. However,
the model electric use shows a huge summer peak! Had this contractor prepared calibration graphs
such as these for submission to the owner, they would have caught the error. As a Greek philosopher is
reputed to have said, "the problem once solved, is simple." However, once again, if you don't execute
the process, you can't get the thing that is left is the solar load. And, if you are looking at an entire
building, including North, South, East and West exposures, they all average out, and guess what? The
building as a whole, experiences cooling and heating loads that are pretty much linear with respect to
ambient temperature—as shown in the figure. So even in a TRACE model you can go in and say,
"Okay, the building is occupied, all those variables are fixed, the only thing that is left is temperature.
You look at the outside air temperature, look in your computer model, and knowing what your chiller
loads are at a few outside air temperatures, you can check your computer output. They ought to be
pretty close. We have actually done models of a building where the building had lost one of it's
chillers and we knew they didn't have adequate capacity. The owners wanted to know how hot it could
be outside before they lost the building. We took the TRACE output and we said, "Looks like you will
lose the building at about 'this' temperature." About a week later we had a day where it just went over
that temperature, and the Chief Engineer called us up and said, "By God, we lost the building that
day." He was pretty impressed, thinking that we were minor "gods" or something—it was truly
amazing. I don't know that we deserved it, but it sure looked good. And I think that typically you can
check your loads by looking at as many points of the data as you can and then comparing those data
points to your model. I'll tell you if you know the building has 200 tons worth of load and your model
says 100, it's not going to be a good model, no matter how carefully its been assembled.
Figure 7-1.
Annual Energy Profile
The next thing we want to look at is the annual energy profiles. To do this you need to plot the
model's predictions of energy use month-by-month versus the actual energy use from the utility bills.
See Figures 7-2 and 7-3.
Figure 7-2 is the original model of a county administration building where a design/build
contractor did a model and estimated twice the savings that were actually possible to be achieved. As
you can see, it looks like random lines on the graph. As regards electricity, the actual electric use was
relatively flat but higher during the summer months than the winter months, but really not that much
of a peak during the results, no matter how fancy your simulation program is.
Figure 7-2
Looking at what happened on the gas, the actual gas, the little x's show high use in the wintertime
(January and February), and drop down real low in the summertime and comes back up again at the
right side of the graph (wintertime again). This is the pattern that is characteristic of most buildings.
The contractor's model was so off base that it actually predicted a peak gas use for the month of July!
This seems rather obvious doesn't it. However, I would venture to say that more than half the
computer models that are done in this country today have problems of a similar nature and the people
doing them don't realize that their models are "baloney"—because they haven't done even this simple
level of output critique. What I do hear, however, is people complaining that they can't get their
models to agree on an annual basis, that means on a monthly basis, they are even worse. It is
interesting to observe, by the way, that the areas under the curves in Figure 7-2 are virtually identical,
meaning that if you only compared the total annual energy use for this model against the actual bills,
there would appear to be no error—which is probably what led the contractor astray.
We took two days and reconstructed this model in Carrier's HAP program, which is the
program used by the contractor. Now, even though we were working with as-built data and a very
limited on site survey, we were able to produce the results shown in Figure 7-3. Note that the annual
energy use (the area under the curves) is nearly identical. Also note that the characteristic shape of the
curves matches very well as well. An interesting note is the apparent error in the model's electric and
gas use in the month of December. While this might seem to be a fairly serious error (the gas differs
quite a lot for example), in truth this anomaly in the graphs actually reinforces the accuracy of the
model. The reason is that this was a county building where the entire building is shut down for the
holidays at the end of the year. However, the chief engineer was nervous about taking off for a couple
of weeks, and each year he would leave all the air handling units running 24 hours a day for the
holiday season, resulting in the high electrical use and the very high natural gas use (the building was
equipped with mixing air handling systems, multi-zone and double duct, with outside air economizers
which send cold air down the hot deck all of the time the units were in operation, causing huge
amounts of heating to be used to reheat all the outside air). Unfortunately no simulation programs that
we are aware of allow you to easily account for unique, short-term operational changes, so it was not
possible to correct for this error in the model. It was, however, reassuring to be able to specifically
identify the reason for the somewhat significant error in the one month. Incidentally, as an ESCo or a
contractor, demonstrating such a situation to an owner would likely lead to building great confidence
with the owner, and it identifies a significant inefficiency that could be corrected relatively easily
(through the installation of a building automation system).
Figure 7-3.
It is a matter of some pride for our firm that our building simulation program, BEST, was in 1984,
the first simulation program to incorporate automatic creation of these calibration graphs as a standard
feature of the software. This includes the monthly profiles discussed above, and the hourly profiles
discussed later in this chapter.
Check Actual Vs Model Weather Data:
As discussed in Chapter 2, the weather data we have available for use in our simulations are
generally of an average nature (even if an 8760 hour weather data file is available for use). However,
the actual energy use data to which we are attempting to calibrate our model were created in an
environment of actual weather. Since we are using average weather data to simulate actual energy use,
we are stuck with a minimal amount of error regardless of the accuracy of our simulation. Thus, it is
sometimes instructive to compare the weather data used in the simulation with the actual weather data
experienced by the building being simulated. Occasionally there will be errors in the simulation that
are clearly explained by the variance in the actual and simulation weather data. A typical comparison
is shown in Figure 7-4. In this case, should the modeled energy use, say for electricity, be higher in the
month of July, then this error might be explained by the fact that the actual weather was warmer
during this month than the weather data used for the simulation. Once again, an error of this sort can
actually lend credence to the modeling process since it shows that we can explain variances that are
beyond the ability of the simulation program to accommodate, meaning that if the real building had
experienced the same weather as the model, it would agree with the model! Obviously, you don't want
to try to make this point to non-technical folks on the client's side of the table, as it may be too obscure
for most people to appreciate, and would only lend confusion rather than confidence.
Check Hourly Energy Profiles
The next step in output critique and calibration is to check hourly energy use profiles.
This step requires demand interval data from a utility company mag tape meter or perhaps a
Dranetz 8000 which was used to monitor the building's total electrical use on a continuous basis (even
a few days of data can be invaluable for calibration of a building simulation model).
Examples of these profiles are shown in Figures 7-5, 7-6, 7-7 and 7-8. These graphs are from the
same county project above where the design-build contractor estimated twice the savings that was
realistic for the project.
Figure 7-4.Figure 7-5 shows the building's total electrical demand for a midweek August day. As can
be seen, the original model shows low consumption at night, but higher consumption during the day.
Figure 7-6, for an August Sunday, is similar in that it shows low modeled energy use at night as well.
What is not so obvious, until you look closely at it is that the area under the curves (the total energy
use) is virtually identical for the plots shown in Figure 7-5, meaning that, once again (just like the
annual energy profiles—Figure 7-2) this error would not be observed if the daily energy use totals
were compared, but not the profiles themselves.
The explanation for this problem in modeling is that the modeler ignored the computer room in
the building and ignored the fact that portions of the building were in operation around the clock,
specifically the county jail and the sheriff's dispatching operation—not to mention the computer room.
What the modeler did was to take these all night and end-use-specific loads, and "spread" them around
the building as though they were plug loads like computers and office equipment—which turned off at
night. In addition, to get the annual energy use totals to come out "right" the modeler played around
with the air handling unit fan inputs (static pressure, fan efficiency, etc.) to pick up more energy use.
Unfortunately when the modeler simulated the fans as variable speed, these over-sized fans produced
grossly over-optimistic estimates of savings as well.
Figure 7-5.
Figure 7-6.Figures 7-7 and
7-8 show the results from reassembling the model by correcting allocating power to the 24 hour
computer center operation, splitting the building up among a greater number of HVAC systems and
scheduling some of them for 24 hour operation, and by correcting the fan power inputs.
This last correction, by the way is one that reveals a common fault with most building simulation
programs—that they were created with new construction in mind. Specifically, this particular program
did not allow direct input of the fan motor horsepower, assuming, instead, that the modeler would
want the program to calculate the needed airflow and the needed fan power from the fan design
parameters (fan type, static and efficiency). In fact it required delving deep into the program to
produce output reports which actually revealed the fan power which the program had calculated and
was using for the simulation. Even generally acclaimed programs like DOE-2 suffer from this same
malady, making the modeling of existing buildings a chore at times.
Figure 7-7.
Figure 7-8.
Profile Error Diagnosis and Model Calibration
The following section presents a series of generic annual energy use profiles (both actual and
model) for the purpose of considering models that are out of calibration and what might be the source
of the errors and how they might be corrected. Note that scales are not shown on the graphs because
we want the characteristic shape of the graphs to be what catches your eye, not the actual numbers.
However, you should know that the bottom of the scale on these graphs is zero, so that all the data is
shown and the variations appear in contrast to the full values. We recommend this approach to
preparing graphs, by the way, since raising the bottom of the scale above zero makes the variations in
the data stand out, but prevents you from seeing the big picture, and can therefore be very misleading
at times. This is a very important consideration.
Figure 7-9. Observing these characteristic profiles (one is shown for electricity, and another for
natural gas), we see that the gas profile matches well; however, the electric profile is not a good match.
Observe too that the differential between the actual and model electricity is generally constant
throughout the year, and the model is less than the actual. We can induce that the error in this model is
not related to a weather-dependent load. Possible explanations for this error (and aspects of the model
to correct to achieve calibration) include:
• lighting power density is modeled too low (did you remember your ballasts when you did your
calculation of the lighting load?)
• perhaps a parking garage (and its lighting) have been left out • did you miss the computer
room, or some other ''process" load such as a cafeteria, retail tenant, print shop?
Figure 7-9.
Figure 7-10. Observing these profiles, we notice that the electric model is low again, yet this
time the natural gas is low as well. Again, the error is nearly constant every month of the year.
Possible explanations for this error in the model include:
Figure 7-10.
• a missing "process" or other non-weather-related electric load—combined with a missing
non-weather-related thermal load (perhaps that kitchen does a lot of cooking with gas?)
• perhaps there's an extra building at this site that you missed during your site survey (yes, this
has actually happened to even Fortune-500 ESCos)
• more likely, perhaps, and significantly more subtle, is that the building has a mixing HVAC
system (perhaps a terminal reheat system) and there is an excess of supply air flow and/or the supply
air temperature is lower than was thought, meaning that the heating and cooling are fighting each
other all year 'round—note that if the building were located in a cooler climate where outside air
economizers were in use, then the electric error would taper off in the cooler months (meaning that the
heating is fighting the economizer instead of the chiller)—this would also be the case if supply air
temperature was being reset somewhat aggressively in the cooler months, but was much too cold in
the summer months (an oversized mixing system will continue to mix even on the hottest day of the
year if it is oversized compared to the actual load on the building)
A not so obvious characteristic of mixing HVAC systems is that their mixing of heating and
cooling causes exactly equal amounts of heating and cooling energy to be wasted.
This question of mixing is really very subtle and can be influenced by design and even
maintenance issues, particularly relating to temperature controls, which are not generally the forte of
the consulting community. If you don't reset supply air temperature, it means that you're pumping
55°F cold air down your cold duct every day of the year. From the site survey you thought that you
weren't maintaining a constant supply air temperature, so you modeled reset of supply air temperature
so that in the wintertime your cold deck is maybe only 63°F. These 55° profiles would tell me that
your reset isn't working. You may have thought that it was working but it probably isn't based on the
profiles. I'd say go back out in the field and check it again, asking yourself, "did we look at this in the
summer or the winter?" It would probably be instructive to go out and check a few zone temperatures
and see how many zones are actually mixing on the hottest day of the year. Theoretically, with a
double duct system on the hottest day of the year, every box is at full cooling and we have no mixing.
But if the system is 20% oversized, by accident somehow, or the dampers are leaking through on the
hot side and we have a hot deck running at 140°F, we're now mixing even if the box is in full cooling
position. Maybe the boxes are old and sloppy and have bad seals on the dampers. Some mixing boxes
have these "floppy" little doors that go back and forth. Others have a pair of real nice, round single
blade dampers with rubber seals and when they close, they close tightly. So even the style of box can
dramatically effect how this works.
As observed by a student in the seminar, even on a newer building with a VAV HVAC system,
one zone may be forcing the supply air temperature to be kept very low and cause many of the other
zones to be doing a lot of reheating.
Figure 7-11. Observing these profiles, we notice that the electric model is low again, but this time
only in the summer months. By contrast, the natural gas is right on target. Possible explanations for
this error in the model include:
• underestimating of the cooling load—perhaps you've assumed less glass in the walls than is
actually there, or glass that has a much lower shading coefficient than the actual glass installed in the
building—or perhaps you've underestimated the ventilation air quantity
• another possibility, perhaps, is that the building is equipped with one or more outside air
economizers on various air handling units and the economizer is actually stuck wide open (and not the
way you've modeled it)—however a stuck open economizer would probably also show up as excess
heating of outside air in the wintertime (unless the building has a high internal heat gain and can use
the extra outside air in the winter to cool hot internal spaces—tricky, isn't it?)
You might be inclined to think that perhaps this could be an example of a abnormal weather—a
high temperature summer. Probably not, however. My experience with weather data is that when
people tell you that they are having a terribly, terribly hot summer, what it actually means is that a
couple of weeks out of the summer, they got some temperatures that were unusually high. However, if
you look at the whole four to five months of the summer, you will very likely find that the total
cooling degrees days of the Summer are probably within 10% of the last ten year's average. It's just
that if for a couple of week it is extremely hot, everybody makes a big deal out of it, but statistically
it's not significant.
Figure 7-11.
Figure 7-12. The question viewing this figure is "what does this tell us about the HVAC systems
in this building, or the building in general?"
Figure7-12.
First, let's look at the graph more closely. One thing that should jump out is that there is hardly
any increase in the electric use in the summertime, whereas in most buildings we'd expect to see a
fairly large peak in the summer months from the air conditioning. Next, the gas graph reveals that the
variation from summer to winter is small (summertime use is 50% or more of the winter use per
month) and the summertime use is quite large. Both of these facts should give you some ideas about
the building and/or its HVAC systems.
These profiles are likely due to the following:
• one possibility is that the building is equipped with a gas-fired air conditioning system,
perhaps a gas or steam-fired absorption chiller
• another possibility is that this is an industrial building where only a portion of the building is
electrically air conditioned and there is a large process heating load which is in use year 'round
• finally, and this is the most subtle possibility, this building may have a reheat air conditioning
system where there is a lot of reheating going on all year 'round and the air conditioning is fighting the
heating all year 'round as well—giving us not much of a peak in our summer air conditioning and high
gas use in the summer
Hospitals look a lot like this. Hospitals are a real good candidate for building automation
systems because it turns out that because they are not allowed to have variable volume systems, you
end up doing a lot of re-heating, i.e., a lot of mixing of hot and cold. If you use a building automation
system, and get some good temperature sensing pints out in the occupied spaces, you can start
"tweaking" the supply air temperatures. Ideally what you do, say on a double duct system, is to keep
the hot and the cold deck temperatures following each other only about 15° or 20° apart any season of
the year—going up and down together. What is fairly typaical in a lot of buildings is that you have
140° hot deck or 130° hot deck and maybe it resets to 120°, and you have a 55° cold deck and it
maybe doesn't reset at all. You end up with this big spread between the two, meaning that you're
always mixing a lot of heating and cooling all the time. And what you can do with an automation
system is you can reset the cooling and you can reset the heating with just a small differential between
the hot and cold decks, but you have to have both of those temperatures vary during the year
according to what the aggregate needs are in the building.
Figure 7-13. This is another interesting graph that should tell us something about the building
and/or its operation.
Figure 7-13.
First of all, it is not a bad model, but it has a "hole" in it, doesn't it? The question is "What
could cause real high actual gas use in the month of December?" The weather might have been
extremely cold, you say. Well, that might explain the high actual gas use, but it probably wouldn't
explain the high electric use as well. A retail establishment that stayed open long hours during the
holiday season? Again, that might explain the high electric use, but would probably not explain the
high gas use.
Actually, the most likely explanation is something like the chief engineer who turns things off,
was fired in November. As a result, all the HVAC systems ran around the clock in December. Also, we
might have had a real cold December. It might have been so cold that the chief engineer was afraid of
freezing the building so he left all the air handling equipment running. We've actually encountered a
couple of government agencies that have done exactly that. Since the chief engineer was taking the
holidays off, he just put all the HVAC equipment in "hand" and went home for the holidays.
If this is how your model turned out, and if you were concerned about this error in the model, you
would probably want to check the model weather data against the actual weather data. You might want
to call the chief engineer and say, "Tell me about December last year? Just talk to me about that." I
always like to ask real non-judgmental questions. Questions like, "Tell me about X" instead of saying,
"What the hell did you guys do last December? You guys fall asleep at the switch? What was wrong
last December?'' If you don't put it in non-judgmental terms, expressing curiosity rather than
dissatisfaction, then the operating engineers are more likely to talk to you. And it's amazing how much
judgmental vocabulary we all use without really realizing it. If you can excise that out of your
vocabulary when you are talking to the operating engineer you'll get more answers and probably better
answers. The truth is, if that was an unusual condition, say a unique, really cold December, you'd have
good model, and your weather data would prove the point.
Figure 7-14. This figure is a companion to Figure 7-2. These are hourly electrical energy use
curves. The question here is "What would this do for you on an annual basis?"
If your eye is good at roughly calculating the area under the curves, the result would be that both
curves represent about the same annual energy use—meaning that if you only compared annual energy
use totals, you'd miss this very serious error in the model. As you can see from observing, you have
extra demand in the middle of the day, but demand is missing in the middle of the night. On an annual
basis it was a good model, that's why the company who did this work didn't do these graphs. They
ran the model and said to themselves, "We are within 10% on gas and electric, we have a good
model." The truth is, It's a garbage model.
Figure 7-14.
This wasn't a good model, but it is an example of a real experience, something that actually
transpired. In this case there was a utility company rebate application supported by this erroneous
model. In performing their rebate application review, the utility company didn't know what was wrong
with this model, but they knew in their heart of hearts that the numbers that we're presented with the
rebate application were not good savings numbers. They spent a year resolving this rebate application.
They just went back and forth and back and forth with the customer and the energy services company
for a long time. We were called in to resolve the problem and did so by showing that the fair answer
was to "cut the baby in half" (á la Solomon in the Bible).
Conclusion
What I hope you'll go away with from reading this chapter is that graphic analysis of your
building simulation results can be very meaningful and provide great assistance and insight into the
problems with your modeling—and point the way to proper calibration of your models.
Chapter 8—
Modeling Energy Conservation Measures
This chapter will be somewhat brief since a large part of modeling energy conservation measures
is relatively straightforward. However, the modeling of some measures can be quite tricky, so we will
delve into what makes them tricky and ways to be sure that you're modeling the measures as correctly
as possible.
Lighting Fixture Retrofit
Let's take lighting fixture retrofit as a first example. You went out and you measured 250 kW of
electrical demand for lighting in your building. You're going to do a T8 lamp retrofit, using
power-reducing (low light output) electronic ballasts. If you calculate the new fixture wattages, and
taking into account burn outs (lamps that had burned out previously, but which you will not have after
the retrofit since all lamps and ballasts will be new), you should be able to calculate a new watts per
square foot for the building. To perform the simulation you should be able to simply reduce the watts
per square foot previously entered in the model input, assuming that you used watts per square foot in
the simulation program as the way of telling the computer how much lighting is in the building.
Where you can get in trouble in this situation is that if you did a very complicated model where
you put in a unique watts per square foot value for various zones in the building, you need to be sure
to calculate a correct retrofit watts per square foot for each unique zone. In addition, you can get
yourself in trouble by saying, "Okay, I'm going to retrofit 6,000 fixtures" and you accidentally put that
reduced watts per square foot into 12,000 fixtures worth of square footage. To check against this
problem, you would want to check your lighting demand output on your computer output and say, "I
expect I should have shown about 125 kW reduction in lighting demand" If your model doesn't show
you 125 kW reduction, you probably screwed up the input. Mistakes like this are real easy to do. Just
one little keystroke and you've accidentally doubled the amount of lighting the computer thinks that
you've retrofitted. Again and again you'll find that we recommend making a quick calculation of the
approximate expected result of a retrofit simulation and then checking the simulation results to see
that your final answer is in the same ball park—it's that easy to mess up.
Lighting Controls
Some programs, like the DOE-2 program for example, have the ability to do things like simulate
lighting control, such as lumen maintenance. However, most programs don't have that ability.
Typically, lighting controls are going to be things like occupancy detectors, or perhaps a power line
carrier control system with which you'll "sweep" the lights off at 6:00 p.m. in the office building and
let the janitors turn back on whatever they need (and sweep again every hour and a half after that to
keep turning them off).
Now to build your existing building model you've input a lighting schedule, and let's say it's a
schedule where you've got a little bit of light on in the middle of the night and then in the early
morning people come in and most of the lights come on with them. Your schedule then might have a
little dip around noon time, come back on 100% after lunch, and because the janitors do actually turn
the lights off, your schedule shows a little bit of lighting going off in the early evening and then slowly
trickle off gradually until perhaps at 11:30 P.M. we finally are at minimum lighting for the night.
Now, with your automatic lighting control system you are going to come in and, instead of
controlling lighting with the security people going through the building and turning the lights on, your
control system will delay the lights coming on, on average, for a half an hour. So, in the model you
can change your lighting schedule to reflect this. In addition, in the early evening you know that the
janitors leave maybe 30% of the lights on that they don't really need, and you can change your lighting
schedule in the model to reflect this as well.
So, you've just written a retrofit lighting schedule to simulate the effect of your lighting control
system—and you're pretty confident about it. However, it can be very difficult to determine how
effective a retrofit like motion detection control can be in occupied spaces. In fact it's virtually
impossible to tell, unless you instrument every office in the building that you intend to retrofit. What
you have to do is base you new lighting schedule on your experience and your having watched the
building (during your many site visits—discussed in Chapter 4) and seeing how many people are out
of the offices and the lights are still on. Every building is different. For example, this financial
organization that I am working with in Washington, D.C., doesn't think they have to worry about the
bills—they leave everything on all the time. So there is a golden opportunity there. Other buildings,
you walk in at 6 or 7 P.M. and you go around the building and lights are all turned off—and you come
in during the day at noon time and a lot of the people have turned their lights off. These folks then are
very, very energy conservative and will prevent your lighting retrofit project from paying for itself.
Again, every building is different and the best information you can have to predict the success of
something like lighting control is a lot of in-building survey observation. Nothing else will do.
HVAC Scheduling
You may think that you can start the air handling units at 8 o'clock in the winter but the operating
engineers know that they really need to bring the systems on earlier to get the building ready for
occupancy. I've seen ESCos be real, real aggressive and assume that they can change HVAC schedules
dramatically. As a general rule, it is kind of foolish to be overly aggressive in HVAC scheduling,
unless you've got a situation where the engineers are leaving systems on all night long for example.
You should assume that you have some pre-occupancy HVAC operation in order to bring the building
up or down in temperature. If you know that you're in a climate that is real humid, say Houston or
someplace similar, you might need to have some extra start-up time, especially in the extreme seasons.
So, caution is appropriate with respect to how optimistic you can be with HVAC scheduling.
Another concern is the interaction between operating schedules and system reset. We built a
project in San Francisco many years ago and we put in an optimized start system for the heating in the
wintertime. The only problem was that we were resetting heating hot water temperatures, and those
two controls were fighting each other. The problem was that the optimized start program said, "I will
start as soon as I need to bring the total building up to temperature." The reset control said, "You know
it's not that cold outside, so we'll keep the heating water temperature low," with the result that it was
real hard to warm up the building on start up So the optimized start kept starting the building earlier,
and earlier and earlier and we had to basically put in an override timer for the first hour of operation
and disable the reset control for the first hour. Now this was a fairly simple EMS system, but it
allowed us to run the heating hotter then it had ever run before so that we could delay that start up to
the latest possible time and then start it up, heat the building and then go over to the reset control.
It is very easy to put in controls that will conflict with each other, or produce an unwanted, but
unpredictable, result. In another case, we installed a building automation system in a school district
that included digital controls in each of the classrooms. Now the "canned" control programs for this
system didn't let you turn off the air conditioning, but did allow you to set the space temperature set
point down or up, and the up limit within the software was 95°. Well, it happened that in the southern
part of the San Francisco Bay Area, in summer, you get some really hot temperatures and these
classrooms would get to about 95°, with the air conditioning off. What resulted was that during some
of the summer vacation weekdays, all the air conditioning on the site, would come on, only run for an
hour or two, and create some tremendous demand charges. Our average cost per kilowatt hour due to
the demand charges was in the order of 25 cents! We had all these demand charges, but virtually no
consumption, thereby creating a very high average cost per kWh. To fix the problem we had to
reprogram the system to "fake" out the building automation system to prevent it from turning on the
air conditioning when the buildings got above 95' during unoccupied periods.
So, the bottom line here is that being very optimistic about the efficacy of your control systems
when simulating them can get you in trouble, and that you'd better be sure that you thoroughly
commission your control system once you put it in.
Air Side System Type Change
This refers to changing the air side system type, change from mixing to non-mixing, such as
retrofitting a terminal reheat system to a variable volume terminal reheat type system. Most HVAC
systems that you are going to model can be changed relatively easily in most simulation programs by
changing the input to another system type.
With this kind of retrofit there are a few critical issues that you have to pay attention to perform a
proper retrofit simulation—things like minimum air flows, supply air reset and total system airflow
capacity.
When we do a VAV retrofit, with existing diffusers that are really not designed for VAV, it is our
practice to incorporate some supply air reset to keep the air flow up a little bit in the wintertime so a to
avoid "dumping" or drafts. Dumping is when the airflow coming out of a diffuser is too slow for the
diffuser blades to make the discharge air flow across the ceiling. Instead, the cold air coming out of
the diffuser just "dumps" straight down out of the diffuser—on top of the occupants, resulting in the
sensation of drafts on the part of the occupants. If you're not familiar with this phenomenon you may
want to study room air distribution or read the technical literature provided by diffuser manufacturers.
By resetting supply air temperatures upwards, we cause more air to be needed in the space to maintain
temperature and avoid this problem.
Another thing that you have to watch out for, on VAV for example, is if the computer has
calculated a CFM that is much larger then you actually have and need in the building. You convert it
to VAV in the computer and tell the computer it that it has a variable frequency drive. The computer
thinks you have a lot more air than you actually have. As a result, even on the hottest day of the year
the computer will have the fan running real slow and will end up showing fantastic savings, when in
fact you don't get that savings because your fan is really not that over-sized. Conversely, if the
program thinks you have less airflow capacity than you actually have, it will underestimate savings.
So, it's important to compare the cfm that the computer thinks you have (the programs will generally
do their own calculation of supply air cfm) to the actual cfm. If needed, you may need to force the
program to use the correct cfm for its calculations in order to get a valid retrofit simulation. Because
of this, it is our practice to actually read out or measure the actual airflow on systems 10,000 cfm and
larger.
This is an area where simulation practitioners who do not have HVAC system design experience
can get into trouble. The cfm required to cool a space is determined by the load in the space and the
available supply air temperature. For example, if you are trying to maintain the space at 75°, it will
take one third more air at a 60° supply temperature than at a 55° supply temperature—because the
temperature differential of 20° (75-55=20) is one third more than a 15° differential (75-60=15).
Similarly, if the heat from the lights is 60% of the total cooling load in the space (fairly typical,
particularly in interior zones), then reducing the lighting power by 50% will result in a 30% reduction
of the total airflow needed to cool the space. This is why retrofit measure interaction can be very
meaningful, particularly when variable retrofits are incorporated (say a lighting, VAV and variable
flow chilled water retrofit are all combined).
The bottom line here is that simulating something like VAV retrofit requires a lot of system design
knowledge and an intimate understanding of whether or not your simulation program takes into
account things like the temperature of the chilled water being supplied to an air handling system.
Outside Air Economizers
Modeling an energy conservation measure such as outside air economizers are usually a
slam-dunk with most programs. Virtually every program I know can handle outside air economizers.
You just tell it you have one, and you tell it how it works. I'll warn you that I don't trust enthalpy
economizers as we've never found one that actually works in the field—ever. We would suggest that
you probably will do just as good a job with dry bulb economizer and that you simulate outside air
economizers as dry bulb type as well. In areas where there is high humidity you should look at your
typical design conditions and select a high-ambient lockout temperature that is low enough that even
humid air has a lower enthalpy than the return air from the occupied space.
The other thing to not forget when simulating or considering outside air economizers is building
pressure relief—and the fans to make it work. Most of the failed economizers we have seen in the
field failed because they could not get air out of the building once it had been introduced into the
building. The result was that the front doors on the building could not be closed or air trying to leave
the building would leak from one part of the building to another in trying to find a way out of the
building (air coming out of return air grilles is not uncommon in such a situation!). So, make sure that
you provide fans (or relief dampers, etc.) to get the air out of the building and make sure that any
"parasitic" power consumed by these devices is included in your retrofit simulation.
Waterside Economizers/Variable Flow Chilled Water
Simulation programs like the DOE-2 and TRACE do a pretty good job of waterside economizers
and most of them have the ability to do things like variable flow chilled water. You just have to tell the
program what your going to do a model of and should take care of the rest.
However, you may need to take special actions if you are, for example, going to change the
operating parameters of the system. For example, on very large chilled water distribution systems, you
can increase the effective capacity of the piping and reduce the pumping power dramatically if you
reduce the supply temperature and simultaneously increase the system temperature differential. As
discussed in detail in the article entitled "Don't Ignore Variable Flow" in the bibliography, air handler
coils only really care about mean temperature. So, if you reduce the supply chiller water temperature
to a coil, you can reduce the flow and increase the delta-T in like proportions and still get the same
total cooling capacity out of the coil! The upshot is that the simulation program you are using
probably won't be able to be told that the chilled water supply temperature has changed, etc., so you
may have to "fool" the program by manually telling it that the peak pump horsepower is whatever new
figure you have calculated it to be and it will use this value at peak load and use a cubic algorithm to
reduce pumping power as the load varies during the simulation year.
Common Pitfalls:
Over Simplification of Zoning
The problems that I see going on when you are modeling energy retrofit are things like over
simplification of zoning. This is where the simulation program thinks that the interior and perimeter
zones (which you've combined for simplicity) are going to share internal heat so that the program
thinks that it doesn't need to heat the space. What actually happens if you have large vertical zones, for
example, with partial shading, or you have overhung floors (where the floor above shades the floor
below), those areas that are in the shade or that are overhung are going to need some heating no matter
what the simulation program thinks. So you can very easily over estimate the savings from new
controls and that sort of thing especially in the heating area.
Overly Aggressive Equipment Rescheduling
I think if you are overly aggressively rescheduling equipment you'll end up overestimating the
savings that can be realistically achieved. In all likelihood you'll have to actually start up the building
early in order to achieve suitable interior conditions for occupancy, particularly in winter months and
in the summer months in really hot climates.
Overly Optimistic Variable Volume Systems
In converting to VAV systems, only very rarely (or perhaps not at all) will you eliminate all the
mixing. There better be some mixing still going on in your simulation model or you probably have
made a mistake. Actual fan capacity and modeled fan capacity should be the same to avoid over- or
under-estimating savings.
Order of Implementation
One of the traditional problems with energy retrofit feasibility analysis has been double counting
or overlap of savings. As a simple example, when retrofitting lighting systems we can modify the
fixture to reduce its connected load, or we can apply controls and reduce its hours of use. Now, if each
of these retrofits will reduce the energy used by the lights by 50%, doing them together will not result
in 100% savings! Now this is fairly obvious, but with HVAC and other retrofits, it is not at all obvious
at times. Considering this further, which ever of these two retrofits is implemented first will be able to
"claim" the largest portion of the savings. Say we do the lighting fixture retrofit first. Then it can
"claim" 50% savings. If the controls are done second, then they can only claim a 50% reduction of the
remaining 50% of the connected load, or 25%. As a matter of practice we recommend assuming a
specific order of implementation and simulating each retrofit in turn with the prior retrofits already
assumed to be in place. While this does ''stack the deck" somewhat for those measures assumed to be
implemented first, it does serve the very good purpose of simplifying the analysis and avoiding the
double counting of savings (by us or others) completely.
Output Analysis and Interpretation
When you are looking at your retrofit simulation output, there is a few things you should do
(similar to the critique of the existing building model, discussed in Chapter 7).
Examine the Output "Piece by Piece"
You should examine the output piece by piece, looking at the energy consumption of each type or
piece of equipment. This is as opposed to just taking the bottom line annual cost out of the retrofit run
and comparing it to the model of the existing building. This will take some time and should be done
on a spreadsheet and made a part of the documentation of the work. We'll look at some examples
below in just a moment.
"Seat of the Pants" Estimate of Savings
The computer will be doing a detailed calculation. But to check that we haven't run amuck, you
need to do a quick estimate of what the savings is likely going to be, say your HVAC air side system is
oversized and you're going to convert to VAV with a variable frequency drive so you guess your fan
power savings will be in the range of 75 to 85%. Jot this down on paper so you can compare it to the
simulation results.
Savings Occur Where Expected
Now you can start to check the output results. Did the savings occur where you expected the
savings to occur? If you expected fan savings did you get lighting savings as well (thanks to a
keystroke error?). No, we're not kidding, as the examples below will show.
No Match
If the simulation results are a whole lot different than what you expected, or if they occur in the
wrong place, then either the simulation is wrong, or you don't know what's going on with the
simulation inside the computer, or you don't know what's actually going on in the building, either the
existing building or with the retrofit.
Now for some examples.
Table 8-1
This table is presented to show how a particular simulation was organized, similar to the example
shown in Chapter 6. This figure shows how we split up a building as regards its various air side HVAC
systems. As you can see we modeled this building with eight systems even though there were nearly
40 actual systems in the building. Note that the total measured kW of the supply, return and exhaust
fans are all listed and totaled, and were used in critiquing the model of the existing building to make
sure that all the fan power was successfully input to the program in the first place. Also note that the
systems have been grouped together in anticipation of simulating the various retrofit measures that
were identified early in the feasibility study.
Table 8-2
This is the same building showing the results from the TRACE output (the building was modeled
on the TRACE program) and as you can see we are looking at the savings piece by piece. The pieces
are the chillers, their auxiliaries, the boiler and its auxiliaries, each of the air side system fans, system
by system (note that all 8 are shown) and the interior lights and base electric and gas utilities (these
cover outdoor lights, parking garage lights, process equipment such as domestic water heating, etc.).
Note that we took the time to show the "base" case, which case we are comparing the retrofit run to
(this is determined by the assumed order of implementation, as discussed above—in this case it is the
base case, in the next example it will be different), energy used in the ECM model, the absolute
savings in units of energy for the ECK, and finally the % reduction in the energy end use "piece"
compared to the base case. This last number is most important as it allows us to be alerted to
overestimating of savings in a particular end use or equipment use. For example, while estimating
99% savings for a fan conversion to VAV might not be noticed if we were comparing the total energy
used by the entire building for the base case versus the retrofit case, it will stand out if we are looking
at that one piece all by itself. The importance of this step cannot be overestimated, by the way.
In this table we are examining the modeling of ECMs 1 and 2, which is the conversion of the two
largest double duct air handling systems in the building to VAV These two systems exceed all the other
fan systems in the building combined). We are reducing airflows and eliminating a lot of mixing with
this retrofit so we should see significant fan savings on the systems modified, chiller savings, and
boiler savings. Looking at the table we can see for example, our third chiller, the last one on line, is
showing a lot of savings on that chiller, since it may hardly be needed at all in the future. We see not
very much on chiller two and just a little bit of savings on chiller one. Next we can see that we have
achieved a significant reduction of boiler and boiler auxiliary energy use. Next we see that System 1
(which represents the two actual systems being retrofitted) shows a large savings for the fans. Also
note that there are no savings at all shown for the other fan systems or for lighting or the base utilities
—proving that we did not make an error in our input data for this simulation.
This last comment is perhaps more significant than would appear at face value. I made a mistake
once where I did one little extra key stroke when I was revising the file, and I inadvertently changed
the operating schedule for lighting on a VAV retrofit. The result was that the simulation showed very
attractive savings. I thought I had a great VAV retrofit for a while, until I noticed that my lighting
energy went down—but I wasn't modeling a lighting retrofit, I was modeling an HVAC retrofit.
Table 8-3
This is the next example from this same project as shown in Tables 8-1 and 8-2. In this case we're
a little further down the assumed sequence of implementation and we are simulating the modifying of
some multi-zone units to VAV. In this case we were not installing variable speed drives on the fan, but
are modeling discharge dampers and are "riding" the fan curve instead of varying the fan speed. In this
case the fan savings are much less than the previous variable speed savings. And as you can see in this
case, only this one air handling system is showing an electrical energy savings. We see chiller savings
again and boiler savings because we have eliminated mixing once again, in smaller quantities in this
case.
Table 8-4
If you go to the next sheet, we see a lighting retrofit, using the same analysis. Now, we see that
we have a big savings in lighting, but since we were only retrofitting a portion of the lighting systems,
our savings is reasonable at 21.9%. Interestingly, the systems that have been converted to VAV show a
little bit of fan savings since there is now less cooling load for the fan to have to pump air out in the
space to cool. Also, there is a little bit of chiller savings since we again are doing less cooling with less
lighting. And guess what else? We show a negative savings on the boiler. We are going to have to put
some extra heat in to the building to make up for the heat we have lost by removing the lights. It's not
much because our building is large and has a lot of internal space needing cooling most of the year. So,
if you take lighting out of a building that needs heat now and then, and if your simulation didn't show
more heat from the boiler . . . then oops! (Back to the drawing board.)
This is a lot of work after you've already knocked yourself out just to build the models in the first
place. You look at the print out, you take the energy use data and put it into a spreadsheet—all just to
keep ourselves honest.
I have found that doing this sort of an analysis is invaluable. It's so easy to make a mistake, when
your running something like the DOE-2 or TRACE program. It's real easy to just put a number in
wrong, put the minimum CFM per square foot wrong on a double duct VAV, goof up on your supply
air reset schedule that you put in, accidentally type in the wrong code for the type of fan control that
you have. It's real easy to mess up. Unless you look at this, unless you have already said to yourself,
"This ought to cut about this much out of my energy use" and compare your simulation results to your
seat of the pants estimate, you won't catch even some of the most "obvious" errors—because they are
buried in the output and are really not obvious at all—until you do the detailed output analysis.
If your "seat of the pants" wasn't fairly close to your final answer, then you either have a bad
simulation, or you don't understand how the building is actually operating, or your simulation, or the
program is confused, and it thinks you are doing something different then you are actually doing. And
even though these simulation programs are very well developed, sometimes they have little bugs in
them that the people who wrote them don't bother to tell you about. Sometimes they work the opposite
of what they say they will in the documentation. And you'll never know if you don't look closely!
Supplemental Calculations
All programs have limited capabilities, some more or less than others. Weak areas, for example,
are chilled water plant auxiliaries—even with the latest version of DOE-2. Not every program can
simulate everything you might want to simulate, either and existing system or retrofit. In the seminar
upon which the book is based, we do a case study simulation of a real building. I chose the building
for the case study because it was small and had a lot of retrofit opportunities, and because it had a very
unique HVAC system—a double duct, variable volume, high pressure induction system! All three
types combined in a single air handling system. Part of the point of using this building was to
challenge the DOE-2 wonks who believe that DOE-2 can do anything. They didn't know what to do in
DOE-2 with this building's HVAC system!
It is very appropriate at times to do supplemental calculations. Some programs can do all sorts of
things but they can take a lot of time to prepare the input and do the output analysis. Sometimes it is
better to take the data that the program gives you, put it into a spreadsheet and do some supplemental
calculations.
Let's say you want to do something really fancy with cooling towers and the program that you are
using doesn't have the capability. Well, your computer model is calibrated to your actual energy bill,
so you could trust that your cooling load profiles over a period of a year are pretty good. And that's the
heat that the cooling tower has to reject. So you can take the load profile off into a spreadsheet, and do
a detailed calculation for the cooling tower, and model anything you have the genius to be able to
write into a spreadsheet.
Table 8-5
Here's an example where we were converting a system to variable volume, we were not going to
be able to put in VFDs because the air handling units were real small and the potential savings
wouldn't justify the expense. Since we weren't going to be able to modulate the return fans, our way of
handling the return fan was to basically leave the return fan off until the economizers were at least
75% open, or until cooling was required. In either of these cases we'd need the fan running, either to
prevent building pressurization or to ensure that we achieved maximum airflow for full cooling of the
building. So a lot of the time we wouldn't even run a return fan (we put that as a separate control point
based upon the position of the economizer dampers the outside air temperature. There was no program
that I could find that could model that sort of a control sequence, though we could accomplish it in the
field quite easily with our building automation system. So we went in to the output from the TRACE
model, and we said, ''We believe that any of the hours above 55° during the 6:00 a.m. to 5:00 p.m.
HVAC operating schedule were the hours when we should say that these fans are running." We were
able then to do a stand alone calculation, completely separate from the TRACE program, but based on
the weather profiles in the TRACE output. In fact, though Table 8-5 shows the opposite, I believe we
were actually calculating the parasitic energy being used by the fans rather than the energy actually
being saved (since we had eliminated theses fans in the TRACE VAV run entirely). To determine how
much energy we were going to save by fooling around with the return fans with a unique control
scheme couldn't be modeled, but a good estimate could be calculated with the help of the model.
That's the point of this little discussion, and hopefully the example is meaningful.
The Bottom Line . . . Plausibility?
Again, no model is perfect. When you get to the end of the modeling process, what you should
finally do is stand back and look at the results, and say, "Is this rational?" If, for example, you have an
office building that is running at 80,000 Btu per square foot per year and the calculations say that we
are going to take it down to 30,000 Btu per square foot per year, we are probably kidding ourselves.
Even if we think that everything that we have done up to this point is right, it just doesn't make sense.
That very first "walk-thru," when you walk through the building and you look at the utilities bills and
you get a "seat of the pants" feel for the building is very, very valuable. Unless you can really justify
why your simulation numbers come out so much better, you better make an adjustment at the very end
or you'll find yourself (as an ESCo) writing checks to the customer every year (as many have in the
past!).
Tables 8-6 and 8-7
This is just an example of the approach we have used in the past. Table 8-6 happens to be the same
building that we have been looking at all along in the previous tables. This table is a kind of a
summary showing all of the VAV retrofits, the lighting retrofit, summer shutdown of the steam
distribution, an energy management computer (which put all the air handlers under time control
whereas they were previously running all the time). Excluding the variable flow chilled water (which
had a very poor payback and no synergy with any other retrofits—see further discussion below on
synergy) we came up with a total estimate of kilowatt hours and therms to be saved and what we
thought that was worth in terms of dollars. Then we also looked at our savings in Btu per square foot
per year. We looked at the existing building and in this case we started at 104,000, we thought we
were going to save 43,000 Btu per square foot per year, and we said, "Here's where we think the
building might be when we are done—60,355 Btu per square foot per year." And if you have an office
building that doesn't have a big data center, runs on five shifts per week, in a climate as nice as
Oakland, (and that was the case here) you should be able to get it down to 60,000 Btu per square foot
per year (as we have seen many others in that same regime). In this case we thought that some of our
original kilowatt hour savings were a little optimistic and we also thought that our thermal savings
were a little bit optimistic so we threw in a 5% engineering "discount" on both of those to arrive at our
final number. In fact our VAV "riding the fan curve" conversions of some of the air handlers showed a
49% savings which I thought was a little bit optimistic in that particular simulation. This is where I say,
"I've done as careful a job as I can, and here's my last shot at it." Here's where I say, ''Simulations are
wonderful, but they are not perfect." As you can see, our final percent reductions were 39.9% for
overall Btus and 22.3% on total cost. This was plenty aggressive for this building. In fact, this building
ended up just meeting it's contractual obligations. It was a good thing we discounted the savings a bit
as the in-house staff in this county building ended up being mad at manage ment for doing the project
(they thought the building automation was going to displace their jobs) and they actually sabotaged
the system, causing it to produce less savings than it could have. Fortunately this specific problem, an
operating crew of uncertain reliability, was a specific risk item identified during the project
development and discussed with the owner and which influenced the final guarantee figure (which
was kept low for exactly that reason).
Table 8-7 is another specific project example showing that our engineering confidence in the
project electric savings was very high, but our confidence in the thermal savings was not nearly so
high.
As an added note related to the example in Table 8-6, and in support of full disclosure between an
ESCo and an owner, in this particular case the payback on some of the VAV retrofits was not very
good. However, we knew we couldn't get the heating shut off in the summertime unless we got all the
mixing systems converted to VAV. This is because a double duct or multizone system with an
economizer has no temperature control capability without either cooling or heating in
operation—unless it's converted to variable volume (otherwise you've got the same temperature of
mixed air going down the hot and the cold ducts and the thermostat will move the mixing damper
trying to maintain space temperature, but all it does is vary the airflow between two ducts with the
same temperature air in them—hence no temperature control). With the VAV conversion, however, we
would have temperature control without the heating and the owner joined with the ESCo to chose a
larger, more comprehensive project that had a slightly worse payback.
Chapter 9—
Building Simulation and Performance Contracting
The Little-Known "Dark Side" of Performance Contracting
While it has carried many names over the past few decades, such as "energy services," "demand
side management," and "performance contracting," implementing energy conservaion and energy cost
management programs on a turnkey basis generally including financing and a guarantee, is what we
today call performance contracting. And, as of the writing of this book, it has gained great popularity
and seems to be particularly bolstered by the wave of electric utility deregulation which is in the
process of sweeping the country. When done properly, as explained in our Association of Energy
Engineers Seminar entitled "Management, Measurement, and Verification of Performance Contracts"
(and in our upcoming Fairmont Press book on the same subject), performance contracting has the
ability to integrate financial, engineering, construction, and operations and maintenance services in a
way that often produces spectacular results that could not be achieved by any other means.
Performance contracting, however, does have its dark side. Because the business proposition is so
attractive and compelling, it is frequently viewed literally as a "guaranteed free lunch" by numerous
building owners. However, in spite of the essential simplicity of the business proposition, the
implementation is anything but simple. The soft underbelly of performance contracting, is the
unfortunate and unavoidable fact that savings cannot be measured.
Now this would seem to fly in the face of the measurement and verification contingent, but the
truth is savings themselves, cannot in fact be directly measured. You see, energy savings are the units
of energy that are no longer being used. That is, they are things that are no longer there—and you can't
measure that which doesn't exist—you can only estimate the space they would have occupied had they
existed. That is, it is possible to measure the energy that was being consumed prior to performing the
energy retrofit, and it is possible to measure the energy being used after the retrofit is implemented.
One can conclude, then, that the difference between the two measurements is, of course, the "savings."
However, and this is a big however, the way the building was (the "baseline") no longer exists once
the building is retrofitted and what that "baseline" would have been in the future can never be
absolutely known. This is because the list of factors that can affect building energy use is ponderous
and includes changes in the size of the building, changes in the building's occupancy and use, failures
of existing equipment and control systems, changes in building operations (such as caused by a new
operating engineer), etc., etc. etc. It is possible to do an accounting of the cost avoidance produced by
an energy retrofit project, but this accounting is the product of a lot of measurements and a whole lot
more assumptions and calculations. Because this demonstration of the results of a performance
contract (the counting of the invisible "beans" if you would have it) can be and is very nebulous at
times, minor disasters occur when the unwitting or unwary building owner collides with the
unscrupulous ESCo. Those not so sure of the problems in this regard should read two documents
mentioned in the bibliography; the Energy & Environmental Management article ''How to Marry an
ESCo," and the State of Arizona Auditor General's report entitled "Energy-Saving Devices and
Services Budgeted for by School Districts."
Because "god (and the devil) is in the details" when it comes to performance contracting, we
unalterably recommend to our clients that the entire process of performance contracting be
well-managed—from the beginning to the very end. This is in contrast to what we believe is the
biggest and most serious mistake being made in performance contracting in the late 1990's—which is
to place too much reliance on measurement and verification, treating it as the first line of defense, and
the only portion of the project requiring attentive management. This approach is simply the road to
ruin.
Furthermore, since the foundation out of which a performance contract springs is the technical
inefficiencies inherent in the existing building's design, construction and operation, we also suggest
with great strength that the investment grade energy audit, or detailed engineering feasibility study, be
given primary emphasis, care, and attention. This engineering endeavor is much like a Mayo Clinic
physical that determines whether the patient's heart will be removed and replaced or whether the
patient will be placed on a new diet and exercise regimen. Because it creates the entire foundation for
a performance contract, the investment grade audit is the last place in the entire performance
contracting process where shortcuts should be taken or costs cut. Once the importance of the detailed
feasibility study is grasped, then the importance of building simulation can likewise be grasped—as it
is or should be the key tool of choice for performing the detailed feasibility study.
Computerized building simulation is the key tool for performing detailed feasibility studies for a
great number of reasons as will be discussed in the following.
• Confirms the auditor's knowledge of the building.
• Provides an energy balance
• Identifies energy conservation opportunities
• Documents the baseline conditions
• Provides a foundation for future adjustments to the contract baseline
• Builds confidence and teamwork, helping the project (and the ESCO's sale) to proceed
•
Benefits from Building Simulation
Assuming that the computerized building model is constructed along the lines described in this
book, a considerable number of benefits accrue from the use of building simulation in performance
contracting, as follows below.
Confirming the Auditor's Knowledge of the Building
The process of building and calibrating the model causes an interesting thing to take place in the
mind of the energy engineer performing the audit. As a by-product of the process, the auditor
ultimately winds up confirming their knowledge of the building, i.e., that they know most every
energy-using system and/or equipment that exists in the building and that they know pretty much what
happens in the building with those systems and equipment. The upshot of this is that the auditor may
now proceed with developing his project in near-complete possession of the truth and may perform his
work without having to guess or speculate—at least not very much at all.
Creating an Energy Balance of the Building
The foundation of the project is technical ways of improving the operation of the building and
thereby reduce the use and cost of energy, and thereby producing the cash flow stream which
ultimately pays for everything. Now, if the auditor's estimates of potential energy savings are flawed,
then the entire project is flawed. This makes the energy engineer's estimates of savings more accurate.
Say there is a lot more desktop equipment in a building than the auditor thinks there is and, because he
is to lazy to measure the actual connected power draw of the HVAC fans, he allocates this "plug" load
to the fans incorrectly. Well, if a variable volume retrofit of the HVAC system is planned, then the
estimate of savings generated by the computer simulation model will be much greater than the actual
savings produced by this retrofit—unless the auditor makes a convenient (and completely accidental)
counterbalancing error in his simulation of the variable volume retrofit. Unfortunately many, perhaps
especially those enamored of measurement & verification, eschew the preparation of an energy
balance, saying that they only measure the equipment they intend to retrofit and will perform M&V on
that same equipment afterwards. The problem here is that a short term measurement won't capture a
major change in building occupancy or operation that occurred just prior to the audit (say the HVAC
time clock suddenly dying)—and is one that perhaps the building owner isn't even aware of! So they
auditor monitors 24 hour a day operation of the HVAC, bases his savings on this "baseline" (actually a
false baseline) and is then later surprised when the owner objects to the post-retrofit "invoice'' for
savings. Doing an energy balance will catch such "tunnel vision" errors. By doing an energy balance
(in essence, calibrating the simulation model), all the uses of energy are correctly allocated and the
savings projections based thereupon are dramatically more likely to be accurate, and will ultimately
result in a successful, rather than an unsuccessful project.
Identifying Energy Conservation Opportunities
One attendee at our performance contracting seminar observed that frequently the reason that the
energy balance cannot be completed and/or the model not calibrated, is because there is an as-yet
undiscovered energy conservation opportunity! That is, something is operating out of control,
unbeknownst to the auditor—say the chillers are being left in operation during cold weather (would
you believe a 100 kW chiller load in the middle of the night in the middle of the winter in an Austin
Texas college dormitory?). Now, since the auditor does not know this is happening, his model won't
calibrate and sources and uses of energy won't balance. The lazy auditor may just make a "fudge"
change to the model and call it a day. However, the earnest auditor will ponder the problem and
research the building and the existing documentation to ferret out the reason—and will often be
rewarded with a "pot of gold" for his efforts! Yes, it really is this simple (or complex) at times.
Documenting the Baseline Conditions
One of the benefits, particularly for the ESCo is the fact that a well constructed model, with its
supporting documentation, is a detailed statement of the baseline conditions. In one project, we were
called back by the ESCo after the project was in operation for a year—and the savings guarantee
wasn't being met. Among other things, we re-took the electrical readings on the power distribution
panels on each floor—at the exact same locations the readings were taken during the audit (each was
marked with a sticker with the ESCo's logo and a code name). One thing we discovered was that the
desktop equipment load (the "plug" load) had increased some 30% since the audit amounting to more
than 1,000,000 kWh worth some $100,000 per year! While this was not the only problem with the
project, it did save the ESCo a lot of money—and against which he would have been defenseless had
the original computer model/energy balance not been performed!
Providing the Foundation for Future Adjustments to the Baseline
The example immediately above leads immediately into adjusting the baseline once a change in
the baseline conditions has been identified.
In the case above, the increased "plug" load was input to the original model and the contract
baseline equitably adjusted—without dispute on the part of the owner. This adjustment, incidentally,
took into account interactive effects, such as the added air conditioning load imposed by the increase
in desktop equipment, as well.
Building Confidence and Teamwork
While it is hard to put a value on this side-effect of building simulation, once the survey team has
been in the building observing and documenting existing conditions, and then this information is
converted into a calibrated model of the building, the project team, including the owner, arrives at a
very high level of confidence in the veracity of the audit process. Blind faith is great, but faith based
on knowledge is unassailable. In our experience we have seen the ESCo's sale made at the exact
moment in time when the building owner realized that the audit and retrofit team, in a very short
period of time, had exceeded his own in-house staffs' knowledge of the building—and understood
perfectly well how to make the building better!
Conclusion
What I hope you'll go away with from reading this chapter is that computerized building
simulation offers so many benefits to the business of performance contracting that to fail to use it,
even on smaller, simpler buildings (perhaps with a simple spreadsheet model) is a mistake not worth
making.
Appendices
1. Simulation Program Database
2. Standards for Performing Energy Audits
3. Pre-Survey Checklist
4. Field Survey Data Gathering Checklist
5. ECM Work-Up Sheet
6. Project Pricing Checklist
7. Building Model Checklist
8. Forms:
1. Preliminary Building Survey Data (5 Pages)
2. Power Measurement Data (2 Pages)
3. Architectural Take-Off's (2 Pages)
4. Building Occupancy Schedule
5. Air Handling System Modeling Map
6. Equipment Schedules
7. Lighting Take-Off
8. Simulation Schedules
9. Preliminary Building Model
9. Rule of Thumb Values
1—
Simulation Program Database
165 页缺
167 页缺
169 页缺
171 页缺
173 页
2—
Standards for Performing Energy Audit
Standards for Performing Energy Audit
I—
Scope of Work
The energy audit shall be performed as described below:
A. The ESCO shall obtain and review in detail existing documentation, as available, including:
1. Utility company invoices
2. Utility company demand interval recordings of 15/30 minute electrical demand for characteristic
months of the year, where available
3. Record drawings:
a. mechanical
b. plumbing
c. electrical
d. building automation and temperature controls
e. structural
f. architectural
g. modifications and remodels
4. Original construction submittals and factory data (specifications, pump curves, etc.)
5. Operating engineer logs, maintenance work orders, etc.
B. Perform an inspection survey to:
1. Identify the occupancy and use schedules. Interview the facility manager, chief engineer or others
as needed.
2. Identify "process" energy use, such as, production equipment, computer rooms, printing plants,
etc.)
3. Obtain the hours of operation for building systems and equipment.
4. Inspect major energy-using equipment, including:
a. Lighting
b. HVAC
c. Controls and automation
d. Other (process, outdoor lighting, etc.)
5. Compare the as-built configuration of the building systems (mechanical, electrical and
architectural) for significant variation from the original construction documents.
6. Identify and characterize comfort or system-function problems which may impact the
performance of the retrofit work
7. Perform ''late-night" surveys outside of normal business hours or on weekends to confirm
building system and occupancy schedules.
C. Prepare a post-inspection status report and provide to PUBLIC AGENCY, consisting of:
1. a list of energy retrofit opportunities which appear in the judgment of the ESCO to be likely to be
cost effective and therefore warrant detailed analysis,
2. preliminary estimates of installation costs and energy cost savings for each Energy Conservation
Measure option,
3. recommendations for terminating the Energy Audit if it appears unlikely that a project will meet
the agreed upon cost avoidance commitment in the Energy Audit Agreement.
D. Survey major energy-using equipment. Record the following:
1. Equipment name-plate data
2. Identification name/number and/or description
E. Physically measure the peak electrical demand (in kW) of:
1. Major mechanical equipment (such as, pumps, fans, equipment over 5 hp, etc.)
2. Lighting - where power distribution documentation and circuit segregation makes this feasible
3. Process and other significant miscellaneous loads
4. Instantaneous measurements shall encompass approximately 90% of the facility's total electrical
load. Measurements of the entire facility and/or major feeders/risers may suffice where the
in-facility electrical distribution is inadequately documented or where specific loads cannot be
easily segregated.
F. Continuously record the electrical demand of large and/or highly-fluctuating loads over time to
confirm their hours of operation and actual energy use. ESCO shall use its best judgment regarding the
employment of instrumentation and recording durations so as to achieve an accurate and faithful
characterization of the loads.
G. Directly measure the operating parameters of mechanical systems and equipment as necessary for
the analysis, to include:
1. Air handling systems over 10,000 cfm (for smaller systems, name-plate or as-built data shall be
used):
a. fan rpm
b. system static pressures
c. total air flow
d. outside air flow
e. system air temperatures (hot deck, cold deck, etc.)
2. Wet side system water flows (or pump heads)
3. Wet side system water temperatures
H. Observe the function of the temperature controls under actual operating conditions and/or
manipulate the controls as needed to confirm the actual sequence of control (and return to original
settings).
I. Tabulate the data gathered during the survey and process as required. Prepare in a format suitable
for inclusion in the final report.
J. Prepare a computer simulation model of the facility's annual energy use using DOE-2 or TRACE.
Programs other than these must be approved by the PUBLIC AGENCY's project manager prior to
their use. Calibrate the simulation model to actual energy use, within 5% for electrical and 10% for
natural gas use. Demonstrate the model's calibration by providing a graphic comparison of the "base
year" and the "modeled" use showing monthly electric and gas use. Calibration shall have been
demonstrated only when the characteristic shapes of the ''base year" and "modeled" use are the same.
K. Prepare detailed preliminary engineering for each ECM to include:
1. A written description including:
a. the existing conditions
b. the changes to be made
c. the engineering principle(s) which create or cause energy to be saved
2. A detailed scope of the construction work needed, suitable for cost estimating, including
provisions for disposal and handling of hazardous materials
3. Rough sizing of major equipment and a preliminary equipment selection list
4. Layout sketches for complex chiller, boiler, piping, ductwork or other larger or complicated
retrofits
L. Prepare construction cost estimates. Submit cost estimates along with all backup, vendor and
sub-contractor quotations and other supporting detail to the Project Manager for review. Cost
estimates shall include special provisions, overtime, etc., as needed to accomplish the Work with
minimum disruption to the operations of the facilities.
M. For each ECM calculate the following:
a. base year energy use and cost,
b. post-retrofit energy use and cost
c. percent cost-avoidance projected, by retrofit measure, for each individual system or major piece
of equipment.
Calculations shall:
1. Generally employ computer simulation. Simulation-prepared calculations shall be accompanied
by a short explanation of the way the simulation program was used to accomplish the simulation of the
retrofit and the key input data employed. Printouts shall be provided of all Input files and important
output files and shall be included in the Energy Audit. To assist reviewers, documentation shall be
provided which explains how the final savings figures are derived from the simulation program output
printouts
2. Manual calculations may be substituted where simulation is not feasible. If manual calculations
are employed, formulas, assumptions and key data shall be stated.
3. Follow the methodology of ASHRAE or other nationally-recognized authority and be based on
the engineering principle(s) identified in the description of the retrofit option.
4. Provide an accounting for or explanation of how savings duplication between retrofit options is
avoided.
5. Operational and maintenance savings, if any, shall be identified as a separate line item.
N. Prepare a preliminary measurement and verification plan, explaining how each Energy
Conservation Measure, and each type of cost avoidance is to be measured and verified. This plan need
only show intended methodologies, but is not required to identify precise instrumentation and/or
formulae intended for use. -This plan should be carefully enough prepared so as not to materially
conflict with the final measurement and verification plan to be prepared during final negotiations of,
and incorporated into, the Energy Services Agreement.
O. Prepare a proposed "Project Cost" and a list of "Services to be Provided," in anticipation of ESCO
and Public Agency entering into an Energy Services Agreement to design, install, and monitor the
ECMs proposed in the Energy Audit.
Project Cost is the total amount the PUBLIC AGENCY will pay for the Project. The Project Cost
will compensate ESCO services desired by the Public Agency, which may include, but are not limited
to: engineering, designing, packaging, procuring, installing, training, financing, and monitoring of the
ECMs, and preparation of the Energy Audit.
The ESCO shall provide to Public Agency a list of services and the cost for each service, the sum of
which shall equal the total Project Cost.
P. Meet with Public Agency to:
1. review the ECM options proposed in the Energy Audit, and assemble a package of options which is
compatible with the Public Agency's investment and infrastructure improvement goals; and
2. review the proposed Project Cost and list of Services to be Provided to determine which further
services Public Agency may want ESCO to provide.
Q. Provide to Public Agency a draft "Final Energy Audit" which shall include:
1. Body of the report:
a. introduction and summary,
b. a table summarizing the recommended ECMs, each ECM's design and construction cost, the
first year cost avoidance (in dollars and energy units), and simple payback,
c. description of the existing facility, mechanical and electrical systems,
d. description of energy conservation measures, including estimated costs and savings for each,
e. discussion of measures considered but not investigated in detail,
f. conclusions and recommendations.
2. Supporting documents:
a. existing systems and equipment inventory/data,
b. tabulated survey measurements,
c. printout of simulation model of existing facility,
d. detailed scope of construction work,
e. cost estimates, including all detail and vendor and subcontractors' quotes,
f. calculations used to determine estimates of energy cost savings,
g. preliminary measurement and verification plan,
h. a list of permits needed to implement proposed ECMs and any expenses PUBLIC AGENCY
may incur in obtaining these permits,
i. "Statement of Proposed Project Cost and Services to be Provided."
R. Meet with the Public Agency to present and discuss the draft Energy Audit.
S. Revise Energy Audit as directed by PUBLIC AGENCY.
T. Submit the final Energy Audit to PUBLIC AGENCY.
II—
Technologies to Be Considered and Engineer's Qualifications:
A. At a minimum, the technologies listed below, shall be considered during the performance of
preliminary feasibility assessments and detailed feasibility investigations. Should the engineer in
responsible charge believe that a specific technology is either technically or economically unfeasible,
this shall be discussed with the project manager and an agreement settled to either abandon or further
investigate the technology. Any technologies so abandoned, shall have an explanation for abandoning
the technology presented in the final report.
1. Lighting fixture retrofit
2. Lighting controls
3. Building automation/digital controls
4. Air handling systems:
a. variable volume conversion
b. constant volume airflow control
c. zone/area isolation & shutdown
d. air-to-air heat recovery
e. outside air economizer f. return air conversion
5. Plant/equipment modifications:
a. chiller upgrade/replacement
b. cooling tower upgrade/replacement
c. thermal energy storage
d. variable flow chilled water conversion
e. plant automation
f. boiler burner conversion/upgrade
g. boiler low pressure conversion
h. fuel switching
6. Primary voltage power
7. Alternative power production
B. The following criteria establishes PUBLIC AGENCY's expectations and desires regarding the
qualifications of engineers to perform feasibility studies and retrofit design. Engineers may be
independent consultants or in-house engineers employed by the ESCO. ESCO shall submit engineers'
qualifications for Public Agency's approval prior to commencement of any work. Once approved,
ESCO shall use the same engineers throughout the project and shall not change engineers assigned to
the project without Public Agency's written approval.
1. A registered professional engineer is preferred as the engineer in responsible charge.
2. The engineers should have extensive experience performing instrumented field surveys.
3. The engineers should have considerable computerized building simulation experience and
expertise.
4. Engineers shall have worked for or with a design-build contractor, or at least have considerable
experience at designing retrofit work.
5. Engineers should have a high degree of experience and expertise in digital and other control and
automation systems. Engineer shall have designed control and automation systems as a member of a
controls contracting company or independently.
6. Engineers should be able to demonstrate a track record of energy retrofit projects, with
documented successful energy savings performance on facilities comparable to PUBLIC AGENCY's
facilities.
3—
Pre-Survey Checklist
__ Building access (ID's, master keys, etc.)
__ Parking
__ Work room/office at building
__ Utility bills
__ Demand interval records
__ Sub-meter records
__ 81/2 × 11 floor plans
__ As-builts (2 copies)
__ Mechanical
__ Electrical
__ ATC/Automation
__ Architectural
__ Structural
__ Major tenant improvements
__ Major remodels/additions
__ Review as-builts
__ Gather survey instruments
__ Amp probe
__ Power factor meter
__ Recording power meter
__ Alnor Velometer (10" static probe)
__ Rotating vane anemometer
__ Pitot tube & manometer
__ Hand Tachometer
__ Two 0-100# pressure gauges
__ Temperature recorder
__ 1" dial thermometer(s)
__ Digital thermometer(s)
__ Elapsed time/event recorder (data logger?)
__ Camera/Film
4—
Field Survey Data Gathering Checklist
Field Survey
Data Gathering Checklist
General
__ Building occupancy schedule (Bldg. mgr. interview)
__ Unusual loads - computers, print rooms, shops, etc. (bldg. mgr. interview)
__ Building operations
__ Air handling
__ Central plant
__ Lighting
__ Other____________________________
(Interview chief engineer, janitorial supervisor, etc.
__ Equipment data (existing)
__ Equipment lists
__ Name plate data
__ Submittals
__ Pump curves
__ Fan curves
__ Operating logs
__ Equipment schedules
(Interview chief engineer)
__ Familiarity tour (Building layout, equipment locations, etc.)
__ Plan new data collection
Mechanical
__ Air handling units
__ Name plate data
__ Air flow (total)
__ Air flow (outside air)
__ System type
__ ATC configuration/operation
__ Physical condition
__ Control valve type
__ Confirm/deny as-built condition
__ Photographs as required
(Interview chief engineer)
__ Central cooling plant
__ Refrigeration name plate data
__ Pump name plate data
__ Water flow at operating conditions
__ Photographs as required
(Interview chief engineer)
__ Confirm operating schedules
Electrical
__ Redraw/confirm single-line
__ Measure all loads at "Peak" (V,A,PF)
__ Lighting by floor
__ 120V power by floor
__ Mechanical equipment
__ Miscellaneous
__ Measure selected loads at "minumum" conditions
__ Monitor chiller(s) and ambient temperature
__ Monitor selected loads
__ Elevators
__ Computers
Other________________________
__ Conduct evening "lights on?" tour with sample FC readings
__ Examine/photograph typical fixtures
Architectural
__ Confirm "as-built" condition
__ Floor plans
__ Walls
__ Windows
__ Roof(s)
__ Identify unusual roofs, overhangs, etc.
__ Photograph exterior
__ Measure glass S.C. if specs, not available
Special
__ Identify and investigate special situations as encountered
__ Mechanical
_______________________
__ Electrical __________________________
__ Other _____________________________
5—ECM Work-Up Sheet
6—
Project Pricing Checklist
Project Pricing Check-List
Retrofit work:
__ Materials
__ Labor
__ Sub contractor
__ Design
__ Start-up
__ Monitoring
Contract cost:
__ Legal
__ Cpm
__ Energy accounting
__ Administrative (M&V)
__ Insurance
__ Property taxes
7—
Building Model Checklist
Building Model Checklist
Electrical
__ Plot demand on typical days
__ Lighting loads by floor
__ Miscellaneous loads by floor
__ Mechanical equipment loads
__ base utilities (parking garage, outdoor lights, etc.)
__ Reconstruct day/night demand
GENERAL (JOB)
__ Location/climte
__ Design conditions
__ Economic parameters
__ Rate schedules
ARCHITECTURAL (LOADS)
__ Zoning/orientation
__ System assignment
__ Floor square feet
__ Roof square feet
__ Wall square feet
__ Window square feet/% glass
__ Wall ''U"
__ Roof "U"
__ Window "U"
__ Window "SC"
__ Lighting watts/square feet
__ Misc. loads watts/square feet
__ Lighting schedules
__ Misc. loads/base utility schedules
__ Occupancy schedules
__ Shading
AIR HANDLING (SYSTEMS)
__ System type
__ % ventilation air
__ CFM (by zone)
__ Operating schedules
__ Reset/lockout/special ATC
__ Fan static
__ Supply air temps.
CENTRAL PLANT (EQUIPMENT)
__ Refrigeration type
__ Refrigeration capacity/C.O.P.
__ Refer sequence
__ CHW pump KW/head
__ Pump sequence
__ Boiler type
__ Boiler capacity/efficiency
__ Pump KW/head
__ Fan types
__ Fan kWs
__ Accessory energy use (cooling towers!)
ECONOMIC (ECONOMIC)
__ Utility rates
__ Master/alternate economic input
Note: Names in parentheses refer to sections of input file for the TRACE program.
8—
Forms
General Instructions for Electrical Measurements
1. CAUTION!!!! Taking electrical measurements in the field is a task which requires a significant
amount of knowledge and experience in the design, construction and operation of electrical equipment.
Significant exist when partially disassembling or opening live electrical switchgear, cabinets and the
like. Before attempting such work you should be well versed in electrical equipment and related safety
practices.
2. Electrical measurements will always include voltage, amperage and power factor. Numerous power
factor meters are available however, the unit produced by AEMC is highly recommended as it is easy
to use and very durable. AEMC may be contacted by dialing 1-800-343-1391.
3. The form entitled "Power Measurement Form" shall be used for recording all readings. The name of
every load shall be recorded, the time of the reading shall be periodically recorded (every 30 minutes
or so), the average voltage shall be recorded and the current and power factor recorded for each leg
which is read.
4. All readings will be taken as though all loads, including three phase loads, are single phase loads.
This means that the voltage to be recorded shall be the line-to-neutral (or ground) voltage and the
power factor reading shall be taken by connecting the voltage leads to the leg being read and neutral
(or ground).
5. When taking readings in a power distribution panel or motor control center, the line-to-neutral or
ground) voltage may be read for each leg, averaged and immediately recorded for all loads. In other
words, it needs to be done only once for each group of readings.
6. When taking readings at individual devices (isolated starters, disconnects, junction boxes, etc.) a bit
more care must be taken. It occasionally happens that single phase loads are provided with three phase
voltage. For example, in 120/208 volt systems it is not uncommon to connect air conditioning
equipment which is single phase, 208 volts. In this case the equipment is connected across two legs or
two phases of the 208 volt three phase system and when opening the disconnect two wires are in
evidence. Unfortunately, this can look identical to opening a disconnect on a single phase 120 volt
load which is connected to a single leg of the 208 three phase and the neutral leg. These readings are
done in the same fashion as described above except that the voltage will be read for each leg which is
"hot." In this fashion a single-phase 208 volt load will have a current and power factor reading taken
for each leg, however, a single phase 120 volt load will only have a reading taken on the "hot" leg, as
no voltage will be measurable on the neutral leg.
This procedure simplifies the process of measuring and calculating connected loads. By
following this procedure, that is, taking measurements only on "hot" legs (when outside of panels and
motor control centers, the technician takings readings does not need to determine the electrical
connection of the device being measured, but only follow the procedure as described herein to achieve
a correct and accurate reading. In addition, the mathematics of calculating power is also simplified.
Instead of having to remember which formula to use, all power calculations are simply volts x amps x
power factor, and multi-phase loads are simply the sum of the power in each leg.
9—
Rule of Thumb Values
''RULE OF THUMB" VALUES
PARAMETER
VALUE
UNITS
APPLICATION
HEATING CAPACITY
15–20
BTU/SF
NEWER BUILDINGS, LOW VENTILATION
RATES
20–30
BTU/SF
OLDER BUILDINGS OR HIGH VENTILATION
RATES
40–50
BTU/SF
VERY OLD BUILDINGS OR VERY HIGH
VENTILATION RATES
COOLING CAPACITY
250±
SF/TON
CONFERENCE
ROOMS,
VERY
EQUIPMENT LOADS
400±
SF/TON
TYPICAL OFFICE SPACE
600±
SF/TON
RESIDENTIAL
AIRFLOW
400±
CFM/TON
ALL SYSTEMS
CHILLED WATER FLOW
2.5±
GPM/TON
ALL SYSTEMS
CONDENSER WATER FLOW
3.0±
GPM/TON
ALL SYSTEMS
REFRIGERATION
1.2±
KW/TON
AIR COOLED RECIPROCATING
0.9±
KW/TON
WATER COOLED RECIPROCATING
HIGH
VENTILATION
LIGHTING LOAD
0.6±
KW/TON
WATER COOLED CENTRIFUGAL
.05
CFM/SF
INFILTRATION OR CLOSED DAMPERS
0.1±
CFM/SF
CODE MINIMUM
0.2±
CFM/SF
ASHRAE STANDARDS
0.4±
CFM/SF
NURSING HOMES, LABORATORIES
.5–2.0
CFM/SF
HOSPITALS
.5-–1.0
WATTS/SF
LOW
-
HALLWAYS,
VERY
EFFICIENT
BUILDINGS
MISCELLANEOUS
1.5–2.0
WATTS/SF
MEDIUM - TYPICAL OFFICE BUILDINGS
2.5–3.5
WATTS/SF
HIGH - LABS, TESTING, ETC.
OR .3–.5
WATTS/SF
"PLUG" POWER
LOW - OLDER OFFICE BUILDINGS - VERY
FEW P.C.'S
.5–1.0
WATTS/SF
MEDIUM - TYPICAL OFFICE SPACE
1.0–1.5
WATTS/SF
HIGH - DENSELY OCCUPIED OFFICES EVERYONE WITH A P.C.
SUPPLY FAN HP
.25–.5
HP/1000CFM
LOW - LOW-RISE OFFICES WITH FAN-COIL
UNITS OR SMALL ROOFTOP A/C UNITS
.75–1.25
HP/1000CFM
MEDIUM - TYPICAL LOW-RISE OFFICE
BUILDINGS WITH CENTRAL AHU'S
References and Bibliography
The following references and bibliography are meant to provide the reader with sources of additional
information as a supplement to or in counterpoint to the text.
ASHRAE. 1989. "An Annotated Guide to Models and Algorithms for Energy Calculations Relating to
HVAC Equipment," Atlanta Georgia.
ASHRAE. 1995. "Handbook: HVAC Applications, Chapter 37—Building Energy Monitoring,"
Atlanta Georgia.
ASHRAE. 1995. "Handbook: Fundamentals, Chapter 30—Energy Estimating and Modeling
Methods," Atlanta Georgia.
Benton, C., Chace, J., Huizenga, C., Hydeman, M., and Marcial, R. 1996. "Taking a Building's Vital
Signs: A Lending Library of Handheld Instruments," Proceedings of the ACEEE 1996 Summer Study
on Energy Efficiency in Buildings, Vol. 4, pp. 4.11–4.21.
Clarke, J., Strachan, P., and Pernot, C. 1993. "An Approach to the Calibration of Building Energy
Simulation Models," ASHRAE Transactions, Vol 99, Pt. 2, pp. 917–927
Honeywell, Inc. 1979. "Energy Conservation With Comfort: The Honeywell Energy Conserver's
Manual and Workbook," Fourth Printing, Minneapolis, Minnesota.
Kaplan, M.B., Caner, P., and Vincent, G.W. 1992. "Guidelines For Energy Simulation of Commercial
Buildings," Proceedings from the ACEEE 1992 Summer Study on Energy Efficiency in Buildings, Vol.
1, pp. 1.137–1.147.
Kissock, K., 1997. "Tracking Energy Use and Measuring Chiller Retrofit Savings Using WWW
Weather Data and New Etracker Software, Proceedings from the Cool $ense Forum on Integrated
Chiller Retrofits, Sept., 1997, Lawrence Berkeley National laboratory, Berkeley, California.
Kreider, J., and Haberl, J. 1994. "Predicting Hourly Building Energy Use: The Great Energy Predictor
Shootout," ASHRAE Journal, pp. 72–81, June.
Manke, J.M. and Hittle, D. 1996. "Calibrating Building Energy Analysis Models Using Short-Term
Test Data," Proceedings of the ASME/JSME Solar Energy Conference, November.
Norton, G.R. 1994. "Special Study: Energy-Saving Devices and Services Budgeted for by School
Districts," Report to the Arizona Legislature by the Auditor General
SMACNA. 1985. "Handbook of HVAC Retrofit," Sheet Metal and Air Conditioning Contractors
National Association, Chantilly, Virginia.
Schiller, S. 1998, "M&V Manual," 1998 California Non-Residential Standard Performance Contract
Program, Oakland, California.
USAF. 1978. "Engineering Weather Data," Department of the Air Force Manual AFM 88-29. U.S
Government Printing Office, Washington, DC.
U.S. Department of Energy. 1997. "International Performance Measurement and Verification
Protocol," Efficiency and Renewable Energy Clearing House (EREC), Washington, DC.
Waltz, J. 1998. "Measurement & Verification Options for Performance Contracts." Energy &
Environmental Management. Spring 1998, pp. 36–43.
Waltz, J. 1997. "Don't Ignore Variable Flow." Contracting Business. July 1997, pp. 108–114.
Waltz, J. 1997. "Performance Contracting—How to be Sure it Works Well." Strategic Planning for
Energy and the Environment. Vol 16, No. 4, 1997, pp. 38–49.
Waltz, J. 1996. "Variable Flow Chilled Water Systems." Energy & Environmental Management. Fall
1996, pp. 44–47.
Waltz, J. 1995. "How to Marry an ESCo (and not have to worry about divorce)." Energy &
Environmental Management. Fall 1995, pp. 22–27.
Waltz, J. 1995. "Whole-Building Energy Efficiency." Energy Users News. June 1995, pp. 23–42.
Waltz, J. 1995. "Finding the Silver Lining in CFC Chiller Retrofit." RETSIE Proceedings. 1995.
Waltz, J. 1995. "Integration, Reducing the Cost of CFC Chiller Replacement." Consulting-Specifying
Engineer. January 1995, pp. 43–48.
Waltz, J. 1995. "Chapter 16: Computer Software for Energy Audits." Handbook of Energy Audits.
Fourth Edition, pp. 403–441, The Fairmont Press.
Waltz, J. 1994. "Chapter 13: Demand-Side Management and the Energy Services Industry."
Retrofitting Buildings for Energy Conservation. Second Edition, pp. 185–230, The Fairmont Press.
Waltz, J. 1994. "Computerized Building Simulation . . . A DSM Strategy?" GLOBALCON
Proceedings. 1994
Waltz, J. 1993. "Monitoring and Evaluating DSM and Energy Services Projects." Cogeneration and
Competitive Power Journal. Vol 8, No. 3, 1993, pp. 62–73.
Waltz, J. 1992. "Energy Service Projects: Case studies in Success and Failure." DSM Quarterly.
Summer 1992, pp. 21–26.
Waltz, J. 1992. "Effective Energy Management Planning." Hospital Energy Management Strategies
Seminar. PG&E's Pacific Energy Center, 1992
Waltz, J. 1992. "Practical Experience in Achieving High Levels of Accuracy in Energy Simulations of
Existing Buildings." ASHRAE Transactions. Symposium AM-92-1-2.
Waltz, J. 1989. "Variable Flow Conversions for Chillers." Energy Engineering. Vol 21, 1989, pp.
59–65.
Waltz, J. 1989. "Single Loop Variable Flow Chilled Water Systems. HVAC & Building Systems
Congress Proceedings. 1989
Waltz, J. 1987. "The Four M's of Energy Management." Buildings Design Journal. June 1987, pp.
16–21.
Waltz, J. 1981. "The Energy Maze: How Computers Can Help You Choose the Right Retrofit
Options." MANAGEMENT Insights. Winter 1981, pp. 3–11.