1
INTREPID User Manual
Library | Help | Top
Flight Path Editor (T19)
1
| Back |
Flight Path Editor (T19)
Top
The Flight Path Editor has two functions as an INTREPID tool.
•
It provides traverse line path editing facilities which enable you to check the
spatial coherence of a survey. You can view and verify different aspects of the
dataset including a range of data validation tests. You can delete sections of
traverse lines that do not meet your specifications. The Flight Path Editor is a
quick and effective tool for checking survey quality.
•
It enables you to visualise and superimpose different types of datasets which are
spatially coincident, and perform useful functions such as query, and zoom and
pan.
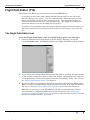
The Flight Path Editor tool
>> To use Flight Path Editor with the INTREPID graphic user interface
1
Choose Flightpath from the Edit menu in the Project Manager, or use the
command fedit.exe. INTREPID displays the Flight Path Editor Main window.
2
If you will be processing a large line dataset and wish to speed up the data display
on the screen, or otherwise wish to adjust the display subsampling rate, adjust it
using the Display Subsampling option from the Line Display menu. (See Setting
the display subsampling interval for details).
3
If you have previously prepared input line dataset specifications for Flight Path
Editor, load the corresponding task specification file using Load Options from the
File menu. (See Specifying input and output files for detailed instructions.)
Note that in interactive mode INTREPID will only use the input line dataset
specifications in a Flight Path Editor task specification file (See Displaying
options and using task specification files for more information). If you do not wish
to load any further datasets, go to step 5.
Library | Help | Top
© 2012 Intrepid Geophysics
| Back |
INTREPID User Manual
Library | Help | Top
4
Flight Path Editor (T19)
2
| Back |
Specify the dataset(s) that you wish to display or edit. Use Load Line Dataset,
Load Point Dataset and/or Load Grid Dataset from the File menu as required.
(See Specifying input and output files for detailed instructions.)
If you are displaying a grid dataset INTREPID will first display it using grey
scale.
If you are displaying a point dataset INTREPID will prompt you to specify Z fields
for the colour and size of the points displayed.
INTREPID displays the dataset(s) in the Flight Path Editor Main window.
5
Examine and/or manipulate the display of the dataset(s) according to your
requirements as follows. You may also perform these operations during flight
path editing in step 7.
•
If you are displaying a grid dataset, switch between grey scale, pseudocolour and
sun angle displays and modify the parameters for these display formats as
required using options from the grid display menu (See Grid dataset display for
details).
•
If you are displaying a points dataset, turn colour and size Z data display on and
off as required. (See Point dataset display for details.)
•
If you are editing or displaying a line dataset and wish to examine a Z field during
the process, specify the corresponding Z field using Load Z Field For Line Dataset
from the File menu. (See Specifying input and output files for detailed
instructions.
•
Zoom (enlarge an area of the display) and/or pan (examine different regions while
enlarged) (See Zooming and panning the display for information).
•
Query points (or distances or pairs of points in a single line of a line dataset) in
the dataset display. INTREPID will report information about the point(s) in the
Flight Path Editor Main window (See Querying points for details)
6
If you are not editing a line dataset go to step 10.
7
Detect the portions of traverse lines that you wish to delete by
•
Viewing the dataset with appropriate display options;
•
Using query operations.
See Line Dataset display for details.
8
Save the results of line data validation tests if required (See Saving line data
validation results for details).
9
Set segments and ends of traverse lines to null as required. Specify the end or
segment and use Delete End/Segment from the Edit menu. See Deleting
segments of traverse lines for details.
10 Repeat the data viewing and editing operations (steps 5–9 (or 4–9 including
adjusting loaded datasets)) as required.
11 If you wish to save the edited data, specify field names for the new X and Y
geographic location data using Save Output X and Y Fields from the File menu.
INTREPID will save the new X and Y data for your dataset as specified. See
Specifying input and output files for detailed instructions.
Library | Help | Top
© 2012 Intrepid Geophysics
| Back |
INTREPID User Manual
Library | Help | Top
Flight Path Editor (T19)
3
| Back |
12 If you wish to record line dataset input and output specifications and the editing
operations performed in this session as a task specification (.job) file in order to
repeat a similar task in batch mode later or for some other reason, use Save
Options from the File menu. (See Specifying input and output files for detailed
instructions.)
Note that the Flight Path Editor can only record input and output line dataset
field specifications and line editing processes in task specification files. (See
Displaying options and using task specification files for more information).
13 If required, repeat steps 2–12, varying the parameters and/or data files as
required.
14 To exit from Flight Path Editor, choose Quit from the File menu.
Notes:
•
You can control the effect of mouse operations in the dataset display area using
the Mouse Mode options in the Command area of the Flight Path Editor Main
window. See Mouse mode summary for details.
•
To view the current set of traverse line editing specifications choose Report from
the Window menu. INTREPID displays the Flight Path Editor Report window.
See Displaying options and using task specification files for details and an
example of a set of specifications.
•
You can view Help information by choosing options from the Help menu (See
Help).
•
You can execute Flight Path Editor line editing tasks as a batch task using a task
specification (.job) file that you have previously prepared. See Displaying
options and using task specification files for details.
Specifying input and output files
To use Flight Path Editor, you will need to specify the dataset(s) you wish to view. If
you wish to examine the Z data from a line dataset during the process, you must also
specify the Z field. If you wish to edit a line dataset and save the edited data, specify
field names for the new X and Y geographic location data.
INTREPID identifies the X, Y, line number and fiducial fields using dataset aliases.
The dataset must have the following aliases, identifying appropriate field files.
Alias
Field File
X
X coordinate (geographic location)
Y
Y coordinate (geographic location)
LineNumber
line number *
FID
fiducial sequence *
* These fields are optional. If you do not specify them, INTREPID will prompt you
with an Open dialog box to specify them. If you do not specify them INTREPID will
use a default system to create the missing numbers (SeeLine, fiducial and point
numbers for details).
See "Vector dataset field aliases" in INTREPID database, file and data structures
(R05) for more information about aliases.
Choose the options as required from the File menu.
Library | Help | Top
© 2012 Intrepid Geophysics
| Back |
INTREPID User Manual
Library | Help | Top
Flight Path Editor (T19)
4
| Back |
In each case INTREPID displays an Open or Save As dialog box. Use the directory
and file selector to locate the file you require. (See "Specifying input and output files"
in Introduction to INTREPID (R02) for information about specifying files).
Load Line Dataset Use this option to specify the line dataset you wish to examine or
edit. INTREPID will open the dataset, locate the X and Y geographic coordinate
fields using dataset aliases and display the lines in the Flight Path Editor Main
window.
Load Z field for Line Dataset Use this option to specify the Z field that you wish to
use for
•
The Z data noise profile display (See Viewing Z data noise for details) or
•
The Z data range, Z data gradient or Z data null data validation displays. (See
Line data validation for details.)
Save Output X and Y Fields Use this option to save the results of the flight editing
process in new X and Y geographic coordinate fields. INTREPID displays
separate Save As dialog boxes for the X and Y field files.
If you will be using INTREPID tools that require X and Y aliases and wish these
fields to become the new main X and Y fields for the dataset, edit the aliases
accordingly. See "Editing the dataset aliases" in INTREPID Old Project Manager
(T01) for detailed instructions.
Save Validation Field Use this option to save a new field in the loaded line dataset
containing results of the current line data validation process. See Saving line
data validation results for details.
Load Point Dataset Use this option to specify a point dataset if you wish to display
one. If you choose this option INTREPID displays the Load Z Field for Point Size
and Load Z Field for Point Colour dialog boxes. Respond to the dialog boxes
accordingly. (See Point dataset display for an explanation of this use of Z fields)
Load Grid Dataset Use this option to specify a grid dataset if you wish to display
one. INTREPID displays the dataset using grey scale. You can change the
display to pseudocolour or sun angle and set the parameters for each display style.
See Grid dataset display for instructions.
Load Options If you wish to use an existing task specification file to specify the
input line dataset, use this option to specify the task specification file required.
INTREPID will load the file and use its contents to load the corresponding line
dataset. (See Displaying options and using task specification files for more
information).
Save Options If you wish to save the current Flight Path Editor line dataset input
and output specifications and the editing operations performed in this session as a
task specification file, use this option to specify the filename and save the file.
(See Displaying options and using task specification files for more information).
Library | Help | Top
© 2012 Intrepid Geophysics
| Back |
INTREPID User Manual
Library | Help | Top
Flight Path Editor (T19)
5
| Back |
Changing aliases after using the Flight Path Editor
After the flight path editing process, you will have a new version of the X, Y
(geographic location) data. You may wish this data to become the principal X, Y data
for the dataset. If so, you will need to assign the X and Y aliases to these fields.
For example, the original X and Y fields may be called Xorig and Yorig. After flight
path editing, you may have saved the corrected X and Y fields as Xvalid and
Yvalid. In this case you would need to assing the X and Y aliases to these new
fields.
See "Editing the dataset aliases" in INTREPID Old Project Manager (T01) for
detailed instructions.
Line, fiducial and point numbers
If the dataset has a line numbers alias (LineNumber), INTREPID uses the line
numbers from this field.
If there is no LineNumber alias, INTREPID assigns line numbers to the data
groups (lines) as they occur, starting with 0.
If there is a Fiducial alias, INTREPID uses the data in the fiducial field.
If there is no Fiducial alias, INTREPID assigns fiducial sequence numbers to the
points as they occur in the dataset, starting with 0. In this case INTREPID will not
be able to detect fiducial sequence interruptions (See Line data validation for details).
Mouse mode summary
Flight Path Editor has a variety of mouse operations, determined by the mouse mode
options located at the bottom of the Main window Command area.
>> To select a mouse mode
Select the corresponding Mouse mode option button.
Zoom Using this mode you can define rectangular regions for zooming the data
display. See Zooming and panning the display for details.
Query Using this mode you can click points and drag between pars of points to obtain
information about the data they represent. See Querying points for details.
Library | Help | Top
© 2012 Intrepid Geophysics
| Back |
INTREPID User Manual
Library | Help | Top
Flight Path Editor (T19)
6
| Back |
Select Ends Using this mode you can specify ends of traverse lines for clipping. See
Deleting the ends of traverse lines.
Select Segments Using this mode you can specify segments of traverse lines for
clipping. See Deleting segments of traverse lines.
Select Lines Using this mode you can select individual lines. INTREPID displays
the current selected line in red. You can observe a selected line's path and extent
and delete it if required. See Deleting traverse lines and Viewing a single
traverse line in red below for further details.
General display controls and options
The Flight Path Editor has a large range of display controls and query operations.
We have provided these to enable you to visualise your datasets and, in flight path
editing, to assist you with detecting traverse line segments that are unsuitable for
inclusion in the dataset.
While using the Flight Path Editor with one or more datasets you can
•
Zoom (enlarge parts of the display) and pan (view different regions of the dataset
displayed when it has been enlarged)
•
View information about points or pairs of points in the display.
•
Choose grey scale, pseudocolour or sun angle display for grid datasets (See Grid
dataset display).
•
Determine point size and colour according to the values of Z fields in point dataset
display (See Point dataset display).
•
Choose from a wide range of line dataset display options (See Line Dataset
display).
Screen redrawing
The Flight Path Editor is designed to work with datasets of unlimited size.
Large datasets require lengthy processing and therefore screen redrawing may take
some time. In order to show you the most up to data version of the datasets
displayed, INTREPID performs redraws after most operations. The delays caused by
these redraws may cause some frustration.
Due to our efforts to minimise screen redraws, INTREPID may fail to redraw the
screen occasionally when you do require a redraw.
This section explains how to alleviate screen drawing delays and how to trigger a
screen redraw if required.
If screen redrawing is too slow
Library | Help | Top
•
Choose Stop Redraw in the Command area if you do not require the current
redraw before performing the next Flight Path Editor operation.
•
If line dataset redrawing is slow, decrease the display subsampling rate and
remain in Zoom mouse mode whenever possible. INTREPID will only redraw the
proportion of data points specified by the rate. See Setting the display
subsampling interval for further details about subsampling.
•
If you have several datasets loaded (e.g., a line dataset and a point dataset and a
grid dataset), consider performing your operations without one or more of the
datasets.
© 2012 Intrepid Geophysics
| Back |
INTREPID User Manual
Library | Help | Top
Flight Path Editor (T19)
7
| Back |
If you need to trigger a screen redraw
>> To trigger a screen redraw
•
Click the pan/zoom indicator square in the Command area or
•
Change the size of the Flight Path Editor window slightly by dragging its border.
Zooming and panning the display
You can enlarge and reduce the display (zoom in and out) and view different parts of
it (pan).
>> To zoom in and out (enlarge/reduce) by steps
To zoom in (enlarge the display) choose Zoom In in the Command area of the Flight
Path Editor Main window. Each time you choose this button, INTREPID will
enlarge the display by 25%.
To zoom out (reduce the display) choose Zoom Out in the Command area of the Flight
Path Editor Main window. Each time you choose this button, INTREPID will reduce
the display by 25%.
You can use these buttons at any time, no matter what mouse mode you have
selected.
>> To zoom in on a selected area of the display
Select Zoom from the Mouse Mode options.
Hold down the left mouse button and drag diagonally (corner to corner) across the
area that you wish to enlarge. INTREPID will enlarge the selected region to fill the
Data area of the window. If you choose Zoom Out, having used this zooming in
process, INTREPID will immediately zoom out to the full dataset display.
Library | Help | Top
© 2012 Intrepid Geophysics
| Back |
INTREPID User Manual
Library | Help | Top
Flight Path Editor (T19)
8
| Back |
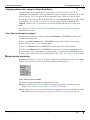
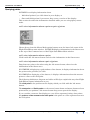
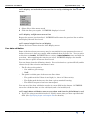
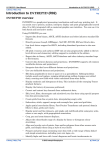
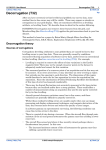
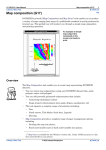
The illustration below is the a zoomed-in part of the grid dataset illustrated in section
Grid dataset display.
>> To pan a zoomed-in display (view different parts)
The Pan/zoom indicator at the right of the Flight Path Editor Main window in the
centre consists of a small square within a larger square. The large square represents
the whole display and the small square the part visible on the screen. When you drag
the small square to a different part of the large square INTREPID shows the
corresponding part of the display.
If you have zoomed out to view the whole display, the small square may occupy the
whole of the large square and may therefore not be visible.
You can use the Pan/zoom indicator at any time, no matter what Mouse Mode (Query,
Clip Ends, Null Segment, Zoom) you have selected.
Library | Help | Top
© 2012 Intrepid Geophysics
| Back |
INTREPID User Manual
Library | Help | Top
Flight Path Editor (T19)
9
| Back |
Querying points
INTREPID can display information about
•
Individual points if you click them in your display or
•
Start and finish points if you mouse drag across a section of the display.
This section describes the information obtained while you are using Query mouse
mode.
>> To view information about a point or pair of points
Choose Query from the Mouse Mode option buttons near the lower left corner of the
Flight Path Editor main window. INTREPID displays information in the Status area
at the top of the Command area of the Flight Path Editor Main window.
>> To view information about a point
Click it with the left mouse button and view the information in the Status area.
>> To view information about a pair of points
Drag from one point to the other using the left mouse button, then view the
information in the Status area.
If INTREPID is displaying a grid without a line dataset, it displays information about
the point on the grid that you click.
If INTREPID is displaying a line dataset, it displays information about the nearest
point on a line to the click point.
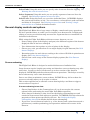
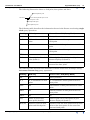
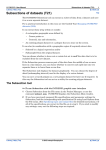
The following definitions, diagram and tables will help to explain the way that Flight
Path Editor reports information to you.
The click point is the position on the display which you click with the left mouse
button.
The start point and finish point are the mouse button down and mouse button release
points when you perform a left mouse button drag across part of the display.
If you consider a traverse line display as a set of line segments joining data points,
the point on a line nearest to the click point is the point on a line segment nearest to
the click point.
Library | Help | Top
© 2012 Intrepid Geophysics
| Back |
INTREPID User Manual
Library | Help | Top
Flight Path Editor (T19)
10
| Back |
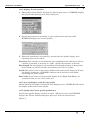
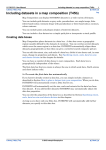
The following illustration shows a click point, data points and lines.
Subsampled data point
Click Point
Nearest subsampled data point on line
Nearest point on line
Subsampled data point
Subsampled data point
The following table describes the information shown in the Status area during single
click query operations.
Heading
Grid only
Line or Line + Grid (Query Mode)
km
n/a
Survey distance
X, Y
X, Y coordinate of click
point
X, Y coordinates of data point nearest to
click point
Line
n/a
Line number of data point nearest to click
point
FID1
n/a
Fiducial number of data point nearest to
click point
FID2
n/a
n/a
Val
Value of grid cell at click
point (band 0)
Value of grid cell at click point (if grid
dataset displayed) (band 0)
Dist (m)
n/a
Distance from nearest point on a line to
nearest line data point
The following table describes the information shown under these headings during
left mouse button drag query operations
Library | Help | Top
Heading
Grid only
Line or Line + Grid(Query Mode)
km
n/a
Survey distance
X, Y
X, Y coordinates of start
point
X, Y coordinates of data point nearest to
start point
Line
n/a
Line number of data point nearest to start
point
FID 1
n/a
Fiducial number of data point nearest to
start point
FID 2
n/a
n/a
Val
Value of grid cell at
start point (band 0)
Value of grid cell at start point (if grid
dataset displayed) (band 0)
Dist (m)
distance between start
point and finish point
Distance from line data point nearest start
point to line data point on the same line
nearest finish point
© 2012 Intrepid Geophysics
| Back |
INTREPID User Manual
Library | Help | Top
Flight Path Editor (T19)
11
| Back |
Grid dataset display
If you are viewing a grid dataset you can choose pseudocolour, grey scale or sun angle
display. INTREPID uses grey scale when it first displays the grid.
Use the options from the Grid display menu to specify your grid display method.
Pseudocolour display
If you choose pseudocolour display without modifying the Low Clip and High Clip
parameters INTREPID will apply a fixed range pseudocolour display to your grid.
This involves dividing the range of cell values in your grid into equal parts
corresponding to pseudocolour values and assigning colours to the cell values
accordingly. The 256 basic pseudocolour values are set out in the lookup table
pseudocolour.lut (See "Colour Lookup Tables" in INTREPID database, file and
data structures (R05) for details).
If you set Low Clip and/or High Clip values INTREPID will assign
•
The lowest ranking colour to all grid cells whose value is less than or equal to the
Low Clip value.
•
The highest ranking colour to all grid cells whose value is greater than or equal to
the High Clip value.
•
The other colours in the pseudocolour range to other cells in the grid on the basis
described above.
>> To specify pseudocolour display for your grid
1
Choose Grid With Pseudocolour from the Grid Display menu. INTREPID
displays the Pseudocolour for Grid Dataset dialog box.
2
Specify or reset Low Clip and High Clip values if required
To restore the Low Clip and High Clip values to the minimum and maximum cell
values, choose Reset. Otherwise enter the values (in Z units) in the corresponding
text boxes.
Library | Help | Top
© 2012 Intrepid Geophysics
| Back |
INTREPID User Manual
Library | Help | Top
3
Flight Path Editor (T19)
12
| Back |
Choose OK.
INTREPID displays the grid using pseudocolour.
Grey scale display
If you choose grey scale display without modifying the Low Clip and High Clip
parameters INTREPID will apply a fixed range grey scale display to your grid. This
involves dividing the range of cell values in your grid into equal parts corresponding
to grey scale values and assigning colours to the cell values accordingly. The 256
basic grey scale values are set out in the lookup table greyscale.lut (See "Colour
Lookup Tables" in INTREPID database, file and data structures (R05) for details).
If you set Low Clip and/or High Clip values INTREPID will assign
•
The lowest ranking shade to all grid cells whose value is less than or equal to the
Low Clip value.
•
The highest ranking shade to all grid cells whose value is greater than or equal to
the High Clip value.
•
The other shades in the grey scale range to other cells in the grid on the basis
described above.
>> To specify grey scale display for your grid
1
Choose Grid With GreyScale from the Grid Display menu. INTREPID displays
the Pseudocolour for Grid Dataset dialog box.
The Low Clip and High Clip text boxes will at first contain the minimum and
maximum cell values.
Library | Help | Top
© 2012 Intrepid Geophysics
| Back |
INTREPID User Manual
Library | Help | Top
2
Flight Path Editor (T19)
13
| Back |
Specify or reset Low Clip and High Clip values if required
To restore the Low Clip and High Clip values to the minimum and maximum cell
values, choose Reset. Otherwise enter the values (in Z units) in the corresponding
text boxes.
3
Choose OK.
INTREPID displays the grid using grey scale.
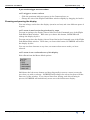
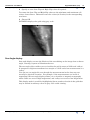
Sun Angle display
Sun angle display creates the illusion of the sun shining on the image from a chosen
angle, creating a system of illuminated areas.
The sun angle effect enables you to visualise the grid in terms of 'hills' and 'valleys'.
It interprets a high measurement in a sample as a 'hill' and a low measurement as a
'valley'.
You can use sun angle this even though the measurements in the data may not
actually be physical elevation. For example, if the measurements are levels of
magnetism, the sun angle display allows you to visualise a 'magnetic topography'
where 'hills' are areas of high magnetism, and 'valleys' are areas of low magnetism.
This display mode is useful for highlighting linear trends or breaks in the grid that
may be missed in ordinary colour or grey scale coded viewing.
Library | Help | Top
© 2012 Intrepid Geophysics
| Back |
INTREPID User Manual
Library | Help | Top
Flight Path Editor (T19)
14
| Back |
>> To specify sun angle display for your grid
1
Choose Grid With Sun Angle from the Grid Display menu. INTREPID displays
the Sun Angle for Grid Dataset dialog box.
2
Specify Declination, Inclination and Vertical Exaggeration as required, then
choose OK. INTREPID displays the grid in sun angle format.
Declination is the 'compass' direction of the line from the overhead point to the 'sun'.
A declination of 0° means that the 'sun' is North of the overhead point. A
declination of 90° means that it is East of the overhead point. –90° means West
and +180°or –180° means South. The default declination is 45°
Inclination is the angle of the 'sun' between the horizon and the overhead point. An
inclination of 0° means that the 'sun' is on the horizon and an inclination of 90°
means that it is at the overhead point. The default inclination is 45°
Vertical Exaggeration is the size of the contrast between high and low values. If
you increase the Vertical Exaggeration, the 'hills' will appear higher and the
'valleys' deeper. The default vertical exaggeration is 100.
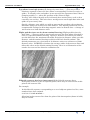
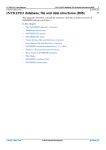
Here is an illustration of sun angle grid display
Modifying the parameters of the current display format
You can modify the parameters of the current grid display format by choosing its
menu option again (or specifying an equalisation histogram).
Library | Help | Top
© 2012 Intrepid Geophysics
| Back |
INTREPID User Manual
Library | Help | Top
Flight Path Editor (T19)
15
| Back |
>> To modify pseudocolour grey scale or sun angle display parameters.
1
Choose Grid with Pseudocolour or Grid with Sun Angle accordingly from the Grid
Display menu. INTREPID displays the corresponding dialog box.
2
Modify the parameters as required and choose OK. INTREPID displays the grid
using the modified parameters.
Equalising histogram
If you are using the grey scale or pseudocolour display, you can use an equalising
histogram to distribute the colours or shades so that each colour or shade has the
same area in the display (i.e., the same number of grid cells).
>> To turn on the equalising histogram display
1
Ensure that you are displaying the data using grey scale or pseudocolour.
2
Choose Histogram from the Grid Display menu. INTREPID displays the
Histogram Options for Grid Dataset dialog box.
3
Set the Bin Width parameter if required and choose OK. INTREPID will
redisplay the grid using the equalising histogram.
Bin width In a piecewise linear histogram the data is grouped in 'bins' according to
rank. Each 'bin' contains a fixed number of data items of approximately the same
value. The bin width parameter specifies the percentage of the data occupying
one 'bin'. The default value of .3 results in about 330 bins. If you increase the bin
width, resulting in fewer 'bins', the data will have larger clusters and fewer
different colours. If you decrease the bin width, resulting in more 'bins', the data
will have smaller clusters and a greater variety of colours.
>> To turn off the equalising histogram display
Library | Help | Top
1
Choose Histogram from the Grid Display menu. INTREPID displays the
Histogram Options for Grid Dataset dialog box.
2
Choose Cancel.
3
Click the pan/zoom indicator box or slightly adjust the window size to force a
screen redraw.
© 2012 Intrepid Geophysics
| Back |
INTREPID User Manual
Library | Help | Top
Flight Path Editor (T19)
16
| Back |
Point dataset display
You can display a point dataset as a set of square markers. INTREPID can vary the
size and colour of the markers according to the values in Z fields. Specifically, you
can
•
Select a Z field whose value will determine the size of the point markers in the
display, and turn this aspect of the display on and off as required.
•
Select a Z field whose value will determine the colour of the point markers in the
display, and turn this aspect of the display on and off as required.
In each case INTREPID assigns the sizes or colours according to a fixed range
system, where each size or colour has a value range the same size. INTREPID
assigns the colours from the pseudocolour.lut lookup table (See "Colour Lookup
Tables" in INTREPID database, file and data structures (R05) for more information)
INTREPID assigns sizes according to the range of Z values.
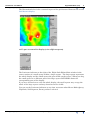
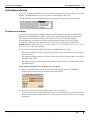
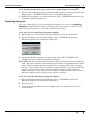
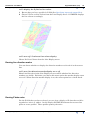
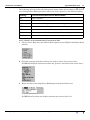
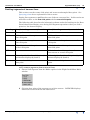
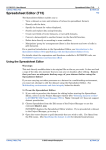
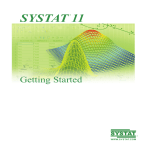
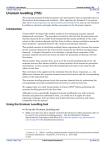
The following illustration of a point dataset overlaying a grid is an Euler
Deconvolution estimating depth of magnetic sources.
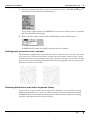
The following illustrations are enlargements of sections of the display above.
Library | Help | Top
© 2012 Intrepid Geophysics
| Back |
INTREPID User Manual
Library | Help | Top
Flight Path Editor (T19)
17
| Back |
When you first specify the point dataset for display using Load Point Dataset from
the File menu, as well as prompting you to specify the point dataset, INTREPID will
prompt you to specify a Z field to determine point colour and a Z field to determine
point size. See Specifying input and output files for details.
Changing the colour and size Z field selection
>> To specify or respecify the point colour or size Z fields
If you did not specify a Z field for colour or size and now wish to do so, or if you wish to
change your field selection, reload the point dataset using Load Point Dataset from
the File menu, and specify the colour and size Z fields as required.
>> To turn point colour or size display on or off
Choose the Z Value as Point Colour and/or Z Value as Point Size form the Point
Display menu to turn the display on or off. The options will have check marks
against them if they are turned on.
Line Dataset display
The line dataset display has a large range of display options to enable you to both
view and edit the dataset. You can
•
Determine whether (in Zoom mouse mode) your line dataset display redraws
quickly with lower precision or more slowly with full precision by specifying the
display subsampling rate. See Setting the display subsampling interval for
details
•
View the total traverse line length of the dataset. See Querying points for details.
•
Click any part of any traverse line using the mouse and view (for the nearest data
point) the X and Y coordinates, the traverse line number, the number and fiducial
number. See Querying points for details.
•
Specify a traverse line by number or click it in the display and view its path. See
Viewing a single traverse line in red for details.
•
For a selected Z field, view the traverse line paths with points failing your data
validation criteria coloured in red. You can also save a new field in the line
dataset containing the data validation results. See Line data validation for
details.
•
For a selected Z field, apply fixed range pseudocolour to the lines indicating values
of the Z data. See Showing Z values as line colour for details.
•
View markers indicating the directions of the traverse lines. See Viewing line
direction marks for details.
•
For a selected Z field, view noise in the field as a profile superimposed on the
traverse lines. See Viewing Z data noise for details.
If you require a Z field for use in the display, specify it using the Load Z Field for Line
Dataset option from the File menu (See Specifying input and output files for details).
You can control most of the line dataset display features using options from the Line
Display menu.
Library | Help | Top
© 2012 Intrepid Geophysics
| Back |
INTREPID User Manual
Library | Help | Top
Flight Path Editor (T19)
18
| Back |
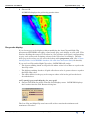
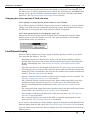
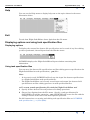
The following illustration shows a line dataset as the Flight Path Editor originally
displays it.
Setting the display subsampling interval
Available in Zoom mouse mode only. Each time you perform an operation or change
an option, INTREPID will redraw the screen. For a large line dataset, this may take
too long. While you are using Zoom mouse mode you can speed up the display (at the
cost of display precision) by reducing the subsampling interval. For example, if you
set the subsampling interval to 2, INTREPID will only display every second data
point on the screen. The default subsampling interval for Zoom mouse mode is 10.
If you select a mouse mode other than Zoom, the subsampling interval changes to 1.
If you return to Zoom mode, the subsampling interval returns to the set value. See
Mouse mode summary for general information about mouse modes.
Library | Help | Top
© 2012 Intrepid Geophysics
| Back |
INTREPID User Manual
Library | Help | Top
Flight Path Editor (T19)
19
| Back |
>> To specify the subsampling interval
1
Ensure that you are using Zoom mouse mode.
2
Choose Set Subsampling Rate from the Line Display menu. INTREPID displays
the Subsampling for Line Display dialog box.
Specify the subsampling interval in the Rate text box and choose OK. INTREPID
will redraw the display with the new subsampling interval whenever you are using
Zoom mouse mode.
Note: Increasing the value of the Rate parameter means increasing the interval—
INTREPID displays fewer data points.
Viewing a single traverse line in red
INTREPID can display the path of an individual traverse line in red. You can specify
the traverse line by its number or by clicking it in the display.
You can delete the selected line (See Deleting traverse lines).
>> To display an individual traverse line in red using its number
Choose Single Line In Red from the Line Display menu. INTREPID displays the
Select Line dialog box.
Choose the line number from the list box and choose OK.
INTREPID displays the traverse line path in red.
Library | Help | Top
© 2012 Intrepid Geophysics
| Back |
INTREPID User Manual
Library | Help | Top
Flight Path Editor (T19)
20
| Back |
>> To display an individual traverse line in red by clicking the line on the
screen
1
Select Select Line mouse mode
2
Click the line you require. INTREPID displays it in red.
>> To display a different traverse line
Repeat the process just described. INTREPID will return the previous line to white
and display the new line in red.
>> To cancel single line in red display
Choose No Line Colours from the Line Display menu.
Line data validation
Some of the data from your survey may be unsuitable for your purposes because of
faults or because it does not comply with standards that you have set. You can refer
to this data as invalid. INTREPID has a variety of data validation tests available for
your data. After applying the criteria you select, INTREPID displays the invalid
traverse lines or parts of traverse lines in red.
You can choose from the following criteria. For each criterion, a point will fail (and be
coloured red) if the criterion statement is true.
•
•
The Z value at the point is
•
Not within a given range;
•
Null;
The point is within part of the traverse line where
•
The gradient of the Z data is too high (i.e., there is Z data noise);
•
The flight path deviates too far from a given nominal bearing;
•
The fiducial sequence has been interrupted.
You can save line data validation results in a new field in the dataset. INTREPID
saves the validation data as 0 for valid (red) and 1 for invalid (red).
>> To apply data validation tests to your data and view the failed data in red,
1
Library | Help | Top
If you are using tests which involve a Z field, ensure that you have specified this
field. (See Specifying input and output files for details).
© 2012 Intrepid Geophysics
| Back |
INTREPID User Manual
Library | Help | Top
Flight Path Editor (T19)
21
| Back |
2
Choose Line Data Validation In Red from the Line Display menu. INTREPID
displays the Data Validation Parameters dialog box
3
Turn on the data validation tests and specify the corresponding parameters as
required, then choose OK. INTREPID displays the dataset with the traverse line
paths or sections of paths that fail the data validation test shown in red (i.e., the
data for which the statements in the dialog box are true).
4
Adjust the tests as required by repeating steps 2 and 3 above.
>> To cancel Line Data Validation in red display
Choose No Line Colours from the Line Display menu
Data validation tests and parameters
Here is a detailed description of the data validation tests and parameters.
Z data ranges ('Z value is not between ...') INTREPID will reject (mark in red) points
whose Z values are outside the range you specify. Specify lower and upper values
of the range of Z values in the corresponding text boxes. The default values are
the maximum and minimum values of the Z data. Here is an illustration of the
results of a Z data range validation test.
Z value is null If you turn on this check box, INTREPID displays all points in red for
which the corresponding Z data value is null.
Library | Help | Top
© 2012 Intrepid Geophysics
| Back |
INTREPID User Manual
Library | Help | Top
Flight Path Editor (T19)
22
| Back |
Z gradient is too high (noise) ('Z changes by more than ...') You may wish to
eliminate segments of traverse lines whose corresponding Z values are noise or
spikes. To identify noise and spikes, locate traverse line segments where Z data is
changing rapidly, i.e., where the gradient of the Z data is high.
You may also wish to identify noise in diurnal (base station) data, such as that
caused by sun activity. This noise has a much greater wavelength than noise and
spikes in your survey data.
Specify a distance over which you wish to measure the gradient, the maximum
allowable change (in Z units) over this distance. The default parameters are the
recommended settings for detecting magnetic noise in diurnal data—a change of
100 Z units over 5000 distance units.
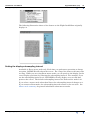
Flight path deviates too far from nominal bearing ('Flight path deviates by
more than ...') You may wish to retain only traverse line data whose direction is
close to a specified nominal bearing. Specify a distance over which you wish to
test the direction, the maximum allowable deviation (in distance units) over this
distance, and the nominal bearing to which valid lines should conform. The
default parameters are a deviation of 50 distance units over a distance of 5000
distance units. INTREPID calculates the average strike of the traverse lines and
offers this value as the default nominal bearing. Here is an illustration of the
results of a traverse line direction validation test.
Fiducial sequence has been interrupted If the fiducial sequence has a
discrepancy between a pair of adjacent points, there may be a data fault at this
point in the traverse line.
For example,
•
In this fiducial sequence corresponding to a set of adjacent points in a line, some
numbers have been omitted.
34 35 36 37 38 45 46 47 48 ...
All points in the traverse line from the point of the interruption (shown in bold)
may be invalid.
Library | Help | Top
© 2012 Intrepid Geophysics
| Back |
INTREPID User Manual
Library | Help | Top
•
Flight Path Editor (T19)
23
| Back |
In this fiducial sequence, there is a small range where the fiducial sequence is
incorrect, but the sequence continues correctly after the interruption.
21 22 23 24 25 26 543 544 29 30 31
In this case, only the points with the incorrect fiducial sequence numbers may be
invalid.
If you turn on Fiducial sequence has been interrupted, INTREPID will show all
points that are invalid as illustrated in the above examples.
Saving line data validation results
You can record the data validation results in a new dataset field. This field contains
the value 1 for invalid data points (red), and 0 for valid (white) data points. You can
perform this process as often as you wish with different validation tests, each time
specifying a different field name.
>> To save the line data validation results
1
Specify and display the results of a line data validation test as described above.
2
Choose Save Validation Field from the File menu. INTREPID displays a Save As
dialog box. Specify the name for the new field and choose OK. (See Specifying
input and output files for detailed instructions.)
Showing Z values as line colour
If you have specified a Z field you can display its values using fixed range
pseudocolour. INTREPID will colour the traverse line paths in the display according
to the value of the Z field. INTREPID assigns the colours from the
pseudocolour.lut lookup table (See "Colour Lookup Tables" in INTREPID
database, file and data structures (R05) for more information)
Library | Help | Top
© 2012 Intrepid Geophysics
| Back |
INTREPID User Manual
Library | Help | Top
Flight Path Editor (T19)
24
| Back |
>> To display the Z field as line colour
1
Ensure that you have specified a Z field (See Specifying input and output files).
2
Choose Z Value as Line Colour from the Line Display menu. INTREPID displays
the line colours accordingly.
>> To turn off Z value as line colour display
Choose No Line Colours from the Line Display menu.
Viewing line direction marks
You can choose whether to display the direction marks at each end of each traverse
line.
>> To turn line direction marks display on or off
Show Line Direction in the Line Display menu controls whether line direction
markers are visible. Each time you choose this menu option the marker display turns
on or off. When direction marker display is on, the menu option has a check mark.
Viewing Z data noise
For the Z field that you have selected, you can view a display of Z data that could be
regarded as 'noise' or 'spikes'. In this display INTREPID distorts the traverse line
paths to create profiles. These profiles portray the noise.
Library | Help | Top
© 2012 Intrepid Geophysics
| Back |
INTREPID User Manual
Library | Help | Top
Flight Path Editor (T19)
25
| Back |
>> To display Z noise profiles
1
Choose Show Noise Profile of Z from the Line Display menu. INTREPID displays
the Noise Profile Settings for Z Field dialog box.
2
Specify the parameters according to your requirements and choose OK.
INTREPID displays the Z Noise profiles.
3
Adjust the parameters as required by turning off noise profile display, then
repeating steps 1 and 2 above.
Tolerance The tolerance is the minimum wave amplitude below which you will not
consider an anomaly to be noise or a spike. Specify the tolerance in Z units.
Wavelength The wavelength is the maximum wavelength (number of data points)
above which you will not consider an anomaly to be noise or a spike.
Vscale The vertical scale is the relative height of the noise profile display in Z units
per display centimetre. INTREPID subtracts the Z data base value before
calculating the profile height.
Base Value In the context of noise profile display in the Flight Path Editor, we
recommend that you use a base value of 0.
>> To turn off display of the Z noise profile
Choose Show Noise Profile of Z from the Line Display menu. INTREPID will redraw
the display without the Z noise profile.
>> To modify the Z noise profile parameters
Turn Z noise profile display off, then on again. When you turn it on INTREPID
displays the Z Noise Profiles dialog box again (see above for instructions).
Choose ??
Library | Help | Top
© 2012 Intrepid Geophysics
| Back |
INTREPID User Manual
Library | Help | Top
Flight Path Editor (T19)
26
| Back |
Editing line dataset flight paths
If you wish to 'delete' some data points in your line dataset so that they are not used
in further processing of the survey, you can set the X and Y fields for those points to
null. This disables the points without disturbing the integrity of the data.
INTREPID cannot use the 'deleted' points for operations such as gridding, but it
retains the other data for the points such as line numbers, fiducial numbers, Z data,
etc.. For example, if you viewed the Z data using the Histogram tool (See Histograms
(T08)), the tool would include the Z values from 'deleted' data points.
You can 'delete' a whole traverse line, all data points from a chosen point to the
nearest end of the traverse line, or all of the data points in a line segment that you
specify.1
Deleting traverse lines
>> To delete a traverse line
1
Select the line (See Viewing a single traverse line in red for instructions).
2
Choose Delete Line form the Edit menu.
Deleting the ends of traverse lines
This section uses the terms 'click point' and 'nearest subsampled data point'. See
Querying points for an explanation.
You can select the ends of a number of lines for deletion, then delete all of the selected
ends with a single Edit menu operation.
To select the second and subsequent line ends for deleting all at once, hold down CTRL
when you click them. When you have selected all line ends, choose Delete end/
segment from the Edit menu.
1. Note that in this operation, you are setting the values in the X and Y fields to null. In
the 'Z data is null' data validation test, INTREPID identifies the points whose Z field
value is null. If you set parts of lines to null using the process described in the current
section, the lines will disappear from the display. The only connection between this
process and the data validation test is that you may have used some data validation
testing to identify lines for removal.
Library | Help | Top
© 2012 Intrepid Geophysics
| Back |
INTREPID User Manual
Library | Help | Top
Flight Path Editor (T19)
27
| Back |
The following table describes the information shown under the headings in the Status
area during Delete Ends operations when you click a point in a line dataset display.
Heading
Line Information(Select Ends Mouse Mode)
km
survey distance
X, Y
X, Y coordinates of data point nearest to click point
Line
Line number of data point nearest to click point
FID1
Fiducial number of data point nearest to click point
FID2
n/a
Value
Value of grid cell at click point (if grid dataset displayed) (band 0)
Dist (m)
Distance from click point to nearest data point
>> To 'delete' an unwanted end of a traverse line
1
Choose Select Ends from the Mouse Mode options in the Flight Path Editor Main
window.
2
Click the starting point from which you wish to 'delete' the traverse line.
INTREPID displays information about the point as described in the table above.
3
Delete the line end using Delete End/Segment from the Edit menu.
INTREPID will redraw the display without the traverse line end.
Library | Help | Top
© 2012 Intrepid Geophysics
| Back |
INTREPID User Manual
Library | Help | Top
Flight Path Editor (T19)
28
| Back |
Deleting segments of traverse lines
This section uses the terms 'click point' and 'nearest subsampled data point'. See
Querying points for an explanation of these terms.
Setting line segments to null involves two clicks on a traverse line. In this section we
will refer to these as the first click point and the second click point.
The following table describes the information shown under the headings in the Data
Point Information Display area during Null Segment operations when you click a
point in a line dataset display.
Heading
Line (Select Segment mode) first click
Line (Select Segment mode) second click
km
Survey distance
X, Y
X, Y coordinates of data point nearest to
first click point
X, Y coordinates of data point nearest to
first click point
Line
Line number of data point nearest to
first click point
Line number of data point nearest to first
click point
FID1
Fiducial number of data point nearest
to first click point
Fiducial number of data point nearest to
first click point
FID2
n/a
Fiducial number of data point on the same
line nearest to second click point
Value
Value of grid cell at first click point (if
grid dataset displayed) (band 0)
Value of grid cell at first click point (if grid
dataset displayed) (band 0)
Dist (m)
Distance from click point to nearest
data point
Distance from click point to nearest data
point
>> To remove segments from traverse lines,
Library | Help | Top
1
Choose Null Segment from the Modes options in the Flight Path Editor Main
window.
2
Click the first point of the segment you wish to remove. INTREPID displays
information as described in the table above.
© 2012 Intrepid Geophysics
| Back |
INTREPID User Manual
Library | Help | Top
3
Flight Path Editor (T19)
29
| Back |
Click the second point of the segment you wish to remove. INTREPID displays
information as described in the table above.
If you choose further points, INTREPID will use them to replace point 1 and point
2 (FID1 and FID2) alternately.
4
Delete the line segment using Delete End/Segment from the Edit menu.
INTREPID will redraw the display without the line segment.
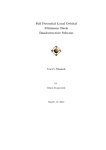
Deleting parts of traverse lines—example
The following example shows traverse lines whose ends cross over, traverse lines that
pass too close to other traverse lines, and traverse lines whose ends overlap. In the
second illustration, these problems have been corrected, leaving a set of traverse lines
that is evenly spaced without redundant data from overlapping ends or traverse lines
that are too close to each other.
Restoring deleted line ends and/or segments (Undo)
If you remove a traverse line end or segment by mistake, you can restore it using
Undo from the Edit menu. You can restore all of the ends and segments 'deleted'.
INTREPID will restore them in reverse order with each Undo operation, starting
with the end/segment most recently 'deleted'.
Library | Help | Top
© 2012 Intrepid Geophysics
| Back |
INTREPID User Manual
Library | Help | Top
Flight Path Editor (T19)
30
| Back |
Help
You can use the Help menu to display help text on the topics shown in the menu
illustration below.
Exit
To exit from Flight Path Editor choose Quit from the file menu.
Displaying options and using task specification files
Displaying options
To display the current line dataset file specifications and a record of any line editing
you have performed, choose Report from the Window menu.
INTREPID displays the Flight Path Editor Report window containing this
information.
Using task specification files
You can store line dataset file specifications and line editing process specifications for
Flight Path Editor in task specification (.job) files.
Note:
•
In interactive mode INTREPID will only use the input line dataset specifications
in a Flight Path Editor task specification file.
•
The Flight Path Editor tool can only record input and output line dataset field
specifications and line editing processes in task specification files.
>> To create a task specification file with the Flight Path Editor tool
1
Specify all line dataset files and perform all editing operations.
2
Choose Save Options from the File menu. Specify a task specification file
(INTREPID will add the extension .job) INTREPID will create the file with the
settings current at the time of the Save Options operation.
For full instructions on creating and editing task specification files see INTREPID
task specification (.job) files (R06).
Library | Help | Top
© 2012 Intrepid Geophysics
| Back |
INTREPID User Manual
Library | Help | Top
Flight Path Editor (T19)
31
| Back |
>> To use a task specification file in an interactive Flight Path Editor session
Load the task specification (.job) file (File menu, Load Options) (Only line dataset
input file specifications will be used).
>> To use a task specification file for a batch mode Flight Path Editor task
Only line dataset loading, editing operations and saving are available.
Type the command fedit.exe with the switch –batch followed by the name of the
task specification file.
For example, if you had a task specification file called surv329.job in the current
directory you would use the command
fedit.exe –batch surv329.job
Task specification file example
Process Begin
Name = flightEdit
Xin = ebagoola_s/x
Yin = ebagoola_s/y
Xout = ebagoola_S/x_trim1
Yout = ebagoola_S/y_trim1
Parameters Begin
EditDelta Begin
EditType = CutEnd
Line = 30
Point = 62
EditDelta End
EditDelta Begin
EditType = NullSegment
Line = 6
Point1 = 277
Point2 = 176
EditDelta End
Parameters End
Process End
Library | Help | Top
© 2012 Intrepid Geophysics
| Back |