1
EP.C.8
BT.C.9
Normalized Delay
Normalized Energy
Normalized Delay
Normalized Energy
1.60
1.40
1.20
1.00
0.80
0.60
0.40
0.20
0.00
2.50
2.00
1.50
1.00
0.50
0.00
auto
600
auto
800 1000 1200 1400
MG.C.8
600
800 1000 1200 1400
LU.C.8
Normalized Delay
Normalized Energy
Normalized Delay
Normalized Energy
1.80
1.60
1.40
1.20
1.00
0.80
0.60
0.40
0.20
0.00
1.60
1.40
1.20
1.00
0.80
0.60
0.40
0.20
0.00
auto
600
auto
800 1000 1200 1400
FT.C.8
600
800
CG.C.8
Normalized Delay
Normalized Energy
1.20
1.20
1.00
1.00
0.80
0.80
0.60
0.60
0.40
0.40
0.20
0.20
1000 1200 1400
Normalized Delay
Normalized Energy
0.00
0.00
auto
600
800
SP.C.9
auto
1000 1200 1400
600
IS.C.8
Normalized Delay
Normalized Energy
1.40
1.20
1.00
0.80
0.60
0.40
0.20
0.00
800 1000 1200 1400
Normalized Delay
Normalized Energy
1.20
1.00
0.80
0.60
0.40
0.20
0.00
auto
600
800
1000 1200 1400
auto
600
800 1000 1200 1400
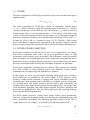
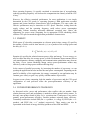
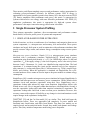
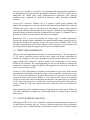
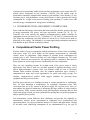
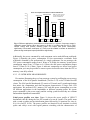
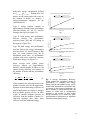
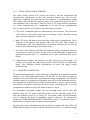
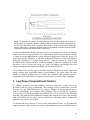
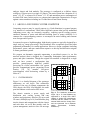
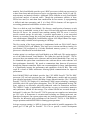
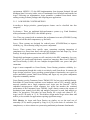
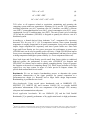
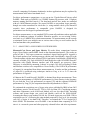
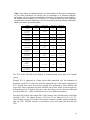
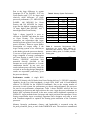
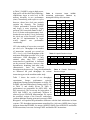
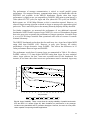
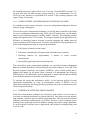
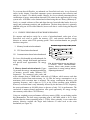
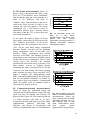
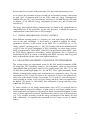
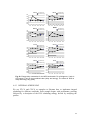
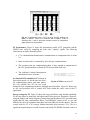
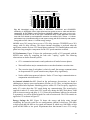
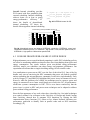
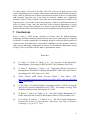
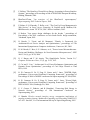
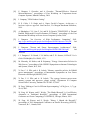
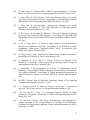
Fig. 20. Energy-delay crescendos for the NPB benchmarks. For all diagrams, X-axis is
CPU speed, Y-axis is the normalized value (delay and energy). The effects of DVS on
delay and energy vary greatly.
6.4.3 INTERNAL SCHEDULING
We use FT.C.8 and CG.C.8 as examples to illustrate how to implement internal
scheduling for different workloads. Each example begins with performance profiling
followed by a description of the DVS scheduling strategy derived by analyzing the
profiles.
46