1
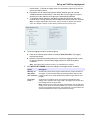
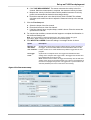
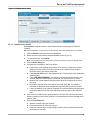
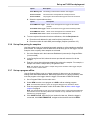
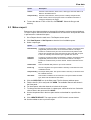
View data
Option
Description
Alarms
Shows the date and time, alarm source, alarm type, state and data for all
alarms in the tabular format.
Sample History
Shows the date and time, status (success or failed), sample number,
bottle number, volume and program name in a tabular format when a
sampler is attached to the logger.
6. To save the data as a TSV or CSV file, click EXPORT. Select the file type and
directory.
5.3 Make a report
Reports can show instrument data or site-specific information such as events and alarms.
To make a report, data must first be downloaded from an instrument. All reports are made
in pdf format for a selected time span.
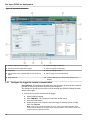
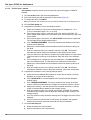
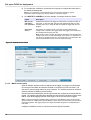
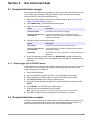
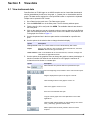
1. Go to Reports from the main menu. The Reports screen opens.
2. Click Data Reports or Site Reports to show the list of available reports.
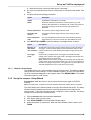
3. Select a report type:
Option
Description
Data Summary
A summary of instrument data. The maximum, minimum, average and total
(if applicable) values are shown for each selected channel. The report
includes an overall summary and a list of interval summary data for each
channel. The intervals are hourly when the time span is less than or equal
to 48 hours and daily when the time span is greater than 48 hours.
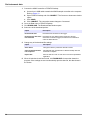
Summary
Statistics
A summary of instrument data. The maximum, minimum, average and total
(if applicable) values are shown for each selected channel. The report
includes an overall summary for each channel. Interval summaries are not
listed.
Tabular Data
A list of Individual data points for up to seven channels.
Event Log
The event log data. The report includes a summary of all events and a list
of individual events.
Sample History The sample history data. The report includes a summary of all events and a
list of individual events.
Site Alarm
A list of alarm conditions for an instrument. The report includes the alarm
type, alarm state and data for each alarm.
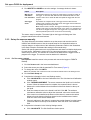
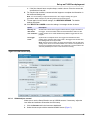
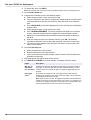
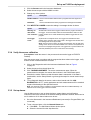
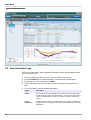
4. Click the OPEN FILE icon in the Sites panel. The file directory window opens.
5. Find the site file (.fl9 or .as9) and click OPEN. The available channels are shown in
the Sites panel.
6. For data reports, select the channels to include in the report.
7. To change the units that are shown in a data report, select the units icon. Select the
units to show in the report and click SAVE.
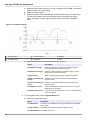
8. Use the drop-down lists in the time span section to show data for a specific time
span.
9. Click CREATE REPORT. The report opens in a PDF format in a new window.
10. Use the toolbar to save or print the report.
29