1
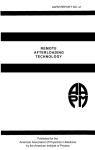
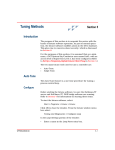
MAESTRO
Multi-Channel Analyzer Software
Modification of the MAESTRO User Manual
Designed for PHYS405 Undergraduates
by Roberto Livi
(Edited by E. Beise, Jan 2007)
Table of Contents
1. Introduction…………………………………………………..............................
2. Software………………………………………………………………………...
2.1 Region of Interest (ROI)………………………………………………...
2.1.1 Select a Region………………………………………………..
2.1.2 Calibration…………………………………………………….
2.1.3 Counts…………………………………………………………
2.1.4 Finding Peaks, Net Area, and Gross Area…………………….
2.2 Live / Real Time………………………………………………………...
2.3 Interface……..…………………………………………………………..
3. Tips and Hints……………………………………………………………..........
3.1 Gamma-Ray Spectroscopy………………………………………………
3.2 Gamma-Gamma Angular Correlation…………………………………..
4. Frequently Asked Questions……………………………………………………
1
2
2
2-3
2
2
3
4-5
5-6
7-8
7
8
9
1. Introduction
MAESTRO is a Windows based software program that analyzes detector signals
from emitted photons from various radioactive sources. The program controls the input to
the Multi Channel Analyzer (MCA), a PCI-Card that is mounted onto the motherboard of
the computer. Using the software with the MCA, a user can collect multiple counts from
a detector, corresponding to emitted gamma-rays (photons), and store them into exactly
two-thousand-forty-eight channels or bins according to the signal pulse height. In the
apparatus in our labs, the signal pulse height is proportional to the gamma-ray energy.
Once the data are accumulated, MAESTRO offers a variety of analytical tools to interpret
the information. This manual will focus on functions that will be useful for experiments
involving gamma-ray spectroscopy; these functions include Region of Interest (ROI),
Gaussian fits, peak finders, sum of counts and Calibration.
The MAESTRO software will be used for the following two experiments:
Gamma-Ray Spectroscopy (#7) and Gamma-Gamma Angular Correlation (#9). The
following will be a brief description of both experiments and their main purpose.
The main objective of Experiment 7 is to identify the emitted gamma rays from a
variety of radioactive sources and, given the known spectra, calibrate the energy response
of the detector. One of the sources used is, for example Cesium137 (Cs137), for which
the primary gamma emitted has an energy of 662 kilo electron-Volts (keV) when not
interacting with their surrounding elements. In the experiment, the source is placed in
front of a Sodium Iodide detector at a given distance and the detector output is fed
through a spectroscopy amplifier to create a voltage that is proportional to the gamma-ray
energy. The MAESTRO software is then enabled to collect the voltage data into specific
bins. The user should then notice a peak appear, and the channel in which it appears
corresponds to the 662 keV gamma-ray. The energy scale has to then be calibrated using
other known sources.
The Gamma-Gamma Angular Correlation measurement is an experiment used to
analyze the rapid (coincident) emission of two gamma-rays from a Cobalt-60 (60Co)
nucleus. In order to find their correlation in terms of a separating angle, two NaI detectors
are used in coincidence, meaning that every time a photon with is detected by both
instruments at the same time, a signal is sent to the computer. The signal sent to the
computer is the sum of the two detector signals, corresponding to the summed energy of
the two gamma-rays.
Below is a description of some of the basic functions of the MAESTRO software
which would typically be useful in the above experiments. Most MCAs have this type of
functionality.
2. Software
2.1 Region of Interest
This function is used to highlight specific sections of the accumulated data. Once the
region is selected, a user has the option to perform a calibration or find the peak, the
number of counts inside that region, the net area and the gross area. Below are
instructions on how to perform these functions.
2.1.1 Select a Region of Interest
1. Press and hold the left mouse button on one end of the desired region.
2. Move the cursor over to the other side until your area is inside the rectangle.
3. Release the left mouse button and press the right mouse button inside the
rectangle.
4. Select Mark ROI.
Hint: Once you have selected a rectangle, do not click on the toolbar and select ROI,
Mark ROI. This option will only highlight one single channel instead of the channels
inside the rectangle.
2.1.2 Calibration
1.
2.
3.
4.
Select ROI.
Place the marker (vertical line) on the ROI.
On the toolbar select Calculate, Calibrate.
In the field next to Calibration (Energy), enter the desired energy corresponding
to the peak of the ROI.
2.1.3 Counts
1. Select ROI.
2. Right-click on the ROI and select Sum.
3. On the bottom of the window you should see a message appear as in Figure 1
below.
Figure 1: Message after summing channels in ROI
There is also a second method of summing counts:
1. Using the left mouse button, select a rectangle.
2. Right-click on the inside of the rectangle and select Sum.
2.1.4 Finding Peaks, Net Area, and Gross Area
1. Select ROI.
2. Double-click with the left mouse button on the ROI.
A new window will appear as you can see in Figure 2.
Figure 2: Information regarding the selected ROI.
To find the Peak, MAESTRO has an imbedded Gaussian fit function that produces a
centroid and a Full Width at Half Max (FWHM), which can be manually converted into a
standard deviation using the following equation:
σ = FWHM / 2.354
The Gross Area and the Net Area are derived by MAESTRO in the following manner:
B = Background
An = Net Area
Aag = Adjusted Gross Area
Ci = Counts
L = High Limit ROI
H = Low Limit ROI
The Gross Area Counts in our case is simply the counts inside the ROI. MAESTRO on
the other hand uses a correctional equation that adjusts the counts inside the ROI due to
the uneven background. For our purposes, we do not need to know the details of this
procedure. The Net Area is then simply the adjusted Gross Area Counts minus the
derived Background.
2.2 Real/Live Time
Real Time and Live Time are presets that control the length of time of your data
acquisition. Real Time is a set interval based upon an active clock, meaning that it will
count time without any breaks. Live Time on the other hand takes the effect of dead time
into account. Whenever a pulse is detected, the detector needs a certain amount of time to
process this information. During this time gap, the detector will not be able to reveal any
other pulses or signals. Thus, to obtain a higher signal rate from your detector, the
MAESTRO software allows the user to avoid the dead time and maximize data collection
for the selected time period. Here is a guide on how to set-up your desired real/live time.
2.2.1 Real Time
1.
2.
3.
4.
5.
6.
From the top toolbar menu select Acquire, MCB Properties.
On the tab menu in the new window, click on Presets.
In the white box next to Real Time, enter the desired time length.
Enter the number zero in the box next to Live Time to exclude it.
Click Close.
Check under Preset Limits on the right side of the screen whether the
information you have entered is correct.
Hint: If the information under Preset Limits is not correct, try re-entering your desired
time, but this time, instead of entering a zero for the excluded field, simply leave it blank.
The software is sometimes slow in updating this information, so give it three to four
seconds of time.
2.2.2 Live Time
1.
2.
3.
4.
5.
Repeat steps 1. and 2. from the Real Time Procedure.
In the white box next to Live Time, enter the desired time length.
Enter the number zero in the box next to Real Time to exclude it.
Click Close.
Check under Preset Limits on the right side of the screen whether the
information you have entered is correct.
A third way to set an automatic limit on how much data you want to acquire is the ROI
Peak preset. Select an ROI and then enter the number of counts desired in the white box
next to ROI Peak. This function can be used, but it is suggested to only pick a Live Time
value.
Figure 3 shows the Preset window in which you will be entering your data.
Figure 3: Preset window for entering Real/Live Time
2.3 Interface
Below is a brief description of the MAESTRO interface following a guide to shortcuts
and the Display menu
2.3.1 Brief Description
There are a total of five interfaces in the MAESTRO program. The top interface is the
toolbar-menu. It has standard options including saving files, opening files, printing, and
exit. The Acquire drop menu has a link to the MCB properties that gives the user control
over presets such as time and peak counts (detailed information can be found in section
2.2 Real/Live Time). The Calculate menu contains links to programs that modify the
data or analyze parts of the selected ROI. The next menu is called ROI. The list of
options includes the Sum (sums counts in ROI) and Mark ROI (marks the selected
region as ROI). The Services and Window menus are not used for our purposes.
The next interface, the shortcut-menu, is right below the toolbar-menu. It includes the
same options as the interface above, but instead of drop down menus, it has a few
shortcut icons that represent the most frequently used options. The main interface is in
the center of the MAESTRO program. In this window the user will observe the data input
from the MCA. The interface on the far right side informs the user of the date and the
Real/Live Time (how long the program has been collecting). The last interface is located
of the bottom of the screen and shows the position of the marker in terms of channels.
Also, if an area is selected, the bottom window will also display the gross area, net area,
and the sum of counts for that region.
2.3.2 Display Menu
Here is a list of useful displays that might aid the user for visual conceptions.
Viewing the data...
… as points
- Select Display, Preferences, Points
… with the ROI filled - Select Display, Preferences, Fill ROI
… with everything filled - Select Display, Preferences, Fill All
2.3.3 Shortcuts
Recall - this button opens an existing spectrum file.
Save – this shortcut saves the spectrum that is selected in the main interface.
Scale – clicking on either Log or A will change the y-axis scale of your main
interface. Log is a logarithmic scale and A is the normal scale.
Zoom In/Out – this option allows the user to zoom in and out of the main
window. This will only work when the normal scale A is selected. If viewing your graph
in Log, clicking Zoom In/Out will simply change the scale automatically.
Mark ROI – using this shortcut allows the user to highlight a ROI.
Clear ROI – clears the ROI which is currently selected by the marker.
Figure 4: MAESTRO Interface
3. Tips and Hints
How do I print a copy of my spectrum?
Using the “print” feature directly from MAESTRO will result in getting a long list of
numbers or using up the toner cartridge of the printer.
Instead, use “SAVE AS”, then save as an ASCII SPE file. If you then double-click on
the file, it will open a different application which plots the spectrum in a form that can be
printed. You can change things like log vs lin for the y-axis once you are in this new
application.
4. Frequently Asked Questions
Why do I not see a graph developing while I am taking data?
First, you should check your scale in the toolbar. Try switching from LOG to A and vice
versa. If you were first in LOG and have now switched over to A, try zooming in on the
bottom of the graph using the Zoom In and Zoom Out buttons that are also found on the
toolbar.
Second, check that you have the right window on your screen. There are two different
windows: the Buffer and the MCA instrument. They are both located in a drop-down
menu on the right side of the toolbar, on the same line with LOG and A.
Why is the GO button grey before I try to collect data?
You probably have your screen set to buffer instead of the MCA instrument. To switch to
the MCA, simply click on the drop-down menu at the right side of the toolbar and select
MCA.
Why can I only select a one channel width ROI?
If you use the Mark ROI function from the toolbar, the program will only highlight the
region where your marker (vertical line) is. To avoid this, you can simply select your
area, right-click inside the rectangle and choose the Mark ROI option from the menu.