1
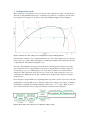
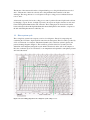
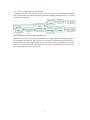
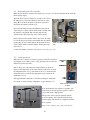
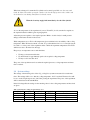
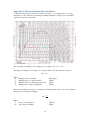
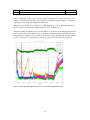
This manual is for internal use of Nikhef
03 May 2010
03 May 2010
Version: 1.0
Manual
Carbon dioxide cooling blow system
Nikhef
Mechanische technologie
Sciencepark 105
1098 XG Amsterdam
www.nikhef.nl
Introduction
The CO2 cooling blow system may only be used and controlled by technicians employed at Nikhef.
This document first gives a short introduction of a cooling cycle, followed by the cooling cycle of the
CO2 cooling blow system. Next the manual describes the usage, control and handling of the blow
system.
Safety
Caution
Carefully read the manual of the CO2 cooling blow system before use!
Don’t use the CO2 cooling blow system in a poorly ventilated room and
without CO2 alarm system to avoid the danger of suffocation!
When the electricity supply fails, immediately close the CO2 cylinder!
The weight of the CO2 cylinder is above 25 kg, move the cylinder with at
least two persons!
During transport of the CO2 cooling system, always remove the CO2
cylinder from the system!
Transport of the CO2 cylinder has to be done with a cylinder trolley.
In use, always fasten the cylinder in the CO2 cooling blow system with the
cylinder holder strap.
2
Contents
Introduction ............................................................................................................................................. 2
Safety ...................................................................................................................................................... 2
Contents .................................................................................................................................................. 3
1
2
Refrigeration cycle .......................................................................................................................... 4
1.1
Blow system cycle .................................................................................................................. 5
1.2
CO2 cooling blow system design ............................................................................................ 6
CO2 cooling blow system usage ...................................................................................................... 7
2.1
Sensors of the CO2 cooling blow system ................................................................................ 8
2.2
Connecting the blow system ................................................................................................... 8
2.3
Disconnecting the blow system............................................................................................... 9
2.4
Refreshing the CO2 cylinder ................................................................................................. 10
2.5
Getting started ....................................................................................................................... 10
2.6
System settings...................................................................................................................... 11
2.7
Turning the CO2 cooling blow system off ............................................................................ 12
2.8
CO2 cooling blow system transport....................................................................................... 12
3
Product assembly .......................................................................................................................... 13
4
Failure and repair .......................................................................................................................... 14
5
Maintenance .................................................................................................................................. 14
Appendix A: Theoretical mass flow calculation ................................................................................... 15
Appendix B: Results of reducing mass flow tests................................................................................. 17
3
1 Refrigeration cycle
The cooling cycle of a refrigerator is a process based on dry compression cooling; a cooling process
where the cooling medium is heated up to overheated vapour before it is compressed. A view of the
dry compression cooling process by means of a pressure-enthalpy diagram is given in Figure 1.
Figure 1: Schematic view of the cooling cycle of a refrigerator in a pressure-enthalpy diagram
Liquid from the condenser (4-1) is expanded between node 1 and 2. The expansion causes a pressure
drop from p2 to p1, a phase change from liquid to a liquid-vapour mixture and a temperature decrease
to temperature T1, the saturation temperature of p1.
Next the cooling medium is evaporated and overheated at constant pressure between node 2 and 3.
After evaporation of the cooling medium to vapour, the cooling medium is isentropic compressed
from pressure p1 to p2 (3- 4). During this process, work (h4-h3) is added to the system in form of
compression. The compressed vapour at node 4 is cooled to node 5 and condensed to node 1 at a
constant pressure. During this process the overheated vapour changes back to liquid to restart the
described cycle.
Pre-cooling the cooling medium before expanding makes it possible to reach a vapour ratio of 0, after
expanding the cooling medium (node 2’). The dry compression cooling process with pre-cooling the
medium before expanding it is indicated in Figure 1 with nodes 1’, 2’, 3’, 3 and 4. Figure 2 gives a
view of the block schema of the cooling cycle with the components of the refrigerator.
Figure 2: Block schema of the cooling cycle of a refrigerator with pre-cooling
4
The amount of heat extracted from the cooling medium by pre-cooling is indicated between node 1
and 1’. This amount of heat is absorbed by the cooling medium in the return line of the heat
exchanger. The energy increase as a consequence of the pre-cooling process is indicated between
node 3’ and 3.
A decreased vapour ratio before the cooling process starts is preferred because liquid can absorb heat
by changing to vapour. In case of a high vapour ratio, the vapour can begin to function as an isolator
between the liquid medium and the wall of the tube. The isolating layer can decrease heat transfer
between the tube wall and the liquid medium; this means that liquid becomes unable to evaporate at
the tube wall. This phenomenon is called dry out.
1.1 Blow system cycle
The cooling blow system is the evaporator section of a refrigerator. Instead of compressing and
condensing the CO2 back to liquid it will be vented into the atmosphere. The CO2 will be provided by
a CO2 vessel instead of a condenser. The thermodynamic cycle of the blow system is given in the
pressure-enthalpy diagram of Figure 3. The continuous green line is the blow system cycle. The
dashed line is the imaginary refrigeration cycle which is abandoned. At the state of the compressor
inlet, the overheated vapour is now heated to room temperature and expanded to atmospheric pressure
and vented afterwards.
Figure 3: Pressure-enthalpy diagram for the cooling blow system cooling at -30 °C
5
1.2 CO2 cooling blow system design
A schematic overview of the design of the CO2 cooling blow system is given in Figure 4. The liquid
CO2 is led from the CO2 bottle through a filter. In the heat exchanger the liquid CO2 is pre-cooled by
the fluid in the return line.
Figure 4: Schematic overview of the CO2 cooling blow system
The needle valve causes a pressure drop and thereby the cooling temperature. During the passage of
the experiment, the liquid CO2 will evaporate as a consequence of the added heat produced by the
experiment. The post heat exchanger heats the CO2 up to 20 °C and the cooling fluid can be vented
safely into the environment. The relief valve makes it possible to regulate the pressure, and thereby
the cooling temperature, in the blow system.
6
2 CO2 cooling blow system usage
The CO2 cooling blow system can be used for quick experiment/power cooling. The system is able to
cool down experiments to a temperature range of -30 to -10 °C. The maximal power that can be
cooled with the blow system is equal to 200 Watt.
Figure 5 gives a view of the CO2 cooling blow system with indication of the important parts and
controls.
Figure 5: Indication of the parts of the CO2 cooling blow system
Don’t use the CO2 cooling blow system in a poorly ventilated room and
without CO2 alarm system to avoid the danger of suffocation!
In use, always fasten the cylinder in the CO2cooling blow system with the
cylinder holder strap.
7
2.1 Sensors of the CO2 cooling blow system
The CO2 cooling blow system contains two types of sensors, temperature sensors and pressure
sensors. The two pressure gauges on the front panel of the system function as pressure sensors. Gauge
8 indicates the pressure in the CO2 cylinder and gauge 3 indicates the system pressure.
The temperature sensors are thermocouple sensors and indicate the temperature of CO2 at the
following points:
•
•
•
•
•
T1
T2
T3
T4
T5
Temperature of the heat exchanger 1outlet
Temperature of the experiment inlet
Temperature of the experiment return
Temperature of the heat exchanger 2 inlet
Temperature of the heat exchanger 2 outlet (vent)
2.2 Connecting the blow system
Check if the cylinder is secured with the cylinder holder strap and that the ramp is secured. Next make
sure that all the Swagelok connections to the CO2 cooling blow system are connected securely. The
connections to consider are:
•
•
•
•
Experiment inlet (2)
Experiment return (4)
Relief connection (9)
Cylinder connection (7)
Plug the power plugs of the Tamson hot bath circulator and, if present, the flow meter in sockets.
8
2.3 Disconnecting the blow system
Make sure that the CO2 cylinder is closed properly. Measure the temperature of the CO2 and the
system pressure.
[bar]
60
50
40
30
20
10
[°C]
40
30
20
10
-10
-20
The table to the left indicates the system pressure and the temperature of
CO2 at which a pressure drop to 1 bar may occur without snow formation
in the system.
There won’t be snow formation when the system pressure is kept above
10 bar.
When the measured temperature is above the indicated temperature at the
system pressure, the pressure may be lowered to 1 bar.
Now partly open the flow regulator
(1) and the pressure regulator (5).
Let the pressure drop to 0 bar on
both pressure gauges.
Disconnect both experiment
connections and the relief
connection.
When the power of the Tamson hot
bath circulator is off, pull the plugs
from the sockets.
Figure 6: Front panel
9
2.4 Refreshing the CO2 cylinder
Make sure that the blow system is disconnected (paragraph 2.3) from the experiment (2, 4), relief (9)
and electricity supply.
Place the blow system so that there is enough room to lower
the ramp and to position the cylinder trolley in front of the
ramp (11). Lock the front wheels of the blow system and
disconnect the cylinder connection (7).
Next lower the ramp and place the cylinder trolley in front
of the ramp. Loosen the cylinder holder strap. Carefully turn
the cylinder of its plateau (12) down the ramp into the
cylinder trolley. Fasten the strap of the cylinder trolley.
Position the new CO2 cylinder in the trolley before the ramp.
Loosen the strap of the trolley and carefully turn the cylinder
up the ramp onto the cylinder plateau. Next fasten the strap
of the cylinder holder round the cylinder. Pick up the ramp
and secure it.
Figure 7: Cylinder connection with nylon
ring
Connect the cylinder connection; mind that the nylon ring is present!
2.5 Getting started
When the CO2 cooling blow system is properly connected as described
in paragraph 2.2, it is time to start cooling. It is important to follow the
instructions for the user safety.
Turn on the power of the Tamson hot bath circulator as shown in
Figure 8. The temperature of the water in the hot bath can be set with
the temperature knob on top of the Tamson (40 °C). Consider that the
temperature knob is secured. The temperature can be read from the
thermometer on top.
Wait approximately 10 minutes, so that heat exchanger 2, behind the
front panel, is warm; A surface temperature of approximately 37 °C.
Figure 8: Tamson hot bath
circulator
Now check that the flow regulator is partially open
(indication 5.0) and the pressure regulator is almost
closed, this means a high pressure.
The pressure of the system is regulated with the
pressure regulator and is indicated with the lower
pressure gauge. The mass flow is regulated with the
flow regulator.
Don’t let the system pressure drop below 10 bar!
Figure 9: Front panel of the blow system
10
When heat exchanger 2 is warm the CO2 cylinder can be turned open. Make sure that you stand
beside the blow system when opening the cylinder related to the high pressure in the cylinder and
check that there is no hissing sound from a leak in the system.
When the electricity supply fails, immediately close the CO2 cylinder!
As soon the temperature of the experiment is (sensors T2 and T3) is cold, turn the flow regulator to
the required indication which is given in paragraph 2.6.
Adjust the pressure regulator to the required pressure. Mind to do this slowly for small pressure
changes, small turns and wait ± 30 seconds!
Watch temperature sensor T4, for this temperature gives an indication for the stability of the cooling
temperature. When T4 increases much over time, it’s possible that the flow is too low and the system
isn’t able to cool the power of the experiment. After a while the experiment temperatures T2 and T3
will increase due to the mass flow shortage.
Keep an eye on temperature sensors and mind that:
•
•
•
T4 may not increase much in time
T2 and T3 must be approximately equal to the acquired cooling temperature
T5 may not be lower than 10 °C
The power of the experiment can be set when the acquired pressure, cooling temperature and mass
flow is reached.
2.6 System settings
The settings of the metering valve of the CO2 cooling blow system are measured for certain mass
flows. The settings will be set so that the cooling temperature -30 °C is reached. The mass flow will
be set to reach a liquid-vapour ratio of 0.5 after passing the experiment. The power of the experiment
will be varied between 20 and 200 Watt.
In the following tables the settings for the metering valve for the cooling temperatures and heat loads
are given.
Table 1: Metering valve settings at approximately -30 °C
[Watt]
20
50
100
200
[°C]
-30
-30
-30
-30
[bar]
13 ± 1
13 ± 1
13 ± 1
13 ± 1
[g/s]
0.3 ± 0.1
0.4 ± 0.1
0.7 ± 0.05
1.3 ± 0.1
11
Metering valve indication
1.15
1.20
2.07
3.12
2.7 Turning the CO2 cooling blow system off
To turn off the CO2 cooling blow system, close the CO2 cylinder. Open the flow regulator partially, so
that the high pressure behind the valve can leave the system.
When the system has warmed up, as indicated in paragraph 0, the power of the Tamson hot bath
circulator can be turned off.
2.8 CO2 cooling blow system transport
By transport of the CO2 cooling system, always remove the CO2 cylinder
from the system!
The blow system can be moved by means of the wheels of the system. Make sure that the blow
system is disconnected properly, as indicated in paragraph 2.3, and that the CO2 cylinder is removed
from the cylinder plateau and thus from the blow system (paragraph 2.4)!
The weight of the CO2 cylinder is above 25 kg, move the cylinder with at
least two persons!
Transport of the CO2 cylinder must be done with a cylinder trolley.
12
3 Product assembly
A view of CO2 cooling blow system assembly is given in Figure 10
and the parts list is given.
•
•
•
•
•
•
•
•
•
•
•
•
•
•
•
•
•
•
•
•
•
•
•
Frame of Bosch profile 45 Χ 45 mm
2 castors with polyurethane band
2 casters with polyurethane band
Polyethylene box 16 litre
Tamson hot bath circulator
2 blue flexible tubes
Balance and protector
Ramp
Botlle holder
CO2 cylinder
Front panel
5 Thermocouples
Rheonik mass flow meter RHM015 & RHE07
2 Pressure gauges
2 Swagelok relief valve, type SS-6R3A-MM
Swagelok metering valve, type SS-42GS6MM
Swagelok Filter, type SS-6TF-MM-05
Swagelok tube fittings 6 mm
Merinox stainless tube 3x0.5 mm
Merinox stainless tube 6x1.0 mm
Swagelok convoluted PTFE hose
CO2 cylinder connection RU1
Nylon ring
Figure 10: Product assembly
The Tamson hot bath circulator is the heat
supply for the post-heat exchanger (heat
exchanger 2).
It is possible to place a mass flow meter in
the system to monitor the mass flow of the
CO2 through the system. Adding a mass
flow meter to the system must be done by
a technician employed at Nikhef.
Figure 11: Schematic view of the CO2 cooling blow system
13
The CO2 cooling blow system exists out
the blow system cycle build out of
Swagelok parts, as shown in Figure 11.
With the two pressure gauges, the cylinder
pressure and system pressure can be
monitored. Five thermocouples give the
system temperature at several points,
indicated in Figure 11.
4 Failure and repair
Interference of the Tamson hot bath circulator:
•
Turn the power of the Tamson hot bath circulator off, close the CO2 cylinder, don’t use the
system and report the failure by the Mechanische Technologie department of Nikhef.
The system can’t reach the necessary cooling capacity:
•
•
Turn the flow regulator slowly open. The mass flow of the CO2 increases and is able to absorb
more heat from the experiment.
Make sure that the tubing from the experiment inlet en to the experiment outlet is properly
insulated. It is possible that the tubing experiences a large heat transfer as a consequence of
the temperature difference with the surroundings.
The system doesn’t reach the cooling temperature:
•
•
Slowly turn the pressure regulator so that it closes a bit. As a consequence of the pressure
drop in the CO2 cooling blow system the relation of temperature and pressure in the system is
lost.
Turn the flow regulator maximal open en check the mass flow. When the mass flow isn’t
larger than 1,5 g/s the CO2 cylinder is empty and needs to be refreshed.
5 Maintenance
The maintenance of the CO2 cooling blow system will be done by technicians employed at Nikhef.
14
Appendix A: Theoretical mass flow calculation
An indication will be given of the mass flow that is necessary to cool certain powers to a cooling
temperature of -30 °C. The theoretical change in enthalpy during the cooling process is determined
and next the mass flow is calculated.
Figure 12: Theoretical cooling process of the CO2 cooling blow system
The total change in enthalpy for the cooling process is equal to: Δ The change in enthalpy as a consequence of cooling the heat load of the experiment is equal to:
Δ Where:
Enthalpy at 20°C and 60 bar
Enthalpy after pre-cooling and 60 bar
Enthalpy after pre-cooling and pressure drop
Enthalpy after cooling the experiment
[254 kJ/kg]
[kJ/kg]
[kJ/kg]
[kJ/kg]
The mass flow which is necessary for cooling the experiment is equal to the power of the experiment
divided by the total change in enthalpy:
Where:
Power of the experiment
Total change in enthalpy
Δ
Δ
[200 J/s]
[kJ/kg]
15
Table 2 and Table 3give the theoretical calculated mass flows for heat loads of 20, 50, 100, 200 Watt
for the different cooling temperatures.
Table 2: Theoretical enthalpy for a cooling cycle with a liquid-vapour ratio of 0.5
[°C]
-30
[bar]
14.3
[kJ/kg]
254
′ [kJ/kg]
134
[kJ/kg]
133
[kJ/kg]
285
∆ [kJ/kg]
152
Table 3: Theoretical calculated mass flows for a liquid-vapour ratio 0.5 and a cooling temperature of -30 °C
[g/s]
0.13
[g/s]
0.33
[g/s]
0.66
[g/s]
1.32
16
Appendix B: Results of reducing mass flow tests
The minimal CO2 mass flow of the CO2 cooling blow system for certain experiment powers is
determined. A thin tube is connected to the CO2 cooling blow system, power is added to the tube with
a power supply. At a constant power the mass flow is reduced to the point at which the mass flow is
too little to be able cool the thin tube.
First the mass flow is established a bit above the theoretical mass flow. Next the power is added and
the mass flow is reduced until an unstable state is reached.
Time
14:18
14:20
14:22
14:24
14:26
14:27
14:32
14:32
14:34
14:39
14:43
14:48
14:48
14:49
14:56
14:58
15:00
15:02
15:06
15:12
15:16
15:18
15:20
15:22
15:24
15:26
15:28
15:30
15:32
15:34
15:35
15:36
15:36
15:39
15:43
15:49
15:51
15:53
15:55
Action
Heat exchanger 1 is warm 37.3 °C
Cylinder open, pressure set on 12 bar and flow at indication 10
Calibrate load 0.6 Ohm
Pressure much to high, flow reduced to indication 2
System and experiment are cold, adjust the pressure to 12 bar
Reduce flow at 0 Watt, indication 1.10
Flow instituted at 2.0
Add power, accidently 300 Watt
Add power, I=5.8 A, 20 Watt, indication 1.20
Indication 1.15
Indication 1.10
Indication 2.0
Add power, I=9.1, 47.1 Watt
Power off, wait until T4 is cooled down
Add power, I=9.1, 47.1 Watt, adjust pressure to 12 bar
Indication 1.20
Power off, wait until T4 is cooled down
Indication 3.0
Pressure adjustment to 12 bar
Add power I=12.9, 95.4 Watt
Reduce mass flow, indication 2.23
Indication 2.21
Indication 2.19
Indication 2.17
Indication 2.15
Indication 2.13
Indication 2.11
Indication 2.09
Indication 2.07
Indication 2.05
Power off
Adjust mass flow to indication 3.10
Indication 3.20
Adjust pressure to 12 bar
Add power. I=18.3, 200Watt
Indication 3.18
Indication 3.16
Indication 3.14
Indication 3.12
17
Mass flow
3.3
0.5
0.5
0.1 ± 0.05
0.5 ± 0.1
0.3 ± 0.1
0.25 ± 0.1
0.2 ± 0.1
0.5 ± 0.1
0.35 ± 0.1
1.0 ± 0.1
1.0 ± 0.2
1.0 ± 0.1
1.0 ± 0.05
0.9 ± 0.05
0.9 ± 0.05
0.8 ± 0.05
0.8 ± 0.05
0.7 ± 0.05
0.7 ± 0.05
0.7 ± 0.05
0.6 ± 0.05
1.4 ± 0.05
1.5 ± 0.05
1.4 ± 0.05
1.4 ± 0.05
1.4 ± 0.1
1.3 ± 0.1
?
15:55
15:57
Power off, power supply electricity wire too hot!
CO2 cooling blow system off
Figure 13 and Figure 14 give a view of the test results. Temperature T5 is always above 20 °C and
depends on the amount of CO2 that is evaporated in the experiment and heat exchanger 1. When the
liquid-vapour ratio is high, this temperature will increase.
Temperatures T1, T2 and T3 are constant at a cooling temperature of -30 °C. The temperature peaks
are a consequence of the pressure adjustments that are done, see Figure 14.
Temperature T4 has an instable course over time. This is a consequence of the changing liquid-vapour
ratio of the CO2,when all the liquid CO2 has evoparted the temperature will increase. This increase in
temperature has no influence on the stability of the system as long as the liquid CO2 from the cylinder
is pre-cooled (T1) before it experiences a pressure drop due to the needle valve (flow regulator).
Figure 13: Temperature-time diagram of the power tests to determine the minimal mass flow
18
CO2 cooling blow system
300
250
P [Watt]
200
150
100
50
0
14:24
14:38
14:52
15:07
15:21
t [HH:MM]
15:36
15:50
16:04
16:19
Figure 14: A view of the power that is added over time during the power tests
CO2 cooling blow system
30
25
p [bar]
20
15
10
5
0
14:24
14:38
14:52
15:07
15:21
t [HH:MM]
15:36
Figure 15: Pressure-time diagram of the power tests
19
15:50
16:04
16:19