1
GL800
Application software
USER'S MANUAL
MANUAL NO. APS(GL800)-UM-152
Contents
1. Main Features........................................................................................................... 4
2. System Requirements............................................................................................... 6
3. Installing the USB Driver........................................................................................... 7
4. Connecting to a PC (Personal Computer)............................................................... 10
4-1 Connecting via USB . .................................................................................................................10
4-2 Connecting via LAN....................................................................................................................11
4-3 Setting IP Address or USB ID.....................................................................................................12
5. Installing the GL800 Application Software ............................................................. 14
6. Launching the Software.......................................................................................... 15
7. PC Connection Settings.......................................................................................... 16
8. Display Screens...................................................................................................... 18
8-1 Y-T (Main Screen).......................................................................................................................18
8-2 Enlarged Y-T Display...................................................................................................................20
8-3 X-Y .............................................................................................................................................21
8-4 Digital .........................................................................................................................................22
8-5 Meter . ........................................................................................................................................23
8-6 Report ........................................................................................................................................24
9. Settings Screens..................................................................................................... 25
9-1 AMP Settings..............................................................................................................................25
9-1-1 Span Settings....................................................................................................................27
9-1-2 Scaling Settings................................................................................................................27
9-2 Data Capture Settings . ..............................................................................................................28
9-2-1 Device Capture Settings ..................................................................................................29
9-2-2 PC Capture Settings.........................................................................................................30
9-3 Trigger/Alarm Settings . ..............................................................................................................31
9-3-1 Trigger Start Condition......................................................................................................32
9-3-2 Alarm Condition ...............................................................................................................34
9-3-3 Send Email when Alarm is Generated..............................................................................34
9-4 Report Settings...........................................................................................................................35
9-5 Other Settings.............................................................................................................................36
10. About Icons........................................................................................................... 37
10-1 Expand, Shrink, or Move the Y Axis..........................................................................................37
10-2 Plot Marks.................................................................................................................................38
10-3 Y Axis Operations ....................................................................................................................38
10-4 Display Cursors . ......................................................................................................................41
10-5 Input Comments . .....................................................................................................................41
11. Replay Data ......................................................................................................... 42
11-1 Replay Data Captured to the PC .............................................................................................42
11-2 Replay Data Captured to the Device . ......................................................................................43
11-3 Review PC (Waveform Display)................................................................................................44
11-3-1 Superimpose/Link...........................................................................................................45
11-3-2 Convert then Save .........................................................................................................45
11-3-3 Display in Excel ..............................................................................................................46
11-3-4 Alarm . ............................................................................................................................46
11-3-5 Search . ..........................................................................................................................46
11-3-6 XY between Cursors.......................................................................................................47
11-3-7 Scale Operations.............................................................................................................47
11-4 Review PC (Digital Display)......................................................................................................48
12. Other Functions..................................................................................................... 49
12-1 CSV File Batch Conversion .....................................................................................................49
12-2 Statistics/Log . ..........................................................................................................................50
12-3 Protect . ....................................................................................................................................50
12-4 Exit Software.............................................................................................................................51
13. Operating Procedure............................................................................................. 52
1. Main Features
1-1 A Variety of Display Formats
Data can be viewed in Y-T, X-Y, Digital, Meter, and Report formats, on large, easy-to-read screens.
In the Y-T display screen, display can be either enlarged or scrolled vertically.
1-2 Simple and Easy to Use
Large icons make it simple and easy to control the waveforms. Time axes, spans, waveform positions can be changed
easily.
1-3 Multichannel Measurement
A maximum of 200 channels can be measured with one device, and 500 channels with multiple devices connected.
Displayed waveforms can be grouped, and you can select and check a desired waveform among many of them
(up to four groups can be set per device).
1-4 Export to Direct Excel File Function
Captured data can be exported directly to an Excel file and displayed as graphs.
Ready-to-use template files are provided as standard for your convenience.
(Note: The Microsoft Excel program must be installed.)
1-5 Thumbnail Waveform Display
Before replaying captured data, the waveforms can be checked by referring to the small images (thumbnails) provided
next to each file name. These thumbnails provide easy confirmation of the data before opening the file.
1-6 Real-time Calculation Functions
During data capture and data replay operations, up to four calculation operations can be performed.
The calculation results can be viewed as a waveform.
1-7 Send Email when Alarm is Generated
When an alarm is generated, this function enables a notification email to be sent to a mobile phone, for example, thereby
ensuring that a check can be performed if required.
(Note: An email sending environment is required.)
1-8 Printing Function, Screen Save Function
The waveform screen can be printed out on a printer, and screen copies saved to a file.
(Note: To use the printing function, the device must be connected to a printer.)
1-9 Help Function
Help buttons that provide simple descriptions of the various functions are assigned to each of the menu setting items to
provide ease of use.
2. System Requirements
Make sure that the computer on which you plan to install the software meets the following requirements.
Item
OS
CPU
Memory
HDD
Display
Other
System requirements
Windows 2000, XP,Vista
Pentium 4: 1.7 GHz or higher
256 MB or more
20 MB additional space is required for installing software.
1024 x 768 resolution or higher, 65535 colors or more (16-bit or more)
USB port, TCP-IP port, CD-ROM drive (for installing from CD)
Microsoft Excel software (for the Export to Direct Excel File and Display in Excel functions)
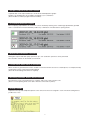
CHECKPOINT
Even when using a PC that meets the system requirements, measurement data may not be captured correctly depending on the PC status
(e.g. running other applications or insufficient memory capacity in the storage media used).
Exit all other applications before capturing data to the internal hard disk.
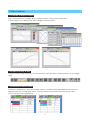
3. Installing the USB Driver
This chapter describes how to install the USB driver.
Checking the version of your USB driver
This section describes how to view the version of the USB driver if it is already installed.
(1) Opening "Device Manager"
Select "Control Panel" g "System" g "Hardware" tab or right-click "My Computer", select "Properties" g
"Hardware" tab g "System Properties" window, and then click the "Device Manager" button.
(2) In the "Device Manager" window, open "USB (Universal Serial Bus) Controller". Confirm that "Graphtec DM/GL/WR
Series USB Driver" is shown. Right-click it and select "Properties".
(3) Updating the driver
Select the "Driver" tab and click the "Driver Details" button.
(4) Select [...\GTCUSBR.SYS] to view the version of the driver file.
Installing the USB driver
This section describes how to install the USB driver.
(1) Insert the User's Guide CD-ROM provided as a standard accessory into the PC's CD-ROM drive.
(2) Connecting the GL800 to the PC
Connect the GL800 to the PC using the USB cable, and then turn the power on.
(3) Install the USB driver. The installation procedure depends on the type of operating system and whether or not you
are installing the driver for the first time.
Windows XP,Vista :
Driver software is to be installed for the first time.
Driver software is already installed.
Windows 2000: Driver software is to be installed for the first time.
Driver software is already installed.
Windows XP,Vista : Driver software is to be installed for the first time.
Installing the USB driver
(1) Detecting the hardware
Connect the USB cable to the PC and GL800. The "Found New Hardware" message appears.
(2) Starting the wizard
In the "Found New Hardware Wizard" window, select "Install from a list or specific location (Advanced)" under
"What do you want the wizard to do?" and click "Next".
(3) In the "Please choose your search and installation options." window, select "Don't search. I will choose the driver to
install." and click "Next".
(4) In the "Select the device driver you want to install for this hardware." window, click "Have Disk".
(5) In the "Install from Disk" window, browse the CD-ROM under "Copy manufacturer's files from",
select "USB DRIVER \ Win2k-XP-Vista \ GTCUSBR.INF" and click "OK".
*If your OS is the Windows Vista (64 bit version), please install the USB driver which is located at "USB Driver \ Vista-x64".
(6) In the "Select the device driver...." window, "Graphtec DM/GL/WR Series USB Driver" appears in the "Model" box.
Select it and click "Next".
(7) Installing the driver
Windows XP starts installing the driver. Depending on the OS settings, the following error message may be
displayed: "The software you are installing for this hardware: GL800 has not passed Windows Logo testing to verify
its compatibility with Windows XP." Click the "Continue" button to proceed with the installation.
(8) Completing installation
The "Completing the Found New Hardware Wizard" window appears. Click "Finish" to exit the wizard.
Windows XP,Vista : Driver software is already installed.
Updating the USB driver
(1) Opening "Device Manager"
Select "Control Panel" g"System" g "Hardware" tab or right-click "My Computer", select "Properties" g
"Hardware" tab g "System Properties" window, then click the "Device Manager" button.
(2) In the "Device Manager" window, open "USB (Universal Serial Bus) Controller". Confirm that "Graphtec DM/GL/WR
Series USB Driver" is shown. Right-click it and select "Properties".
(3) Updating the driver
Select the "Driver" tab and click "Update Driver".
(4) Starting the update wizard
The "Hardware Update Wizard" appears. Select "Install from a list or specific location (Advanced)" under "What do
you want the wizard to do?" and click "Next".
(5) In the "Please choose your search and installation options." window, select "Don't search. I will choose the driver to
install." and click "Next".
(6) In the "Select the device driver you want to install for this hardware." window, click "Have Disk".
(7) In the "Locate File" window, browse the CD-ROM, select "USB DRIVER \ Win2k-XP-Vista \ GTCUSBR.INF" and click "Open".
*If your OS is the Windows Vista (64 bit version), please install the USB driver which is located at "USB Driver \ Vista-x64".
(8) Return to the "Select the device driver" window and click "Next".
(9) Installing the driver
Windows XP starts installing the driver. Depending on the OS setting, "The software you are installing for this
hardware: GL800 has not passed Windows Logo Testing to verify its compatibility with Windows XP" message may
appear. Simply click "Continue Anyway".
(10)Completing the installation
The "Completing the Hardware Update Wizard" window appears. Click "Finish" to exit the wizard.
Windows 2000: Driver software is to be installed for the first time.
Installing the USB driver
(1) Starting the wizard
Connect the USB cable to the PC and the GL800. The "Found New Hardware" wizard appears.
(2) In the "Found New Hardware Wizard" window, select "Search for a suitable driver for my device (Recommended)"
under "What do you want the wizard to do?" and click "Next".
(3) In the "Locate Driver File" window, select "CD-ROM drive" under "Optional search locations" and click "Next".
(4) Browse the CD-ROM, select "USB DRIVER \ Win2k-XP-Vista \ GTCUSBR.INF" and click "OK".
(5) "The wizard found a driver" message appears. Click "Next".
(6) Completing installation
The "Completing Found New Hardware Wizard" window appears. Click "Finish" to exit the wizard.
Windows 2000: Driver software is already installed.
Updating the USB driver
(1) Opening "Device Manager"
Select "Control Panel" g "System" g "Hardware" tab or right-click "My Computer", select "Properties" g
"Hardware" tab g "System Properties" window, then click the "Device Manager" button.
(2) In the "Device Manager" window, open "USB (Universal Serial Bus) Controller". Confirm that "Graphtec DM/GL/WR
Series USB Driver" is shown. Right-click it and select "Properties".
(3) Updating the driver
Select the "Driver" tab and click "Update Driver".
(4) Starting the update wizard
"Upgrade Device Driver Wizard" appears. Click "Next".
(5) In the "Install Hardware Device Drivers" window, select "Display a list of the known drivers for this device so that
I can choose a specific driver." under "What do you want the wizard to do?" and click "Next".
(6) In the "Select a Device Driver" window, click "Have Disk".
(7) In the "Locate File" window, browse the CD-ROM, select "USB DRIVER \ Win2k-XP-Vista \ GTCUSBR.INF" and click "OK".
(8) Return to the "Select a Device Driver" window and click "Next".
(9) In the "Start Device Driver Installation" window, click "Next".
(10)Completing installation
The "Completing the Upgrade Device Driver Wizard" window appears. Click "Finish" to exit the wizard.
4. Connecting to a PC (Personal Computer)
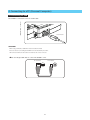
4-1 Connecting via USB
The GL800 is connected to a PC via a USB cable.
B connector
CHECKPOINT
When using a USB cable, a USB driver must be installed in the PC.
Please see Section 3, "Installing the USB Driver" for the installation procedure.
LAN connector. Make sure the cable is inserted into the correct connector.
Use an A-B type USB cable to connect the GL800 to a PC.
A connector
B connector
10
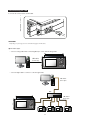
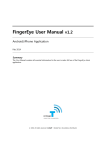
4-2 Connecting via LAN
It can also be connected via a LAN cable.
CHECKPOINT
Depending on your usage, use one of the following types of LAN cables.
LAN Cable Types
• Use a crossing cable when connecting directly to a PC, without using a hub.
LAN cable
(crossing)
PC
• Use a straight cable to connect to a PC through a hub.
LAN cable
(straight)
PC
HUB
LAN cable
(straight)
11
4-3 Setting IP Address or USB ID
To connect to a PC, configure the device's interface settings.
USB Settings
Press the "MENU" key five times to open "I/F Settings".
Configure "USB ID Settings".
Power off and restart to make the settings take effect.
TCP-IP Settings
Press the "MENU" key five times to open "I/F Settings".
Configure "TCP-IP Settings".
Set "IP Address", "Subnet Mask", "Port Number", and "Gateway".
Then power off and restart to make the settings take effect.
12
Example of TCP-IP Settings
Connecting one PC and one GL800
Refer to the following settings if you are not connecting to a corporate LAN or other networks.
Connect GL800 to a PC with a crossover cable.
PC's IP Address
GL800's IP Address
IP Address of second and more GL800s
192. 168. 1. 1
192. 168. 1. 2
192. 168. 1. 3 (increase the number replacing "3" with 4, 5, 6, and so on)
CHECKPOINT
In this case, always set the subnet mask to "255.255.255.0".
In this case, always set the port number to "8023".
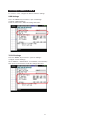
Setting PC's IP Address (Windows XP)
Select "Start" button g "Control Panel" g "Network Connections" g "Local Area Connection" g "Properties" g
"Internet Protocol (TCP/IP)" g "Properties", click to select "Use the following IP address" check box, set "IP address"
and "Subnet mask", and then click "OK".
13
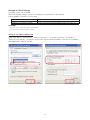
5. Installing the GL800 Application Software
This chapter describes how to install the application software.
(1) Insert the User's Guide CD-ROM provided into the PC's CD-ROM drive.
(2) Click the Taskbar's Start button, and then click the Run... icon to open the "Run" window.
(3) Enter the CD-ROM drive name and \English\GL800-APS\Setup.exe as the name of the file you wish to open.
If the disk is in drive D, for example, enter "D\English\GL800-APS\Setup.exe" in the box and then click "OK" to launch
the installer.
(4) Follow the instructions on the screen to continue with the installation.
CHECKPOINT
Be sure to observe the following points when connecting the GL800 to a PC.
• Do not connect any devices apart from a mouse or a keyboard to any of the other USB terminals on your PC.
• Set the PC's power-saving functions to Off.
• Set the Screen Saver to Off.
• Set the anti-virus software auto update and scan scheduler functions to Off. Also, set the Windows auto update and scheduler functions
to Off.
14
6. Launching the Software
Click the Taskbar's "Start" button g "Programs" g "GL800APS" g "GL800APS" to launch the application software.
Once the program has started up, the following screen is displayed.
15
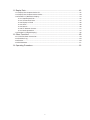
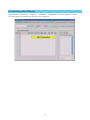
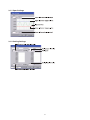
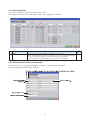
7. PC Connection Settings
Configure the communication settings between GL800 and a PC.
(1) Click the "Connect (F5)" button on the main menu to display the Connect screen.
(2) Select the interface to connect.
(3) Click row "1:" to reverse the display color to blue, and then click the "Edit/Add" button.
(4) Enter "Device Name", "IP Address", "Port Number", and "USB ID", and then click "OK".
(5) Click the "Connect" button to perform the connection to enable communication between the devices.
(6) Click the "Close (ESC)" button to close the Connect screen.
16
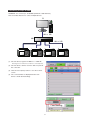
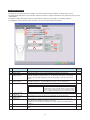
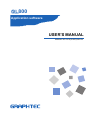
Connecting multiple GL800s
GL800APS can connect up to 10 GL800s (maximum of 500 channels).
This section describes how to connect multiple devices.
PC
LAN or USB
HUB
LAN or USB
(1) On each device, register "IP Address" or "USB ID".
Note: Register one number for each device to avoid duplicates.
(2) On each device, click the "Connect" button to perform
the connection.
(3) Click the "Close (ESC)" button to close the Connect
screen.
(4) The connected tabs are displayed. Select each
device to make desired settings.
17
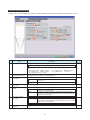
8. Display Screens
This chapter describes the various screens used in this software.
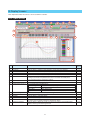
8-1 Y-T (Main Screen)
1
2
3
10
9
4
11
5
12
6
13
8
7
14
16
15
17
18
19
20
21
22
23
24
No.
Name
1
2
3
4
5
6
Connect (F5)
Review PC
CSV file batch conversion
Enlarged Y-T display
Protect
Print Screen
7
8
9
Save Screen
End
Simplified message area
Description
Click this button to open the Connect screen.
Click this button to replay the data captured to the PC (personal computer).
Click this button to convert multiple GBD (binary data) files captured to the PC to CSV files.
Click this button to enlarge the waveform area in Y-T display screen.
Click this button to set the password to protect the software.
Click this button to print out a copy of the screen.
Printing is performed at the printer that has been selected as the default printer.
If you change the printer, relaunch the software.
Click this button to save the displayed screen as a BMP file.
Click this button to exit the application.
The operating status is displayed here.
Free Running
Armed
Recording...
Capture Ended
10
11
12
13
14
Capture Settings
Start (F7)
Stop (F8)
Review Device
Alarm
15
Statistics/Log Display
Ref.
Section
7
11-1
12-1
8-2
12-3
12-4
Stopped status (not capturing data)
Awaiting trigger activation; data has not been captured.
Data capture status
Data captured has ended. Click the "Stop" key.
Click this button to open the data capture settings screen.
Click this button to start data capture.
Click this button to stop data capture.
Click this button to replay the data captured to the device.
Click this button to display the alarm output port status. If "Alarm Hold" has been selected,
the alarm can be cleared by clicking the "Alarm Clear" button.
Click this button to display the results of statistical calculation performed during data
capture, and a log of the alarms generated.
18
9
11-2
11-3-4
12-2
No.
16
Name
Battery Information
Description
The device battery capacity is displayed here.
When the AC power supply is being used
Battery power: Full
Battery power: Medium
Battery power: Low
Battery power: Very low
17
Capture Information
Ref.
Section
(blue, blue, blue)
(green, green, green)
(–, orange, orange)
(–, –, red)
(–, –, –)
Data capture stops if a capture operation
is being performed.
Information is displayed here during a data capture operation.
Start Time
Capture Time
Allowable Time
Data capture start time.
The amount of time that has elapsed since the start of data capture.
The amount of time available for data capture. When the remaining
time is up, data capture stops at both the device and the PC.
Number
The number of data capture operations when Repeat Capture
has been specified.
Sampling Interval
The sampling interval.
PC Capture Destination The data capture destination at the PC.
18
19
Waveform Op.
Cursors
20
Comment
21
Switch displayed groups
22
23
Waveform Graph
Digital
24
Cursor Time
Click this button to perform various settings for the waveform display.
Click these buttons to display the cursors during a data capture operation when the device
is in the Scroll Off status.
Click this button to enable a comment to be input above the desired CH waveform on the
waveform graph displayed during data capture.
Click one of these buttons to select a group whose waveform and digital values are
displayed.
The waveforms are displayed here.
The digital values are displayed in this area. Clicking on any of the CH numbers enables
the waveform for that channel to be hidden/displayed. The channels for which an alarm
has been generated are shown in red.
The cursor times are displayed during data capture when Scroll Off has been selected.
10
10
10
The "Scroll" button is displayed on the Y-T screen during data capture. Use the "Scroll" button's On/Off functions to
display current data and past data.
When Scroll On has been selected, the waveform graph is scrolled so that the data at the right edge is the newest data.
When Scroll Off has been selected, the scrolling operation is halted and data that was captured in the past can be viewed
on the scroll bar.
Scroll On
Scroll Off
19
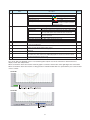
8-2 Enlarged Y-T Display
You can press
■ button to enlarge Y-T waveform display area.
2
1
3
4
6
5
7
8
9
10
11
12
13
No.
Name
1
2
3
4
5
Simplified message area
Start (F7)
Stop (F8)
Protect
Print Screen
6
7
8
9
10
Save Screen
Close
Capture Information
Waveform Op.
Cursors
11
Comment
12
13
CH Select
Waveform Graph
Description
The operating status is displayed here.
Click this button to start data capture.
Click this button to stop data capture.
Click this button to set the password to protect the software.
Click this button to print out a copy of the displayed screen.
Printing is performed at the printer that has been selected as "the default printer".
Relaunch the software after you change the printer.
Click this button to save the displayed screen as a BMP file.
Click this button to go back to the regular screen.
Information is displayed here during a data capture operation.
Click one of these buttons to perform various settings for the waveform display.
Click these buttons to display the cursors during a data capture operation when the device
is in the Scroll Off status.
Click this button to enable a comment to be input above the desired channel waveform on
the waveform graph displayed during data capture.
Select the channel to perform waveform operation.
The waveforms are displayed here.
20
Ref.
Section
12-3
10
10
10
10
8-3 X-Y
Up to four combinations can be handled, and the X-Y channels can be specified freely.
6
1
2
4
3
5
No.
Name
1
2
X-Y Waveform Graph
Range
3
4
ON/OFF
X Axis/Y Axis
Channel Settings
Cursor Information
Waveform Op.
5
6
Description
The X-Y waveforms are displayed here.
These buttons specify display of the scale values for the channels selected for the X and
Y axes.
Click these buttons to specify the display as ON or OFF.
Use these buttons to select the channels for the X and Y axes.
The cursor levels of the channels for which Range has been specified are shown here.
Use these buttons to expand, shrink, or move X and Y axes.
21
Ref.
Section
8-4 Digital
The captured data is displayed as digital values. Instantaneous values are displayed in large characters to enable easy
confirmation.
1
2
4
3
No.
1
2
3
4
Name
Set displayed CH
Analog
Pulse
Logic
Description
Click one of these buttons to select 20 analog channels to display the digital values.
20 analog channels' digital values are displayed here.
Pulse signals' digital values are displayed here.
Logic signals' digital values are displayed here.
22
Ref.
Section
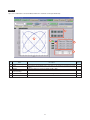
8-5 Meter
The inputs for each channel are displayed in a meter format.
1
2
3
No.
1
2
3
Name
Description
Set displayed CH
Click one of these buttons to select 20 analog channels to display in the meters
Alarm Range
The alarm range is displayed in ◄.
Instantaneous Value Level This is the current input position. It is filled in red from zero to the current input value.
23
Ref.
Section
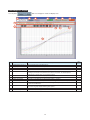
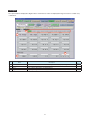
8-6 Report
The daily report data is displayed in this screen.
When the device is in the Free Running status, the data can be displayed in Excel format.
If Off has been specified for the Report setting, report data is not displayed.
3
1
2
4
No.
Name
1
2
Display in Excel
Daily report data
3
Daily Report Capture
Interval
Calc. results
4
Description
The data is displayed in Excel format when the device is in the Free Running status.
The daily report data is displayed here. If the number of points exceeds 100, data is
deleted starting from the oldest data (the actual data is not affected).
The daily report capture interval is displayed here.
The calculated results for the average, maximum and minimum values are displayed here.
24
Ref.
Section
9. Settings Screens
This chapter describes the screens used to perform settings related to data capture.
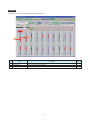
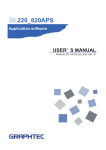
9-1 AMP Settings
This screen is used to make the analog input, logic input, and pulse input settings.
1
5
2
3
6
7
9
10
11
8
12
4
13
14
20
15
16
17
18
21
22
1
Name
Settings tabs
27
28
These tabs are used to change the settings screen.
Report Settings
Other Settings
CH
Color
Annotation
Input
25
Description
AMP Settings
Data Capture Settings
Trigger/Alarm Settings
2
3
4
5
24
19
26
No.
23
This tab is used to make input-related settings.
This tab used to make settings related to data capture.
This tab is used to make settings related to the trigger and
alarm functions.
This tab is used to make settings related to the daily report,
monthly report, and Export to Direct Excel File functions
This tab is used to make various other settings, to display
information, and so forth.
These are the channel numbers for analog input.
The color used for the waveform for each channel can be specified here.
Each channel can be freely annotated (input the signal name, etc.).
Select the input type for each channel.
Off
DC
TEMP
RH
No input is made to that channel.
Select DC to perform voltage measurement.
Select TEMP to perform temperature measurement.
Select RH to perform humidity measurement.
25
Ref.
Section
No.
6
Name
Range
Description
Ref.
Section
These buttons are used to select the input range for each channel.
DC
TEMP
RH
20, 50, 100, 200, 500 (mV), 1, 2, 5, 10, 20, 50 V, 1-5V
TC-K, TC-J, TC-T, TC-R, TC-E, TC-B, TC-S,
TC-N, TC-W, Pt100, JPt100, Pt1000
Fixed to 1 V; the unit is converted internally.
0V g 0%, 1V g 100%
7
Filter
Use these buttons to set the filter for each channel. Moving average processing is used in
the filter. It captures the data for configured number of times at the configured sampling
rate and performs average processing.
Off, 2, 5, 10, 20, 40 (times)
8
9
Unit
Span
10
11
Scaling
CH Group
12
13
Switch CH
Graph Display
14
15
16
17
Logic/Pulse switching
Logic CH number
Logic Line Color
Logic Filter
The selected unit is displayed here.
Use these buttons to set the upper limit and lower limit values for the waveforms
displayed in the waveform graph.
Use these buttons to convert the unit.
Use these buttons to set the display group for each channel.
Only the groups set here can be viewed in Y-T display screen.
Use this slider to select 10 channels to perform the settings.
The waveforms for which settings have been made can be checked here.
Click the "Apply" button to apply the settings that have been made.
Use this button to switch the digital input. Logic, Pulse, or OFF can be set here.
The channel numbers for logic input.
Make the logic waveform color setting here.
Make the logic filter setting here. The filter is about -3dB at about 30Hz.
18
19
20
Pulse CH number
Pulse Line Color
Pulse Input
The channel numbers for pulse input.
Make the pulse line color setting here.
Use the Input button to select the pulse input type.
9-1-1
9-1-2
Off, On
Off
Revolutions
Counts
Inst.
21
Pulse Range
Pulse input is not made.
The number of pulses generated in one second is counted, multiplied
by 60, and displayed as the number of revolutions (RPM).
A cumulative count is made of the number of pulses generated in one
sample.
The number of pulses generated in one sample is counted.
Use these buttons to set the pulse range.
Revolutions
Counts
Inst.
50, 500, 5000, 50k, 500k, 5M, 50M, 500M
PRM/F.S.
50, 500, 5000, 50k, 500k, 5M, 50M, 500M
C/F.S.
50, 500, 5000, 50k, 500k, 5M, 50M, 500M
C/F.S.
22
Pulse Filter
Make the pulse filter setting here. The filter is about -3dB at about 30Hz.
23
Pulse Slope
Use this button to select the pulse detection slope.
Off, On
H
L
24
Pulse Span
25
26
27
28
Pulse Scaling
OK
Cancel
Apply
Rising signals are counted.
Falling signals are counted.
Use this button to set the upper limit and lower limit values for the waveforms displayed
in the waveform graph.
Use this button to convert the unit.
Click this button to register your settings and close the screen.
Click this button to close the screen without registering your settings.
Click this button to apply the settings made.
26
9-1-1
9-1-2
9-1-1 Span Settings
9-1-2 Scaling Settings
27
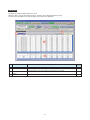
9-2 Data Capture Settings
Settings such as the Sampling Interval, Device Capture Settings and PC Capture Settings are made at this screen.
1
5
2
6
7
3
8
4
No.
1
9
Name
Sampling Interval
Description
Ref.
Section
Use this button to select the sampling interval.
100, 200, 500 (ms), 1, 2, 5, 10, 20, 30 (s), 1, 2, 5, 10, 20, 30 (min), 1 (h)
2
3
Device Capture Settings
Allowable capture time
Device Capture Settings
Name Type
Depending on the measured number of channels, the following sampling intervals can be
set.
•10 channels or less : 100ms or above
•11 to 20 channels : 200ms or above
•21 to 50 channels : 500ms or above
•51 to 100 channels : 1s or above
•101 to 200 channels: 2s or above
The length of time available for data capture to the selected device storage medium
(internal memory or USB device) is displayed here.
Use this button to select the method for appending the file name.
Auto
User
4
5
Device Capture Settings
Save Path
PC Capture Settings
Format
The save destination at the device for the captured data is selected here.
GBD
The data is saved as binary data. When compared with a CSV file,
the file size is somewhat small.
The data is saved as text data in a format that can be displayed in
Excel. Please note that the maximum number of samples that can be
displayed in Excel is 65535.
PC Capture Settings
Name Type
Use this button to select the method for appending the file name.
PC Capture Settings
Save Path
The save destination at the PC (personal computer) for the captured data is selected
here.
Auto
User
7
9-2-1
Use this button to select the format of the data saved to the PC (personal computer).
CSV
6
Create a date folder in the specified folder, and then create a date and
time file in it.
The file name can be freely specified by the user.
A folder with the date as the file name is created within the specified
folder, and then a file with the date and time as the file name is created
within the newly-created folder.
The file name can be freely specified by the user.
28
9-2-2
No.
Name
8
PC Capture Settings
Create Backup File
9
PC Capture Settings
Backup Interval
Ref.
Section
Description
To enable this function, click the checkbox to display the check mark. The backup file is
created at the same location as that specified in Item 7 "Save Path" above. The "_bk" file
extension is appended to the file name.
Use this button to select the backup interval. During data capture, a backup data file is
created at the specified intervals. If all the backup files are linked, the data will be same
as that of the original data.
1, 2, 6, 12, 24 (h)
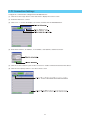
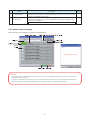
9-2-1 Device Capture Settings
This screen shows the settings for the Device save destination.
Select Folder Screen
CAUTION!!
Data capture cannot be started if the device is full. If the device becomes full during a data capture, the device stops capturing,
but the PC continues capturing.
If "Repeat" is set to "ON" in Trigger Settings, after the device becomes full, the PC also stops capturing next time the Repeat starts.
When measuring for a long time, attach a USB memory to the device and set it as a destination for capturing.
29
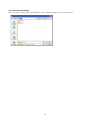
9-2-2 PC Capture Settings
The screen that is normally used to open Windows is used to make the settings for the PC save destination.
30
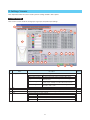
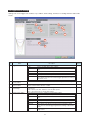
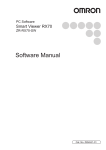
9-3 Trigger/Alarm Settings
Settings such as the trigger start condition, stop condition, alarm settings, and those for sending email are made at this
screen.
1
5
6
2
7
3
8
4
9
10
11
12
No.
Name
Description
1
Trigger Start Condition
Use this button to select the trigger start condition.
Off
There is no data capture start condition.
Level
Data capture starts when the desired channel reaches the specified level
value.
Alarm
Data capture starts when the specified alarm occurs.
Date
Data capture starts at the specified date and time.
Time
Data capture starts at the specified time.
External
Data capture starts with the external terminal signal.
Data capture starts when the external trigger signal detects a falling of
about 2.5V or less.
2
Start side
Level Condition
Start side
Alarm Condition
Start side
Date Settings
If "Level" has been selected for the start condition, make the required level settings here.
3
4
5
Trigger Stop Condition
If "Alarm" has been selected for the trigger start condition, set the alarm number here.
Select an alarm number between 1 and 4.
If "Date" or "Time" has been selected for the trigger start condition, make the required
settings here.
Date : Set the year, date, and time to start the data capture.
Time : Set only the time to start the data capture.
This parameter specifies the condition for stopping data capture.
Off
Level
Alarm
Date
Time
External
Capture time
There is no data capture stop condition.
Data capture stops when the desired channel reaches the specified level
value.
Data capture stops when the specified alarm occurs.
Data capture stops at the specified date and time.
Data capture stops at the specified time.
Data capture stops with the external terminal signal. Data capture
stops when the external trigger signal detects a falling of about 2.5V
or less.
Data capture stops when data has been captured for the specified
length of time.
31
Ref.
Section
9-3-1
No.
6
7
8
Name
Description
Stop side
Level Condition
Stop side
Alarm Condition
Stop side
Date Settings
9
Repeat
10
11
Alarm Condition
Alarm Hold
If "Level" has been selected for the stop condition, make the required level settings here.
If "Alarm" has been selected for the trigger stop condition, set the alarm number here.
Select an alarm number between 1 and 4.
If "Date", "Time", or "Capture time" has been selected for the trigger stop condition, make
the required settings here.
Date
: Set the year, date, and time to stop the data capture.
Time
: Set only the time to stop the data capture.
Capture time: Set the length of time between the start and the end of the data capture.
If On has been selected, the device proceeds to perform the next data capture operation
after a stop trigger has been generated.
Use this button to make the alarm level settings for each input.
This parameter specifies whether to maintain or clear the alarm status.
On
Off
12
Send Email when Alarm is
Generated
Ref.
Section
9-3-1
9-3-2
Once an alarm has been generated, the alarm status is maintained.
The alarm generated on each channel is retained together with the alarm
output status. To clear the alarm status, click the "Alarm Clear" button
displayed in the "Alarm Screen" described in Item 14 of Section 8-1, "Y-T".
The alarm generated status is not maintained. If the alarm status is
canceled, the alarm status and alarm output for each channel are
canceled.
9-3-3
Use this button to set the conditions for sending an email.
An email can be sent when an alarm has been generated.
(However, an email sending environment must be enabled.)
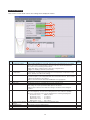
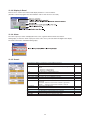
9-3-1 Trigger Start Condition
If "Level" has been selected for the Trigger setting, the "Trigger Start Condition" settings must be made.
1
2
3
4
7
5
8
9
10
11
6
12
14
13
15
No.
1
2
Name
CH
Function
Description
The channel numbers are displayed here.
Use this button to select the trigger level detection mode.
Off
Hi
Lo
Win In
Win Out
3
4
Upper/Lower
Unit
16
Disabled
Detection is performed when the signal is rising.
Detection is performed when the signal is falling.
Detection is performed when the value is within the specified range.
Detection is performed when the value is outside the specified range.
The level settings are displayed here.
The unit is displayed here.
32
Ref.
Section
No.
Name
Description
5
Settings
Click this button to make the level settings.
6
7
8
Switch CH
Pulse CH
Pulse Function
Use this slider to select 10 channels to perform the settings.
The channel numbers for pulses are displayed here.
Use this button to select the pulse level detection mode.
Off
Hi
Lo
Win In
Win Out
9
10
11
12
13
Pulse Upper/Lower
Pulse Unit
Pulse Settings
Logic CH
Logic Function
The level settings are displayed here.
The unit is displayed here.
Click this button to make the pulse settings.
The channel numbers for logics are displayed here.
Use this button to select the logic setting.
X
Hi
Lo
14
Combination
15
16
OK
Cancel
Disabled
Detection is performed when the signal is rising.
Detection is performed when the signal is falling.
Detection is performed when the value is within the specified range.
Detection is performed when the value is outside the specified range.
Disabled
Detection is performed when the signal is rising.
Detection is performed when the signal is falling.
Use this button to set the combination of configured triggers.
OR : Data capture starts (stops) when one of the configured trigger conditions is true.
AND: Data capture starts (stops) when all of the configured trigger conditions are true.
Click this button to register your settings and close the screen.
Click this button to close the screen without registering your settings.
Example of level setting screen
33
Ref.
Section
Figure
below
9-3-2 Alarm Condition
The alarm level settings for each input are made at this screen.
The settings are the same as those described in Section 9-3-1, "Trigger Start Condition".
1
No.
1
Name
Output
Description
Use these buttons to set the number to output when an alarm occurs.
Select a number between 1 and 4. The output is from the device's alarm output terminal.
To use the alarm output signal, you need a B-513 which is sold separately.
For the specification of the alarm output, refer to the device's User's Guide.
9-3-3 Send Email when Alarm is Generated
An email can be sent to a specified email address (or addresses) when an alarm is generated.
(An email sending environment must be enabled.)
34
Ref.
Section
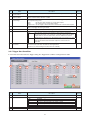
9-4 Report Settings
The daily report and monthly report settings, as well as the Direct to Excel settings, are made at this screen.
The daily and monthly reports are created as separate CSV files at capture intervals that are separate from those of the
captured data.
The Export to Direct Excel File function transfers data in real time to an Excel file as it is being captured.
If a template is used for the Excel file, waveforms can also be drawn in Excel in real time.
1
3
4
2
5
6
8
9
7
No.
Name
1
2
3
Daily report
Monthly report
Daily report
Capture Interval
4
Monthly report
Capture Interval
Output Format
5
Description
Click this checkbox to enter a check and enable the Daily report function.
Click this checkbox to enter a check and enable the Monthly report function.
Use this button to select the daily capture interval.
Available settings for 20 channels are 1, 5, 10, and 30 seconds, and 1, 5, 10, and 30
minutes. The selectable maximum speeds vary depending on how many channel are
used.
Use this button to select the monthly capture interval.
Available settings are 1, 5, 10, and 30 minutes, and 1, 2, 6, 12, and 24 hours.
Use this button to select the output format for the report(s).
Save as CSV batch files
Export to direct Excel file
6
8
Configure CSV file:
Daily report
Configure CSV file:
Monthly report
Template file
9
10
Destination sheet
Start cell
7
10
The data is saved as CSV batch files.
The captured data is exported directly to Excel. If a
template file that was created in Excel is used, an original
report can be created in real time. The template files that
were provided as standard accessories can also be used.
This parameter is used to specify the save destination for the Daily report.
This parameter is used to specify the save destination for the Monthly report.
The template file settings for the Export to Direct Excel File function are made here.
Files with the "xlt" and "xls" extensions can be used.
Template files are provided as standard in the "Temp" folder that is installed with this
software.
This parameter is used to specify the name of the specified template sheet.
This parameter is used to specify the start position on the sheet from which to transfer
data.
35
Ref.
Section
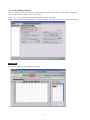
9-5 Other Settings
This screen is used to make various other settings and to display information.
1
2
3
4
5
6
7
8
9
10
11
No.
Name
1
Synchronous control
2
Room Temp.
Compensation
3
Burnout
4
5
6
Output alarm at burnout
Temp. Unit
Power On Start
7
AC Line Frequency
8
Return to Factory Default
Settings
Software Version
Device Information
Graphtec Web site
9
10
11
Description
When multiple GL800s are connected, and if you start a measurement on one of them,
all the others whose synchronization control set to On also start the measurement.
The same is true for finishing a measurement.
Trigger and capture settings operate at their own configured values.
(Triggers or samplings cannot be synchronized.)
This parameter is used when thermocouples are used to perform temperature
measurement. Set to On when performing the room temperature compensation on this
device. (Always select On for this setting.)
Set to On to regularly check a thermocouple sensor line break.
If a thermocouple is connected parallel with other measurement devices, please set this
to Off as it may affect the other devices.
When a sensor line break is detected, "BURN OUT" message appears.
When set to On, an alarm is output when a burnout has occurred.
The display unit can be switched between Celsius and Fahrenheit.
Data capture starts automatically as soon as the power to the device is turned on.
This setting can only be specified for data capture to the device.
If On has been selected, select "Save the settings to the device" when exiting this
software.
Set the voltage frequency to suit the area where the device will be used. Be sure to select
the correct frequency, as an incorrect setting affects the noise reduction capability.
The noise on the power source can be eliminated at the following sampling rates:
10 channels or less
: 500ms or above
20 channels or less
: 1s or above
50 channels or less
: 2s or above
100 channels or less : 5s or above
200 channels or less : 10s or above
Click this button to return the settings to the default values.
The software version is displayed here.
Information relating to the connected device is displayed here.
Click this button to access the Graphtec web site.
36
Ref.
Section
12-4
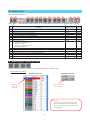
10. About Icons
This chapter describes icons.
1
2
3
4
5
6
7
8
9
10
11
12
13
14
(In this table: F = Operable during a Free Running, C = Operable during a data capture, R = Operable during a replay)
No.
1
2
3
4
5
6
7
8
9
10
11
12
13
14
Description
Operable behavior
Shrinks the time axis.
Expands the time axis.
Expands the Y axis of the selected channel.
Shrinks the Y axis of the selected channel.
Moves up the position of the selected channel.
Moves down the position of the selected channel.
Displays plot marks at the sample points of a waveform.
Opens a sub-screen to:
•Switch the scroll direction,
•Set the scale axis,
•Reset the Y axis operation, and
•Perform calculations.
Displays Cursor A in the waveform display.
Displays Cursor B in the waveform display.
Input comments. Up to 20 comments can be entered.
Displays the level value for Cursor A in the digital value area.
Displays the level value for Cursor B in the digital value area.
Displays the level value for Cursor A-B in the digital value area.
C, R
C, R
F, C, R
F, C, R
F, C, R
F, C, R
F, C, R
F, C, R
C, R
C, R
C, R
C, R
C, R
C, R
Ref.
Section
10-1
10-1
10-1
10-1
10-2
10-3
10-4
10-4
10-5
10-1 Expand, Shrink, or Move the Y Axis
Select a channel and click one of these icons to expand, shrink, or move the Y axis.
How to Select a Channel
Enlarged Y-T Screen
Regular Y-T Screen
Highlight the
Channels to be
operated.
Select a Channel
to be operated.
CAUTION!!
There may be some deviation if you repeat the
operation to change back to the original state.
In this case, follow the steps in 10-3-3 "Reset the
Y Axis Operation".
37
10-2 Plot Marks
The waveforms are plotted by interpolating sample points.
Click this icon to display marks for the actual sample points.
10-3 Y Axis Operations
Click this icon to open the sub-screen to perform Y axis operations.
10-3-1 Scroll Directions
Item
Scroll direction
Description
In Y-T display screen, switches the scroll direction:
Horizontal or Vertical.
Horizontal Scroll
Vertical Scroll
38
Operable behavior
F, C, R
10-3-2 Scale Axis Settings
Item
Zone Divisions
Y Axis 1-4
(when "No Division"
is selected)
Description
Operable behavior
Divides the zone for the waveform graph. You can select
F, C, R
"No Division", "Divide by 2", "Divide by 5", or "Divide by 10".
Note: The zone division is not available in vertical scroll mode.
Sets the channel for Y axis ranges 1 to 4.
F, C, R
<Zone Division Screen>
<Example of Y Axis Range Display>
39
10-3-3 Reset the Y Axis Operation
Item
Description
Reset
Operable behavior
F, C, R
After using these icons to expand, shrink, or move the Y axis,
click "Reset" to change back to the state before performing the
operation. Select a channel to reset, and then click this key.
10-3-4 Calculation
Item
Calculation CH
On/Off
Calculation
Formula
Description
Use these buttons to set calculations 1-4 to On/Off.
On : Calculation results are shown as waveforms and digital
values.
Off : Do not perform calculations.
The calculation results are only shown in Y-T display, and
do not affect the captured data.
Use this button to set the variable for a linear expression
between channels.
A • ・CH X ∗ B • ・CH Y + C
The expression you set appears at the bottom of this
window.
40
Operable behavior
F, R
F, R
10-4 Display Cursors
Click these icons to show cursors in the waveform display.
Cursor A
Cursor B
10-5 Input Comments
Click this icon to input a comment above the waveform of the desired channel during a data capture (replay) operation.
When On has been selected for Scroll : The comment is input at "Comment Input Pos" above the waveform graph.
When Off has been selected for Scroll : The comment is input at the position above Cursor A.
When displaying replay
: The comment is input at the position above Cursor A.
41
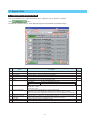
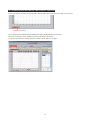
11. Replay Data
11-1 Replay Data Captured to the PC
This section explains how to replay data that has been captured to your PC (personal computer).
Click
button.
The data files captured to the PC will be displayed together with thumbnails (small index images).
6
2
1
5
3
4
7
8
9
11
10
No.
1
2
3
4
5
6
Name
Drive
File Path
Select Folder
Create Folder
Delete
Order
Description
Use this button to select the appropriate PC drive.
The file location is displayed here.
Click this button to select the folder that has data files.
Click this button to create a new folder.
Click this button to delete the selected file.
Use this button to select the file arrangement order.
File Name
Day/Time Updated
7
Frequently-used folder
8
Waveform thumbnail
9
10
File list
Register as frequentlyused folder
Select File
Cancel
11
12
12
The files are arranged by file name.
The files are arranged starting from the latest updated day/time.
Use these buttons to select a frequently-used folder and move the file to that folder.
Single click : Select
Double click : Move
The captured data is displayed as a compressed waveform.
Thumbnails can only be displayed for data that was captured using this software.
Moreover, data that was captured to the device itself cannot be displayed as thumbnails.
The captured data is displayed in a list format.
Click this button to register the currently displayed folder as one of the frequently-used
folders. After registering, it is added to Item 7 "Frequently-used folder".
Click this button to select a file (display the file).
Click this button to cancel the selected file.
42
Ref.
Section
11-2 Replay Data Captured to the Device
Replay data that has been captured to the device.
Click
■ button.
The data captured to the device are displayed.
1
No.
1
2
2
Name
Device Memory
USB device
Description
Click this button to display the files saved to the internal memory.
Click the appropriate button to display the files saved to the selected USB device.
43
Ref.
Section
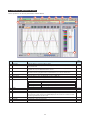
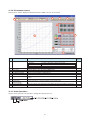
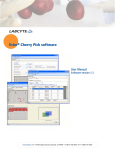
11-3 Review PC (Waveform Display)
These operations can also be performed for Review device.
2
1
3
4
5
6
7
9
8
11
10
12
14
13
No.
Name
1
2
Open File
Superimpose/Link
3
Convert then Save
4
Display in Excel
5
6
7
8
Print Screen
Save Screen
Close
Replay information
Description
Click this button to select the data to replay.
Click this button to display a screen showing superimposed or linked data from multiple
files saved in PC.
Click this button to convert the replayed data to a different file format (GBD, CSV) or to
clip and save only the data between the cursors.
Click this button to display the captured data in Excel format.
The Microsoft Excel program must be installed before you can use this function.
Click this button to print out a copy of the displayed screen at your default printer.
Click this button to save the displayed screen as a BMP file.
Click this button to close the replay screen.
The replay information is displayed here.
Capture File Name
Start Time
Capture Time
Sampling Interval
9
10
11
12
Alarm
Search
XY between cursors
Digital
13
14
15
Scale operations
Scroll bar
Cursor Time
15
Ref.
Section
11-3-1
11-3-2
11-3-3
The name of the data capture file that is being replayed.
The time at which data capture was started.
The data capture time
The sampling interval
Click this button to display the alarm port status.
Click this button to perform data search.
Click this button to display the data between the A and B cursors in X-Y format.
The digital values are displayed in this area. Clicking on any of the CH numbers enables
the waveform for that channel to be hidden/displayed. The channels for which an alarm
has been generated are shown in red.
Use this area to auto-scale X axis, enlarge the selected area, etc.
Use this bar to move the waveform.
The cursor times are displayed here.
44
11-3-4
11-3-5
11-3-6
11-3-7
11-3-1 Superimpose/Link
This function enables multiple files to be superimposed on the display, or to be linked.
The data must be captured under the same conditions to be linked.
1
2
3
4
No.
1
2
3
4
5
6
7
5
6
Name
Add
Delete
File list
Superimpose
Link
Default
Cancel
7
Description
Click this button to add a file to those selected for the superimposing or linking operation.
Click this button to delete the added file from the list.
The files added to those selected for superimposing or linking are listed here.
Click this button to superimpose files.
Click this button to link files.
Click this button to open the original file without performing any superimposing or linking operations.
Click this button to close the screen.
11-3-2 Convert then Save
This function is used to convert replayed data to a different format (GBD, CSV), and to clip and save only the data
between the cursors.
45
Ref.
Section
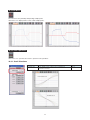
11-3-3 Display in Excel
This function is used to launch Excel and display the data in a new worksheet.
(The Microsoft Excel program must be installed in order for this function to be used.)
11-3-4 Alarm
The alarm output port status is displayed in this screen, together with the Alarm Clear button.
During replay, it shows the alarm output port status at the cursor point selected in the digital value display.
The Alarm Clear button is disabled during replay.
11-3-5 Search
Analog Search ("Edge" is used for the search judgment criterion.)
CH
Use this button to select the CH to be searched.
Slope
Use this button to select the slope to use for performing the
search.
H: Search for a rising signal.
L : Search for a falling signal.
Level
Use this button to set the search level.
Prev. Search
Search in the past direction.
Next Search
Search in the forward direction.
Alarm Search ("Edge" is used for the search judgment criterion.)
Alarm
This parameter is used to specify the alarm port number (fixed).
Generated/Cleared Use this button to set the alarm status in which searches are
performed.
Generated : Performs search when an alarm is generated.
Cleared : Performs search when an alarm is cleared.
Prev. Search
Search in the past direction.
Next Search
Search in the forward direction.
Max/Min
CH
Use this button to select the CH to be searched.
Search Max
A search is made for the maximum value data.
Search Min
A search is made for the minimum value data.
46
R
R
R
R
R
R
R
R
R
R
R
R
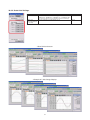
11-3-6 XY between Cursors
This function is used to display the data between the A and B cursors in an XY format.
2
1
4
3
6
9
5
7
8
10
11
No.
1
Name
Replay Information
Description
The replay information is displayed here.
Start Time
Capture Time
Sampling Interval
2
3
4
5
6
7
Print Screen
Save Screen
Close
X-Y Waveform Graph
Waveform operation icons
Range
8
9
ON/OFF
X Axis/Y Axis
Channel settings
Cursor Information
Display Cursor
10
11
The time at which data capture was started.
The data capture time
The sampling interval
Click this button to print a copy of the screen at the default printer.
Click this button to save the screen in BMP format.
Click this button to close the screen.
The X-Y waveform graph is displayed here.
Use these buttons to expand, shrink, or move X and Y axes.
These buttons specify display of the scale values for the channels selected for the X and
Y axes.
Click these buttons to specify the display as ON or OFF.
Use these buttons to select the channels for the X and Y axes.
The cursor levels of the channels for which Range has been specified are shown here.
Click this button to move the cursor to the center of the graph.
11-3-7 Scale Operations
Use this area to perform scale operations, enlarge the selected area, etc.
47
Ref.
Section
Revision sheet
The function which are marked are not available.
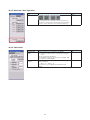
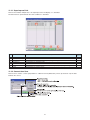
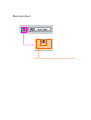
11-4 Review PC (Digital Display)
You can select "Digital" tab to switch to the digital display.
The Digital screen is used mainly to perform operations such as statistical calculation using the A and B cursors.
1
2
3
4
No.
1
2
3
4
Name
Display switching tabs
Execute Stat. Calc
Digital display
Cursor Time
Description
Click one of the tabs to switch between Waveform and Digital displays.
Click this button to perform statistical calculation of the data between Cursors A and B.
The cursor A and B levels, calculation results, and so forth are displayed here.
The cursor A and B times are displayed here.
48
Ref.
Section
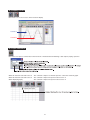
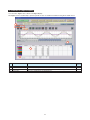
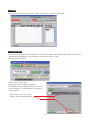
12. Other Functions
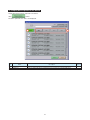
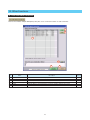
12-1 CSV File Batch Conversion
This function enables multiple GBD (binary data) files to be converted in a batch to CSV format files.
2
3
1
4
6
No.
1
2
3
4
5
6
Name
List of converted files
Add
Delete
Save destination folder
Cancel
Start batch conversion
5
Description
The batch-converted files are displayed in a list.
Click this button to add a file to the batch to be converted.
Click this button to remove a file from the batch to be converted.
Select the save destination for the batch-converted files here.
Click this button to cancel the batch conversion operation and close the screen.
Click this button to start batch file conversion.
49
Ref.
Section
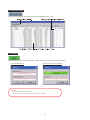
12-2 Statistics/Log
The statistical calculation and alarm log results are displayed in this screen.
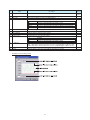
12-3 Protect
Click this button to protect all the operations of this software. To clear it, password should match.
Protect Setting Screen
Protected / Protect Clear Screen
Enter the password.
Enter the password again to confirm it.
Enter the password to clear protect.
CAUTION!!
Protect is effective only on this software.
Note that you can exit this software by using Windows operations.
50
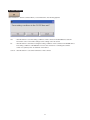
12-4 Exit Software
Click this button to exit this software. When you click this button, the following appears:
Yes
: Click this button to save the setting conditions on this software in the GL800 device and exit.
Note that it cannot save all the settings. Some settings cannot be saved.
No
: Click this button to exit without saving the setting conditions on this software in the GL800 device.
The setting conditions on GL800 device revert to the state before controlling the software.
In this case, please power off and back on the device.
Cancel : Click this button to cancel the termination of this software.
51
13. Operating Procedure
This chapter describes the basic operating procedure.
The operating procedure starts with the software and the device in the connected status.
For the connection procedure, see Section 4, "Connecting to a PC (Personal Computer)".
The settings that are not addressed in the following sections are the factory default settings.
No.
1
2
3
4
5
Operation
Capture Settings
Start
Displaying past data during a data capture operation
Stop
Replay Data
Description
Make the settings required for data capture.
Start data capture.
Select Off for "Scroll" to display past data.
Stop data capture.
Replay data captured to the PC (personal computer).
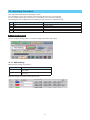
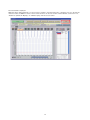
13-1 Capture Settings
Click the "Capture Settings" button to make the settings required for data capture.
13-1-1 AMP Settings
Make the input settings shown below.
CH used
Input
Range
2 channels (CH 1 and CH 2)
CH 1: DC
CH 2: TEMP
CH 1: IV
CH 2: TC-T
Make the settings as shown in the following screen:
52
13-1-2 Data Capture Settings
When the settings described in Section 9-1, "AMP Settings" have been made, click the "Data Capture Settings" tab.
Here, we will make the settings related to data capture.
Select "1sec" for the sampling interval. Leave all the other settings unchanged.
(Device capture destination: Device Memory; PC capture destination: the folder to which this software was installed)
13-2 Start
Click the "Start" button to start capturing actual data.
53
13-3 Displaying Past Data during a Data Capture Operation
If Off is selected for the waveform "Scroll" button during a data capture operation, past data can be viewed.
Click the "Scroll" button.
The scrolling operation will be halted, enabling past data to be displayed in the scroll bar.
Moreover, moving the cursors enables the cursor level values to be viewed.
To return to the waveform scrolling operation, click the "Scroll" button once again.
54
13-4 Stop
Click the "Stop" button. Data capture stops, and the device returns to the Free Running status.
13-5 Replay Data
Data that has been captured to the PC (personal computer) can be replayed. Replaying the data enables you to view the
captured data, and aligning the cursors enables you to browse the reference values.
Click the "Review PC" button.
The file selection screen opens.
Open the file to which the data was captured.
A thumbnail waveform is displayed at the left of each file
name, enabling you to confirm the data contents without
opening each file.
Select the file that you want to open,
and then click the "Select File" button.
55
The selected file is replayed.
While the data is being replayed, you can move the scroll bar to view the waveforms, or align the cursors to browse the
reference values. In addition to these, various other functions can also be used. For further details, see Section 11-3,
"Review PC (Waveform Display)". To end data replay, click the "Close" button.
56
Specifications are subject to change without notice.
GL800 Application Software User's Manual
APS (GL800)-UM-152
August 1, 2007 1st edition-02
GRAPHTEC CORPORATION