1
Operation & Maintenance
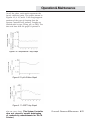
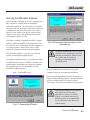
On all the plots, each mark represents the
hourly collection point. The graphs shown in
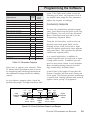
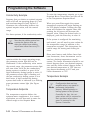
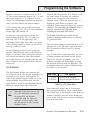
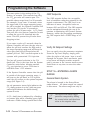
Figures 4.9, 4.10, and 4.11 are rough approximations of the type of charting that the
System Controller will perform. Graphs are
labeled with its type (Temp, pH, or ORP). The
date and time that the graph is printed is
Figure 4.9 • Temperature 7-day Graph
Figure 4.10 • pH 48-Hour Graph
Figure 4.11 • ORP 7-day Graph
also on every chart. (The System Controller
does not currently support datalogging
of conductivity measurements for the IR
Printer.)
CHAPTER 4: OPERATION & MAINTENANCE 4-11