1
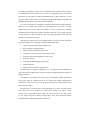
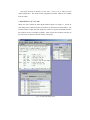
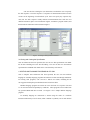
Once the program halts (because a condition bit was set to 1, an error occurred, or the user selected the "Stop" menu item) the user can inspect the state of the machine, including the contents of the registers and RAMs. 5. SPECIAL FEATURES OF CPU SIM Some of the strengths of CPU Sim include its display of registers and RAMs, its editing and debugging aids, and its help facilities, all of which make it easier for the user to understand what is happening as a program is executing. 5.1 Displaying Registers and RAMs The user can view the contents of the registers and RAMs though windows (for example, see the windows labeled "Registers" and "RAM Main" in Figure 1). The contents of the registers can be viewed and edited, if desired, in either decimal, binary, or hexadecimal. A decimal value is converted to or from a binary value using two's complement representation. The values in each RAM can also be displayed in these bases. In addition, the RAM values can be displayed and edited in groups of 1 to 8 bytes, corresponding to the word size of the architecture being simulated. Furthermore, RAM windows include a column for comments associated with each word of memory, which provides a way for the user to indicate the contents of the word. The assembler initializes this column with the comments on the end of each line of assembly code. That is, if a line of the assembly program is: add sum
; add sum to the acc
then the assembler and loader will put the assembled code in the RAM and will put the comment in the corresponding comment column of the RAM window. 5.2 Editing and Debugging CPU Sim has a debugging mode that users can enter when they wish to step through the execution of the program one machine instruction or one microinstruction at a time. (See Figure 7 for the toolbar that appears when users enter debugging mode.) After each such step, the user can inspect and optionally edit the state of the machine. CPU Sim can also be configured to highlight cells of RAMs whose addresses are in certain registers. For example, the top of the stack can be highlighted, as well as the next instruction to be executed. At any point when in debug mode, the user can also back up one machine instruction at a time (all the way back to the original state of the machine when debug mode was entered). This ability to step forward and backward through the code makes pinpointing hardware or software errors almost trivial.