1
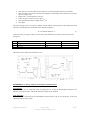
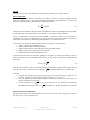
Physics 476LW
Modern Physics Laboratory
Gamma-Ray Spectroscopy
Introduction
The purpose of this experiment is to acquaint the student with some of the basic techniques used for
measuring g-rays. It is based on the use of a thallium-activated sodium iodide detector (NaI(Tl)). Much of
this manual is adapted from the ORTEC® documents Experiment 3: Gamma-Ray Spectroscopy Using
NaI(Tl) and MAESTRO®-32 MCA Emulator Software User’s Manual.
There are a number of types of detectors for gamma radiation and they are used in a variety of areas of
physics. For example, g-ray detectors that were used for studying g-rays produced by electron-positron
annihilation near black holes detected g-rays produced by lightning on Earth. g-ray production by lightning
had been unknown and the serendipitous measurements opened up a variety of questions that continue to be
studied.
The premium solid-state g-ray detector is high purity germanium (HPGe). Although it produces excellent
results it is very expensive and a high level of expertise is need use it. In this lab we use a NaI(Tl) detector,
which is a scintillation type detector. One of the weaknesses of NaI(Tl) is that it does not have the energy
resolution of HPGe, as can be seen by comparing the width of the peaks in Figure 1. Therefore, one part of
our experiment will be to determine the energy resolution of our NaI(Tl) detector.
Figure 1. Comparison of peaks from HPGe and NaI(Tl) detectors.
(From ORTEC publication: Experiment 7: High-Resolution Gamma-Ray Spectroscopy)
2 The Experiment
2.1 The Apparatus
- Integrated NaI(Tl) Scintillator, Photomultiplier Tube, and PMT Base with Stand
- Lead shielding
- Multi Channel Analyzer (MCA)
- Windows computer with PCI card
- MAESTRO-32 software
- A set of radioactive samples
Department of Physics
May 30, 2013
University of Missouri-Kansas City
1 of 6
Figure 2. Diagram of NaI(Tl) g-ray scintillation detector system
2.2 Startup Procedures
The apparatus will be set up for this experiment. Complete the following steps:
- Log onto the computer using your university username and password .- Start the MAESTRO-32 software
- Under tab "Acquire" select option “MCB Properties”
- Select tab “high voltage” and select "On". The high voltage is 800 V.
2.3 Spectra Collection
Calibration
The first task that must be performed is calibration. The detector consists of 1024 channels of a
multichannel analyzer (MCA) system. The system has a linear relation between the height of the pulse
coming from the gamma-ray detector and the energy deposited in the detector by a g-ray. We will calibrate
the system to determine the slope and y-intercept of the calibration function.
Calibration procedure
•
•
•
•
Under "Acquire" select the "Clear" option.
Place the 137Cs sample on the blue sample holder and slide it into the top of the sample chamber
rack.
Make sure the lead absorber is in the slot of the rack just below the sample.
Close the door on the sample chamber.
Department of Physics
May 30, 2013
University of Missouri-Kansas City
2 of 6
•
•
•
•
•
•
Click the "Go" icon and collect counts until there are several hundred counts in the channels.
Click the "Stop" icon and save the data in an SPE file on the desktop with a name that you will be
able to recognize later.
Remove the 137Cs and replace it with 60Co.
Under "Acquire" select the "Clear" option.
Close the door and collect a sample for the 60Co.
Save again.
The energy data given for 137Cs and 60Co and the channel number of these peaks are three data points from
which you can determine the coefficients of the calibration equation:
Eg = m*(channel number) + b
(1)
where Eg is the g-ray energy in MeV, m is the slope of the calibration line, and b is the intercept on the
energy axis.
1
2
3
Item
137
Cs
1st 60Co
2nd 60Co
Energy (MeV)
0.662
1.17
1.33
Table 1
Channel Number
Determine m and b and plot the calibration curve.
Figure 3. 137Cs peak
Figure 4. 60Co peaks
EXPERIMENT 3.2. Energy Analysis of an Unknown Gamma Source*
3.2.1 Purpose
This experiment uses the calibrated system of Experiment 3.1 to measure the photopeak energies of an
unknown g-ray emitter and to identify the unknown isotopes of the elements.
3.2.2. Procedure
1. Erase the 60Co spectrum from the multichannel analyzer (MCA), but do not change any of the gain
calibration settings of the system.
Department of Physics
May 30, 2013
University of Missouri-Kansas City
3 of 6
2. Obtain an unknown gamma source from the instructor. Accumulate a spectrum for the unknown sources
for a period of time long enough to clearly identify its photopeak(s). From the calibration curve, determine
the energy for each photopeak.
-----------------------------------------------------------------------------------------------------------EXERCISE
Use the library services of MAESTRO-32 to identify the unknown isotope.
-----------------------------------------------------------------------------------------------------------EXPERIMENT 3.3. Spectrum Analysis of 60Co and 137Cs*
3.3.1. Purpose
The purpose of this experiment is to explain some of the features, other than the photopeaks, usually
present in a pulse-height spectrum. These are the Compton edge, the Compton continuum and the
backscatter peak.
3.3.2. Background Information
The photopeak is created when a gamma-ray photon interacts in the scintillator via the photoelectric effect.
The photon encounters an electron that is tightly bound to a nucleus. The entire energy of the photon is
transferred to the electron, causing the electron to escape from the atom and the gamma-ray disappears in
the process. As the photoelectron travels through the scintillator, it loses its energy by causing additional
ionization. At the end of the process, the number of ionized atoms is proportional to the original energy of
the photon. As the electrons refill the vacancies in the ionized atoms, visible light photons are generated.
This is the source of the scintillation, wherein the number of visible photons is proportional to the original
energy of the gamma-ray. Consequently, the event populates the photopeak in the spectrum. This peak is
often called the full-energy peak, because a two-step interaction, a Compton scattering followed by a
photoelectric interaction, also contributes a small number of events to the full-energy peak.
The Compton interaction is a pure, kinematic collision between a gamma-ray photon and what might be
termed a free electron in the NaI(Tl) crystal. By this process, the incident gamma-ray photon gives up only
part of its energy to the electron as it bounces off the free electron. The recoiling electron loses energy by
causing ionization as it travels through the crystal. Thus the number of visible photons in the resulting
scintillation is proportional to the recoil energy of the Compton electron. The amount of energy transferred
from the gamma-ray photon to the recoiling electron depends on whether the collision is head-on or
glancing. For a head-on collision, the gamma-ray transfers the maximum allowable energy for the Compton
interaction. Although it involves a photon and an electron, the interaction is similar to a billiard-ball
collision. The reduced energy of the scattered gamma-ray can be determined by solving the energy and
momentum conservation equations for the collision. The solution for these equations in terms of the
scattered gamma-ray energy can be written as:
Eγ
Eγ ' =
1+
Eγ
(1− cosθ )
m0c 2
(2)
where
Eγ' is the reduced energy of the scattered g-ray, γ', in MeV,
θ is the scattering angle for the scattered g-ray, relative to the incident g-ray,
Eγ is the energy of the incident g-ray, γ, in MeV,
m0c2 = 0.511 MeV is €
the equivalent energy of the rest mass, m0, of the electron, and
c is the speed of light.
Department of Physics
May 30, 2013
University of Missouri-Kansas City
4 of 6
For a head-on collision, the gamma-ray is scattered backwards along its initial trajectory, and θ = 180°. For
this condition, the backscattered gamma-ray energy becomes
Eγ ' =
Eγ
1+ 4 Eγ
(3)
Where the convenient approximation, (m0c2)–1 ≈ 2, has been used. (Note, for the units to work, the Eg in
the denominator is written in terms of MeV, but units are not included with the numerical value.)
€
If this backscatter event happens in the detector, the maximum energy transferred to the recoiling electron
will be
E = Eγ − Eγ '
(4)
Thus the maximum energy that can be recorded in the spectrum for a gamma-ray that interacts in the
detector by Compton scattering is given by equation (4). This defines the energy of the Compton edge in
Figures 3 and 4. For an initial gamma-ray energy of 1MeV, equations (5) and (6) predict that the Compton
edge will occur at 0.80 MeV, €
and the energy of the backscattered gamma ray will be 0.20 MeV. Because
the gamma-ray photon can be scattered through any angle from 0 to 180°, and the scattered photon can
escape the detector, the energy deposited in the detector can vary from the maximum at the Compton edge
through all values down to zero. This is the genesis of the Compton continuum in Figures 3 and 4. Find a
backscatter peak in this spectrum. It's energy plus the Compton edge energy equals the energy of the main
photopeak.
Note that there is a small, but non-zero, probability that the Compton scattered photon will be subsequently
absorbed in the crystal by the photoelectric process. This two-step interaction will generate a pulse that falls
in the full-energy peak. Compton scattering from an entirely different location causes the backscatter peak
in Figures 3 and 4. Consider a gamma ray emitted by the radioactive source in a direction heading away
from the detector. This gamma ray can encounter material in the neighborhood of the radioactive source
and undergo Compton scattering. If the scattering angle is 180° the scattered gamma ray travels back
towards the detector with an energy defined by equation (5). If this lower energy gamma ray interacts in the
scintillator by the photoelectric effect, it will contribute to a photopeak at the lower energy. Typically this
backscatter peak will be of low intensity, if there is minimal material behind the radioactive source. Usually,
the backscatter peak is rather broad, because of the range of directions that can contribute to the peak. For
initial gamma-ray energy of 1 MeV, equation (5) predicts that the backscatter peak will occur at 0.20 MeV.
Figure 2 illustrates some of the types of interactions that can take place in the NaI(Tl) detector and the
surrounding shielding material.
-----------------------------------------------------------------------------------------------------------Calculate the energy of the Compton edge for the 0.662-MeV gamma ray from 137Cs. Enter this
value in Table 1. From your plot and calibration curve, does this calculation agree with your
measured value?
b) Calculate the Compton edge energy for the 1.33-MeV gamma ray from 60Co, and enter that result
in Table 1. Is that value in agreement with your 60Co spectrum?
c) From Eq. (3) calculate the backscatter peak energies for the gamma rays from 137Cs and 60Co. Fill
in the rest of Table 1. How do your measured energies compare with the theoretical energies from
Eq. (3)?
a)
---------------------------------------------------------------------------------------------------------Energy Resolution
Department of Physics
May 30, 2013
University of Missouri-Kansas City
5 of 6
Purpose
The purpose of this part of the experiment is to measure the resolution of the NaI(Tl) detector.
Relevant Equations
The resolution of a spectrometer is a measure of its ability to resolve (i.e., separate) two peaks that are
fairly close together in energy. Fig. 3 shows the gamma spectrum that was plotted for the 137Cs source. The
resolution of the photopeak is calculated from the following equation:
R=
δE
× 100%
E
(5)
Where δE is the Full Width of the peak at Half of the Maximum count level (FWHM) measured in number
of channels, and E is the channel number at the centroid, i.e., the mid-point of the photopeak.
€
In Fig. 3 the photopeak is in channel 280 and its FWHM = 32 channels. From Eq. (5), the resolution is
calculated to be 11.5%. It is standard practice to specify the quality of the NaI(Tl) detector by stating its
measured percent resolution on the 662-keV photopeak from a 137Cs radioactive source.
The resolution of a scintillation detector depends upon several factors. Among them are:
1. number of photons per scintillation event
2. number of photons that strike the photocathode
3. number of photoelectrons released per photon hitting the photocathode
4. number of photoelectrons that strike the first dynode
5. multiplication factor of the photomultiplier tube
In general, the greater each one of the above quantities is, the better (i.e., smaller) the resolution. Factors 1
and 2 refer to properties of the scintillator while factors 3, 3, and 5 refer to the phototube. Mathematically
we say that
R = α + β / Eγ
(6)
where R is the resolution, a and b are constants referring to the scintillator and phototube respectively, and
Eg is the g-ray energy. Note that R varies inversely as
€
Eγ and thus the higher Eg is, the smaller R is.
Procedure
1. Using the same amplifier and analyzer gain settings as before, measure the g-ray spectra of 57Co
and 54Mn. Tabulate these results along with those obtained for 60Co and 137Cs.
€
2. Using the equation (5), which defines resolution, calculate the resolution for each of the g-ray
energies and put them in your table.
3.
Plot the resolution R vs.
1/ Eγ and on a second graph, R vs. Eg. Determine the parameters
alpha and beta from the plot of R vs.
1/ Eγ and equation (6). Discuss the plots that you obtained.
€
References and Acknowledgements
Sections marked with an * are from the ORTEC® Experiments in Nuclear Science, Experiment 3: Gamma€
Ray Spectroscopy Using Na(Tl) Detectors.
Department of Physics
May 30, 2013
University of Missouri-Kansas City
6 of 6