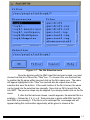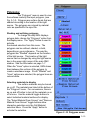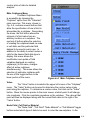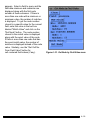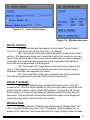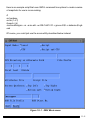
1
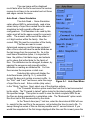
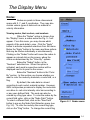
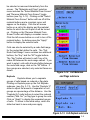
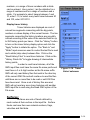
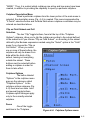
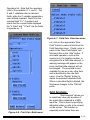
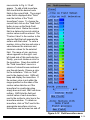
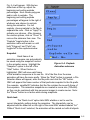
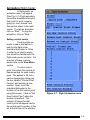
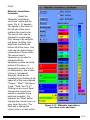
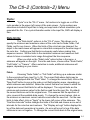
by clicking on the colored box.
Clip on field subset and cell selection
These two toggle buttons tell
GMV to draw isosurfaces based only on
data contained within some subset. For the
"Clip on Field Subset" option, the subset is
defined by the "Subset" function. The
"Subset" function is found in the Controls−2
menu. This function is explained later on in
this text. For the "Clip on Cell Selection"
option, the subset is defined by the Boolean
expression created using the "Select" option
in the "Cells" menu. Isosurfaces will then
only be drawn from node data found in the
selected cells.
GMV only checks the status of
these two buttons when an isosurface is
created. Therefore, any changes made with
these two options will not take effect until a
new isosurface is calculated.
Coloring isosurfaces with field values
The isosurfaces can be colored
with the blue−to−red intensity color of node
field values. All the isosurfaces for a specific
type (material isosurfaces or field
Figure 4−13. Isovolume menu
isosurfaces) are colored according to the
selected field values. To color the isosurfaces with field values, first select a field
with the "New Field" button, then click on the "Color Surface with Node Field"
button.
Isovolume:
The "Isovolume" option of the "Calculate" menu allows the creation of
isovolumes (the display of a volume with surfaces of which are interpolated
between the selected minimum and maximum field values). The selection of this
option creates the menu shown in Fig. 4−13.
This menu lists the current active field, and the minimum and
maximum values of this field. To add an isovolume, enter the value for the
minimum and maximum surfaces in the "Isovolume Range" areas, then select
4−15