1
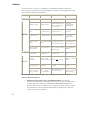
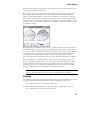
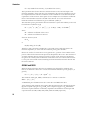
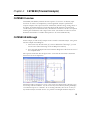
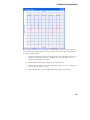
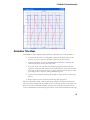
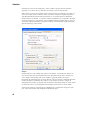
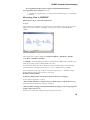
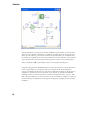
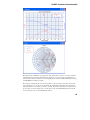
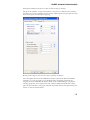
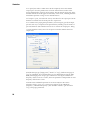
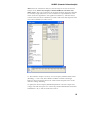
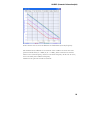
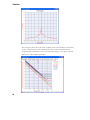
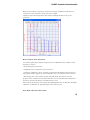
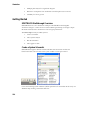
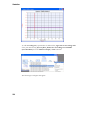
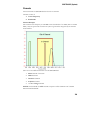
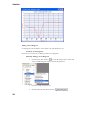
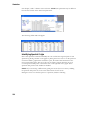
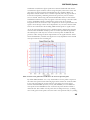
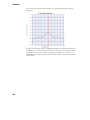
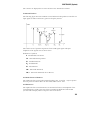
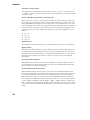
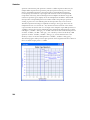
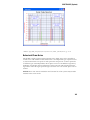
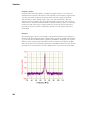
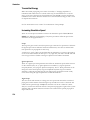
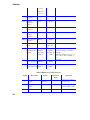
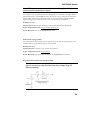
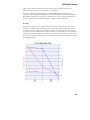
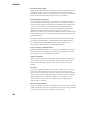
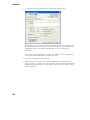
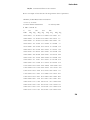
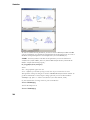
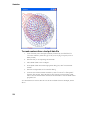
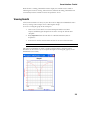
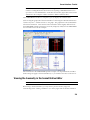
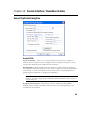
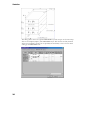
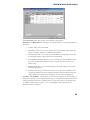
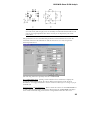
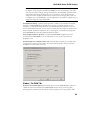
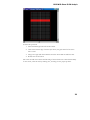
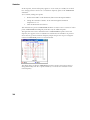
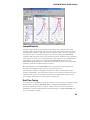
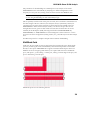
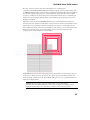
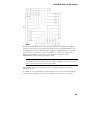
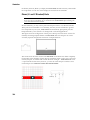
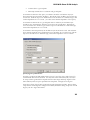
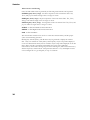
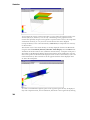
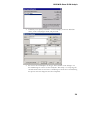
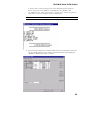
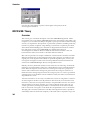
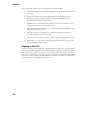
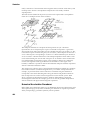
Linear Analysis
Smith Chart
In 1939, Philip H. Smith published an article describing a circular chart useful for graphing
and solving problems associated with transmission systems [36]. Although the
characteristics of transmission systems are defined by simple equations, prior to the
advent of scientific calculators and computers, evaluation of these equations was best
accomplished using graphical techniques. The Smith chart gained wide acceptance during
the development of the microwave industry. It has been applied to the solution of a wide
variety of transmission system problems, many of which are described in a book by Philip
Smith [37]. The Smith chart as displayed by GENESYS is shown in below. Labels for
normalized real and reactive components are displayed when the level of detail permits it.
The design of broadband transmission systems using the Smith chart involves graphic
constructions on the chart repeated for selected frequencies throughout the range of
interest. Although the process was a vast improvement over the use of a slide rule, it is
15