1
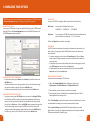
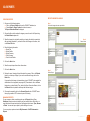
5. GENERATING GRAPHS Having connected your UT5000 and downloaded RFID data and thickness measurements, you can use CONNECT to create line or bar graphs showing thickness variations at each tagged location. To display the Thickness Gauge Graph Generator, click on the RFID Data Tracking button on the dashboard. SELECTING THE TAG Select the alias of the required tag from the Location (RFID Tag) dropdown list. TAG DATA CONNECT displays the following information: First Reading - date of the first thickness reading at the tag’s location Last Reading - date of the most recent thickness reading at the tag’s location Max Reading - high thickness alarm setting Min Reading - low thickness alarm setting You can also scroll through a list of all the recorded measurements. To save the raw data for the selected tag, click on the Export Data to CSV button. EDITING THE GRAPH You can adjust various features of the displayed graph: X-Axis Range By default, CONNECT shows all the recorded data. You can adjust the displayed range by changing the Start Date and End Date values. Click on the Update Graph button to apply the new settings. Foreground/Background Colours The foreground consists of the lines/bars and X-axis ticks and labels; the background is the graph area. CONNECT’s default palette uses a black foreground with an off-white background. Use the Foreground Colour and Background Colour list boxes to choose from: Orange, White, Off White, Pale Blue, Pale Green, Beige, Pale Grey, Dark Grey, Navy Blue, Dark Green or Black. Changes to the colour palette are applied automatically. Note. The Max/Min alarm settings and graph annotations are displayed in red and axis labels and notes in black. These colours cannot be changed. Units Use the Units list box to choose whether CONNECT displays thickness measurements in millimetres or inches. Line/Bar/3D Bar Use the option buttons to change the type of graph you want to display. SAVING THE GRAPH Click on the Save Graph button to store it as an image in one of CONNECT’s image libraries. Choose an existing library or type a name for a new library. You can edit the image and add annotations (see page 11) and use it in reports (see page 12). 6 Ref. ID 4000, Rev. A 7