1
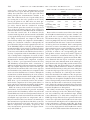
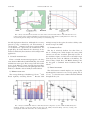
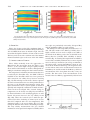
Article (refereed) – Published version
Balfour, C.A.; Howarth, M.J.; Jones, D.S.; Doyle, T.. 2013 The Design and
Development of an Irish Sea Passenger-Ferry-Based Oceanographic Measurement
System. Journal of Atmospheric and Oceanic Technology, 30 (6). 1226-1239.
10.1175/JTECH-D-12-00223.1
This version available at http://nora.nerc.ac.uk/502703/
NERC has developed NORA to enable users to access research outputs
wholly or partially funded by NERC. Copyright and other rights for material
on this site are retained by the rights owners. Users should read the terms
and conditions of use of this material at
http://nora.nerc.ac.uk/policies.html#access
© Copyright 2013 American Meteorological Society (AMS).
Permission to use figures, tables, and brief excerpts from this work
in scientific and educational works is hereby granted provided that
the source is acknowledged. Any use of material in this work that is
determined to be “fair use” under Section 107 of the U.S. Copyright
Act September 2010 Page 2 or that satisfies the conditions
specified in Section 108 of the U.S. Copyright Act (17 USC §108, as
revised by P.L. 94-553) does not require the AMS’s permission.
Republication, systematic reproduction, posting in electronic form,
such as on a web site or in a searchable database, or other uses of
this material, except as exempted by the above statement, requires
written permission or a license from the AMS. Additional details are
provided in the AMS Copyright Policy, available on the AMS Web
site located at (http://www.ametsoc.org/) or from the AMS at 617227-2425 or [email protected].
Contact NOC NORA team at
[email protected]
The NERC and NOC trademarks and logos (‘the Trademarks’) are registered trademarks of NERC in the UK and other
countries, and may not be used without the prior written consent of the Trademark owner.
1226
JOURNAL OF ATMOSPHERIC AND OCEANIC TECHNOLOGY
VOLUME 30
The Design and Development of an Irish Sea Passenger-Ferry-Based Oceanographic
Measurement System
C. A. BALFOUR, M. J. HOWARTH, D. S. JONES, AND T. DOYLE
National Oceanography Centre, Liverpool, United Kingdom
(Manuscript received 12 October 2012, in final form 6 December 2012)
ABSTRACT
An evolving coastal observatory has been hosted by the National Oceanography Centre at Liverpool,
United Kingdom, for more than nine years. Within this observatory an instrumented ferry system has been
developed and operated to provide near-surface scientific measurements of the Irish Sea. Passenger vessels
such as ferries have the potential to be used as cost-effective platforms for gathering high-resolution regular
measurements of the properties of near-surface water along their routes. They are able to operate on an
almost year-round basis, and they usually have a high tolerance to adverse weather conditions. Examples of
the application of instrumented ferry systems include environmental monitoring, the generation of long-term
measurement time series, the provision of information for predictive model validation, and data for model
assimilation purposes.
This paper discusses the development of an engineering system installed on board an Irish Sea passenger
ferry. Particular attention is paid to explaining the engineering development required to achieve a robust,
automated measuring system that is suitable for long-term continuous operation. The ferry, operating daily
between Birkenhead and Belfast or Dublin, United Kingdom, was instrumented between December 2003 and
January 2011 when the route was closed. Measurements were recorded at a nominal interval of 100 m and
real-time data were transmitted every 15 min. The quality of the data was assessed. The spatial and temporal
variability of the temperature and salinity fields are investigated as the ferry crosses a variety of shelf sea and
coastal water column types.
1. Introduction
The exploitation of regularly scheduled commercial
vessels to gather scientific measurements is a technique
that has been increasing in popularity for some time
(Hydes et al. 2009; Petersen et al. 2011; Grayek et al.
2010; Buzzelli et al. 2003). The basic premise is to install
scientific instrumentation on board a commercial seagoing vessel to automatically gather information such as
seawater quality measurements for the waters through
which the vessel sails. This approach can represent a costeffective mechanism for scientific studies by the exploitation of regularly scheduled vessels of opportunity.
Under the European Union’s (EU) fifth framework
(contract EVK2–2002–00144) funding was received
from 2002 to 2005 by the National Oceanography Centre (NOC) in Liverpool to install instrumentation on
Corresponding author address: Dr. Christopher Balfour, National Oceanography Centre, 3 Brownlow St., Liverpool L3 5DA,
United Kingdom.
E-mail: [email protected]
DOI: 10.1175/JTECH-D-12-00223.1
board an Irish Sea passenger vessel to form what is
commonly referred to as a FerryBox. The general objective was to gather long-term oceanographic measurements to complement a suite of Irish Sea measurement
and modeling systems. This was used to form a coastal
observatory (Howarth and Palmer 2011) that represented a national capability for U.K. science (http://noc.
ac.uk/ocean-watch/about). A key feature of the Irish Sea
FerryBox was the ability to use regular sailings to gather
measurements on an almost daily year-round basis.
Passenger vessels tend to have a higher tolerance to
adverse weather conditions than smaller survey vessels.
This subsequently offers an opportunity to gather measurements across complete transects of the Irish Sea that
would be difficult or expensive to accomplish by other
means. Potential limitations of this approach are that
ferries tend to follow fixed routes and usually only nearsurface measurements can be generated. This results
in datasets that usually have excellent temporal resolution with only a limited spatial resolution.
In the early stages of the project commissioning, a
bespoke in-house-designed system was selected because
JUNE 2013
BALFOUR ET AL.
of the prohibitive cost of the commercial systems that
existed at that time (Englander 2009; Petersen et al.
2003). There are many engineering challenges to overcome to develop a reliable and robust FerryBox system.
The key scientific requirements were for measurements
every 100 m, a near-real-time data transfer capability,
and regular ferry-based sensor calibration verification.
The basis of this is that the ferry is required to resolve
frontal gradients, for which a horizontal resolution of
100 m is sufficient. This requirement resulted in the selection of an instrumentation sampling rate of 10 s for
a typical ferry speed of 20 kt. This represents an appropriate choice for the sampling rate that is well within
the capabilities of the instrumentation used.
Problems to be addressed when implementing the
FerryBox include a potentially unreliable external
power source in the ferry, electrical interference from
the ship’s systems, and reliable long-distance data
communications between instrumentation in the engine
room and a data management system in the bridge of the
ferry. Sedimentary and biological fouling of the scientific sensors used also represented a potential source of
data quality limitations. This paper discusses the techniques applied to design such a system and the key scientific measurements the FerryBox has been used to
generate.
After an introductory section, this paper provides
a review of the instrumentation and supporting engineering infrastructure system design. Details of the
telemetry system are provided before the sensor evaluation, development, and scientific results are presented.
The paper concludes with a review of the sensor system
results and achievements along with a series of suggested additional applications.
2. Instrumentation system development
The close proximity of the 12 Quays ferry terminal at
Birkenhead, United Kingdom, to the NOC Liverpool
laboratory made this facility a suitable choice for
implementing an Irish Sea FerryBox. Initially, Norse
Merchant Ferries, then Norfolkline, and then DFDS
Seaways operated a fleet of four cargo and passenger
vessels. Two vessels sailed between Birkenhead and
Belfast, in the United Kingdom. The other vessels sailed
between Birkenhead and Dublin in the Republic of
Ireland (Fig. 8a) until the closure of these routes in
January 2011. One of these vessels, the M/V Liverpool
Seaways, had the FerryBox installed. This ship provided
oceanographic measurements during sailings between
Birkenhead and Dublin twice daily from Tuesday to
Saturday, with single sailings on Sunday and Monday. A
crossing of the Irish Sea normally required approximately
1227
7 h for completion. Ferry measurements were an important component of a coastal observatory that complimented other measurements taken via ship-based
survey grids, instrumented moorings, surface buoys,
coastal tide gauges, satellite sensing, and autonomous
underwater gliders.
The oceanographic instrumentation fitted on board
the ferry was composed of two main components. First,
there was a sensor system fitted in the engine room that
was located approximately 3 m away from the main
seawater inlet and water storage chest to the ferry that
was used for engine cooling purposes. This cooling water
was pumped from an inlet in the ferry hull. The inlet was
at a nominal water depth of approximately 3 m below
the sea surface during sailings. A proportion of this
cooling water was subsequently pumped through a pressure vessel in the ferry engine room that contained a series of oceanographic sensors. The flow rate through
the pressure vessel was relatively high with a refresh of
the chamber water occurring typically every 20–30 s. The
measured parameters were composed of seawater conductivity, temperature, pressure, derived salinity, dissolved oxygen concentration, optical backscatter (OBS)
turbidity, and chlorophyll a concentration. A satellitebased telemetry system was included that allowed a subset of the ferry-based measurements to be available in
near–real time during sailings. A 2-week service interval
was used that involved exchanging the instrumentation in
the engine room for a replacement set of instruments that
have recently been cleaned, serviced, and calibration
checked. During servicing, a visit was also made to the
bridge of the ferry that hosted the second key set of instrumentation for the FerryBox. This was basically
composed of a data recorder, a GPS receiver, and a satellite data telemetry modem. The service visit to the
bridge of the ferry was primarily to copy the stored
oceanographic data that had been recorded by a custom
real-time datalogger and to check the instrumentation
system status. Following the service visit, the recovered
instrumentation was returned to the NOC laboratories
for data downloading, servicing, and calibration testing.
In addition to this, a buoy in the Liverpool Bay with
a similar instrumentation package that was regularly
serviced by a different institute was used for scientific
measurement comparison. This assisted with the process
of FerryBox sensor calibration between instrumentation
service visits to the ferry.
There are many potential problems with installing
sensitive instrumentation electronics in a large passenger vessel. The design of the FerryBox instrumentation
has paid careful attention to addressing any difficulties
that may arise with interference and electromagnetic
compatibility (EMC; Horowitz and Hill 1993; Chatterton
1228
JOURNAL OF ATMOSPHERIC AND OCEANIC TECHNOLOGY
VOLUME 30
TABLE 1. FerryBox instrumentation.
Sensor type
Conductivity (shielded inductive) (NXIC)
Temperature (aged thermistor)
Pressure (micromachined silicon)
Chlorophyll a
Turbidity (OBS with mechanical wiper)
Dissolved oxygen
Supplier
Teledyne
Teledyne
Teledyne
Chelsea
Seapoint
Aanderaa
Range
21
0–9 S m
258 to 1358C
0–200 m
0–100 mg L21
0–25 FTU
0–500 mM L21 or
0%–140%
Accuracy
60.0009
60.005
0.05%*
62%
62%
,5%
* Percentage of full scale.
and Houlden 1991). This has helped to ensure reliable
operation when delicate, precision oceanographic sensors are placed in close proximity to possible sources of
interference, such as the various ship-based power and
instrumentation systems. A detailed list of the instrumentation installed in the engine room is provided
in Table 1. At the heart of the engine room instrumentation
was an autonomously logging Teledyne Citadel NXIC
CTD (Teledyne RD Instruments 2010). A series of
auxiliary sensors were also connected to the CTD to
supplement the recorded parameters. The CTD was
configured to internally record a backup of the sensor
readings at 10-s intervals and to broadcast these data in
real time via a serial interface. Labeled photographs of
the instrumentation frame and the pressure vessel enclosure are shown (Fig. 1). To the left-hand side of the
pressure vessel, an electrically actuated valve was used
to control the water flow through the inlet to the
FerryBox pressure vessel. Water exiting the pressure
vessel traveled through a nonreturn flow valve and an
overboard drain.
In addition to the instrumentation listed in Table 1,
a mechanical wiper (Zebra Technologies Ltd. 2010) has
been installed. The function of this Hydro-Wiper was to
provide automated mechanical cleaning for the Seapoint OBS sensor (Seapoint Sensors Inc. 2001) at 2-h
intervals. This served to discourage the onset of sedimentary and biological fouling of the sensor optical face,
allowing the measurement quality of this sensor to be
sustained. Instrumentation electronics provided a batterybacked power source and reliable data communications
over a distance of approximately 100 m. This was required to communicate with the instrumentation system that was installed in the bridge of the ferry, in close
FIG. 1. Engine room instrumentation photographs of (a) the sensor frame and (b) the pressure vessel, which
incorporates the instrumentation frame.
JUNE 2013
BALFOUR ET AL.
1229
FIG. 3. Bridge data communications and electronics.
FIG. 2. Robust engine room to bridge data communications.
proximity to some externally mounted antennas. The
functional diagram (Fig. 2) indicates how a robust mechanism for data communications has been implemented.
In general the external power supply generated by the
ship can be subject to interference and interruption. A
commercial electrical mains filter with an in-line earth
inductor was used to suppress electrical noise in the shipgenerated alternating current (ac) supply that drives the
FerryBox electronics. A battery-backed, electrically isolated direct current (dc) supply was then used to power
the marine sensors inside a pressure vessel using a waterproof cable feed. The battery backup used provided
sufficient power to maintain the instrumentation operation in the event of an external power failure for durations of up to approximately two days. This was used
to sustain the operation of the system during periods of
routine maintenance of the ferry that may involve prolonged interruptions to the external power supply in the
engine room. All of the dc power lines used within the
instrumentation system implemented independent fuses
for electrical safety purposes. An external RS232 serial
connector was located via a short connection approximately 2 m in length close to the pressure vessel. This
allowed local monitoring and configuration of the in situ
CTD in addition to communications with the bridge
instrumentation. A commercial data converter (B&B
Electronics 2012) was used to provide optical isolation
for the category 5 (American National Standards Institute 2001) shielded twisted pair data cable that
was used for the 100-m-long data link. This ensured that
the bridge instrumentation was electrically separate
from the engine room instrumentation. The RS422 side
of the data converter was powered by an electrically
isolated dc power supply. The differential RS422
standard (American National Standards Institute 2005)
was selected for its ability to implement long-distance
(.1000 m) point-to-point data connections with a high
degree of tolerance of electrical interference. The ship’s
earth was also electrically separate from the instrumentation common connection to eliminate this as a
potential source of interference and EMC problems. A
series of EMC filters (Montrose 1999) were added to the
main power and data lines. These were primarily composed of torus-shaped ferrites installed around power
and data cables to improve electrical interference rejection. These design features and characteristics have
served to implement a robust power supply and data
communications link.
In a similar manner to the engine room electronics,
a filtered external mains supply was used to power the
bridge systems (Fig. 3). An optically isolated data converter communicated with the engine room electronics.
An electrically isolated dc power supply drives the instrumentation electronics with a standby rechargeable
battery. This provided the capability to power the various systems for up to approximately half a day if an interruption in the externally generated ac power occurs.
This reduced-capacity backup was primarily due to
space constraints and proved to be sufficient for this
application. A GPS recorder (Laipac Technology Inc.
2007) provided a series of internal records of positional
and accurate time recordings in addition to generating
a stream of RS232-based GPS readings at 1-s intervals.
A low-Earth-orbit satellite communications data modem (Digi International 2009) sampled instrumentation
data arriving from the engine room and added a GPS
positional fix in addition to an accurate time reference.
This information was then transferred at a nominal time
interval of 15 min to a land-based downlink. The telemetry modem incorporated an independent GPS receiver that also provided redundancy for the transfer of
positional information at 15-min intervals in the event of
a failure of the main GPS receiver. A series of coaxial
1230
JOURNAL OF ATMOSPHERIC AND OCEANIC TECHNOLOGY
leads were installed to connect the GPS receiver and
telemetry modem to the required external antennas on
the upper deck of the ferry using weatherproof bulkhead
couplings.
A key component of the FerryBox system and the
bridge-based electronics was a small computer system
that undertook such functions as data logging, FerryBox
water flow valve control, and GPS data processing. A
Persistor Instruments CF2 embedded processor system
(Persistor Instruments Inc. 2005) was used to decode the
engine room instrumentation data and RS232-based
serial GPS fix information. The primary function of the
Persistor unit was the generation of an American Standard Code for Information Interchange (ASCII) text
record of the complete set of oceanographic measurements in engineering units in real time. These recorded
data included a GPS-derived position, an accurate time
reference, and the derived 1978 Practical Salinity Scale
(PSS-78) salinity. The data record was stored in a removable flash memory card. Temporary removal of this
card allowed the downloading of a copy of the recorded
scientific measurement data during service visits to the
ferry. In a similar manner to the engine room electronics
features such as EMC filters, power line fuses and electrical isolation were added to construct a system with a
high degree of tolerance to possible electrical interference from the various ship systems. A series of RS232
connectors were included to allow monitoring and interrogation of the received engine room data, GPS positional information, telemetry modem status, and the
Persistor embedded control computer unit operation.
Custom software was developed for the Persistor data
recorder for the FerryBox application. A simplified
overview of the software operation (Fig. 4) was that
every 10 s the sensor data broadcast from the engine
room prompted processing by the data recorder software. This information was decoded in real time into
engineering units and the latest GPS fix data were
added. The GPS data were extracted by parsing a serial
NMEA 0183 (National Marine Electronics Association
2002) sequence of strings from the GPS recorder. GPS
data decoding was achieved using the Persistor computer
during the time available between measurements arriving
from the engine room. The complete decoded GPS-derived accurate time, latitude, longitude, and the decoded
CTD data were then stored in a removable flash memory
card inside the Persistor computer as ASCII text in real
time. At the end of this process, a test was then made to
determine if a number of predefined GPS control
boundaries had been reached. If this occurred, then an
appropriate valve control signal was generated. This
ensured that when the ferry was close to port, the
FerryBox water pressure chamber flow control valve
VOLUME 30
FIG. 4. Simplified schematic of the Persistor CF2–based data
decoding and recording software operation.
operated correctly and measurements were temporarily
suspended. When the data decoding and valve boundary
testing were complete, the Persistor computer then resumed decoding the latest GPS fix data at 1-s intervals.
The storing of this information to internal memory ensured that an up-to-date ship position and accurate time
reference were available in the Persistor computer.
Each of the Birkenhead, Dublin, and Belfast ports
the ferry can visit has two GPS-derived boundaries
predefined within the Persistor computer. An inner
boundary was defined at a specified distance from the
ship’s mooring location in port of typically 1 km. An
outer boundary was then defined at a farther distance
away from the port-based mooring location that was
usually in the order of several hundred meters. A GPS
boundary with hysteresis was implemented such that
when the ship crossed the inner port boundary, the instrumentation chamber water flow control valve in the
engine room was closed. This was required to stop
heavily turbid waters in the river Mersey, particularly
when the ship was close to the Birkenhead port berth,
from fouling the instrumentation. When the ship left
port, the outer GPS boundary needed to be crossed to
allow the instrumentation chamber water flow control
valve to open again. This dual boundary technique introduces backlash that prevents the possibility of the
control valve from being rapidly switched as a boundary
was crossed due to the possible variation of practically
derived GPS information. The GPS boundaries for the
JUNE 2013
BALFOUR ET AL.
1231
Birkenhead port were extended to approximately 2 km
to limit the effect fouling. A watchdog time-out feature
was added to the Persistor CF2 software such that if
external interference causes the Persistor CF2 computer
to stop operating correctly, then after a predefined time
of approximately 20 s the computer will be automatically reset. Once this has occurred, normal data recording and valve control operations will be resumed.
The result of this was to implement robust, reliable scientific data recording with integrated instrumentation
chamber water flow valve control.
3. Marine data telemetry
An important requirement was for the FerryBox to be
able to transfer measurement data in near–real time. This
information allowed the performance of the FerryBox
sensors to be closely monitored in addition to providing
the latest scientific measurements for publication. If a
problem was identified with the FerryBox measurements using the near-real-time data, then this could be
dealt with outside of the normal 2-week service schedule. This helped to sustain the quality controlled scientific output from the FerryBox. Norse Merchant Ferries,
Norfolkline, and then latterly DFDS Seaways Irish Sea
ferries did not have Internet connectivity during sailings.
The limited range of shore-based services, such as radio
frequency communications and mobile or cellular telephones, prompted the choice of low-Earth-orbit satellites.
This approach implemented a near-real-time marine data
telemetry system that could operate during the full Irish
Sea transects of the ferry.
The satellite service selected allowed small volumes of
data in the order of several tens of bytes to be transferred
using the very high frequency (VHF) band. A specialist
data modem was required for wireless data transfer from
the ferry via satellite to a ground-based satellite communications station with Internet access. As one of the
Orbcomm (Orbcomm 2001) low-Earth-orbit satellites
passed within range of the ferry-based data modem, twoway communications with the satellite could be established from the ferry using a radio frequency data link.
The m100 (Digi International 2009) satellite modem
was selected for the FerryBox. This modem required
significant adaptation to be used for marine data telemetry applications. Custom electronics and bespoke
modem software were developed to allow the m100 to
be connected to and process the serial data broadcast in
real time from the engine room of the ferry. These data
were decoded, compressed to binary, a GPS time and
positional measurement were added from the m100 GPS
receiver, and then the message was queued for transfer.
A series of empirical trials was then conducted to
FIG. 5. Near-real-time ferry data transfer latency from 5 to 11 Jan
2010. Fitted curve indicates the general message latency times in
the range of 20–30 min.
determine the preferred antenna arrangement and data
transfer rates to be used (Balfour 2012).
The actual near-real-time data transfer follows a
complex path from measurement to decoding. The sequence basically comprises instrumentation measurement data from the engine room being received in the
bridge and subsequently checked for integrity. These
data were decoded into engineering units and then range
tested. If these tests are passed and the data fall within
the ranges expected of the originating sensors, then the
measurements were queued for transmission to a satellite using the m100 modem in the bridge electronics
enclosure. As soon as a satellite passes within range of
the ferry-based satellite modem, the measurement data
were transferred to a ground-based communications
station when the satellite network had the capacity to
do so. The data received by a ground-based satellite
downlink were then transferred using e-mail via the
Internet to an account hosted by the NOC laboratory.
This e-mail account was interrogated every 20 min using
an automated-computer-based script. After a series of
data validation tests, if the format of the data was correct,
then the latest near-real-time ferry measurements were
entered into a database. These data were available for
download and published using the NOC Coastal Observatory Internet site (http://cobs.pol.ac.uk/cobs/ferries/).
Variable message latencies were introduced during
this process (Fig. 5). The limited number of satellites in
the Orbcomm constellation and the use of communication frequencies similar to ship- and land-based systems
can introduce near-real-time data transfer delays. Any
problems that occur with the NOC information technology (IT) infrastructure can also introduce measurement
data reception delays. Occasional latencies of several
hours for near-real-time data transfer can occur (Fig. 5).
1232
JOURNAL OF ATMOSPHERIC AND OCEANIC TECHNOLOGY
VOLUME 30
FIG. 6. NXIC CTD sedimentary fouling salinity measurement decay: (a) FSI salinity measurement decay between
service visits and (b) expanded view of the FSI salinity decay profile.
However, the general near-real-time data transfer latency
tends to be on the order of approximately 20–30 min,
as indicated by the fitted curve (Fig. 5). Despite the limitations of Orbcomm, the comparatively low cost of the
service against other satellite-based telemetry options
resulted in the choice of this system. The latencies introduced, while undesirable, were considered to be satisfactory for the purpose of FerryBox near-real-time
performance monitoring and measurement data transfer.
4. Sensor operation, scientific measurements, and
data analysis
This section reviews the performance of the sensors
that were incorporated in or trialed in the FerryBox
before presenting some of the key scientific measurements undertaken by the system. A long-term problem
with measurements undertaken in the Irish Sea and
Liverpool Bay is that of progressive sensor fouling and
subsequent loss of measurement quality. While biological fouling of sensors almost inevitably occurs over
time, a particularly acute problem has been the effect of
sedimentation. Suspended matter, particularly in the
highly turbid waters of the river Mersey and Liverpool
Bay, caused progressive fouling of the oceanographic
instrumentation as seawater was pumped through the
FerryBox instrumentation chamber. This frequently resulted in reductions in scientific measurement quality.
This problem has primarily affected the measurement of
seawater salinity and chlorophyll fluorescence, as reported previously (Balfour et al. 2007).
a. Oceanographic sensor performance evaluation
Throughout the lifetime of the FerryBox, there has
been an ongoing process in operation to evaluate the
performance of oceanographic sensors that are used
in the demanding coastal areas required by the NOC
Coastal Observatory. Previous studies had found a potential robustness of conductivity measurement advantage of the Teledyne Citadel nonexternal inductive cell
(NXIC) CTD (Teledyne RD Instruments 2010), formerly referred to as a Falmouth Scientific, Inc., (FSI)
CTD, when compared to a Sea-Bird CTD (Sea-Bird
Electronics Inc. 2007) for this application. Sea-Bird
CTDs use an electrode-based conductivity measurement cell with a comparatively smaller geometry. This
had a tendency to rapidly foul with sediment deposits
when used in the Irish Sea FerryBox. In contrast to this,
the Citadel CTD uses a larger geometry-shielded inductive conductivity cell that exhibited a more robust
measurement in the Irish Sea FerryBox. Following the
installation of this type of sensor in the FerryBox, it has
transpired that salinity measurement drift still occurs in
response to sedimentary fouling, albeit to a lesser degree
than previously observed with the Sea-Bird instrumentation. The NXIC CTD salinity plots (Fig. 6) for
data collected during 2007 show a step change in the
measurement after a service visit. This serves to illustrate the problem of instrumentation fouling. The plots
(Figs. 6a and 6b) show a roll off of measured salinity
between service visits to the FerryBox to exchange the
sensors in the engine room. The measured value recovers after the service visit before a progressive value
underestimate occurs again during the sensor set deployment. Clearly, any measurement error is undesirable, and the first step taken to address this problem was
to install a valve to stop the FerryBox chamber water
flow when the ferry was close to port. This was to suspend the measurements while the ship was in highly
turbid and disturbed near-shore waters. The penalty for
this was to interrupt the measurements when the valve
was closed. The plot (Fig. 7a) shows changes in the peak
salinity measurement per crossing. The peak salinity
value occurs as the ferry crosses the Irish Sea between
JUNE 2013
BALFOUR ET AL.
1233
FIG. 7. Effect of the water flow control valve and
subsequent ferry-to-SmartBuoy measurement comparisons within a 2-km range: (a) valve-based sensor contamination reduction, where blue denotes the peak salinity
value without the valve operating and red denotes the peak
salinity value with the valve operating; (b) buoy–ferry salinity measurement comparison; (c) temperature; (d) turbidity; and (e) dissolved oxygen concentration.
Anglesey and Dublin. The peak salinity value does not
vary significantly in the short term and thus can be used
to assess the effect of the valve. The remainder of the
plots (Figs. 7b–e) compare ferry measurements with the
regularly serviced Centre for Environment, Fisheries
and Aquaculture Science (CEFAS) SmartBuoy (Mills
et al. 2005) in Liverpool Bay, which is located at 538320 N,
3821.80 W, when the ferry was at a distance of approximately 2 km from the buoy. This represented the closest
distance that the ferry regularly passed the buoy. The
maximum time difference of the ferry from the buoy at
2 km was 15 min, with the ferry passing north or south
of the buoy. While the tidal currents are rectilinear approximately east–west and the salinity gradient is east–
west, differences resulting from a maximum separation
of up to 15 min were small, as shown by the temperature
and salinity standard deviations (Table 2).
The peak salinity reduction per crossing (Fig. 7a) for
a particular set of instrumentation illustrates the fouling
problem. The red points were generated when the
1234
JOURNAL OF ATMOSPHERIC AND OCEANIC TECHNOLOGY
control valve closed off the instrumentation system
water flow close to port. The blue points show the peak
salinity decay when the valve is left open, with water
flowing through the instrumentation chamber at all
times. The reduction in the rate of peak salinity decay
per crossing due to the valve operation can be clearly
seen by the points in red. This effect was more pronounced if routine service visits were missed and a longer service interval than the standard 24 crossings
occurred. Based upon these results, the average rate of
decay of the peak salinity value per ferry crossing was
reduced from 0.019 to 0.009 PSU with the inclusion of
the water flow control valve. If an allowance for the
seawater intake lags in the system was made and the FSI
average peak salinity decay correction was applied, then
the salinity measurement was improved. When the
corrected ferry salinity was compared to the SmartBuoy
salinity, the correlation coefficient r subsequently improved from the 0.19 previously reported before the use
of the FSI NXIC CTDs to 0.91 (Fig. 7b). Temperature
measurement (Fig. 7c) in contrast to salinity has always
proved to be robust. For the temperature measurements,
a sensor was not installed at the hull-based water inlet to
the ferry. Comparisons with the SmartBuoy show that
only a small parasitic temperature elevation of 0.168C
occurred as the water was pumped through the FerryBox
instrumentation chamber. The comparison scatterplot
(Fig. 7c) shows a good agreement between the ferry
and SmartBuoy measurements, with a correlation coefficient of 0.99 achieved. For measurements of turbidity
(Fig. 7d), a higher dispersion was observed in this optically derived measurement. The same sensor type was
used for both the ferry and the buoy for comparison. The
exact reason for this difference is unclear, although the
measurement could be disturbed by the route seawater
takes before being measured in the FerryBox. Dissolved
oxygen concentration measurements (Fig. 7e) (Panton
2012) show a good correlation between the measurements for the comparison of 277 data points. There is a
lower value that is consistently measured in the FerryBox,
although the same sensor is used by the SmartBuoy.
While the accuracy of the sensors is listed in Table 1,
uncertainties associated with the practical measuring
systems used in the SmartBuoy and the ferry will result
in small differences in the measured parameters between
each system. In coastal environments the achievable and
meaningful target precisions for temperature and salinity measurements have been shown to be much larger
than manufacturer specifications. Realistic accuracies
have been demonstrated as in the order 0.18C and 0.1
PSU for temperature and salinity, respectively. The
ferry measurements presented in this paper demonstrate this (Table 2).
VOLUME 30
TABLE 2. FerryBox to SmartBuoy measurement comparison
statistics.
Mean
Std dev
No. of
difference
of the
data
(ferry 2 buoy) difference points
Figure and
measurement
Corr
coef r
7b salinity (PSU)
7c temperature
(8C)
7d turbidity (FTU)
7e dissolved
oxygen (mg L21)
0.91
0.998
20.01
0.16
0.27
0.24
1373
1409
0.69
0.95
3.09
21.59
4.17
0.51
1147
277
Between the near-surface-water inlet to the ferry and
the FerryBox instrumentation pressure chamber, the
pipe work and a seawater storage chest introduced a
measurement time lag. A delay existed between when
water was pumped into the ferry and when the scientific
measurements from this water occurred. An estimation
of this lag has been determined. This is subsequently
taken into account to determine the position that a set
of measurements were recorded. During ferry transects
(Fig. 8a) the engine cooling water inlet pump, with a
peak flow of 1000 m3, the corresponding pipe work,
and an inline seawater storage chest with a capacity of
300 m3 introduced a measurement time lag. The eastbound and westbound ferry spatial measurement differences illustrated this time lag for consecutive crossings
along the same route. Measurement of the salinity gradients between the Liverpool Bay and the mouth of the
river Mersey (Fig. 8b) allowed this lag to be estimated.
The salinity gradient differences between consecutive
inward and outward ferry crossing were used, taking into
account the ship’s speed. For an average of consecutive
crossings, an estimation of a 5-min lag in the measurements was determined. In addition to this, the pressure
reading from the CTD was used as a proxy for variations
in the flow rate through the FerryBox from the nominal
values. Changes in this pressure indicated seawater inlet
flow rate alterations due to such factors as ferry maintenance. Unless the anticipated nominal values of pressure
were measured in the instrumentation chamber, the data
from the FerryBox were disregarded.
The salinity measurement comparison (Fig. 9) illustrates the advantages of the Alec Electronics temperature and conductivity with mechanical wiper (CTW)
sensor (Horiuchi et al. 2010) when compared to the
NXIC-type design. These data were generated when the
sensors were operated in the FerryBox at the same time
in coastal waters with high levels of sedimentation. The
sensor performance evaluation graph (Fig. 9a) shows
a roll off of the measured salinity with the NXIC CTD
over a 27-day deployment in the FerryBox. In contrast
to this, the Alec CTW sustained the measurement over
JUNE 2013
BALFOUR ET AL.
1235
FIG. 8. Ferry eastbound and westbound consecutive transect measurements. Blue is eastbound and red is westbound. (a) Ferry transect with the SmartBuoy position in the Liverpool Bay marked. (b) Expanded view of the ferry
measurement gradient change in the Liverpool Bay area, illustrating a lag.
the full deployment duration. Although the accuracy
quoted by Alec conductivity cell measurement is
60.05 mS cm21 compared to the more accurate NXIC
of 60.009 mS cm21 quoted by the manufacturer, the
graphs (Fig. 9) clearly illustrate the advantage of mechanical conductivity measurement cell cleaning for this
application.
b. Scientific measurements
From a scientific measurement perspective, the ferry
route between Birkenhead and Dublin (Fig. 8a) crossed
six different water types. These range from the fresher
water of the Mersey estuary, through Liverpool Bay,
past Anglesey, and then across the principal axis of the
Irish Sea to Dublin, and are briefly described below.
1) MERSEY ESTUARY
The average discharge of the Mersey is 72 m s23, with
floods regularly exceeding 500 m s23. Because tidal
mixing is strong in the region, the surface salinity at the
mouth averages 28.5 PSU.
2) LIVERPOOL BAY
The bay is relatively shallow, less than 50 m, so
this is a mixing zone, which despite the strong tidal
currents can become stratified, primarily because of
the freshwater input, on tidal and occasionally longer
(few days) time scales. In addition to the Mersey, the
rivers Conwy, Clwyd, Dee, and Ribble discharge into
the bay with a combined mean freshwater flux of
230 m s23.
3) NEAR ANGLESEY
The tidal currents around Anglesey are strong (the
maximum tidal current for an average spring tide is
1.7 m s21), so that the water column remains well mixed
throughout the year.
FIG. 9. Ferry-based FSI CTD and Alec CTW measurement comparison: (a) Alec CTW and FSI salinity measurements showing a progressive FSI roll off in the peak salinity measured during each ferry crossing, and
(b) magnitude and form of the FSI to Alec salinity difference.
1236
JOURNAL OF ATMOSPHERIC AND OCEANIC TECHNOLOGY
VOLUME 30
FIG. 10. Temperature and salinity measurements. The missing sections represent the times when maintenance was
being undertaken to the ferry or the FerryBox measurement system. (a) FSI temperature measurements, and (b) FSI
salinity measurements.
4) IRISH SEA
This is the deepest section (the maximum depth exceeds 100 m) and has the maximum salinity (in the range
33.8–34.8 PSU) from water of Atlantic origin, since the
mean flow through the Irish Sea is from south to north.
The ferry track crosses the southern end of the summer
thermal stratified region to the west of the Isle of Man.
5) APPROACHES TO DUBLIN
These differ markedly from the approaches to
Birkenhead. The mean flow from the Liffey is less
(14 m3 s21), the water depth is deeper, rapidly reaching
50 m, and the tidal currents are weaker, subsequently resulting in a freshwater mixing zone that is much narrower.
The temperature and salinity measurements that were
recorded by the FerryBox since the NXIC CTD was
installed in late December 2007 have been generated
with corrections for salinity decay between servicing
(Fig. 10). The missing sections in the dataset represent
the times when maintenance was being undertaken to
the ferry or the FerryBox measurement system. The
figure demonstrates that a system capable of sustained
spatially and temporally continuous scientific measurements has been developed. The seasonal change in
temperature can be clearly seen (Fig. 10a) and will not
be discussed further as the underlying physics are well
known. Of greater interest is the 3-yr salinity record
(Fig. 10b), where the seasonal cycle is much less pronounced (r2 values for fitting an annual cycle are less
than 0.25 compared with .0.9 for temperature). The
dominant feature is the mean salinity (Fig. 11), illustrating the different water masses described previously.
The ferry salinity measurements also give detailed
information on its spatial and temporal variability where
two topics are particularly noteworthy, Liverpool Bay
and the maximum salinity on each crossing.
The mixing zone in Liverpool Bay lies between 3.58–48
and 38W (the mouth of the Mersey). Salinity here is
highly variable and can reach as high as 32.4 PSU at
the mouth of the Mersey and as low as 29.3 PSU at the
Mersey Bar site (3.368W). This variability is demonstrated in Fig. 12, showing the longitude where 32 PSU is
crossed. The variability within the bay seems to depend
more on the bay’s circulation (on average, northward at
the surface with a strong wind influence) than on variations in the freshwater discharge. Of exceptional value
are the inshore time series measurements between the
SmartBuoy site and the mouth of the Mersey, which are
measurements of the river plume that only a ferry can
provide. The time series of the measurements at the
mouth of the river Mersey, approximately 1500 m from
FIG. 11. The average salinity plotted against longitude.
JUNE 2013
BALFOUR ET AL.
1237
cycles. Salinity and temperature were the key values
used for scientific research. The other optical sensor
measurements of chlorophyll a concentration, turbidity,
and dissolved oxygen concentration had laboratorybased reference value checks applied for each of these
sensors prior to deployment to look for any evidence of
measurement drift. The subsequent data from these
sensors was then archived for future scientific analysis.
5. Discussion and future work
FIG. 12. The longitude where the ferry crossed 32 PSU. The water
to the east is fresher and to the west saltier.
Birkenhead port, are compared to the measurements
approximately 20 km westward of this, when the ferry
passed close to the SmartBuoy (Fig. 14). While as expected the temperatures are well correlated and the
differences predictable, the salinities are much less well
correlated (correlation coefficient r 5 0.42), demonstrating the large variable gradients close to the coast,
a region where numerical models are less accurate.
There was considerable variability of the maximum
salinity on each crossing against time and longitude
(Fig. 13). This is an indication of the variability in the
weak average flow of water of Atlantic origin from south
to north through the Irish Sea. There is no correlation
between the position, which varies from north of Anglesey to close to Dublin, and the salinity value.
The higher-frequency variations (Fig. 14) show the
effect on temperature and salinity in response to tidal
Coastal environments place particularly rigorous requirements on oceanographic sensors in terms of their
resistance to sedimentary and biological fouling. The
choice of sensing technology used can have a direct
impact on both the quality of the measurements made
and the underlying science that relies on the integrity
of this information. Organizations such as the U.S.
government–funded Alliance for Coastal Technologies
(ACT) (www.act-us.info) have been commissioned to
subject new and existing sensing technology to a series
of common performance evaluations that are independent of a particular manufacturer (Alliance for Coastal
Technologies 2006). The result of this is the provision of
information to assist with the choice of the most suitable
sensors for a particular coastal application. Bearing in
mind the potential diversity of practical coastal monitoring applications, it is believed that there is still scope
for individual performance trials. This paper has discussed the specific experiences of water quality sensors
and their performance for an Irish Sea–based instrumented ferry system.
The instrumented ferry has served as an important
source of scientific measurements within the NOC
Coastal Observatory. The measurements from the
FIG. 13. The maximum salinity on each crossing plotted against (a) time and (b) longitude.
1238
JOURNAL OF ATMOSPHERIC AND OCEANIC TECHNOLOGY
VOLUME 30
FIG. 14. Temperature and salinity seasonal cycle measurement comparisons and inshore gradients. Liverpool Bay
is in red and mouth of the river Mersey in blue. (a) FSI temperature measurements, and (b) FSI salinity measurements illustrating the gradients.
FerryBox also provided a mechanism for the validation
of predictive models such as the NOC Proudman
Oceanographic Laboratory Coastal Ocean Modelling
System (POLCOMS) Irish Sea model. In addition to
this, the introduction of dissolved oxygen measurement
to the FerryBox increased the scientific data range of the
instrumentation installed. Dissolved oxygen measurements assist with the task of water quality assessment
by organizations such as the U.K. Environment Agency
in response to the EU Water Framework Directive
(European Parliament 2000). This directive deals with
environmental protection and the promotion of sustainable water use. The core water quality assessment
parameters are listed as oxygen content, pH value, conductivity, nitrate, and ammonium.
From the perspective of the FerryBox sensor development, the migration to a shielded-inductive-type
conductivity cell has improved the robustness of the
ferry-based salinity measurements. This measuring system was further improved when an automated shut of
the valve was used to prevent highly turbid waters from
being pumped through the instrumentation chamber
when the ferry is close to port or maneuvering in or out
of its port-based berth. It is also clear from the measurement value decays between service visits that the
performance of the Teledyne Citadel NXIC conductivity cell would improve further if an automated conductivity cell mechanical cleaning system was installed.
This is clearly illustrated by the results of the trials of
the Alec Electronics CTW. This self-cleaning electrodetype conductivity cell, while offering approximately one
decimal place less in quoted temperature- and conductivitymeasured accuracy, has clearly demonstrated a robustness of measurement advantage if mechanical cleaning
is used. This is particularly evident in the enhanced
stability of the derived salinity from the CTW when
compared with the NXIC conductivity cell during a simultaneous dual deployment in the FerryBox. A drawback with the CTW is that it does not have a standard
provision for a real-time data output in conjunction with
internal logging or the ability to record data from auxiliary sensors. The optical measurements of turbidity
and dissolved oxygen show some differences between
buoy-based observations. The exact reason for this will
require further investigation.
In terms of the scientific analysis of the data from the
FerryBox, aliasing of ferry measurements occurs due to
a ferry sailing pattern that is out of synchronization with
the nominal 12.4-h tidal cycle. To assist with the data
analysis, it would be advantageous to install a robust
measurement of at least temperature and salinity close
to the mouth of the river Mersey. This could be used to
provide round-the-clock data for this area that would
provide measurement gradient information when an
Irish Sea ferry is away from inshore waters. The FerryBox
is one of the few measurement systems capable of providing inshore water quality measurements. This information is important for scientific studies and to assist
with the improvement of predictive models. A desirable
addition to this type of FerryBox system would be automated water sample collection and refrigeration along
a series of waypoints during the ferry route. The regular
collection and laboratory analysis of these samples could
provide an additional source of sensor calibration data
for the FerryBox.
The system that has been designed can be incorporated into other ships of opportunity using the modular pressure chamber and electronics enclosures that
have been devised. The Persistor CF2–based centralized
datalogger is a key component that provides a science
JUNE 2013
BALFOUR ET AL.
and positional data record. Additionally, this unit controls the operation of the FerryBox and water flow control
valve. Custom software for the CF2 FerryBox application
has been developed using structured design methodologies, allowing adaptation for future applications. Data
recording redundancy is provided with the CTD internal
data record in the engine room, the GPS receiver internal
record, and the telemetry modem GPS receiver. Support
from a ship operator is required for vessel access, particularly during the commissioning of such an oceanographic
sensor system. A progressive approach to the installation
is recommended to construct and test the system in stages
while the vessel is in port between sailings or for maintenance. For the efficient operation of such a FerryBox,
convenient port access is desirable. The risks of this approach include vessel rescheduling and route closures. The
possible need to remove and relocate the sensor system
should be considered.
While it is disappointing that the Birkenhead–Dublin
ferry route discussed in this paper has been closed, it is
envisaged that a series of further applications exist for
the instrumentation system that has been developed.
Examples of this include sensors installed on alternative
ferry routes or long-range cargo vessels to provide a
range of cost-effective, sustained coastal and offshore
scientific measurements.
Acknowledgments. The authors express their thanks
to the EU and the U.K. Natural Environment Research
Council (NERC) for the provision of funding to research
this activity. Norse Merchant Ferries, Norfolkline, and
DFDS Seaways are also acknowledged for their cooperation and support of this project.
REFERENCES
Alliance for Coastal Technologies, 2006: Protocols for verifying the
performance of in situ turbidity sensor. Alliance for Coastal
Technologies Rep. PV06–01, 20 pp.
American National Standards Institute, 2001: TIA/EIA standard:
Commercial building telecommunications cabling standard.
Part 1: General requirements, American National Standards
Institute TIA/EIA-568-B.1, 79 pp.
——, 2005: TIA/EIA standard: Electrical characteristics of balanced voltage digital interface circuits. American National
Standards Institute TIA-422-B, 36 pp.
Balfour, C. A., 2012: Cost-effective remote data acquisition and
instrumentation management for oceanographic and environmental monitoring applications. Oper. Oceanogr., 5, 41–52.
——, M. J. Howarth, M. J. Smithson, D. S. Jones, and J. Pugh, 2007:
The use of ships of opportunity for Irish Sea based oceanographic measurements. Proc. OCEANS ’07 Conf., Aberdeen,
Scotland, IEEE/OES, Paper 061211-007.
B&B Electronics, 2012: 485LDRC9 industrial RS-232 to RS-422/
485 converter. B&B Electronics Data Sheet, 2 pp.
1239
Buzzelli, C. P., J. Ramus, and H. W. Paerl, 2003: Ferry-based
monitoring of surface water quality in North Carolina estuaries. Estuaries, 26, 975–984.
Chatterton, P. A., and M. A. Houlden, 1991: EMC: Electromagnetic Theory to Practical Design. Wiley, 295 pp.
Digi International, 2009: The Digi m100 smart satellite modem.
Digi International Data Sheet, 2 pp.
Englander, J., 2009: The International Seakeepers Society: A decade of innovation and progress. Sea Technol., 50, 34–35.
European Parliament, 2000: Directive 2000/60/EC of the European
parliament and of the council. European Parliament and
Council of the European Union, 72 pp.
Grayek, S., J. Staneva, J. Schulz-Stellenfleth, W. Petersen, and
E. V. Stanev, 2010: Use of FerryBox surface temperature and
salinity measurements to improve model based state estimates
for the German Bight. J. Mar. Syst., 88, 45–59.
Horiuchi, T., F. Wolk, and P. Macoun, 2010: Long-term stability of
a new conductivity-temperature sensor tested on the VENUS
cabled observatory. Proc. OCEANS ’10 Conf., Sydney, NSW,
Australia, IEEE, 1–4.
Horowitz, P., and W. Hill, 1993: Interference: Shielding and
grounding. The Art of Electronics, 2nd ed. P. Horowitz and
W. Hill, Eds., Cambridge University Press, 455–465.
Howarth, M. J., and M. R. Palmer, 2011: The Liverpool Bay
Coastal Observatory. Ocean Dyn., 61, 1917–1926.
Hydes, D. J., M. C. Hartman, J. Kaiser, and J. M. Campbell, 2009:
Measurement of dissolved oxygen using optodes in a FerryBox
system. Estuarine Coastal Shelf Sci., 83, 485–490.
Laipac Technology Inc., 2007: The G35L GPS data logger user
manual V1.0. Laipac Technology Inc., 13 pp.
Mills, D. K., N. Greenwood, S. Kröger, M. Devlin, D. B. Sivyer,
D. Pearce, S. Cutchey, and S. J. Malcolm, 2005: New approaches to improve the detection of eutrophication in UK
coastal waters. Environ. Res. Eng. Manage., 2, 36–42.
Montrose, M. I., 1999: EMC inside the PCB. EMC and the Printed
Circuit Board: Design, Theory, and Layout Made Simple.
IEEE Press, 23–52.
National Marine Electronics Association, 2002: The NMEA-0183
standard, version 3.01. National Marine Electronics Association, 88 pp.
Orbcomm, 2001: Orbcomm system overview: A80TD0008—
Revision G. Orbcomm LLC, 54 pp.
Panton, A., 2012: The impact of physical processes on primary and
secondary production in a temperate shelf sea. Ph.D. thesis,
University of Liverpool, 149 pp.
Persistor Instruments Inc., 2005: The Persistor CF2 getting started
guide, revision 2.0. Persistor Instruments Inc., 30 pp.
Petersen, W., M. Petschatnikov, F. Schroeder, and F. Colijn, 2003:
FerryBox—A new system for automatic measurement of
biological-chemical parameters from ferry boats. Proc.
OCEANS 2003 Conf., San Diego, CA, IEEE, 2234–2237.
——, F. Schroeder, and F. D. Bockelmann, 2011: FerryBox—
Application of continuous water quality observations along
transects in the North Sea. Ocean Dyn., 61, 1541–1554.
Sea-Bird Electronics Inc., 2007: SBE 16plus SEACAT user’s
manual. Sea-Bird Electronics Inc. Manual Version 18, 89 pp.
Seapoint Sensors Inc., 2001: Seapoint turbidity meter user manual
standard version. Seapoint Sensors Inc., 13 pp.
Teledyne RD Instruments, 2010: Citadel CTD technical manual
P/N A176-004. Teledyne RD Instruments, 150 pp.
Zebra Technologies Ltd., 2010: Hydro-Wiper operation manual.
Zebra-Tech Ltd., 8 pp.