1
1236
JOURNAL OF ATMOSPHERIC AND OCEANIC TECHNOLOGY
VOLUME 30
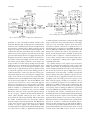
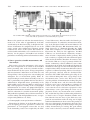
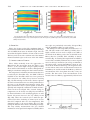
FIG. 10. Temperature and salinity measurements. The missing sections represent the times when maintenance was
being undertaken to the ferry or the FerryBox measurement system. (a) FSI temperature measurements, and (b) FSI
salinity measurements.
4) IRISH SEA
This is the deepest section (the maximum depth exceeds 100 m) and has the maximum salinity (in the range
33.8–34.8 PSU) from water of Atlantic origin, since the
mean flow through the Irish Sea is from south to north.
The ferry track crosses the southern end of the summer
thermal stratified region to the west of the Isle of Man.
5) APPROACHES TO DUBLIN
These differ markedly from the approaches to
Birkenhead. The mean flow from the Liffey is less
(14 m3 s21), the water depth is deeper, rapidly reaching
50 m, and the tidal currents are weaker, subsequently resulting in a freshwater mixing zone that is much narrower.
The temperature and salinity measurements that were
recorded by the FerryBox since the NXIC CTD was
installed in late December 2007 have been generated
with corrections for salinity decay between servicing
(Fig. 10). The missing sections in the dataset represent
the times when maintenance was being undertaken to
the ferry or the FerryBox measurement system. The
figure demonstrates that a system capable of sustained
spatially and temporally continuous scientific measurements has been developed. The seasonal change in
temperature can be clearly seen (Fig. 10a) and will not
be discussed further as the underlying physics are well
known. Of greater interest is the 3-yr salinity record
(Fig. 10b), where the seasonal cycle is much less pronounced (r2 values for fitting an annual cycle are less
than 0.25 compared with .0.9 for temperature). The
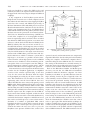
dominant feature is the mean salinity (Fig. 11), illustrating the different water masses described previously.
The ferry salinity measurements also give detailed
information on its spatial and temporal variability where
two topics are particularly noteworthy, Liverpool Bay
and the maximum salinity on each crossing.
The mixing zone in Liverpool Bay lies between 3.58–48
and 38W (the mouth of the Mersey). Salinity here is
highly variable and can reach as high as 32.4 PSU at
the mouth of the Mersey and as low as 29.3 PSU at the
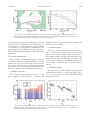
Mersey Bar site (3.368W). This variability is demonstrated in Fig. 12, showing the longitude where 32 PSU is
crossed. The variability within the bay seems to depend
more on the bay’s circulation (on average, northward at
the surface with a strong wind influence) than on variations in the freshwater discharge. Of exceptional value
are the inshore time series measurements between the
SmartBuoy site and the mouth of the Mersey, which are
measurements of the river plume that only a ferry can
provide. The time series of the measurements at the
mouth of the river Mersey, approximately 1500 m from
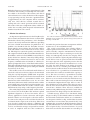
FIG. 11. The average salinity plotted against longitude.