1
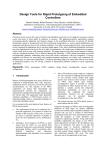
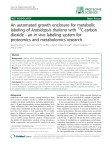
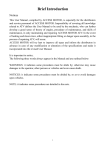
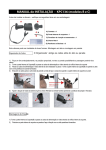
Cell Lenght V 2.0
User Manual
Any comment or request, please contact:
Dr. Arturo Pimentel [email protected]
Dr. Gabriel Corkidi [email protected]
Web page: http://www.ibt.unam.mx/labimage
Download link: http://www.ibt.unam.mx/labimage/proyectos/arabidopsis
1. System requirements
-
Java JRE (Download java: http://www.java.com/en/download/).
PC with Linux, Windows or MAC OS
2. Abstract.
This software is designed to acquire data of the cell's length within different lanes, over
a collection of 2D images of roots. The procedure enables the serial processing of
images from the collection. The traced lengths and coordinates from segments of the
root within different lanes are stored and ordered in a text file which can be exported to
any other statistical package. By using this application, acquisition time is largely
reduced than if using simply ImageJ and stored data are ranged logically for further
analysis.
3. Instructions.
1
To execute the graphic interface (Figure 1) give a click to the executable file:
Cell_Length_V2.xx.jar
2
Press the button ‘Define images folder (1) to locate the folder containing the
images collection (select the folder, not a file within). Once selected, the
information will appear in the notification window (13). At this point define the
pixel size for calibrating the image collection (in micrometers) by using the
window (2).
3
After the images folder is selected, this application explores the defined
directory and builds up the list of images to be analyzed (contained in the
images folder). Color or gray level images are accepted. It also accepts
different size of images and formats within jpg, tif, png, gif. The final list will
be displayed in the notification window (13).
4
At this point, the button ‘Start process’ (3) will be enabled and once activated,
the first image of the list will be displayed and its name will appear in window
(11). This is the active image being analyzed.
5
The wheel of the mouse can be used to zoom-in or zoom-out while displaying
any image. First point once over the center of the region to be zoomed.
6
Prior beginning to take measures, press the button ‘Start measurements’ (5).
This will enable the active image to receive the measuring clicks. Point the
cells’ borders defining sequentially their lengths to be measured (Figure 2). A
complete lane of cells can be traced.
7
During the measuring process defined before, any point can be deleted by using
the button ‘Delete last point’ (6) and continue tracing the correct point. The
image selector (12) can be used at any moment to select another image to, for
example, compare adjacent cells when they are not well defined or out of focus
in the active image.
8
When all cells’ lengths are marked, the button ‘End measurement’ (7) should
be pressed. The program will ask if the user needs to trace more measurements
in the actual image (for example to repeat several times a lane to take a mean
value, or to trace different lanes) or if he desires to change to the following
image of the list.
9
Within an active image, the user may perform multiples measures in different
cell lanes over the same image. If one of the measured lanes needs to be erased,
select the number of the lane to be erased with (9) and then press the button
‘Delete measurement’. Data coming from erased lane will be excluded in the
output file. If all the lanes need to be erased from the file, activate ‘Delete all’
(10).
10 Area (11) shows the active image under analysis.
11 When the sequence of images of the list is processed, the button ‘End process’
(4) should be pressed. The measured lengths (with additional data, see Fig. 3)
will be saved in a simple text file with extension .txt and it will be located in
the same directory where the root images were stored (when selecting directory
with button (1)). Figure 3 shows an example of file containing the name of the
analyzed image, the actual date, the calibration (pixel size), then five columns
showing the dataset label, traced point label, its corresponding x,y coordinates
in the image and the length of each cell. The ‘End process’ button (4) is always
active and the program may be quitted at any moment, and the active data will
be saved in the text file.
12 The notification window (13) is designed to follow every step of the measuring
procedure executed by the program.
Figure 1. Graphical user interfase designed to measure the cells’ lengths into the images of
the selected roots.
Figure 2. Image of a slice of Arabidopsis thaliana (Nomarski microscopy) showing the
marked point (in yellow) to define the cells’ borders for measuring their lengths.
Image File: agl12Col0-18-01-.jpg
Date: 2015/01/26
12:11:45
Pixel size (µm/pixel): 1.0
Dataset Point.number
Coordinate.X (pix)
0
0
0
0
0
1
1
1
1
1
1
2
3
4
5
2
3
4
5
6
464
487
508
528
544
463
480
490
505
517
Image File: agl12Col0-18-m-40x23, 20x11.jpg
Date: 2015/01/26
12:11:45
Pixel size (µm/pixel): 1.0
Dataset Point.number
Coordinate.X (pix)
0
0
0
0
0
0
0
1
2
3
4
5
6
7
847
899
948
997
1048
1090
1138
Coordinate.Y (pix)
480
478
477
475
476
624
627
627
628
628
Coordinate.Y (pix)
795
798
798
802
804
801
798
Distance (µm)
23.0867928
21.023796
20.0997512
16.0312195
17.2626765
10.0
15.0332964
12.0
Distance (µm)
52.0864666
49.0
49.1629942
51.0392006
42.1070065
48.0936586
Figure 3. Example of the output file .dat once imported over MS Excel. Two lanes were
pointed in the first image and a single one in the second image. Note that the first length
measured is within the second row (Point 2), corresponding to the distance between points
1 and 2.