1
COMPUTER PROGRAM MANUAL
(SURVEY DATA REDUCTION MANUAL)
DAT31W
Version 1.20
May, 2003
Geonics Limited
1745 Meyerside Drive, Mississauga, Ontario, Canada L5T 1C6
Tel: (905) 670 9580
Fax: (905) 670 9204
E-mail: [email protected]
Contents
1. Introduction .................................................................................................. 1
1.1
1.2
1.3
1.4
About DAT31W .......................................................................................... 1
Contents of DAT31W Distribution Disk ....................................................... 2
DAT31W Software Installation .................................................................... 2
Program Overview ..................................................................................... 6
2. Quick Start ................................................................................................. 11
2.1 Download Data ....................................................................................... 11
Download Data from Polycorder 600 ....................................................... 11
Download Data from Pro4000 ................................................................ 12
2.2 Convert File Format ................................................................................. 13
Convert Polycorder 600 Files ................................................................... 13
Convert EM31pro Files............................................................................ 14
2.3 Displaying Data as Profiles ...................................................................... 14
Loading and Displaying Data Files ........................................................... 14
Selecting Survey Lines ............................................................................. 16
Deleting and Renaming Survey Lines ........................................................ 16
Changing Display Parameters .................................................................. 16
Selecting Channels to Display .................................................................. 17
2.4 Editing Survey Geometry .......................................................................... 18
Survey Conducted without Fiducial Markers .............................................. 18
Survey Conducted with Fiducial Markers ................................................... 18
2.5 Create XYZ File ........................................................................................ 20
3. Data Transfer .............................................................................................. 25
3.1 Polycorder Communication Parameters .................................................... 25
3.2 Upload Program Files to Polycorder ......................................................... 26
General Information ................................................................................ 26
Description of Polycorder Program Files .................................................... 26
Uploading Files to the Polycorder ............................................................. 27
3.3 Download Data from the Polycorder ........................................................ 29
Data File Formats ................................................................................... 29
Download Procedure ............................................................................... 30
3.4 Download EM31pro Files from Pro4000 ................................................... 33
Data File Formats ................................................................................... 33
Download Files Procedure ....................................................................... 33
i
4. Loading and Displaying Data ....................................................................... 39
4.1 Loading EM31 Profile Files ....................................................................... 39
Loading Data File ................................................................................... 39
Loading Additional Data Files to Separate Windows .................................. 41
Adding Data to the Existing Window ......................................................... 42
4.2 Closing Profile Window and Saving Data ................................................. 42
Closing Active Window ........................................................................... 42
Clear Workspace .................................................................................... 43
Save Data .............................................................................................. 43
Save Data to Specified File (Save As)........................................................ 44
4.3 Select, Delete and Rename Survey Lines................................................... 44
Selecting Survey Lines ............................................................................. 44
Deleting Survey Lines .............................................................................. 46
Renaming Survey Lines ............................................................................ 46
4.4 Select Data Types ..................................................................................... 47
4.5 Changing Display Parameters .................................................................. 47
Set Display Parameters Window ............................................................... 48
Quick Change of Horizontal and Vertical Scales ....................................... 48
4.6 Data Info ................................................................................................. 49
4.7 Grid Lines ................................................................................................ 50
4.8 Moving Bar .............................................................................................. 51
4.9 Set Line Attributes .................................................................................... 51
4.10 Refresh Screen ......................................................................................... 52
5. Editing Data................................................................................................ 53
5.1 Edit Reading ............................................................................................ 53
Deleting Readings................................................................................... 55
Updating Readings ................................................................................. 56
5.2 Shift Data Set .......................................................................................... 57
5.3 Remove Background ................................................................................ 58
One Point Method .................................................................................. 58
Two Point Method ................................................................................... 59
5.4 Smooth Data ........................................................................................... 60
6. Editing Survey Geometry ............................................................................. 63
6.1
6.2
6.3
6.4
Set Line Limits .......................................................................................... 64
Shift Survey Lines ..................................................................................... 65
Split Survey Lines ..................................................................................... 66
Position Markers ...................................................................................... 68
Repositioning A Selected Marker .............................................................. 70
Reposition a Group of Selected Markers ................................................... 70
ii
6.5 Position Line Segments ............................................................................ 72
Repositioning a Selected End of Line Segment ........................................... 73
Reposition a Group of Selected Segment End Stations ............................... 73
6.6 Quick Marker and Profile Adjustments ..................................................... 75
Quick Marker Adjustment ........................................................................ 75
Quick Remove Marker ............................................................................ 76
Quick Line End to Marker Adjustment....................................................... 76
Quick Adjust Survey Line ......................................................................... 76
7. 2D Layout (Create XYZ File) ......................................................................... 77
7.1 Create XYZ File ........................................................................................ 78
Parameters Describing Contents and Format of XYZ File ............................. 78
Creating an XYZ File with W-E or S-N Line Orientation .............................. 80
Creating an XYZ File with Arbitrary Orientation ......................................... 82
7.2 View Survey Layout (W-E) or (S-N) ............................................................ 83
8. GPS Positioning ........................................................................................... 85
8.1 Combine EM31 and GPS Files.................................................................. 86
Parameters for Combine EM31 and GPS Files Window .............................. 86
View Time Range .................................................................................... 90
Creating XYZ File .................................................................................... 91
8.2 GPS Positioning ....................................................................................... 92
Parameters in GPS Positioning Window ..................................................... 92
Creating XYZ File .................................................................................... 95
8.3 Correct Time Delay in XYZ Files ................................................................ 96
Parameters in Correct Time Constant Delay Window .................................. 96
Creating Corrected XYZ File ..................................................................... 99
APPENDIX A ................................................................................................... 101
A.1 Description of Data File in DAT31W (G31) Format.................................. 101
Example of EM31 File in DAT31 Format ................................................. 102
A.2
A.3
A.4
A.5
A.6
The Data File in the Polycorder 600 Format ............................................ 103
The Data File in the Polycorder 720 Format ............................................ 104
Examples of GPS File Formats ................................................................ 106
Description of Data File in EM31pro Format ........................................... 107
Example of Data File in EM31pro Format ............................................... 110
APPENDIX B ................................................................................................... 111
B.1 Short Overview of Programs Lynx and ProShell ....................................... 111
B.2 Establishing Communication.................................................................. 111
B.3 Transferring Files to the Pro4000 from the PC ......................................... 112
B.4 Transferring Files from the Pro4000 to the PC ......................................... 112
iii
1. Introduction
This Windows based program replaces the DOS version of software DAT31. Survey data reduction program for
Geonics EM31 ground conductivity maters operates under Windows 95/98/XP/NT(4.0), and Windows 2000.
While both versions, DOS and Windows, perform basically same functions, the Windows version of DAT31 provides a much easier users interface, better information on the screen, larger amount of readings can be operated on
in one block, limited only by capacity of a computer hard drive, support for any printer and plotter supported by
Windows, and has more control and faster completion of most of the tasks. In addition DAT31W supports EM31
data files which include Global Positioning System (GPS) data recorded directly in logger Allegro (Pro4000) operating under the control of program EM31alg.
1.1 About DAT31W
The program DAT31W is designed to process data collected by Polycorders 600 and 720 operating under
corresponding programs EM31-MK2 and EM31, data recorded in the field computer Allegro (or Pro4000)
using data acquisition program EM31alg, or data acquired directly in the computer through the RS232
interface. It allows transfer of data files from the Polycorder or Allegro to a Personal Computer (PC).
Subsequently, it can be used to display, edit, print and plot data files. Data can be plotted on the computer
screen and on any printer supported by Windows. There is an option to create files that can be used as
input for the GEOSOFT or SURFER contouring packages, or any other contour software, if three column
[X,Y,data1] format is suitable.
This Windows based version of DAT31W provides a much easier interface and better information on the
screen. The amount of readings is limited only by the capacity of a computer hard drive. It supports any
printer and plotter that is supported by Windows and gives more control and faster completion of tasks.
The latter can be especially appreciated by users employing Auto mode and fiducial markers during survey.
Positioning of markers and aligning of survey line ends, even in the case of large survey layouts, is much
faster and easier as compared to the DOS based program.
Additional improvements were also introduced to the data downloading. The program lists the Polycorder
or Pro4000 data files and their sizes, and the user may simply select files to be downloaded without having
to review the Polycorder directory. Still, DOS based downloading programs are included on the disk in
order to support older DOS or 16 bit Windows (3.1 or 3.11) based computers.
Overall processing of the EM31 data with this Windows based software will result in much greater productivity. File formats are compatible with older DOS based versions of DAT31 and DAT31-MK2 programs.
However to download data from the Polycorder 600 or 720 a new version of the Polycorder program
EM31-MK2 (for Polycorder 600) or EM31 (for Polycorder 720) has to be installed in the logger. These new
Polycorder programs are still compatible with the DOS based software so data files can be downloaded
using a new DAT31W for Windows as well as older DOS based DAT31 software.
EM31 readings are arranged in profile lines. Every profile line can consist of unlimited number of segments. Each profile line can contain up to eight separate curves: two for the Inphase and Quadrature
1. Introduction
1
(Conductivity) components, for each of the Vertical and Horizontal dipole modes, and an additional two
for different instrument orientation. Note that the Quadrature component is generally referred to as Conductivity in this manual.
One sample data file, DEMO1.G31 is included on the program disk. It allows the user to become familiar
with running the DAT31W program.
1.2 Contents of DAT31W Distribution Disk
Program DAT31W is supplied on one CD disk. Disk contains following files and directories:
SETUP31.EXE UploadFiles
-
DAT31DOS
Documentation DAT31Wdisks -
setup program for DAT31W.
directory with following Polycorder files:
FORM31.MK2 and EM31.MK2 for Polycorder 600 and standard EM31-MK2,
FORMSH.MK2 and EM31-SH for Polycorder 600 and short EM31-MK2,
FORMDL.720 and EM31.720 for Polycorder 720 and analog EM31,
these files are also placed by Setup31 program in subdirectory UploadFiles of
the DAT31W program directory.
directory containing all EM31 DOS based program and associated files
directory containing manuals available in PDF format
directory containing two subdirectories (Disk1, Disk2, and Disk3) for users
that require floppy disks to run Setup31
If EM31 software is supplied with EM31alg program for Allegro following additional file and directory are
included on the CD distribution disk:
EM31alg.EXE EM31Salg.EXE Pro4000disks -
data acquisition program for Allegro (or EM31pro.EXE for Pro4000)
as above for short (2 m) EM31-MK2 (or EM31Spro.EXE for Pro4000)
directory containing contents of three floppy disks with a Pro4000 system
files and Juniper System communication program Lynx
1.3 DAT31W Software Installation
DAT31W uses setup program to load files on your computer. The following section describes the installation process.
To install DAT31W insert the DAT31W CD disk into computer CD disk drive. Exit all Windows applications before installing the program.
From the Windows File Manager, select Run from the File menu. The Run dialog box opens (Figure 1.1).
Figure 1.1: Run Dialog window
2
DAT31W Operating Manual
Browse for the file SETUP31.EXE in the directory of the diskette. Click OK to launch the Setup program.
Once the Setup determines your computer configuration the Welcome window opens (Figure 1.2).
Figure 1.2: Welcome window
Read the text and click the Next button. The Serial Number window will be displayed (Figure 1.3).
Figure 1.3: Serial Number window
Type the Serial Number into provided box and press the Next button. (If you do not know the Serial
Number, you will not be able to continue.) The Installation Directory window opens (Figure 1.4).
Figure 1.4: Installation Directory window
1. Introduction
3
The default directory is c:\Geonics\DAT31W. Click the Next button to install the program to this directory. If you wish to install DAT31W to another directory, click the Browse button and the Select Installation Directory window will open (Figure 1.5).
Figure 1.5: Select Installation
Directory window
Select a target directory and click OK. The Select Installation Directory window closes, and the Installation
Directory window opens with the selected directory listed. Click the Next button. The Select Short cut
Folder window opens (Figure 1.6).
Figure 1.6: Select Shortcut Folder window
The setup program will create a DAT31W menu item in the Program menu accessible by clicking Start. If
you do not want to use the proposed folder, you can either enter a new name, or select an existing folder
from the list. Click Next and Ready to Install window will follow.
Figure 1.7: Ready to Install window
4
DAT31W Operating Manual
In case you would like to make any changes before installation, click Back. To abort installation click
Cancel. If you are ready to start installation, click Finish. The installation progress bar will appear (Figure
1.8).
Figure 1.8: Installing Files progress bar
The Installing Files window with a progress bar displays the percentage of the installation completed.
When finished, the End of Installation window will appear (Figure 1.9).
Figure 1.9: Finished window
Click Finish to end installation. SETUP31 creates a DAT31W program group and places DAT31W and
Uninstall icons into it. The setup program creates also a DAT31W menu item in the Program menu
accessible by clicking Start. A reminder to restart the system will be displayed at the end of the Setup31
program.
Figure 1.10: Restart Notice window
The destination directory that was chosen earlier contains program files, sample files, and the subdirectory
UploadFiles that includes files necessary for uploading the Polycorder 600 or 720.
In addition, DAT31W disk includes DOS based programs necessary for downloading data in case the field
computer does not have Windows 95/98/XP or NT(4.0)/2000 installed. These files are located in the
DAT31WDOS subdirectory of the disk.
1. Introduction
5
1.4 Program Overview
Start the DAT31W by double clicking the DAT31W icon in the Start|Programs menu, in Windows Explorer, or on the desktop if a shortcut was created. At the start, DAT31W occupies the entire screen (Figure
1.11):
Figure 1.11: DAT31W Initial Screen
The DAT31W defaults to a maximized screen and clicking the minimize button allows access to other
applications behind DAT31W. At this point, the user can:
• upload program to the Polycorder,
• download data from the Polycorder,
• download data files from the Pro4000 field computer,
• merge EM31 and GPS files,
• position EM31 files containing GPS positions,
• convert raw Polycorder 600 or 720 files to DAT31 format (.G31) files,
• convert raw EM31pro (R31) files to DAT31 format (.G31) files,
• load data files: DAT31 profile files (.G31 files). XYZ files, and small (up to 64K) text files,
• select display (tool bar and status bar).
After DAT31 profile file (G31) is loaded tool bar becomes active and the screen has following shape (Figure
1.12):
6
DAT31W Operating Manual
Figure 1.12: DAT31W Screen after profile file is loaded
A stacked profile display can be enlarged to occupy the entire screen by clicking the maximize button. The
tool bar (if selected in View menu) is displayed across the top of the screen. The following quick access
tools (Figure 1.13) are described below, starting from the left side of the bar:
Figure 1.13: DAT31W Tool Bar
Load EM31 profile file (data file in DAT31 format with extension name .G31).
Load XYZ file two dimensional file (DAT31W allows user view layout of survey lines and
stations).
Load text file (this function is similar to Notepad in Windows and allows user to edit small, up
to 64K in size, text files).
Save As allows user to save data under different file names at any time during data processing.
Select Lines allows user to select survey lines to be displayed. This function also allows you to
delete and rename survey lines.
Select Channels allows the user to select the EM31 data types (to be profiled and/or displayed numerically in windows below the tool bar.
Set Display Parameters allows user to set the range of display as well as define axes tics.
1. Introduction
7
Position Markers allows user to display the Position Markers window.
Adjust Marker allows the quick adjustment of a marker position.
Remove Marker allows erasing of a chosen marker.
Adjust survey line between end of the line and a marker allows user to adjust end of the
line without moving neighboring marker.
Adjust Survey Line allows user to adjust ends of survey lines. The procedure allows moving
start of the line (green square) without changing its length and moving end of the line (red
square) without repositioning of the start point of the line.
Position Line Segment allows the user to adjust the ends of a segment of survey lines.
Modify Horizontal Scale (group of five buttons) allows user to:
compress (squeeze) scale,
expand scale,
return to default range,
shift plot left
shift plot right,
Increments are the same increment of minor tic of horizontal axis.
Modify Vertical Scale (group of five buttons) allows user to:
compress (squeeze) scale,
expand scale,
shift plot up,
shift plot down,
8
DAT31W Operating Manual
return to default range.
Increments are the same increment of minor tic of vertical (conductivity) axis.
Show Moving Bar displays a vertical bar (line) which can be moved along horizontal axis.
This bar may allow to compare alignment of anomalies located at various survey lines.
View XYZ/Create XYZ File allows user to display two dimensional layout of the survey
oriented in W-E direction and to display Create XYZ File menu.
View XYZ/Create XYZ File allows user to display two dimensional layout of the survey
oriented in S-N direction and to display Create XYZ File menu.
A detailed description of the functionality of each tool is provided in revelant sections of the manual.
1. Introduction
9
2. Quick Start
This chapter is intended for users who wish to quickly start downloading and editing an EM31 survey. Detailed
information on all functions and capabilities of the program is given in later sections. It is assumed that the Polycorder 600, Polycorder 720 or the field computer Pro4000 was loaded with necessary files to collect field data.
2.1 Download Data
Download Data from the Polycorder 600
Select Data Transfer in the program menu and then select the Download EM31 Files from Polycorder
600 item (Figure 2.1).
Figure 2.1: Data Transfer menu
The Download EM31 Files from Polycorder 600 window will appear (Figure 2.2).
Figure 2.2: Download Data window
The basic procedure for downloading files is displayed in the bottom of the Download EM31 Files from
Polycorder 600 window, and is as follows:
•
connect the Polycorder and desktop computer with the dumping cable.
•
check the port number.
2. Quick Start
11
•
•
•
•
•
Select and execute the DUMPWIN program in the Polycorder.
click the List Files button to get data file names contained in the Polycorder. After several seconds,
when communication is established and tested, list of all available files to download will appear in
the left list box. At the same time the Download button will be activated.
select files to be downloaded from the logger. Selected files are highlighted.
click on Download. At this point a progress bar indicates the percentage downloaded for each file.
Transferred files will be displayed in the centre list box.
after transfer is completed files are automatically converted from raw EM31 format to DAT31
format, with the extension name G31.
Please refer to section 3 (Transfer Data) for a detailed description of downloading a data file from Polycorder 600.
Download Data from Pro4000
Select Data Transfer in the program menu and then select the Download EM31pro Files from Pro4000
item (Figure 2.3).
Figure 2.3: Data Transfer menu
The Download EM31pro Files from Pro4000 window will appear (Figure 2.4).
Figure 2.4: Download EM31 Files from Pro4000 window
The basic procedure for downloading files is displayed in the bottom of the Download EM31pro Files
window, and is as follows:
•
connect the field computer and desktop computer with the dumping cable.
•
check the port number.
•
Select and execute the Upload Files procedure in the field computer program.
•
click the List Files button to get data file names contained in the field computer. After several
seconds, when communication is established and tested, list of all available files to download will
appear in the left list box. At the same time the Download button will be activated.
•
select files to be downloaded from the logger. Selected files are highlighted.
12
Geonics DAT31W Operating Manual
•
•
click on Download. At this point a progress bar indicates the percentage downloaded for each file.
Transferred files will be displayed in the centre list box.
after transfer is completed files are automatically converted from raw EM31pro (extension name
R31) format to DAT31 format, with the extension name G31.
Please refer to section 3 (Transfer Data) for a detailed description of downloading a data file from the field
computer Pro4000.
Data files can also be downloaded from Pro4000 by alternative utilities, i.e. Juniper Systems program Lynx.
Procedure of Data File Transfer using program Lynx is described in Appendix B. These files (raw data files
with extension names R31) can be converted to DAT31 format (files with extension G31) by using the
Convert Files option which can be accessed from the main menu of the program.
2.2 Convert Files
Convert Polycorder 600 Files
The data acquisition program EM31-MK2, operating in the Polycorder, saves readings in a raw files format.
DAT31W uses the ASCII format of data files. These files are given the extension name G31. When the raw
data file is downloaded from the Polycorder it is converted at the same time to DAT31 (G31) format. In
cases where files in the DAT31 format (G31) are lost, accidentally overwritten, or not available for any
reason an option called Convert Files|Convert Polycorder 600 Files allows you to convert the Polycorder raw data files to ASCII files (G38).
To convert Polycorder files select Convert Files in the program menu and then select the Convert Polycorder 600 Files item. The Convert Polycorder EM31 Files to DAT31 Format window will appear (Figure
2.5).
Figure 2.5: Convert Polycorder EM31 Files to DAT31 (G31)
Format window
Select the file to be converted by clicking on the Input File button. An open file window will appear with
list of available files. (Polycorder files do not have extensions, therefore all files in the selected directory will
be displayed. The user has to select EM31 data files which were created in the Polycorder.) In a similar way
click on the Output File button and specify the output file name with extension G31. After both files are
displayed in the corresponding text windows the button Convert will be activated. When the Convert
button is clicked the selected Polycorder file is converted to G31 format. This file can subsequently be
loaded to the program as a “EM31 Profile” file.
The above procedure can be repeated for any number of remaining raw data files to be converted.
2. Quick Start
13
Convert EM31pro Files
The data acquisition program EM31pro, operating in the field computer Pro4000, saves readings in a raw
(binary) files format which are given the extension name R31. DAT31W uses the ASCII format of data
files. These files are given the extension name G31. When the binary (raw) data file is downloaded from the
field computer it is converted at the same time to DAT31 (G31) format. In cases where files in the DAT31
format (G31) are lost, accidentally overwritten, or not available for any reason an option called Convert
Files allows you to convert the raw data files (R31) to ASCII files (G31).
This function is also useful if the data acquisition program, EM31pro, is used on a laptop (EM31pro and
EM31proA run on any MS DOS compatible computer). In this case downloading raw data files is not
applicable and data files saved in R31 format can be rewritten to G31 using the Convert Files option. These
G31 files can be loaded to the DAT31W program on the same computer.
To convert R31 files select Convert Files in the program menu and then select the Convert EM31pro
Files item. The Convert EM31pro Files to DAT31 (G31) Format window will appear (Figure 2.6).
Figure 2.6: Convert EM31pro Files to DAT31 (G31) Format
window
Select the file to be converted by clicking on the Input File button. An open file window will appear with
list of available R31 files. In a similar way click on the Output File button and specify the output file name
with extension G31. After both files are displayed in the corresponding text windows the button Convert
will be activated. When the Convert button is clicked the selected R31 file is converted to G31 format. This
file can subsequently be loaded to the program as a “EM31 Profile” file.
The above procedure can be repeated for any number of remaining raw data files to be converted.
2.3 Displaying Data as Profiles
Loading and Displaying Data Files
To display data, select File|Open EM31 Profile File in the menu or click the left mouse button on the
toolbar
button (load EM31 Profile File). The Open EM31 File window will be displayed (Figure 2.7).
Select a directory and file name and then click on Open (you can also simply double click the left mouse
button or press Alt_O on the keyboard). The Open EM31 File window displays available files with the
extension name G31.
14
Geonics DAT31W Operating Manual
Figure 2.7: Open EM31 File window
After the file is loaded, data is displayed in the stacked profile format shown in Figure 2.8. Survey lines are
organized in panels, which contain recorded data. In general, each survey line belongs to a separate panel,
although, in the case where two or more survey lines have the same line name and same instrument mode,
Figure 2.8: DAT31W screen with stacked profiles
they will be placed in the same panel. In order to display these lines in separate panels the line names must
be changed.
Each panel will include one or more data types (channels) as specified in the Select Data Type window. This
window can be access from the main menu by selecting Display|Select Data Type or by clicking the
(Select Data Type) button located on the tool bar. See Select Data Type section below.
This description of the EM31 data types is used through the entire program in several windows. Orientation is supported only by the data acquisition program EM31-MK2 in Polycorder. Data files created by the
program EM31pro (in Pro4000) have always instrument Orientation 1.
By default all channels are displayed for all survey lines. The left vertical axis relates to the EM31 apparent
conductivity (Quad-phase component) and it is labeled in millisiemenses per meter (mS/m), while right axis
corresponds to the EM31 Inphase response and it is labeled in parts per thousands of Primary Field (ppt).
2. Quick Start
15
Selecting Survey Lines
When a data file is loaded, all survey lines are profiled. To display a selection of survey lines select
Display|Select Lines in the menu or click on the
toolbar button (Select Lines). The Select Lines
window is shown in Figure 2.9.
Figure 2.9: Select Lines window
Select and deselect lines to be displayed, by clicking on the line names in list boxes. The EM31 component,
dipole mode, and orientation of the instrument is displayed at each line as the EM31 Data Type. Buttons
Select All and Unselect All are also available. All highlighted line names will be profiled on the screen after
clicking OK button.
Deleting and Renaming Survey Lines
The most common initial task in data processing is deleting and renaming survey lines. Both tasks can be
accomplished in the Select Lines window (Figure 2.9).
To delete a survey line from the loaded set of data, click on the check box next to the Delete Line label.
When a check mark is visible, click on the appropriate line name in the line name list box. The letter D will
be displayed next to the line name. These lines will not be displayed nor written to the output file during
Save or Save As tasks.
Survey lines also can be renamed in the Select Lines window. Click on the name in the line names list: the
highlighted line name will appear in the edit box located at the Rename Line label. Edit the name in the Edit
Box and click the Rename Line button. The updated name will now be displayed in the line names list.
Please refer to section 4 (Data Display) for a detailed description of type of formats for data presentation.
Please note that Deleted and Renamed lines will be valid as long as the program
is running. In order to save changes permanently use “Save As” or “Save” option to create a new data file which can be used later by the program. It is
recommended that you use “Save As” and keep the original data in an unedited
form.
Changing Display Parameters
To adjust the range of displayed parameters select Display|Set Display Parameters in the menu or click
the left mouse button on the
toolbar button. The Set Display Parameters window is shown in Figure
2.10.
16
Geonics DAT31W Operating Manual
Figure 2.10: Set Display Parameters window
Selecting Channels to Display
To set the channels to be displayed select Display|Select Data Type in the menu or click the left mouse
button on the
toolbar button. The Select Data Type window is shown in Figure 2.11.
Figure 2.11: Select Data Type window
This window contains check boxes for each type of EM31 data. Each Type is described by a three character
abbreviation:
QV1
IV1
QH1
IH1
QV1
IV1
QH1
IH1
-
Quad-phase component (conductivity),
Inphase component,
Quad-phase component (conductivity),
Inphase component,
Quad-phase component (conductivity),
Inphase component,
Quad-phase component (conductivity),
Inphase component,
Vertical Dipole mode,
Vertical Dipole mode,
Horizontal Dipole mode,
Horizontal Dipole mode,
Vertical Dipole mode,
Vertical Dipole mode,
Horizontal Dipole mode,
Horizontal Dipole mode,
Orientation 1
Orientation 1
Orientation 1
Orientation 1
Orientation 2
Orientation 2
Orientation 2
Orientation 2
The Select Data Type window is divided into two sections, Show Profile and Show Value. The profile
section lets you select channels to be displayed as profiles. To select a channel click on the check box next to
the channel number. The Show Value section lets you choose the channels that will be displayed in numerical form in windows located below the toolbar.
Please refer to section 4 for a detailed description of the Select Data Type to Display procedure.
2. Quick Start
17
2.4 Editing Survey Geometry
The program lets you adjust line geometry by changing the placement of start and end stations. It also
allows you to reposition points that were marked with the fiducial switch.
Survey Conducted without Fiducial Markers
A survey that was carried without using the fiducial markers will generally not require any editing of data
positions. Corrections of common field errors, such as an incorrect start station or line direction, can be
made using the Set Line Limits or Shift Survey Lines option in the Edit Geometry menu shown in Figure
2.12.
Figure 2.12: Edit Geometry menu
Please note that ends of survey lines can also be easily adjusted by the Position
Markers tool even if during the survey fiducial markers were not used. The Start
and End stations of each survey line can be edited in the same way as stations
tagged by fiducial markers.
Survey Conducted with Fiducial Markers
If data was recorded with fiducial markers, the following two step procedure is recommended:
1.
Adjust the ends of the survey lines using either the Adjust Survey Line or Set Line Limits
option, or the Quick Adjust Survey Line tool (click the
toolbar button).
2.
If Line Segments are present, position the ends of the segments using the Position Line Segments tool (click the
toolbar button).
3.
Position the ends of the lines and fiducial markers using the Position Markers tool (click the
toolbar button).
18
Geonics DAT31W Operating Manual
Step 1
Press the Adjust Survey Line button and drag the end points, the start and final stations, to
approximately the correct locations. (Positions will be set more precisely in Step 3). This task will
involve repositioning of the final station only, provided that the start station entered in the data
logger during data collection gives the correct position on the survey grid. (If start stations were
not correctly labeled, it is likely that the horizontal axis will need to be re-scaled to accommodate
the full length of the survey grid before repositioning the end points.)
When using the Adjust Survey Line tool the following rules apply:
• repositioning the start station shifts the entire line, and the spacing between stations (increment) remains unchanged.
• repositioning the final station shortens or stretches the line. The start station remains in the
same position, and the increment is adjusted according to the final station change.
If a survey’s layout is relatively square or rectangular, then adjusting the survey lines can be made
easier by using the Set Line Limits window (select Edit Geometry|Set Line Limits).
After the end points of all lines have been adjusted to approximately correct positions, the fiducial
markers (assuming that they were regularly spaced in the field) should be roughly aligned across the
stacked profiles.
Step 2
This step is used only if Line Segments were used.
Line segments are marked by blue squares at end stations of segments. If an end of a segment is
the end station of the survey line, this station is treated by the program as the end of the survey
line.
Press the Position Line Segments
button on the tool bar or select Edit Geometry|Position
Line Segments. The Position Line Segment window will appear on the screen (similar to Position Markers window shown in Figure 2.13). This option can be applied to selected end stations or
to a group of end stations of line segments.
For Group positioning:
• check the Group box in the Position Line Segments window.
• use a mouse to drag a rectangle around the group of markers to be repositioned.
• use the speed buttons or keyboard to specify the station in the edit box.
• place the cursor inside the rectangle and click the left mouse button.
All selected stations will be moved to the specified station.
Repositioning any end station of the line segment shortens or stretches given segment.
Step 3
Press the Position Markers
button on the tool bar or select Edit Geometry|Position Markers. The Position Markers window will appear on the screen (Figure 2.13). This option can be
applied to selected markers or to a group of markers. Since all markers may be relatively close to
their true locations (following Step 1), using Group mode can be a fast method to reposition
several markers at once to a selected location.
2. Quick Start
19
Figure 2.13: Position Markers window
For Group positioning:
• check the Group box in the Position Marker window.
• use a mouse to drag a rectangle around the group of markers to be repositioned.
• use the speed buttons or keyboard to specify the station in the edit box.
• place the cursor inside the rectangle and click the left mouse button.
All selected markers will be moved to the specified station. The same procedure can be applied to
the start and final stations of survey lines.
The positioning of markers and end stations is described in detail in Section 5, where the procedure is
illustrated with an example.
2.5 Create XYZ File
This option creates an ASCII file containing three columns: X, Y, Z1, Z2 etc. (where Z1 corresponds to e.g.
conductivity in mS/m, depending on the Create XYZ File settings). This file can be used as an input file for
the GEOSOFT or SURFER contour packages (or any other, if a multi column format is suitable). All data
must be entered in the Load EM31 Profile File or Add menus prior to running this option.
Data can be converted directly to an XYZ file format by selecting the 2D Layout|Create XYZ File menu
option. Alternatively, the layout of the survey can first be examined by selecting the 2D Layout|View XYZ
menu, or clicking the View XYZ (W-E) or View XYZ (N-S) button on the tool bar. The view XYZ option
shows a two dimensional layout of stations and survey lines oriented either in the W-E or N-S directions.
Each station is represented by a dot on the screen. At this point the configuration of the layout can be
examined visually and corrected if required.
After the 2D Layout|Create XYZ File from the profile menu, or the File|Create XYZ File from the
View XYZ menu options is selected, the Create XYZ File window is displayed (Figure 2.14).
20
Geonics DAT31W Operating Manual
Figure 2.14: Create XYZ File window
Before creating the XYZ file the following parameters must to be specified:
Orientation of Survey Lines
Choose Regular W-E or S-N, or Arbitrary orientation of survey lines. The W-E orientation corresponds to a layout where lines are parallel and oriented in the X direction (assuming that the North
or Y coordinate points to the top, and that the East or X coordinate points to the right edge of a
page). The S-N orientation corresponds to the perpendicular layout, with survey lines oriented in
the Y direction. The Arbitrary option is designed for layouts where survey lines are not parallel.
If W-E orientation is selected, it is assumed that the line name gives the Y (S-N) coordinate and
stations are aligned along the X (W-E) axis. If survey lines are parallel and oriented in W-E direction, but line names do not correspond to the Y coordinate, then rename the lines in the Select
Lines window. It should be noted that if the line name starts with a number and ends with a letter,
e.g. 10N, only the number will be recognized as a Y coordinate.
If the S-N orientation is selected, the line name corresponds to the X (W-E) coordinate and stations are aligned along the Y (S-N) axis. Again, if survey lines are parallel and oriented in S-N
direction, but line names do not correspond to the X coordinate, then rename the lines in the Select
Lines window. It should be noted that if the line name starts with a number and ends with a letter,
e.g. 10E, only the number will be recognized as an X coordinate.
The Arbitrary option is used only if lines are not parallel. To use this option click the radio button
Arbitrary in the Create XYZ File window. The Arbitrary Orientation page becomes active (Figure
2.15).
2. Quick Start
21
Figure 2.15: Create XYZ File window with the Arbitrary option
After the Output File Name is specified and the Create button is clicked, two stations must be
entered for each survey line. In the edit box of Reference Station #1, enter the coordinates of the
start station of the displayed survey line. For Reference Station #2, enter the coordinates of any
other point on this survey line (assuming the line is a straight line only). A projection of coordinates for every station on the line will be calculated. Any XYZ file created with the arbitrary line
orientation can be viewed using the File|Open XYZ menu option, or by clicking the Open XYZ
File button on the tool bar.
Format
Indicate the appropriate option for the contouring software to be used. The Generic option will
create a multicolumn file without any text strings. This file can be used as an input file for many
contouring packages (including Geosoft and Surfer).
Select Data Type
To select the EM31 data type (component, dipole mode, and instrument orientation) to be written
in the output file click the corresponding radio button in the Select Data Type section of the Create
XYZ File window (Figures 2.14 and 2.15).
To select a data type click on the radio button next to the data type name (see Select Data Type
section of this chapter). Only one type of the EM31 data can be written to created XYZ file. Data
is always placed in the created XYZ file in the following order: X coordinate, Y coordinate, and one
type of data. The parameter Time (time stamp for each reading) will be placed in the last column of
the file (assuming that time stamp is present in data file). A comment line listing all parameters in
the file is placed as a header for each created XYZ file.
22
Geonics DAT31W Operating Manual
When the Output File Name button is clicked, a Select XYZ File Name window is displayed (Figure 2.16).
The EM31 file name with an extension corresponding to the selected output file format (xyz, dat, or asc) is
given as a default.
Figure 2.16: Select XYZ File window
Accept the default or specify a new file name and click the Save button. The Select XYZ File Name
window will close and the selected file name will be displayed at the bottom of the Create XYZ File window.
When you click on the Create XYZ File button a progress bar, located at the left bottom corner of the
window, will indicate the percentage of the created file that has been completed.
The creation of XYZ files is generally very fast for the W-E and S-N line orientation. Not surprisingly it is
a somewhat more lengthy process for the Arbitrary survey line orientations.
Files created by this portion of the program can be viewed at any time using the File|Open XYZ menu, or
by clicking the View XYZ File button located on the tool bar.
2. Quick Start
23
3. Data Transfer
This chapter describes the transfer of files (program and data files) between the Polycorder and the computer. Both
types of Polycorders, 600 and 720, can be used with the EM31-MK2 Polycorder program, while EM31 can be used
only in Polycorder 720 connected to analog EM31. The transfer of data files from the Pro4000 field computer
operating under the control of the EM31pro program is described in Section 3.5. The procedure of downloading
files from the Pro4000 applies to the Allegro field computer running program EM31proA.
3.1 Polycorder Communication Parameters
The Polycorder communication parameters are the same for all Uploading and Downloading procedures.
These parameters are usually properly set after resetting the logger with the RESET module. In case they
are modified, set the communication parameters (using Polycorder Mode 5-2) according to Table 3.1.
Table 3.1: Polycorder communication settings
Parameter
Setting
Parameter
Setting
INP LINE TERM
<CR>
BAUD RATE
9600
DATA BITS
8
INP MAX LENGTH
95
PARITY
N
TRANSMIT DELAY
0
STOP BITS
1
CHECKSUM
N
DUPLEX
H
END OF LINE SEQ
<CR><LF>
XMT PMTS
N
END OF PAGE SEQ
<CR><LF>
LINE REQ
A
END OF FILE SEQ
<CR><LF>
REPEAT REQ
B
MATING CALL
A or <CR>
CONTINUOUS REQ
C
BEEP TONE
55
STOP REQ
D
BEEP TIME
10
Character <CR> (Carriage Return) is represented on the Polycorder display as a left pointing arrow, while
<LF> (Line Feed) is shown as a check mark.
If DOS based programs are used for Uploading or Downloading files, change the parameter MATING CALL to <CR>. To set <CR> in the Polycorder press the following keys on the Polycorder
keypad: CTL (one key) 0 1 3.
If necessary, refer to the manufacturer documentation for more details regarding the Polycorder communication parameters.
3. Data Transfer
25
3.2 Upload Program Files to Polycorder
General Information
Normally, the Polycorder 600 and 720 that are supplied with the EM31-MK2 or EM31 systems contains all
the necessary programs for running the instruments. However, there are several circumstances when uploading
the Polycorder program files should be performed:
• Polycorder does not contain necessary programs.
• loading updated versions of Polycorder programs.
• changing instrument that will be used with the logger.
• after routine or necessary clean up of the Polycorder.
The Polycorder 600 is used with the EM31-MK2 (digital signal output) while the Polycorder 720 is used
with the standard EM31 (analog output).
However, it is possible however to collect EM31-MK2 data using the Polycorder 720. In
this case follow the procedures designed for the Polycorder 600, despite the fact that the
Polycorder 720 is used. Other words, if the used instrument cable (connecting the Polycorder and the instrument) is connected to a 37 pin Polycorder port, the Polycorder 720
files must be uploaded, and the Polycorder 720 is the only available logger. If the instrument cable is connected to the 25 pin Polycorder connector then the Polycorder 600 files
must be uploaded.
The Polycorder EM31 and EM31-MK2 program supplied with the Windows based software is almost
identical to the previous versions supplied with the DOS based DAT31 program. Data files created during
data collection are also compatible. The difference is in the downloading of files which is handled by new
routines, DUMP31W for the Polycorder 720 and DUMPWIN for the Polycorder 600. If data is to be
downloaded with Windows based software, a new version of the Polycorder programs (version 2.0 or later)
must be uploaded to the Polycorder.
If data is collected using an older version of Polycorder software it should be downloaded with the DOS
based software (DOS based DAT31) and then data files in DAT31 format processed with the DAT31W.
While data files in DAT31 format (G31) can be used in both DOS and Windows based software, raw data
files in Polycorder format have small differences. Therefore, if files were downloaded using DOS based
DAT31 and separate conversion to DAT31 format is required, these files must be converted using DOS
based DAT31. Similarly, if files were downloaded using DAT31W they can be converted using only Windows based DAT31W.
It is advised to reset the Polycorder and reload the programming after several days of use. This will keep the
directory file refreshed. The Polycorder has no system directory and the internal data file, DIRFILE, is
used to log all entered file names. When the directory file contains many file names, the downloading
procedure becomes more time consuming. In addition, there will be less choice in naming files. Since the
EM31-MK2 program does not allow the appending of data files, the file names present in the directory file
can not be used even in the case where they were previously deleted from the system.
The Polycorder is reset with the RESET module. To reset the Polycorder, make sure that all data are
downloaded and saved, since all data will be permanently deleted. Insert the RESET module to the Polycorder connector with the RESET label facing the operator and press the ON key (or OFF and ON if the
logger was ON initially).
26
DAT31W Operating Manual
Description of Polycorder Program Files
Two file types, format files and program files have to be transferred to the Polycorder to run the EM31 or
EM31-MK2 Polycorder programs. The Polycorder 720 requires two files: FORMDL.720 and EM31.720,
while the Polycorder 600 requires files FORM31.MK2 and EM31-MK2. These files are placed in the
subdirectory UploadFiles of the directory chosen during DAT31W installation. In addition, if short version of EM31-MK2 is used the Polycorder requires files FORMSH.MK2 and EM31-SH. A description of
Polycorder files is as follows:
Polycorder 600 files
FORM31.MK2 this file contains format files necessary for EM31-MK2 data files and two files:
DIRFILE directory file to log entered file names. Do not edit this file.
DUMMY01 small text file that can be safely erased in case additional memory is
needed to run downloading programs.
EM31.MK2
contains programs for Polycorder 600. It includes following programs:
EM31-MK2 data acquisition program for Geonics EM31-MK2 instrument.
DUMPWIN program to download data files while using DAT31W (Windows
based) computer program.
DUMP31
program to download data files while using DAT31 (DOS based)
computer program.
FORMSH.MK2 this file contains format files necessary for EM31-SH data files and two files:
DIRFILE directory file to log entered file names. Do not edit this file.
DUMMY01 small text file that can be safely erased in case additional memory is
needed to run downloading programs.
EM31-SH
contains programs for Polycorder 600 (short EM31-MK2). It includes following programs:
EM31-SH data acquisition program for short version of Geonics EM31-MK2.
DUMPWIN program to download data files while using DAT31W (Windows
based) computer program.
DUMP31
program to download data files while using DAT31 (DOS based)
computer program.
Polycorder 720 files
FORMDL.720 this file contains format files necessary for EM31 data files and two files:
DIRFILE directory file to log entered file names. Do not edit this file.
DUMMY01 small text file that can be safely erased in case additional memory is
needed to run downloading programs.
EM31.720
contains programs for Polycorder 720. It includes following programs:
EM31
data acquisition program for Geonics EM31 instrument.
DUMP31W program to download data files while using DAT31W (Windows
based) computer program.
DUMP
program to download data files while using DAT31 (DOS based).
BATTERY program to display status of the Polycorder 720 battery.
Format files (FORM31.MK2, FORMSH.MK2, FORMDL.720) can be loaded only
when the Polycorder is reset. The Polycorder system does not allow format files
to be overwritten.
Format file must be present in the Polycorder prior to uploading the corresponding program file.
3. Data Transfer
27
Download programs DUMP31, DUMPWIN, DUMP31W, and DUMP require about 500 bytes (corresponds to about 70 records) of free memory in the Polycorder. In cases where the Polycorder memory is
entirely used during field work and the dump program can not be run, erase the file DUMMY01 using the
Polycorder Mode 4-2.
When file DUMMY01 is erased and not immediately replaced through uploading,
create your own “dummy” file by recording a file with about 100 readings that
can be deleted, if necessary.
Uploading Files to the Polycorder
Select the Data Transfer|Upload Files to Polycorder 600 or Data Transfer|Upload Files to Polycorder 720 in the program menu (Figure 3.1).
Figure 3.1: Data Transfer menu
Note, that it is possible to collect EM31-MK2 data using the Polycorder 720. In
such a case, use the procedures designed for the Polycorder 600, despite the
fact the Polycorder 720 is used.
After clicking one of the Upload Files to Polycorder... item shown in Figure 3.1, the Upload Files From
PC to Polycorder window will appear (Figure 3.2). In this figure, files FORM31.MK2 and EM31.MK2 for
the standard EM31-MK2, and FORMSH.MK2 and EM31-SH for short version of the EM31-MK2 are
displayed in the Files to Upload list box When the Polycorder 720 is uploaded, files FORMDL.720 and
EM31.720 will be listed.
Figure 3.2: Upload EM31 Files from PC to Polycorder 600 window
28
DAT31W Operating Manual
Normally, the Polycorder files are located in the subdirectory UploadFiles of the program folder (chosen
during installation). The program checks this subdirectory. If the Files to Upload list box does not contain
necessary files, click the Browse button to locate the Polycorder files.
Change of the port assignment can be done by clicking the Down arrow button in the field labeled Current
Port. The pull down list box will be displayed, as shown in Figure 3.3. Select required COM port number.
Figure 3.3: Selecting serial port number
To upload files to the Polycorder, follow the instructions on the screen (Figure 3.2). Select a file by clicking
the left mouse button on the name in the list box. The file name will be highlighted and the Upload button
will be activated. Using the left mouse button, click the Upload button and then, with the Polycorder
turned ON, enter the Polycorder Mode 3-2. Information reminding you to enter Polycorder Mode 3-2 is
displayed (Figure 3.4). If Polycorder Mode 3-2 is not entered during 15 seconds the program will reset the
Upload File window.
Figure 3.4: Upload File window waiting for Polycorder entry
After Mode 3-2 in the Polycorder is entered, uploading starts, which should be confirmed by an updated
graphic and by a progress bar located at the bottom of the Upload File from PC to Polycorder window
3. Data Transfer
29
Figure 3.5: Upload EM31 Files from PC to Polycorder 600
window during transmission
(Figure 3.5).
When a file is uploaded, the file name is displayed in the Uploaded Files list box. At this point the next file
can be uploaded.
Format files are loaded very quickly (within a few seconds), whereas uploading of the program files, EM31.720
and EM31.MK2, will take approximately 8 minutes.
If there is a problem during the transmission of files, the progress bar will stop moving. At this point you
should check the cable and the communication parameters.
3.3 Download Data from the Polycorder
Data File Formats
Data files in the logger are formatted in proprietary Polycorder format. The Polycorder format is different
for the Polycorder 600 and Polycorder 720. The Polycorder 600 (EM31-MK2) data is saved in one data file.
The Polycorder 720 (EM31) data set is saved in two files: Header file and Data file. Header and Data files
have a common base name, but different prefixes, H for header and D for data files.
Files in the Polycorder format (either Polycorder 600 or Polycorder 720) are automatically converted to the
DAT31 format during the downloading of data. These new files have same base name with an added
extension name G31. Files in the DAT31 format can be loaded and processed by the DAT31W program.
While only files in the DAT31 format are used in data processing, it is strongly advised that data in the
Polycorder format be saved as well. In case of any hardware malfunction, e.g. a damaged instrument cable,
only the file in Polycorder format may indicate the source of the problem. Additionally, Polycorder files also
contain useful information about the instrument settings used during field work. Files in the Polycorder
format can be converted to the DAT31 format at any time using the Convert Files option of the DAT31W
menu.
Description and samples of EM31 files in the Polycorder 600 and Polycorder 720 formats, as well as an
example of a file converted to the DAT31 format are placed in Appendix A.
30
DAT31W Operating Manual
Download Procedure
Select Data Transfer in the program menu and then click the Download EM31-MK2 Files from Polycorder 600 or Download EM31 Files from Polycorder 720 menu item (Figure 3.6).
Figure 3.6: Data Transfer menu
Note, that it is possible to collect EM31-MK2 data using the Polycorder 720. In
such a case, use the procedures designed for the Polycorder 600, despite the
fact the Polycorder 720 is used.
After clicking the Download Files from Polycorder item shown in Figure 3.6, the Download data from
Polycorder window will appear (Figure 3.7).
Figure 3.7: Download EM31 Files from Polycorder window
The Download data from Polycorder window has three list boxes. The first from the left, labeled Logger
File(s) and Size will contain, after List Logger Files button is clicked, a list of data files located in the
Polycorder and available to download. Along with file names, their size in bytes is displayed. The second list
box, labeled Transferred Files(s), will list downloaded data files in Polycorder format, and the third, Converted File(s), will list files converted from Polycorder to DAT31 format. If file names, either in Polycorder
or DAT31 format, exist on the computer hard disk, an underscore followed by a number will be added to
the base name, e.g. file name ABC would be changed to ABC_1 and ABC_1.G31.
The directory where transferred files will be placed can be selected by using the Browse function. Click the
Browse button with the left mouse button and the Select Directory window will be displayed (Figure 3.8).
After the directory is selected, it will be displayed in the bottom part of the Download data from Polycorder
window. The selected directory will be saved and it will be displayed as a default directory during subsequent
DAT31W executions. If the directory is removed the main directory on C: drive will be used as a default
directory.
3. Data Transfer
31
Figure 3.8: Select Directory for EM31 Files
Change of the port assignment can be done by clicking the Down arrow button in the field labeled Current
Port. The pull down list box will be displayed, as shown in Figure 3.9. Select required COM port number.
Figure 3.9: Selecting serial port number
To start downloading the data files, connect the Polycorder and computer with the dumping cable.
Run the Polycorder program DUMPWIN for Polycorder 600, or DUMP31W for the Polycorder 720. (To
run program in the Polycorder: enter MODE 0, select program name and press ENTER).
Do not mistake the above programs with DUMP or DUMP31 files, which are
included in the Polycorder for DOS based program only.
Using the left mouse button click the List Files button. After several seconds the Logger File(s) and Size
list box will be updated with names of data files available for download (Figure 3.10). At the same time, the
window buttons Download , Select All, and Disconnect will be activated.
32
DAT31W Operating Manual
Figure 3.10: Download EM31 Files... window after Logger
Files are listed
Select the files to be downloaded from the Polycorder by clicking on individual file names in the list box or
click the Select All button to select all available files. When selection of files is complete, click the Download
button. At this point the name of each transferred file is displayed at the bottom of the window and a
progress bar indicates the percentage of downloading completed for each file. Transferred files (in Polycorder format) will be displayed in the centre list box. After the transfer of all selected files is complete, files
in the Polycorder format are automatically converted to the DAT31 format (with extension name G31).
Converted files will be displayed in the Converted File(s) list box (Figure 3.11).
Figure 3.11: Download EM31 Files... window during data
transfer
Data transmission can be stopped at any time by clicking the button STOP located at the window bottom.
All other buttons are disabled during downloading data.
Converted files (with G31 extension name) can be loaded and processed further in the DAT31W program.
Click the Disconnect button to cancel communication with logger. The Download EM31 Files from
Polycorder 600 (or 720) window will remain on the screen and the next data transfer session (i.e. from
another logger) can be performed. Clicking the Exit button will stop Data Transfer function and the
Download EM31 Files from Polycorder 600 (or 720) window will disappear.
3. Data Transfer
33
3.4 Download EM31pro Files from Pro4000
This chapter describes the transfer of data files from a field computer Pro4000 to PC computer using
Download EM31pro Files from Pro4000 option of the DAT31W program. Data files can be downloaded by alternative utilities (e.g. ProShell, Lynx, or FileScout in Allegro Field PC) and then these files can
be converted to DAT31 format using option Convert Files|Conver EM31pro Files in the DAT31W
menu.
Data File Formats
Data files in the field computer are formatted in proprietary EM31pro format. The EM31pro data is saved
in one data file with the extension name R31.
Files in the logger format are converted to the DAT31 format during the downloading of data. These new
files have same base name with an added extension name G31. Files in the DAT31 format can be loaded
and processed by the DAT31W program.
While only the DAT31 format is used in data processing, it is strongly advised that data in the raw (EM31pro)
format be saved as well. In the case of any hardware malfunction, i.e. a damaged instrument cable, only the
file in logger format may indicate the source of the problem. Additionally, raw data files also contain useful
information about the instrument settings used during field work. Files in the EM31pro format can be
converted to the DAT31 format at any time using the Convert EM31pro Files option of the DAT31W
menu.
Description and sample of the EM31-MK2 files in the EM31pro format, as well as an example of a file
converted to the DAT31 format are placed in Appendix A of DAT31W manual.
Download Files Procedure
To start downloading files from the field computer, select the Data Transfer item in the program menu
and then click on Download EM31pro Files from Pro4000 from the menu item (Figure 3.12)
Figure 3.12: Data Transfer menu
After you click the Download EM31pro Files from Pro4000 item, the Download EM31 Files from Pro4000
window will appear (Figure 3.13).
34
DAT31W Operating Manual
Figure 3.13: Download EM31 Files from Pro4000 window
The Download window has three list boxes. The first from the left, labeled Logger Files will contain, after
the List Files button is clicked, a list of data files located in the field computer and available to download.
File names, with their size in bytes will be displayed as well. The second list box, labeled Downloaded Files,
will list downloaded data files in the EM31pro format, and the third, Converted Files, will list files converted
to DAT31 format. If a file name already exists on the computer hard disk, an underscore followed by a
letter will be added to the base name. (ie. file name ABC.R31 would be changed to ABC_1.R31, ABC_2.R31,
and so on.)
To select the directory where transferred and converted files will be placed click the Browse button. The
Select Directory for EM31 Files window will be displayed (Figure 3.14).
Figure 3.14: Select Directory for
EM31 Files window
After the directory is selected, it will be displayed in the text box labelled Save In at bottom part of the
Download EM31pro Files from Pro4000 window. The selected directory will be saved and it will be used as
the default directory during subsequent DAT31W executions. If this directory is removed the C:\ directory
will be used instead.
Change of the serial port assignment can be done by clicking the Down arrow button in the field labeled
Current Port. The pull down list box will be displayed, as shown in Figure 3.15. Select required serial (COM)
port number.
To start downloading the data files, connect the field computer (Pro4000) and PC computer with the serial
cable.
3. Data Transfer
35
Figure 3.15: Select serial port number
Run the EM31pro program in the logger. In the Main menu of the program select Upload Files option,
and press <ENTER>. The logger screen will display the message “Waiting for PC” (shown in Figure
3.16) for up to 1 minute (if time elapses repeat the procedure). On the computer click the List Files button
Figure 3.16: Pro4000 screen
in the Download EM31pro Files from Pro4000 window. At that time both programs (EM31pro and
DAT31W) will establish and test the communication at the highest possible speed of data transfer. After
several seconds the Logger Files list box will be updated with the names and sizes of data files available for
download (see Figure 3.17). At the same time, the Download and Disconnect buttons will be activated,
and the List Files button will be deactivated.
Figure 3.17: List of files available in Pro4000 for Download
in Download EM31 Files from Pro4000 window
36
DAT31W Operating Manual
Select the files to be downloaded from the logger by clicking on individual file names in the list box (Figure
3.18) or click the Select All button to select all available files. When all files are selected the Select All
button will change to the Unselect All button.
Figure 3.18 Selecting files to download
When file selection is complete click the Download button. The name of each transferred file is displayed
at the bottom of the window as it transfers and a progress bar indicates the percentage completed, as
shown in the Figure 3.19.
Figure 3.19: Download window during data transmission
At the same time the logger screen displays transmitted file name and percentage of completed uploading
(Figure 3.20). The transfer procedure can be stopped at any time by pressing <Esc> key on the logger
keypad.
Figure 3.20: Pro4000 screen
during data transfer
3. Data Transfer
37
Transferred files (in EM31pro format) will be displayed in the centre list box. After the transfer of all
selected files is complete, files in the EM31pro format are automatically converted to the DAT31 format
(with extension name G31). Converted files will be displayed in the Converted Files list box (see Figure
3.21). Converted files (with extension name G31) can be loaded and processed further in the program.
Figure 3.21: Download EM31 Files from Pro4000 after
downloading selected files is completed
Click the Disconnect button to cancel communication with logger. The Download EM31 Files from
Pro4000 window will remain on the screen and next data transfer session (i.e. from another logger) can be
performed. Clicking the Exit button will stop Data Transfer function and the Download EM31 Files from
Pro4000 window will disappear.
38
DAT31W Operating Manual
4. Loading and Displaying Data
Three types of files can be loaded to the DAT31W program. Files containing EM31 readings and displayed in the
program as profiles have the extension name G31. These files are described in this section. The Polycorder and
Pro4000 (with extension R31) raw data files and DAT31 file (G31) formats are described in Appendix A.
DAT31W can also display the spatial distribution of stations in XYZ files, and the text of any ASCII file. The latter
function is similar to Windows Notepad, and is limited to files not exceeding 64Kbytes in size in Windows 95 and
98.
4.1 Loading EM31 Profile Files
Loading Data File
To display data select File|Open EM31 Profile File in the menu (Figure 4.1) or click on the
button (marked by a yellow file symbol).
toolbar
Figure 4.1: DAT31W File menu
The Open EM31 Profile File window will be displayed (Figure 4.2). Select the directory and file name and
then click the Open button (or double click the left mouse button, or press Alt_O on the keyboard). Data
files in DAT31 format have the extension name G31.
4. Loading and Displaying Data
39
Figure 4.2: Open EM31 File window
When a larger data file in DAT31 format is loaded to the program a progress bar shows the percentage of
file loaded (Figure 4.3).
Figure 4.3: Progress Bar during Loading .G31 File
After a DAT31 profile file is loaded, data is displayed in a stacked profile format as shown in Figure 4.4.
Survey lines are organized in panels, which contain the recorded readings. In general, each survey line
surveyed in one instrument mode appears in a separate panel. In the case where two or more survey lines
have the same line name, however, they will be placed in the same panel. In order to display these lines in
separate panels the line names must be changed (see section 4.3).
Figure 4.4: DAT31W screen with stacked profiles
In each panel the data type selected for display (see section 4.4 below) are profiled. In default settings, all
data types (both components, both dipole modes, and both instrument orientations) are profiled. The left
vertical axis corresponds to EM31 Quad-phase component (conductivity) in milliSiemens/m (mS/m), while
the right axis is assigned to EM31 Inphase component in parts per thousands (ppt) of Primary Filed..
40
Geonics DAT31W Operating Manual
Loading Additional Data Files to Separate Windows
To display more data in a separate window select File|Open EM31 Profile File in the menu (Figure 4.5)
toolbar button (marked by yellow file symbol).
or click the left mouse button on the
Figure 4.5: DAT31W File menu
The Open EM31 File window will be displayed (Figure 4.2). Select directory and file name and then click
the Open button (or double click the left mouse button, or press Alt_O on the keyboard).
After the new profile file is loaded, data is displayed in a stacked profile format in a new window, as shown
in Figure 4.6. Any number of windows (limited only by the memory of the computer) containing separate
Figure 4.6: DAT31W screen with stacked profiles in two windows
4. Loading and Displaying Data
41
files can be opened. This includes multiple entry of the same file name, so the same data set can be displayed in separate windows. Windows can be resized or tiled (vertically or horizontally) using the Window
menu. The menu displayed at the top of the screen is always associated with the active window.
Adding Data to the Existing Window
To insert data to the existing window select File|Add EM31 Profile File in the menu (Figure 4.5). The
Open EM31 File window will be displayed (Figure 4.2). Select directory and file name and then click the
Open button (or double click the left mouse button, or press Alt_O on the keyboard).
After the new profile file is loaded, data is appended to the existing data set and displayed in a stacked profile
format in the same window (Figure 4.7). Any number of files (limited only by the capacity of the computer
memory) can be loaded to one window.
Figure 4.7: DAT31W screen with content of three files in one window
Data loaded to one window can be saved only as a single file. After several files are loaded to one window it
is worthwhile saving the data set (using function Save As) as a separate data file in order to preserve the
content of the original data files.
4.2 Closing Profile Window and Saving Data
Closing Active Window
To close any active window select File|Close in the menu (Figure 4.8). This procedure can also be performed by clicking the close button of the active window.
42
Geonics DAT31W Operating Manual
Figure 4.8: DAT31W File menu
If any data processing was performed on the loaded data set and items not saved using Save nor Save As
functions (see below), a Save Changes window will appear as shown in Figure 4.9.
Figure 4.9: Save Changes window
Clear Workspace
To close all existing windows (data files) select File|Clear Workspace in the menu (Figure 4.8). Any
editing of data is not saved during this procedure.
Save Data
To save data to the currently opened file select File|Save in the menu (Figure 4.8) or click the left mouse
button on the
toolbar button. If several files are open, the caption displayed at the top of the active
window will be used as the file name.
It is recommended that you use the option Save As, to maintain the original
data in an unedited form.
4. Loading and Displaying Data
43
Save Data to Specified File (Save As)
To save data to a different file select File|Save As from the top menu (Figure 4.8). The Save As window will
be displayed (Figure 4.10). Select a directory, specify a file name and then click the Save button (or double
click the left mouse button, or press Alt_S on the keyboard). Data files containing EM31 readings will have
the extension name G31.
Figure 4.10: Save As window
4.3 Select, Delete and Rename Survey Lines
Selecting Survey Lines
When a data file is loaded, all survey lines contained in the file are displayed. To display a selection of survey
lines select Display|Select Lines from the top menu (Figure 4.11) or click the left mouse button on the
toolbar button.
Figure 4.11: DAT31W Display menu
44
Geonics DAT31W Operating Manual
The Select Lines window is shown in Figure 4.12. In the top right section the number of available survey
lines (Total), the number of currently selected lines (Selected.), and the number of deleted lines (Deleted)
are displayed.
Figure 4.12: Select Lines window
The left list box, labeled Available Lines, displays all available lines, data type (EM31 component, dipole
mode, and orientation). The right list box, labeled Selected Lines, shows the lines selected for display. When
saving data (Save or Save As options), data will be saved in the order shown in the Select Lines window.
Select (and deselect) lines to be displayed by clicking the line names in the corresponding list box. Select All
Lines/Unselect All Lines are also available. All highlighted line names will be displayed on the screen after
clicking the OK button. Figure 4.13 is an example of a screen with three selected lines. (The corresponding
Select Lines window is shown in Figure 4.12.)
Figure 4.13: The DAT31W screen with selected lines.
The selection of lines has no effect on the execution of Save, Save As, and Create XYZ File options.
Select Lines only affects the current display. Therefore, one or two survey lines can be displayed and
examined in detail and then saved with all other (not deleted) survey lines to a new file.
4. Loading and Displaying Data
45
Deleting Survey Lines
You can delete and rename lines with the Select Lines window (Figure 4.12).
To delete a survey line from the loaded set, first click the Delete check box. When a check mark is visible in
the box click the appropriate line name in the list box. The letter D will be displayed next to the line name
(and corresponding sensor type and instrument mode) in the Available Lines list (Figure 4.14). These lines
will not be displayed nor written to the output file during Save, Save As, Create XYZ File tasks.
Figure 4.14: Select Lines window during Delete Line procedure
Lines can be undeleted as well. To undo previously deleted lines (as long as program is running), first click
the Undo Delete check box. When a check mark is visible in the box click the appropriate line name (with
letter D next to its name) in the list box. The letter D will disappear and the survey line can be displayed,
edited, and saved.
Renaming Survey Lines
You can rename survey lines in the Select Lines window as well. Click on the appropriate line name in the
list box. The highlighted line name will appear in the Rename Line edit box (Figure 4.15). Enter the name
and click the Rename Line button. The updated name will now be displayed in the line names list.
Figure 4.15: Select Lines window during Rename Line procedure
Deleted and Renamed lines will be valid as long as the program is running. In
order to save changes permanently, use the Save As option to create a new data
file which can be used later by the program. It is recommended that you use
the option Save As in order to maintain the original data in an unedited form.
46
Geonics DAT31W Operating Manual
4.4 Select Data Type
To select the type of data to be displayed select the Display|Select Data Type from the top menu (Figure
4.11) or click on the
toolbar button. The Select Data Type window will appear as shown in Figure 4.16.
Figure 4.16: Select Channels window
The window lists all available EM31 data types. Futher, this window is divided to two sections, Show Profile
and Show Value. Each section contains check boxes for all types of EM31 data. Data Type names are
described by three labels which are explained below:
QV1
IV1
QH1
IH1
QV1
IV1
QH1
IH1
-
Quad-phase component (conductivity),
Inphase component,
Quad-phase component (conductivity),
Inphase component,
Quad-phase component (conductivity),
Inphase component,
Quad-phase component (conductivity),
Inphase component,
Vertical Dipole mode,
Vertical Dipole mode,
Horizontal Dipole mode,
Horizontal Dipole mode,
Vertical Dipole mode,
Vertical Dipole mode,
Horizontal Dipole mode,
Horizontal Dipole mode,
Orientation 1
Orientation 1
Orientation 1
Orientation 1
Orientation 2
Orientation 2
Orientation 2
Orientation 2
The Select Data Type window is divided into two sections, Show Profile and Show Value. The profile
section lets you select channels to be displayed as profiles. To select a data type click on the check box next
to the data type name in the Show Profile section. Data Types selected in the Show Value section of the
Select Data Type window (Figure 4.16) will be displayed in display boxes located under the toolbar. To
select a data type click on the check box next to the data type name.
After all parameters are selected click the OK button located at the bottom of the window. Clicking the
Cancel button will cancel the selection and the display will not change.
4.5 Changing Display Parameters
The display parameters can be changed by using the Set Display Parameters window or by employing
Quick scale adjustments accessible from the tool bar. The Quick scale adjustments provide a simple and
interactive means of adjusting the display parameters. The Set Display Parameters window allows for a
more detailed setting of parameter while viewing the data.
4. Loading and Displaying Data
47
Set Display Parameters Window
To open the Set Display Parameters window (Figure 4.17) select Display|Set Display Parameters from
toolbar button.
the top menu (Figure 4.11) or click the left mouse button on the
Figure 4.17: Set Display Parameters window
This option allows a range to be set for the length of the line (stations displayed), and the EM31 conductivity and Inphase amplitudes. The major and minor axis tick intervals are also controlled through this window.
(Labels and optional grid lines are plotted at the major ticks only.) After all parameters are set, press the OK
button and the profile display will be updated.
Quick Change of Horizontal and Vertical Scales
To adjust the horizontal range of the profiles can select Display|Change Horizontal Scale|... in the
menu (Figure 4.18), but it is much more convenient to use the buttons located on the toolbar (Figure 4.19).
To access the functions click on the appropriate toolbar button.
Figure 4.18: Change Horizontal Scale menu
48
Geonics DAT31W Operating Manual
Figure 4.19: Change Horizontal Scale
toolbar buttons
These options allow a quick change of the horizontal scale in increments equal to the minor tick setting
(refer to the Set Display Parameters Window earlier in this section). The options are self explanatory.
Buttons shown in Figure 4.19 are (from left): compress, expand, fit to the page, shift left and shift right.
To adjust the vertical parameter scale you can select the Display|Change Vertical Scale|... in the menu
(Figure 4.20), but, as for horizontal scale, it is much more convenient to click on the appropriate toolbar
buttons (Figure 4.21).
Figure 4.20: Change Vertical Scale menu
Figure 4.21: Change Vertical Scale
toolbar buttons
These options allow a quick change of the vertical scale in increments equal to the minor tick setting. The
menu options are self explanatory. The buttons shown in Figure 4.21 are (from left): compress, expand,
shift up, shift down, and scale according to the minimum and maximum values of the response.
4.6 Data Info
To obtain information about data entered into the program select Display|Data Info in the menu (Figure
4.20). The Data Information window that will appear is shown in Figure 4.22.
This window is divided in to four portions. The largets, top portion of the window shows Start and End
station, number of readings, and availability of time stamp for each surevy line. The left vottom part
presents minimum and maximum values for each data type present in the data set. The right bottom part of
the Data Information window shows total number of survey lines, number of readings, and minimum and
maximum values for stations. At the bottom, the symbols used to denote the start and end station of each
line, end of line segments, markers and comments are displayed.
4. Loading and Displaying Data
49
Figure 4.22: Data Information window
4.7 Grid Lines
To obtain horizontal and/or vertical lines at major ticks along the axes, select Display|Conductivity Grid,
Display|Station Grid , or Display|Inphase Grid from the display menu (Figure 4.20). These options
can also be selected by clicking on toolbar buttons
,
, or
corresponding to Conductivity Grid,
Station Grid, or Inphase Grid. The screen with grid lines is shown in Figure 4.23.
Figure 4.23: DAT31W screen with grid lines
50
Geonics DAT31W Operating Manual
Grid lines are plotted across each panel at corresponding major ticks as light grey lines. These options can
be useful in examining the alignment of anomalies which are distributed across more than one survey line,
as well as for comparing anomaly amplitudes.
4.8 Moving Bar
To obtain a vertical line (bar) that can be dragged by the mouse across survey lines, select Display|Show
Moving Bar item from the top menu (Figure 4.20). Or you can click on the toolbar button . A vertical
line will appear on the display (Figure 4.24). To move the line, move the mouse to the line and drag (holding
the left mouse button depressed) either left or right. This option can be useful in examining the alignment
of anomalies which are distributed across more than one survey line.
Figure 4.24: DAT31W screen with the moving bar
4.9 Set Line Attributes
To change the colour and/or thickness of the profile lines of each channel select Display|Set Line Attribute from the top menu (Figure 4.20). The Set Line Attributes window is shown in Figure 4.25.
Each profile line is of a different type, given by the data type name indicating instrument component, dipole
mode, and orientation (see section 4.4). The line types are displayed in the left list box together with samples
of the lines. To change colour or thickness, click the appropriate line in the list box, then click the desired
colour bar in the Colour box and thickness in the Width box. If a colour not provided in the Colour box is
desired, click the Custom button and the Colour window with a larger selection of available colours will be
displayed (Figure 4.26).
4. Loading and Displaying Data
51
Figure 4.25: The Set Line Attributes window
Figure 4.26: The Color window
The background colour can be changed as well. Click the Background button and the window shown in
Figure 4.26 will appear.
After all attributes are set, click the OK button and the profile display will be updated. Line attributes are
written to the DAT31W initial file (DAT31W.INI): during future executions of the program these attributes
will be used as default settings.
4.10 Refresh Screen
To redraw the screen, select the Display|Refresh Screen item in the Display menu (Figure 4.20) or click
toolbar button. The entire screen will be redrawn immediately.
the left button on the
52
Geonics DAT31W Operating Manual
5. Editing Data
To display the Edit Data menu select Edit Data from the main menu at the top of the screen (Figure 5.1).
Figure 5.1: DAT31W Edit Data menu
The Edit Data menu contains the following five items:
Edit Reading is used to display the numeric values of readings, delete selected readings, change values of
any data type, and insert or remove fiducial markers.
Shift Data Set is used to increase or decrease selected channels readings for the entire data set, or selected
survey lines.
Correct Linear Drift function allows you to remove linear offset for all data types.
Smoothing is used to smooth data using linear and quadratic filters.
5.1 Edit Reading
To display the Edit Reading window select Edit Data|Edit Reading from the main menu (Figure 5.1).
The Edit Reading window is shown in Figure 5.2.
5. Editing Data
53
Figure 5.2: Edit Readings window
Survey lines are selected in the section labelled Current Line. Any line can be selected by displaying a pull
down list of available lines (Figure 5.3) and clicking on the one wanted. The name of the selected line is
displayed in the Current Line display box.
Figure 5.3: Editing Readings window with list of Survey Lines
Readings are displayed in the list box located in the central portion of the window. Each row in this box
displays: the station number Stn, the fiducial marker M (fiducial marker: N - no marker, F - marker, Y - non
active marker), and QV1, IV1, QH1, IH1, and then after horizontal scrolling QV2, IV2, QH2, and IH2
(readings in mS/m or ppt). The scroll bar located at the right edge is used to scroll through the stations of
the selected line. Scrolling can also be performed using the keyboard Up and Down keys. A short grey bar
on the profile display indicates the position of the active (highlighted) reading (Figure 5.4). A row of edit
boxes with values corresponding to the selected station is located at the bottom of the Edit Readings
window. These boxes are used to editing readings.
Closing the Edit Reading window with OK, or the close window button (right top corner of the window)
will temporarily save all changes performed while the window was active. Changes can be saved permanently with the Save or Save As options (Section 4.2). Pressing the Cancel button will discard any editing,
and data will be returned to original values.
54
Geonics DAT31W Operating Manual
Figure 5.4: Edit Reading window with a vertical bar indicating position of the
station in the profile view.
Deleting Readings
To delete the readings at a station, click on the station in the list box of the Edit Reading window (Figure
5.4). The readings at that station will be highlighted. Then click the Delete button. Values for all channels at
the station will be removed. Figure 5.5 shows a data set with four stations removed. Readings are removed
from the profile view at the same time.
Figure 5.5: Edit Reading window during Delete Reading procedure
5. Editing Data
55
The Delete Reading function can be applied to any number of stations. To undelete readings click the
Undo button which restores removed stations one by one. The Undo function has an unlimited number of
steps.
Updating Readings
To update the value of any reading, click on the appropriate station. The selected station will be highlighted.
At the same time, values for the first five channels, as well as the status of the fiducial marker will be
displayed in the edit boxes located in the bottom of the Edit Readings window (Figure 5.6).
Figure 5.6: Edit Readings window during editing value of readings
To edit any of these values, click on the appropriate edit box. After entering the new value(s) press the
Update button. Updated values will be displayed in the station list box, and the profile view will be updated
in real time (Figure 5.6).
The status of the fiducial marker can be changed using the same procedure. The character N indicates that
no fiducial marker is associated with the station. Character F indicates a fiducial marker is present, and Y
indicates that a fiducial marker is present but is not active (for the purpose of adjusting the data - see
Section 6). Only active markers can be introduced in the Edit Reading window. To tag a station with a
marker in the Edit Reading window just replace the character N (in the box labeled Mkr) by F or Y. After
clicking the Update button the character F will be displayed in M column at the edited station. The profile
display will be updated simultaneously.
Note that changes can be removed by clicking the Undo button. The Undo function associated with this
procedure removes changes one by one and has an unlimited number of steps.
Note that changes are saved temporarily in the in the program memory while
the window associate with the data set is active. Changes can be saved permanently with the Save As option as discussed in Section 4.2.
(We recommend to use Save As instead of Save, to preserve the original data.)
56
Geonics DAT31W Operating Manual
5.2 Shift Data Set
To display the Shift Data Set window select Edit Data|Shift Data Set from the main menu (Figure 5.1).
The window that will appear is shown in Figure 5.7.
Figure 5.7: Shift Data Set window
The shifting of data function - to increase or decrease the values of all readings on a survey line by a
constant amount - can be applied to any number of selected survey lines and to any selected data types.
Click on the All Lines button to shift data for all survey lines listed in the Select Lines list box. Data is
shifted in increments specified in edit boxes labeled Shift Value located in the right section of the Shift Data
Set window. The increment can be set from the keyboard (after positioning the cursor in the edit box), or
with the speed buttons located at the right edge of each edit box. Increment 0 causes no shift for the data.
To shift data for the selected survey lines click on the Up or Down button. The total shift will be shown in
the display box labeled Total Shift and the graphic display (profile view) will be updated in real time. The
original curves will be displayed in grey. The screen with the shifted readings is shown in Figure 5.8.
Figure 5.8: DAT31W screen during Shift Data procedure
5. Editing Data
57
To close the Shift Data Set window click on OK or the close window button. This will temporarily save any
changes in the data set.
5.3 Linear Drift Correction
To display the Linear Drift Correction window select Edit Data|Linear Drift Correction from the main
menu (Figure 5.1). The window that will appear is shown in Figure 5.9.
Figure 5.9: The Linear Drift Correction window
Editing the Entire Survey Line
The linear shifting of data - to increase or decrease the values of all readings along the survey line as
determined by a linear interpolation between the values at the two end points - can be applied to any
number of selected survey lines. To select lines point and click the left mouse button on all appropriate lines
in the list box labeled Lines. Data are shifted in increments which must be specified in the edit boxes labeled
Left End and Right End located in the top right part of the window. Increments (steps) can be entered
from the keyboard, after positioning the cursor in the edit box. Increment values apply to all data types.
Select data to be edited in the list box labeled Data Type. Increment must be specified separately for each
end station of the survey line, left and right end of the graphic display (regardless how actual Start and Final
stations of the survey lines are located).
After the step is specified, data can be changed by pressing the speed buttons located at the right side of the
Increment edit boxes labeled Left End and Right End. The values of steps for stations located between the
start and end stations will be calculated using linear interpolation. Values of the total shift will be shown in
the display boxes labeled Total Change. The graphic display will be updated in real time. The original
curves will be displayed in grey. The screen with the shifted readings (Conductivity curve of the selected
survey line) is shown in Figure 5.10.
Where results are not satisfactory, changes can be removed by clicking the appropriate speed button until
the Status value displays 0.
58
Geonics DAT31W Operating Manual
Figure 5.10: The DAT31W screen during Linear Drift Correction for the Entire Line
Editing a Segment of the Survey line
To correct drift from within a segment of the survey line only click the Segment(s) button located in the
Apply to window (Figure 5.9). The Segment Ends section will be activated as shown in Figure 5.11.
Figure 5.11: The DAT31W screen during Linear Drift Correction of Line Segments
After specifying a segment of the survey line, the procedure is the same as for correction of the entire line.
Changes will be applied only within the specified segment. An example is shown in Figure 5.11.
Closing the Linear Drift Correction window using OK or the close window button will temporarily save any
changes in the data set.
5. Editing Data
59
5.4 Smooth Data
To display the Smooth Data window select Edit Data|Smooth Data from the main menu (Figure 5.1).
The window that will appear is shown in Figure 5.12
Figure 5.12: The Smooth Data window
The smoothing procedure can be applied to any number of selected survey lines and to any data type. To
select lines click on all appropriate lines in the list box labeled Lines. To select data type to be smoothed click
appropriate check boxes in Select Data Type(s) section of the Smooth Data window. Checking boxes labeled
Conductivity or Inphase will select or deselect all data types associated with the corresponding component.
Several methods of smoothing are available: 3 point linear smooth, 5 point linear smooth, etc. They are
listed and selected using the Select Smooth Routine pull down menu (Figure 5.12).
Figure 5.13: The Smooth Data window with list of available smooth
functions.
After the survey lines, data type and the method of smoothing have been selected, press the Apply Smoothing
button to smooth. Smoothing can be applied to a selected set of data several times. The number of smoothing
applications is displayed and updated in the display box at the bottom of the window (left to the Apply
Smoothing button), labeled Apply Count. The graphic display is updated in real time, with the original
curves displayed in grey, as shown in Figure 5.14.
60
Geonics DAT31W Operating Manual
Figure 5.14: DAT31W screen while smoothing selected data
After smoothing is applied, the buttons located in the Replace with window become active. The original
data can be replaced with the Smoothed or Residual values at any time by pressing the corresponding
button. If the smoothing result is not as desired, click on Original to return to the original values.
The simple, three point linear smoothing function, applied several times, is adequate for “average” EM31
data. Ultimately, however, the method of smoothing (or generating residual curves) and the degree of
smoothing depends on the particular data set, objectives, desired method of presentation, etc.
Closing the Smooth Data window using OK or the close window button will temporarily save changes in
the data set.
Note that changes are saved temporarily in the in the program memory while
the window associate with the data set is active. Changes can be saved permanently with the Save As option as discussed in Section 4.2.
(We recommend to use Save As instead of Save, to preserve the original data.)
5. Editing Data
61
6. Editing Survey Geometry
The Edit Geometry option allows adjustment of the profile geometry, including the repositioning of both the start
and end stations of each line, as well as any station marked with the fiducial switch. To display the Edit Geometry
menu select Edit Geometry in the main menu at the top of the screen (Figure 6.1).
Figure 6.1: DAT31W Edit Geometry menu
The Edit Geometry menu contains three groups of items. In the first group, Set Line Limits changes the position
of the start and end stations of any selected group of survey lines; Shift Survey Lines can be used to move any
selected group of survey lines in either a positive or negative direction along the profile axis; Split Survey Line will
separate any related survey line into two independent survey lines.
The second group contains two items: Position Markers and Position Line Segments. Position Markers is an
efficient tool for aligning fiducial markers and the start and end points of survey lines. Position Line Segments
tool allows the user for adjusting positions of the segment end stations.
The third group contains four items that allow quick (although less accurate) positioning of fiducial markers, and the
start and end stations of each survey line. These “quick” tools are easily accessible from buttons located on the tool
bar.
The fourth group contains only one item, Correct Time Delay, which is a tool for adjusting station positions
according to the rate of travel during data collection.
6.
Editing Survey Geometry
63
6.1 Set Line Limits
To display the Set Line Limits window select Edit Geometry|Set Line Limits in the menu (Figure 6.1).
The Set Line Limits window is shown in Figure 6.2.
Figure 6.2: Set Line Limits window
You can set line limits (positions of the start and end stations) for any number of selected survey lines at
one time. To select lines, use the list box labeled Select Line(s). In the Current Line Limits display box, the
minimum (Left) and maximum (Right) positions of stations are shown. (Left corresponds to the minimum
station positions on the left side of the screen, while Right corresponds to the maximum positions on the
right side for the selected survey lines.) You can specify new Left and Right positions can be specified in the
two edit boxes labeled Set Line Limits to.
If both edit boxes are checked (Figure 6.2), both ends of the selected survey lines will be repositioned to the
specified values. In this case, the station intervals will be adjusted accordingly. If only one edit box is
checked (Figure 6.3), the active station will be repositioned to the specified location, while the non-active
station will remain unchanged.
Figure 6.3: Set Line Limits window with one edit
box checked
64
Geonics DAT31W Operating Manual
After you click the Apply Setting button, the specified adjustments are completed. The graphic display will
be updated in real time. The procedure can be repeated for any additional sets of survey lines and settings.
If any change is not satisfactory, click the Cancel button to close the Set Line Limits window and return all
stations to their original positions. Clicking the OK button will close the Set Line Limits window and apply
the changes.
6.2 Shift Survey Lines
To display the Shift Survey Lines window select Edit Geometry|Shift Survey Lines from the main
menu (Figure 6.1). The window is shown in Figure 6.4.
Figure 6.4: DAT31W screen with Shift Survey Lines window
This option lets you shift any number of selected survey lines, left or right, along the profile axis. The
survey lines can be selected from the list box labeled Select Line(s). The information on current positions
of the end points of the current line is shown in the display box labeled Current Position. The shift
increment (step) can be entered in the edit box labeled Set Step. If the step is positive, the selected lines will
be shifted to the right, with the station numbers increasing accordingly. A negative step will shift survey
lines to the left, with station numbers decreasing accordingly. The lengths of the survey lines will not
change.
After the step is entered, click on Apply to shift the selected lines. The graphic display will be adjusted in
real time. The last operation can be cancelled by clicking the Undo button.
To end this operation, click on OK: the Shift Survey Lines window will close, and all changes will be applied.
If any change is not satisfactory, click the Cancel button to close the Shift Survey Lines window and return
all stations to their original positions.
6.
Editing Survey Geometry
65
6.3 Split Survey Lines
To display the Split Survey Lines window select Edit Geometry|Split Survey Lines from the main
menu (Figure 6.1). The window is shown in Figure 6.5.
Figure 6.5: Split Survey Lines window
This option allows a survey line to be divided into two independent survey lines. The line can be further
divided into any number of separate lines or segments, simply by repeating the procedure.
The line to be split is selected in the Original Line section. Click on the arrow beside the Line Name box to
open the pull down list of available lines, then click on the line to be split (Figure 6.6). The number of
stations in the selected line, and the positions of the stations, will be displayed below the Line Name box.
Figure 6.6: Selecting a line in the Split
Survey Line window
66
Geonics DAT31W Operating Manual
To select the station at which the line will be split, scroll to and highlight the desired station. After splitting,
the selected station will be the last station of the first line, while the next station will be the first station of
the second line. This information, as well as the number of stations in each new line, is provided in the
windows labeled Sub Line1 and Sub Line2 (Figure 6.7).
Figure 6.7: Selecting the station in the line
A vertical bar will move along the line profile indicating the position of the selected station on screen
(Figure 6.8).
Figure 6.8: Profile View display before survey line split
After the station is selected you can apply the split by clicking the Split Line button. The effect is shown in
Figure 6.9.
6.
Editing Survey Geometry
67
Figure 6.9: Graphical display after survey line split
The new lines are named by using the original name with an added underscore and an alphabetic character
in sequence. You can rename later using the Select Line option.
To exit click the OK button, and the Split Survey Line window will close, applying all changes.
6.4 Position Markers
To display the Position Markers window select Edit Geometry|Position Markers from the main menu
(Figure 6.10), or click the Position Markers button
located on the tool bar. The Position Markers window is shown in Figure 6.11.
Figure 6.10: Edit Geometry menu
68
Geonics DAT31W Operating Manual
This option allows you to reposition fiducial points that were marked by pressing fiducial marker while
logging. You can adjust a selected marker or a selected group of markers, and also change start and end
stations.
Figure 6.11: Position Markers window
The Position Marker window is simple and small in order to allow a maximum view of the profiles. An unlabeled edit box is provided for entry of the position to where the marker or the start/end station will be
moved. The position can be entered using either the keyboard, or the two speed buttons.
A check box labeled Group is located below the edit box. The Group option is toggled on/off by clicking
this box. When the check box is marked (on), repositioning will be applied to a selected group of markers.
Otherwise, if the check box is unmarked (off, default) repositioning will apply to a single marker or start/
end station only.
The Undo button will cancel the most recently applied repositioning only. If the Info button is clicked a
window with related help information will be displayed.
To close the window click the Close button located in the top right corner of the window, click the Position
Markers button
on the tool bar, or uncheck the Position Markers item in the Edit Geometry menu
(Figure 6.10).
6.
Editing Survey Geometry
69
Repositioning A Selected Marker
To reposition a selected marker, the Group box in the Position Markers window must be unchecked. This
is the default setting. In the edit box, enter or select a position to which the marker (or line end) is to be
moved. Position the mouse cursor on (or near) the marker or end to be moved and click. The marker will be
repositioned to the station entered in the edit box and all points between the adjacent markers will be
adjusted accordingly. Figure 6.12 shows a marker that was moved from station 128.14 to 160 in the first
survey line from the top of the display.
Figure 6.12: Positioning selected markers
Please note that the marker must not be moved past neighbouring marker (or end). If the specified station
is beyond this range a warning message will be displayed. In the event that a marker must be repositioned
beyond the range of a neighboring marker, either reposition or delete the adjacent marker first.
Reposition a Group of Selected Markers
To reposition a group of markers the Group box in the Position Markers window must be checked. In the
edit box, enter or select the position to which the selected markers (or line ends) are to be moved. Drag a
rectangle around the markers to be repositioned (Figure 6.13). Position the cursor inside the rectangle and
click. All markers (or start/end stations) enclosed in the rectangle will be repositioned to the station entered
in the edit box (Figure 6.14), and points between adjacent markers adjusted accordingly.
The above procedure can be completed in reverse order as well. First, drag a rectangle around the selected
markers, then specify the station in the edit box. Then position the cursor inside the rectangle and press the
left mouse button to reposition all selected markers.
Rules for repositioning a group of markers are the same as for a single marker. The station where the
markers are to be moved must not be past a neighboring marker or line end for any of the selected markers.
If the specified station is beyond this range a warning will be displayed, and the affected marker will not be
70
Geonics DAT31W Operating Manual
Figure 6.13: Positioning Group of Selected Markers
Figure 6.14: DAT31W screen after Positioning Group of Selected Markers (see
Figure above)
repositioned. In the event that a marker must be repositioned beyond the range of two neighboring markers, either reposition or delete the adjacent marker first.
Methods for adjusting profiles and fiducial markers (that’s all modes) are also described in section 2.3 of
this manual (Quick Start - Editing Survey Geometry), and in section 6.5 following.
6.
Editing Survey Geometry
71
6.5 Position Line Segments
To display the Position Line Segments window select Edit Geometry|Position Line Segments from
the main menu (Figure 6.10), or click the Position Line Segments button
located on the tool bar. The
Position Line Segments window is shown in Figure 6.15.
Figure 6.15: Position Line Segments window
This option is very similar to the Position Markers function. It allows you to reposition end points of line
segment. You can adjust a selected segment end point or a selected group of points, and also change start
and end stations of the entire survey line.
Segments of a survey line are marked by blue squares similar to green and red points marking start and end
of the survey line. Line 104 (third from the top) in the example given in Figure 6.15 consists of three
segments. It should be noted that changing position of line segment will change position of markers if they
are present. Changing the position of start/end station or line segment will result in changing the length of
the segment, regardless whether start or final station is moved.
During adjusting survey line geometry when markers and segments of the line are present the following
procedure should be used. First adjust both ends of the survey line, then position end stations of each
segment of the line, and at the end position fiducial markers.
This option is very similar to the Position Markers function. It allows you to reposition the end points of a
line segment. You can adjust a selected segment end point or a selected group of points, and also change the
start and end stations of the entire survey line.
The Position Line Segments window is simple and small in order to allow a maximum view of the profiles.
An un-labeled edit box is provided for entry of the position to where the start/end station of the segment
will be moved. The position can be entered using either the keyboard, or the two speed buttons.
A check box labeled Group is located below the edit box. The Group option is toggled on/off by clicking
this box. When the check box is marked (on), repositioning will be applied to a selected group of markers.
72
Geonics DAT31W Operating Manual
Otherwise, if the check box is unmarked (off, default) repositioning will apply to a single marker or start/
end station only.
The Undo button will cancel the most recently applied repositioning only. If the Info button is clicked a
window with related help information will be displayed.
To close the window click the Close button located in the top right corner of the window, click the Position
Line Segments button
on the tool bar, or uncheck the Position Line Segments item in the Edit
Geometry menu (Figure 6.10).
Repositioning a Selected End of Line Segment
To reposition a selected end station of the line segment, the Group box in the Position Line Segments
window must be unchecked. This is the default setting. In the edit box, enter or select a position to which
the end station is to be moved. Position the mouse cursor on (or near) the selected station (marked by blue
square) to be moved and click. The selected end station of the line segment will be repositioned to the
station entered in the edit box. All markers included in this segment will be adjusted accordingly. Figure 6.16
shows an end of segment station that was moved from station 93.93 (Figure 6.15) to 140 in the first survey
line from the top of the display.
Figure 6.16: Positioning selected end of the line segment
Please note that the end station of the line segment can be moved past another segment end points. In this
case care should be taken which end points correspond to the particular line segment.
Reposition a Group of Selected Segment End Stations
To reposition a group of line segment end stations the Group box in the Position Line Segments window
must be checked. In the edit box, enter or select the position to which the selected stations (or line ends) are
to be moved. Drag a rectangle around the stations to be repositioned (Figure 6.17). Care should be taken
that neighbouring end stations of two segments of the same sutrvey line are not included in the rectangle.
Position the cursor inside the rectangle and click. All end stations of the line segments (or start/end sta-
6.
Editing Survey Geometry
73
tions) enclosed in the rectangle will be repositioned to the station entered in the edit box (Figure 6.18).
Markers located in the modified line segment will be adjusted accordingly.
Figure 6.17: Positioning group of end stations
Figure 6.18: DAT31W screen after positioning group of selected end stations
(compare Figure 6.17)
The above procedure can be completed in reverse order as well. First, drag a rectangle around the selected
stations, then specify the station in the edit box. Then position the cursor inside the rectangle and press the
left mouse button to reposition all selected stations.
74
Geonics DAT31W Operating Manual
6.6 Quick Marker and Profile Adjustments
The Edit Geometry menu provides four tools for quick adjustments of start and end stations, and for
deleting and repositioning fiducial markers (Figure 6.19).
These are:
Quick Marker Adjustment
Quick Remove Marker
Quick Line End to Marker Adjustment
Quick Adjust Survey Line
The accuracy of the “quick” repositioning of markers and stations is relatively limited compared to the
Position Markers option (described in section 6.4) due to the limited resolution of the screen. They are
very useful, however, for the initial adjustments of survey geometry.
To access any of these tools select Edit Geometry|Quick... in the menu (Figure 6.19), or click the appropriate buttons, , , , or , on the tool bar.
Figure 6.19: DAT31W Edit Geometry menu
Quick Marker Adjustment
Select Quick Marker Adjustment in the Geometry menu, or click the
button on the tool bar. Position
the cursor over the marker, then press and hold the left mouse button, and drag the marker along the survey
line. The marker cannot be moved beyond a neighboring marker or line end.
6.
Editing Survey Geometry
75
Quick Remove Marker
Select Quick Remove Marker in the Geometry menu or click the
button on the tool bar. Position the
cursor over the marker, and click. A window confirming deletion (Yes/No) will be displayed. After confirmation the marker will be deleted. This tool has no Undo feature.
Quick Line End to Marker Adjustment
Select Quick Line End to Marker Adjustment in the Geometry menu or click
on the tool bar. This
option adjusts the section of line between a line end and the closest fiducial marker. Position the mouse
over the start or end station of the survey line (marked by small green (start) or red (end) circles). Press and
hold the left mouse button, and drag the line end to the desired position. The position of the end will be
changed without affecting the closest marker, and points in between will be adjusted accordingly.
Quick Adjust Survey Line
Select Quick Adjust Survey Line in the Geometry menu or click the
button on the tool bar. This
option allows adjustment of the start and end stations of each survey line. To reposition any line move the
mouse cursor to the start or end station of the line, marked by a small green (start) or red (end) circle Press
and hold the left mouse button, and drag the station to the desired position. The positions of all points on
the line will be changed according to the following rules:
If the start station is repositioned, the entire line will be shifted without changing the length of the survey
line. The end station will move as well.
If the end station is repositioned, the end station will move while the start station remains fixed. The length
of the survey line and distance between stations (increment) will be changed (expanded or squeezed) accordingly.
76
Geonics DAT31W Operating Manual
7. 2D Layout (Create XYZ File)
The 2D Layout option lets you create and view two dimensional layouts of survey lines. The View Survey Layout
option requires that the survey line names indicate one of the coordinates, X or Y (Easting or Northing) and
stations along the lines are associated with the other coordinate. Create XYZ File lets you generate files with any
configuration of survey lines, including Arbitrary Orientation, however this procedure is relatively time consuming
since it requires manual entry of coordinates for two points per survey line. Therefore, it is strongly recommended
that data files be organized so that each file contains parallel lines surveyed in one direction, either W-E or S-N. If
line names do not correspond to an appropriate coordinate they can be easily changed by the Rename function in
the Select Survey Lines window.
To display the 2D Layout menu select 2D Layout in the main menu at the top of the screen (Figure 7.1).
Figure 7.1: DAT31W 2D Layout menu
The menu contains three options. The first, Create XYZ File generates an XYZ file which can be used as an input
file for various contouring systems.
The two remaining options, View Survey Layout (W-E) and View Survey Layout (S-N), can be used to view a
two dimensional layout of stations for surveys (or a portion of a survey) carried in the W-E direction (along the X
coordinate) and in the S-N direction (along the Y coordinate). These last two are also accessible through buttons
and located on the tool bar.
The two View Survey Layout options show a two dimensional layout of stations and survey lines. Each station is
represented by a dot on the screen. At this point you can visually examine the configuration of the layout and correct
it if necessary.
7.
2D Layout (Create XYZ File)
77
7.1 Create XYZ File
This option creates a file containing three columns: X, Y, Z (where Z corresponds to e.g. Conductivity in
[mS/m] depending on the Create XYZ File settings) in ASCII format. This file can be used as an input file
for the GEOSOFT or SURFER contour packages (or any other, if a multiple column format is suitable).
Data must be entered first under the Load EM31 Profile File or Add menu before running this option.
You can convert data directly to an XYZ file format by selecting the 2D Layout|Create XYZ File menu
option, or alternatively, the layout of the survey can first be examined by selecting the 2D Layout|View
XYZ menu, or by clicking the View XYZ (W-E) or View XYZ (N-S) button on the tool bar. The view
XYZ option shows a two dimensional layout of stations and survey lines oriented either in the W-E or NS directions. Each station is represented by a dot on the screen. At this point you can examine the configuration of the layout visually and correct it if necessary.
After you select the 2D Layout|Create XYZ File from the profile menu the Create XYZ File window is
displayed (Figure 7.2).
Figure 7.2: Create XYZ File window
Parameters Describing Contents and Format of XYZ File
Several parameters which affect the contents and format of the created XYZ file must be specified. Specifically, these are the Orientation of Survey Lines, the EM31 Data Type and other parameters to be written to
the file, Format of the output file, and the output file name. For each parameter there is only one option for
each layout which you select by clicking the appropriate radio button.
78
Geonics DAT31W Operating Manual
Orientation of Survey Lines
Choose W-E, S-N, or Arbitrary orientation of the survey lines. The W-E orientation corresponds
to a layout where lines are parallel and oriented in the X direction. For example, the North and Y
coordinates point to the top, and the East and X coordinates point to the right edge of a page. For
S-N orientation the lines are parallel to and oriented in the Y direction. The Arbitrary option is
designed for layouts where survey lines are not parallel.
If W-E orientation is selected, it is assumed that the line name is the Y, (S-N) coordinate and
stations are aligned along the X, (W-E) axis. If survey lines are parallel and oriented in W-E direction, but the line names do not correspond to the Y coordinate, then rename the lines in the Select
Lines window (see section 4.3). It should be noted that if the line name starts with a number and
ends with letters, i.e. 10N, only the number will be recognized as a Y coordinate.
If S-N orientation is selected, the line name corresponds to the X, (W-E) coordinate and stations
are aligned along the Y, (S-N) axis. Again, if survey lines are parallel and oriented in S-N direction,
but the line names do not correspond to the X coordinate, then rename the lines in the Select Lines
window (see section 4.3). It should be noted that if the line name starts with a number and ends
with letters, i.e. 10E, only the number will be recognized as an X coordinate.
The Arbitrary option is used only in the case where lines are not parallel. A description of creating
the XYZ file while using this option is given separately at the end of this section.
Format
Check the appropriate option according to the contouring software to be used. The Generic option will create a three or more column file (see Channels above) without any text strings. This file
can be used as an input file for many contouring packages (including Geosoft and Surfer). The
Geosoft format will cause the program to write LINE # at the beginning of each survey line,
which is necessary if the Geosoft BIGRID module is used to grid the data.
Output File Name
When you click Browse, a Select XYZ File Name window is displayed, as shown in Figure 7.3.
Figure 7.3: Select XYZ File Name window
The original EM31 file name with an extension corresponding to the selected output file format
(xyz, dat, or asc) is given as a default. Accept the default or specify a new file name and click the
Save button. The Select XYZ File Name window will close and the selected file name will be
displayed at the bottom of the Create XYZ File window. At the same time the Create button is
activated.
7.
2D Layout (Create XYZ File)
79
Data Type
To select channels to be written in the output file click on the proper radio button in the Select
Data Type section of the Create XYZ File window as shown in Figure 7.4.
Figure 7.4: Create XYZ File window during selecting
Data Type
Only one EM31 Data Type per XYZ file is allowed. To select Data Type click on the radio button
next to the Component, Dipole mode, and Orientation. Data is always placed in the created XYZ
file in the following order: X coordinate, Y coordinate, and marked Data Type parameters. The
optional parameter Time (time stamp for each reading) can be placed in the last column of the file.
A comment line listing all parameters in the file is placed as a header for each created XYZ file.
Creating an XYZ File with W-E or S-N Line Orientation
When the Orientation of Survey Lines parameter is set to W-E or S-N you only need to click on the active
Create button to start writing the file. A progress bar located at the left bottom corner of the window will
indicate the percentage of the created file that has been completed (Figure 7.5).
This operation is usually very fast for W-E and S-N line orientations. (It is a more lengthy process for the
Arbitrary survey lines orientation, since several locations must be manually entered by the operator.) After
the file is created, the Create XYZ File window is minimized, and the two dimensional station layout is
displayed (Figure 7.6).
The displayed image shows the spatial layout of lines and stations to scale, based on the station coordinates
written to the created file. The layout can be examined and printed. An option located on the menu and tool
80
Geonics DAT31W Operating Manual
Figure 7.5: Create XYZ File window during creating
output file
Figure 7.6: Layout of stations after an XYZ file is created
bar of this screen lets you identify coordinates by using two perpendicular lines, horizontal and vertical, the
coordinates being displayed in the bottom right portion of the screen.
Files created by this portion of the program can be also viewed at any time using the File|Open|XYZ
menu or by clicking the View XYZ File button located on the tool bar.
7.
2D Layout (Create XYZ File)
81
Creating an XYZ File with Arbitrary Orientation
The Arbitrary option is used only in cases where lines are not parallel. If this option is to be used click the
Arbitrary tab in the Create XYZ File window. The Arbitrary Orientation option becomes active (Figure
7.7).
Figure 7.7: Create XYZ File window (Arbitrary option) during writing
file
After you specify the Output File Name (see Output File Name) and click Create XYZ File, you must
enter two stations for each survey line in the file. The program will systematically preview each survey line
for station coordinates entry. In the edit box for Station #1, enter the coordinates of the start station of the
indicated line and, for Station #2, enter the coordinates of any other point on this survey line, assuming
that the survey line is a straight line only. After coordinates for two stations are specified click on the Apply
button. A projection of the coordinates will be calculated for every station. A progress bar located at the
bottom of the window indicates percentage of data written to the file. The Create XYZ File window during
this procedure is shown in Figure 7.7.
You can view any XYZ file created with the arbitrary line orientation using the File|Open|XYZ menu
option, or by clicking the Open XYZ File button on the tool bar.
After the file is created, the Create XYZ File window is minimized and the two dimensional layout of
stations is displayed (Figure 7.8).
The displayed image shows the spatial layout of lines and stations to scale, based on the station coordinates
written to the created file. The layout can be examined and printed. An option located on the menu and tool
bar of this screen lets you identify coordinates by using two perpendicular lines, horizontal and vertical:
coordinates are displayed in the bottom left portion of the screen.
82
Geonics DAT31W Operating Manual
Figure 7.8: Example of layout after an XYZ file is created using the Arbitrary line
orientation.
You can also view files created by this portion of the program at any time using the File|Open|XYZ
menu or by clicking the View XYZ File button located on the tool bar.
7.2 View Survey Layout (W-E) or (S-N)
Two items in the 2D Layout menu, View Survey Layout (W-E) and View Survey Layout (S-N), let you
view a two dimensional layout of stations for surveys which are carried out in the W-E direction (along the
X coordinate) or in the S-N direction (along the Y coordinate). The program assumes that the survey line
names indicate one coordinate (X or Y) and stations along each line are associated with the second coordinate. These two options, therefore, can be used only if the entered data set consists of parallel lines.
To view the spatial layout of stations, select 2D Layout|View Survey Layout (W-E) or 2D Layout|View
Survey Layout (S-N) from the main menu (Figure 7.1). These two items are also easily accessible from
toolbar buttons
and . A screen displaying survey lines oriented in S-N direction is shown in Figure
7.9.
View Survey Layout offers a quick view of the spatial configuration of survey lines to determine if any
corrections are necessary. Each station is represented by a dot on the screen. Tools provided in the screen
menu and the associated tool bar let you enlarge the selected areas of the survey for closer examination. The
layout can also be rotated in 45 degree increments.
7.
2D Layout (Create XYZ File)
83
Figure 7.9: View Survey Layout (W-E) screen
View Survey Layout (S-N) provides a similar screen containing the layout of survey lines oriented in the
vertical direction (along the Y coordinate).
84
Geonics DAT31W Operating Manual
8. GPS Positioning
Two methods for using the Global Positioning Systems are available with the EM31 system. In the first method
EM31 data is collected in the EM31 logger while GPS data is logged separately to the GPS system logger. The
Combine EM31 and GPS Files option of the DAT31 lets you combine two data sets (EM31 and GPS) into one
XYZ file as long as you can synchronize the EM31 logger clock with the GPS satellite time or determine the
difference between these two clocks. In most cases the difference between clocks (Time Shift) can be determined
with higher accuracy than the logger and satellite clocks can be synchronized. This method can be used with virtually
any GPS system that can log its data, however it requires processing data using GPS software and exporting a GPS
file to ASCII format that contains a minimum positioning data (Easting and Northing) as well as GPS satellite time
data in 24 hour clock format.
The second method is available only when EM31 data are collected using Allegro (or similar) field computer operating under the control of the data acquisition program EM31alg. In this method the GPS receiver is connected to
the EM31 logger serial port and GPS data is collected in the EM31 data file. This method can be used with Differential Global Positioning Systems (DGPS) that can provide Real Time Differential Correction of positioning data
and send a GGA message (standard NMEA-0183 data string). Geonics has tested the program with the Trimble
Ag114 and Ashtech GPS systems. Data collected using this method can be processed using the GPS Positioning
option located in the GPS Positioning menu.
The option Correct Time Delay in XYZ Files can be used to correct the effect of the system (combined EM31
and GPS receiver) time constant delay in two dimensional XYZ files generated by GPS Positioning and Combine
EM31 and GPS Files options.
To display the GPS Positioning menu select GPS Positioning from the DAT31 main menu (at the top of the
screen, Figure 8.1).
Figure 8.1: DAT31W GPS Positioning menu
8.
GPS Positioning
85
8.1 Combine EM31 and GPS Files
This portion of DAT31 uses an EM31 data file in the .G31 format which has recorded time for each
reading, plus a differentially corrected (post processed) GPS file, also with a recorded time for each reading.
The data from these files are combined in an XYZ file which contains location X and Y, and one selected
EM31 data type.
After GPS Positioning|Combine EM31 and GPS Files from the program menu option is selected, the
Combine EM31 and GPS Files window is displayed (Figure 8.2).
Figure 8.2: Combine EM31 and GPS Files window
The Combine EM31 and GPS Files window contains three pages which can be activated by clicking the
appropriate tabs. Each page lets you enter specific parameters necessary to combine EM31 and GPS files..
Parameters for Combine EM31 and GPS Files Window
Several parameters which affect the contents and format of the created XYZ file must be specified. These
are names for the EM31, GPS, and XYZ files (Main page), the EM31 Data Type to be written to the XYZ
file, EM31 Time Shift and GPS Time Gap (Parameters Page), and formats for the XYZ File, GPS File, and
GPS Time (Format page).
EM31 File
First click on EM31 in the Main page. The Open EM31 File window is displayed, as shown in
Figure 8.3.
Select a file name (extension name G31) and click on Open. The Open EM31 File window will
close and the selected file name will appear beside the EM31 button in the Main page of the
Combine EM31 and GPS Files window.
86
Geonics DAT31W Operating Manual
Figure 8.3: Open EM31 File window
GPS File
Next click on GPS. The Open GPS File window is displayed, as shown in Figure 8.4.
Figure 8.4: Open GPS File window
Select a file name and click an Open button. (GPS files in ASCII format usually have extension
names ASC, POS, or TXT). The Open GPS File window will close and the selected file name will
appear at the right side of the GPS button of the Main page.
XYZ File
When you click on XYZ, the Select XYZ File window is displayed, as shown in Figure 8.5.
Figure 8.5: Select XYZ File window
Select or enter a name for the output file and click on Save. The Select XYZ File window will close
and the file name will be displayed beside the XYZ button in Main page of the Combine EM31 and
GPS Files window.
8.
GPS Positioning
87
Data Type
To select EM31 Data Type to be written in the output file click the Parameters tab in the Combine
EM31 and GPS Files window. The Parameters page will appear (Figure 8.6).
Figure 8.6: Parameters page in the Combine EM31 and
GPS Files window
This page is divided into three sections. The section labelled Data Type allows to select desired
EM31 data type (component, dipole mode, and orientation) to be written in to XYZ file. Data Type
names are described by three labels which are explained below:
To select a data type click on the radio button next to the data type name. Only one combination of
dipole mode and orientation in EM31 data type is allowed per one XYZ file. Data is always placed
in the created XYZ file in the following order: X coordinate, Y coordinate, and selected component (in chosen dipole mode and orientation). If Both was selected in the component field, then
Conductivity is always placed in the third column and Inphase in the fourth column. The time
stamp for each reading is placed in the last column of the file. A comment line listing all parameters
in the file is placed as a header for each created XYZ file.
EM31 Time Shift
The EM31 Time Shift can be specified in the Parameters page of the Combine EM31 and GPS
Files window. Click the Parameters tab located at the top of the window and the Parameters page
shown in Figure 8.6 will appear.
If the EM31 logger and GPS system clocks are not synchronized prior to the survey, an appropriate correction (in seconds) can be entered in the edit box labelled Time Shift. In most cases, it is
much easier to determine the time difference between the clocks in these two devices than to
synchronize the two clocks at the outset.
88
Geonics DAT31W Operating Manual
During calculations the Time Shift is applied to the recorded EM31 logger time. Therefore, if the
logger time is ahead of the GPS time, enter a negative value; if the EM31 logger time is behind the
GPS time, enter a positive value.
GPS Time Gap
The differentially corrected GPS data often has gaps, due to differences in the constellation of
satellites visible to two (fixed and moving receivers), lack of beacon signal, etc. Small gaps can also
occur due to a difference in the frequency of data acquisition between the EM31 and GPS systems.
These gaps are filled by DAT31W with the assumption that the EM31 speed is essentially constant
and that the motion is along a straight line during the gaps.
The GPS Time Gap parameter specifies the maximum time during which the EM31 data will be
linearly interpolated between two GPS positions. Enter this parameter (in seconds) in the edit box
labelled GPS Time Gap (Figure 8.6). In most cases a value 2 to 3 times larger than the GPS
acquisition frequency is adequate.
XYZ File Format
You can specify the format of the XYZ output file in the Format page. Click the Format tab at the
top of the window: the page is shown in Figure 8.7.
Figure 8.7: Format page in the Combine EM31 and GPS
Files window
Check the option appropriate for the contouring software used. The Generic option will create a
three column file without any text strings. This file can be used as an input file for many contouring
packages (including Geosoft and Surfer). Geosoft format will cause the program to write LINE #
at the beginning of each survey line.
GPS File Format
The DAT31W is designed to work with the GPS file in ASCII format. ASCII format is usually
obtained by executing the Export ASCII File option available in most GPS data processing programs. This approach assures compatibility with most formats provided by GPS software manufacturers.
8.
GPS Positioning
89
In order to describe the format of the GPS file, set the locations of columns containing Easting,
Northing, and Time in the corresponding edit boxes under Column.
When reading the GPS file, the DAT31W confirms that each value in the indicated column is a
valid numeric parameter; if it is not, that record in the GPS file is ignored. GPS files that contain
comment lines or field description header lines are therefore accepted.
GPS Time Format
This parameter further describes the format of the GPS file. GPS time is usually specified in either
of two formats: hh:mm:ss (hours:minutes:seconds) or, the number of seconds elapsed from GPS
midnight (or from the beginning of the GPS week). Both formats can be used by DAT31W. Specify
which format by checking the appropriate button.
While using the hh:mm:ss format, make sure that 24 hour time format is used
by the GPS software.
View Time Range
After both the EM31 and GPS files have been specified, the View Time Range button is activated in the
Main page of the Combine EM31 and GPS Files window. When the View Time Range button is clicked,
the program begins to read both files. The progress bar at the bottom of the screen shows the percentage
of files read (Figure 8.8).
Figure 8.8: Combine EM31 and GPS Files window during
reading of EM31 and GPS files
Once the files are read the Time Range window will be displayed (Figure 8.9).
Although Time Range viewing is not necessary for combining the EM31 and GPS files, the display is a
quick way to visually estimate the value for the Time Shift. In those cases where the Time Shift is incorrect
(i.e. wrong sign or value), the GPS Time Range and the Shifted EM31 Time Range graphs are not coincident. The most common error is the wrong sign (+/-) entered for the time shift. If the results are satisfactory, close the Time Range View window and continue work in the Combine EM31 and GPS Files window,
or you can adjust the time shift in the parameter page if necessary.
90
Geonics DAT31W Operating Manual
Figure 8.9: Time Range window
Creating XYZ File
When all parameter are set and the file names (EM31, GPS, and output XYZ file) are specified, the Create
XYZ File button is activated in the Main page of the Combine EM31 and GPS Files window. When you
click on Create XYZ File the program begins to read the EM31 and GPS files, interpolates EM31 stations
positions based on time records and the EM31 Time Shift parameter, and writes records to the XYZ
output file. The progress bar at the bottom of the screen shows the percentage read (Figure 8.10).
Figure 8.10: Combine EM31 and GPS Files window during
reading data files and creating output XYZ
file
The speed of this operation depends on the size of the input files. After the XYZ file is created, the
Combine EM31 and GPS Files window is minimized and a two dimensional layout of the survey is displayed (Figure 8.11).
8.
GPS Positioning
91
Figure 8.11: Layout of survey as created in the XYZ output file
The displayed image shows the spatial layout of lines and stations to scale, based on the station coordinates
as written to the created file. The layout can be examined and printed. An option located on the menu and
tool bar of this screen lets you identify coordinates using two perpendicular lines, horizontal and vertical
lines. The coordinates are displayed in the bottom left portion of the screen.
Files created by this portion of the program can be also viewed at any time using the File|Open|XYZ
menu or by clicking the
(View XYZ File) button on the tool bar.
8.2 GPS Positioning
This option of the DAT31W program can be used when the GPS receiver is connected to the EM31 logger
serial port and GPS data is recorder in the EM31pro data file (available with Pro4000 or similar loggers).
This method can be used with Differential Global Positioning Systems (DGPS) that can provide Real Time
Differential Correction of positioning data and are capable of streaming NMEA-0183 message: GGA .
Select GPS Positioning|GPS Positioning from the main program menu. The GPS Positioning window
is displayed (Figure 8.12).
Parameters in GPS Positioning Window
Several parameters which affect the contents and format of the created output (XYZ) file must be specified. These are the EM31, and XYZ file names, the format of coordinates in the output file, and the GPS
Time Gap.
92
Geonics DAT31W Operating Manual
Figure 8.12: GPS Positioning window
Input File
Click on Input button. The Open EM31 File window is displayed (Figure 8.13).
Figure 8.13: Open EM31 File window
The window lists files with extension name G31. Select a file name and click the Open button. The
Open EM31 File window will close and the selected file name will appear next to the Input button
in the GPS Positioning window.
Output File
Click on the Output button. The Select XYZ File window is displayed (Figure 8.14).
Figure 8.14: Select XYZ File window
8.
GPS Positioning
93
Select a file name and click the Save button. The Select XYZ File window will close and the
selected file name will be displayed beside the Output button in the GPS Positioning window.
When Input and Output files are specified the Apply button in the GPS Positioning becomes
active (Figure 8.15).
Figure 8.15: GPS Positioning window with selected Input and
Output files
Data Type
The section labelled Data Type allows to select desired EM31 data type (component, dipole mode,
orientation, and time stamp) to be written in to XYZ file.
To select a data type click on the radio button next to the data type name. Only one combination of
dipole mode and orientation in EM31 data type is allowed per one XYZ file. Data is always placed
in the created XYZ file in the following order: X coordinate, Y coordinate, and selected component (in chosen dipole mode and orientation). If Both was selected in the component field, then
Conductivity is always placed in the third column and Inphase in the fourth column. The time
stamp for each reading is placed in the last column of the file. A comment line listing all parameters
in the file is placed as a header for each created XYZ file.
Coordinates
Positions can be written in the output file as geodetic (geographical) coordinates (Latitude/Longitude) or they can be converted to UTM coordinates. The program uses the WGS1984 datum. To
select coordinates click Geodetic or UTM buttons (Figure 8.15).
Geodetic coordinates are given in degrees. They can be written in two formats DD.DDDDDDDD
or DDMM.MMMMM. To select which format click the appropriate radio button (Figure 8.15).
94
Geonics DAT31W Operating Manual
UTM coordinates can be generated in meters or feet. To select units for UTM coordinates click
one of the radio buttons located at the UTM button (Figure 8.15).
GPS Time Gap
Differentially corrected GPS data often has gaps, due to differences in the constellation of satellites visible to two (fixed and moving receivers), lack of beacon signal, etc. Small gaps can also
occur due to a difference in the frequency of data acquisition between the EM31 and GPS systems.
These gaps are filled by DAT31W with the assumption that the GPS receiver speed is essentially
constant and that it moves along a straight line during the gaps.
The GPS Time Gap parameter specifies the maximum time during which the EM31 data will be
linearly interpolated between two GPS positions. Enter this parameter (in seconds) in the edit box
labelled GPS Time Gap (Figure 8.15). In most cases a value 2 to 3 times larger than the GPS
acquisition frequency is adequate.
GPS Corrections
Check the box labelled GPS Corrections only if differentially corrected position data is to be used
during the creation of XYZ file. When this box is unchecked, both corrected and raw data are used
to calculate positions of EM31 stations.
Creating XYZ File
When all parameter are set and input and output file names are specified, the Apply button is activated in
the GPS Positioning window. After you click the Apply button, the program begins to read the input file,
interpolates the EM31 station positions based on the recorded GPS readings, writes and records to the
XYZ output file. A progress bar at the bottom of the screen shows the percentage read (Figure 8.16).
Figure 8.16: GPS Positioning window during creating
XYZ (output) file
8.
GPS Positioning
95
If the input file does not contain sufficient GPS information, the program will display a warning message
(Figure 8.17), and the program will pause operation till the OK button is clicked in the warning window.
Figure 8.17: Warning window
After the XYZ file is created, you can view the two dimensional layout at any time (Figure 8.20) using the
File|Open|XYZ menu, or by clicking the
(View XYZ File) button on the tool bar.
Figure 8.18: Layout of survey as created in the XYZ output file
The displayed image shows the spatial layout of lines and stations to scale, based on the station coordinates
written to the created file. The layout can be examined and printed. An option located on the menu and tool
bar of this screen lets you identify coordinates using two perpendicular lines, (horizontal and vertical).
Coordinates are displayed in the bottom left portion of the screen.
96
Geonics DAT31W Operating Manual
8.3 Correct Time Delay in XYZ Files
This option allows for the system time constant delay correction. The procedure is similar to the item
Correct Delay Time in Edit Geometry menu for grid based data however this option acts on two dimensional, GPS positioned data.
While the EM31 time constant is known the time constant of the combined EM31 and GPS receiver
system is a funcion of these two devices. The best method to determine the time delay is to survey a few
lines (in two directions) with varying speeds over the same small metallic target. When displaying the image
the anomaly associated with the sample target may be slightly displaced or extended in size on neighboring
lines. After the correct time constant for the system is determined the anomaly should be at the same
location for exach survey line. The alternative, possibly easier method to determine the time constant of the
system is to survey a known buried pipe. After the proper time constant delay correction is applied the
linear anomaly associated with the pipe should be free of any “hearing bone” effect.
Since the image of two dimensional data can be displayed in a mapping system (after griding) the procedure
can be time consuming, however it only needs to be done once for a given GPS receiver and EM31.
In order to apply the correction the generated XYZ file must have time stamps. In the event input file does
not have time stamp at each reading the program will display a warning message.
The correction acts on any XYZ type of file so care should be taken that data is not corrected twice or that
XYZ files created from corrected grid based data are not used.
To access this option select GPS Positioning|Correct Time Delay in XYZ File in the menu (Figure 8.1).
The Correct Time Constant Delay window will appear on the screen (Figure 8.19).
Figure 8.19: Correct Time Constant Delay window
Parameters in Correct Time Constant Delay Window
Several parameters which affect the contents and format of the created output (XYZ) file must be specified. These are the Input and Output XYZ file names, System Time Constant, Maximum Gap between
Readings, and type of coordinates in the input XYZ file.
Input File
Click on Input File button. The Select Input XYZ File window is displayed (Figure 8.20).
8.
GPS Positioning
97
Figure 8.20 Select Input XYZ File window
The window lists files with extension names XYZ, DAT, and ASC. Select a file name and click the
Open button. The Select Input XYZ File window will close and the selected file name will appear
next to the Input File button in the Correct Time Constant Delay window.
Output File
Click on the Output FIle button. The Select XYZ File window is displayed (Figure 8.21).
Figure 8.21 Select Output XYZ File window
As a default the Input File name with prefix C is given. Accept the default, enter, or select a file
name and click the Save button. The Select Output XYZ File window will close and the selected
file name will be displayed beside the Output File button in the Correct Time Constant Delay
window.
When Input and Output files are specified the Proceed button in the Correct Time Constant
Delay window becomes active (Figure 8.22).
System Time Constant
Time delay 0.4 seconds is given as a default. This value can be changed (0 to 1 seconds), however
the user should experiment before choosing a final value.
Maximum Gap Between Readings
This parameter specifies the maximum time during which the EM31 data will be treated as continous
data set. If the gap between two stations is larger than specified maximum gap the station that
follows the gap will be assumed the first station of a new line.
98
Geonics DAT31W Operating Manual
Enter this parameter (in seconds) in the edit box labeled Maximum Gap between Readings. In
most cases a value 2 to 3 times larger than the GPS acquisition frequency is adequate.
Coordinates in XYZ File
Specify type of coordinates in the input file. The output file will be written with the same type of
coordinates.
Creating Corrected XYZ File
When all parameter are set and input and output file names are specified, the Proceed button is activated in
the Correct Time Constant Delay window. After you click the Proceed button, the program begins to read
and analyse the input file, and then calculates corrections for each station based on the instant velocity of
the system at each station. A progress bar at the bottom of the screen shows the percentage read (Figure
8.22).
Figure 8.22 Correct Time Constant Delay window during
creating corected XYZ file
If the input file does not contain time stamp information, the program will display a warning message
(Figure 8.23), and the program will pause operation till the OK button is clicked in the warning window.
Figure 8.25 Warning message
8.
GPS Positioning
99
APPENDIX A
A.1 The Data File in DAT31 (G31) Format
The first row the DAT31 data file contains name of the instrument: EM31M (or GP31M if GPS option
was enabled during data acquisition), number of version, original name of file, and name of an operator
(not used if file is created after editing).
The row started with L specifies beginning of the survey line, it is followed by the line name, and line
parameters (three characters e.g. BB1):
1st component (B-both, Q-Quad-phase, I-Inphase),
2nd dipole mode (B-both, V-vertical, H-horizontal),
3rd instrument orientation (B-both, 1 or 2),
The next field specifies line direction W, E, N, or S. At the end of this row two parameters indicate mode of
data acquisition Y-Auto Mode and it is followed by time increment in seconds, N-Manual Mode is followed
by 0).
The following row starts with T and contains time and date of line creation.
The rows containing data start with the four character sequence (e.g. SV10), meaning of these characters is
as follows:
1st S - reading and station,
R - reading, it appears only when more than one reading was taken at one station,
N - start of new segment of the line,
D - deleted reading.
C - comment, the text of comment follows this field.
2nd V - reading with Vertical dipole mode,
H - reading with Horizontal dipole mode.
rd
3 1 - instrument orientation 1,
2 - instrument orientation 2.
th
4 0 - no fiducial marker,
1 - fiducial marker pressed at this station (only in Auto Mode).
Above 4 character field is followed by station number [user units], Conductivity in mS/m and Inphase in
ppt of Primary Field. If one component is recorded, it is placed into corresponding column while the
other column contains zeros. Conductivity data are always placed in the second column of numbers and
Inphase in the third column.
If a file was created with the EM31-MK2 or EM31 Polycorder program using GPS option it will contain an
additional column that indicate time that reading was recorded (in 24 hour clock format).
Appendix A:
File Format Description
101
Quad-phase and Inphase values of 8000.000 indicate skipped reading.
The DAT31 data file can be easily edited using any text editor, however care should be taken on preserving
proper placement of all parameters.
Example of EM31 File in DAT31 Format
EM31M V3.33 H31TEST
JOHN
L
10
BB1 W N 0
T
15:31 10-11-90
SV10
0.000
20.100
RH10
0.000
20.200
SV10
1.000
20.200
RH10
1.000
20.200
SV10
2.000
20.400
RH10
2.000
20.620
C
GRASS STARTS
SV10
3.000
20.820
RH10
3.000
20.820
SV10
4.000
20.680
RH10
4.000
20.620
L
20
BV1 E Y 1.0
T
11:03 10-12-90
SV10
45.000
17.580
SV10
44.611
17.580
SV10
44.222
17.760
SV11
43.833
17.640
SV11
43.444
17.520
SV11
43.055
17.580
SV10
42.666
17.700
SV10
42.277
17.700
NV10
37.600
16.140
SV10
37.169
16.140
SV11
36.738
16.080
SV10
36.307
16.920
SV10
35.876
17.520
L
30
BVB S N 0
T
11:52 10-12-90
SV10
0.000
20.580
RV20
0.000
20.680
SV10
1.000
20.620
RV20
1.000
20.880
SV10
2.000
20.880
RV20
2.000
21.040
SV10
3.000
21.000
.......
(or GP31M V3.33...in GPS option format)
line 10 starts
3.396
3.203
3.047
2.842
2.649
2.432
comment
2.264
2.192
2.143
2.168
line 20 starts
1.301
1.276
1.301
1.301
1.325
1.361
1.301
1.337
1.325
1.337
1.325
1.337
1.349
fiducial marker
new segment starts
line 30 starts
3.047
3.107
3.083
3.131
3.107
3.071
2.986
EM31-MK2 file with time stamp (GPS option) will contain one more column Hour:Minute:Seconds/
Hundreds of Seconds (24 h clock) e.g.:
SV10
102
3.000
21.000
2.986
16:14:12.15
DAT31W Operating Manual
A.2 The Data File in the Polycorder 600 Format
The EM31-MK2 Polycode program records a set of data in one file. The file name is supplied by the user
at the FILE: prompt (xxxx). (There is no Header and Data file as in Geonics EM31). The example of data
file and the format of the file is as follows.
DAT:1995
DON1
RT31 (or GP31)
B
V
1
JOHN
M
1.0
L1
06/20/95
13:16:33
E
0.000
I
0.500
Td+0319+1121
Td+0332+1172
Td+0123+2345
Tb+0351+1251
Tf+0298+6344
TF+0407+1434
TF+0407+1434
TF+0512+1732
TF+0432+1520
TF+0432+1528
TF+0432+1528
TB+0427+1512
Tb+0376+1327
TB+0420+1519
TB+0418+1548
TB+0407+1513
TD+0388+1441
TD+0378+1415
Td+0376+1438
Td+0372+1427
Td+0412+1397
Td+0468+1444
Td+0668+1223
Td+0868+0140
Tb+0376+1327
L2.5
06/20/92
13:19:37
W
20.000
I
-1.000
Tf+0887+0140
............
Initial line of data file
Name of the file as specified by the user
The Polycorder format file (RS31 - standard, GP31 - GPS format)
Both components (Quad-phase and Inphase)
Vertical Dipole mode
Orientations 1
Operator name
Mode (here Manual, can be A for Auto)
Samples/Record (if Auto this value indicates selected time interval)
Name of Line (name follows letter L)
Date
Time (it is the time when line was specified)
Direction (East)
Start Station
Increment between readings (follows letter I)
Each reading starts with letter T, and it is followed by a
single character (information byte). The ASCII number of this
character indicates dipole mode, range (scale), and Marker in
Auto mode. The information byte is followed by two fields (5
places
each including sign) indicating readings for Quadphase and Inphase.
Divide these values by 4 to get the actual readings in mV.
Information byte interpretation
Bit
Decimal
Value and Meaning
7 128
1
not used
6
64
Marker =1
trigger pressed
=0
otherwise
5
32
Mode
=1
for vertical operation
=0
for horizontal operation
4
16
0
not used
3
8
0
not used
2
4
Range 3
1
2
Range 2
0
1
0
not used
Range 3 and Range 2 represent sensitivity as follows:
Sensitivity Range 2
Range 3
10 mS/m
1
0
100 mS/m
0
1
1000 mS/m
1
1
Start of the next Line (2.5)
Date
Time
Direction (West)
Start Station
Increment (-1)
EM31-MK2 file with time stamp (GPS option) will contain two more columns Seconds/Hundreds of
Seconds and Hour/Minute e.g. line
Tb+0906+0150
1215 1614
means: Reading, time (24 h clock) is 16:14:12.15
Appendix A:
File Format Description
103
A.3 The Data File in the Polycorder 720 Format
Sample EM31 header and data files - Both components
Header file
minute
hour
year
DAT-90
H31TEST
H31HDN
| 0| 0| 0| 0|
|10|16|15|39|
|10|16|16|10|
| 0| 0| 0| 0|
| 0| 0| 0| 0|
|10|16|16|50|
&
orientation
operator
component B,Q or I
comment
0|*
|0|*|*
1|JOHNNY|B|V|TRAIL
0|*
|B|*|*
0|*
|*|*|END OF TRAIL
0|*
|B|*|*
0|*
|B|*|*
day
month
|*
|10
|20
|*
|*
|30
pointer to data file
start station
station increment
line name
|*|*|
|W|Y|
|E|Y|
|*|*|
|E|Y|
|W|Y|
dipole mode V,H or B
profile direction
.0|
1.0|
1.0|
0.0|
1.0|
1.0|
.0|
-1|
1|
0.0|
1|
-1|
0|
112|
0|
0|
50|
133|
0
1
8
10
13
22
time if AUTO
automatic mode Y/N
The first or the last line of header file can be empty, containing only * and 0. It is ignored by the PC
program.
Data file
In case of single component measurement the second column in the following file disappears
DAT-90
D31TEST
H31DAB
7
7
-.213 -.023
-.211 -.023
-.213 -.023
-.228 -.023
-.252 -.023
-.264 -.022
7
7
-.291 -.022
4
4
-.272 -.022
-.263 -.022
7
7
-.281 -.022
-.308 -.022
6
6
-.359 -.023
104
2
-4
-4
-4
-4
-4
-4
3
-4
4
-4
-4
5
-4
-4
0
-4
flag for new line, pointer to row 2 of header file
4 < 128 then V mode, 4 - gain is 30,
Conductivity = (-2)*(-.228*30) = 13.68 mS/m,
Inphase = (-1)*(-.023*12.04189) = 0.277 ppt
flag for new line 20, pointer to row 3 of header file
flag for comment
flag for new station (new segment) of the same line
skipped station
DAT31W Operating Manual
-.376 -.024
-4
-.369 -.024 -132
-.351 -.024
-4
-.339 -.024
-4
7
7
6
-.420 -.021
-4
5
0
0
&
...........
132 > 128 then reading was taken at H mode
132-128=4 then gain as above is 30
flag for new line 30
flag for end of file
EM31 file with time stamp (GPS option) will contain two more columns Seconds/Hundreds of Seconds
and Hour/Minute eg. line
-.420 -.021
-4
1215 1614
means: Reading (3 values), time (24 h clock) is 16:14:12.15
Table of Multipliers for Gain
EM31 Instrument
Scale
Digital Representation
1000
300
100
30
10
3
-1
-2
-3
-4
-5
-6
Multiplication Factor
Quad-phase [mS/m]
Inphase [ppt]
2000
600
200
60
20
6
(if single component)
500
150
50
15
5
1.5
If Both components were selected, the Inphase component (second column id data file) has only one gain
(-12.04189).
If absolute value of digital reading is larger than 128, it indicates Horizontal mode.
If absolute value of digital reading is larger than 16, then it indicates fiducial marker.
Example
Value of digital reading is -132
132 > 128
132-128=4
4 < 16
==> Horizontal Mode
==> No Fiducial Marker
-4 (because absolute values were used in above calculations)
From above tables factor to multiply voltage (e.g. 0.51) is:
0.51 * 60 = 30.6 mS/m (corresponds to Gain 30) for Quad-phase
0.51 * 15 = 7.65 ppt (corresponds to Gain 30) for Inphase (if single component)
Appendix A:
File Format Description
105
A.4 Examples of GPS File Formats
GPS File in Trimble Pathfinder ProXL/XR ASCII Format (PFINDER for DOS)
SSF->ASCII V2.05
Thu May 23 23:26:55 1996
Input File : C:\BRAMP\BRA1\R052314B.COR
Output File : C:\BRAMP\BRA1\R052314B.ASC
Datum
: WGS-84
Coordinate System : UTM [ 17T ]
Output positions
Parameter
--------Northing
Easting
Time
4841594.028,
4841594.027,
4841594.021,
4841498.297,
4841498.312,
4841498.322,
4841498.366,
.................
Columns
------[
1, 18 ]
[ 20, 38 ]
[ 52, 70 ]
607685.406,
607685.378,
607685.380,
607795.311,
607795.306,
607795.310,
607795.372,
Units
----Meters
Meters
14:07:38.00
14:07:39.00
14:07:40.00
14:47:38.00
14:47:39.00
14:47:40.00
14:47:41.00
GPS File in Trimble Pathfinder ProXL/XR/XRS ASCII Format
(Pathfinder Office for Windows)
“Note”,4835682.630,608991.847,03/31/97 16:54:57,
”Logging started: 16:54:37 03/31/1997 Mon (UTC time)”
“PosnPnt”,4835682.630,608991.847,03/31/97 16:54:57
“PosnPnt”,4835682.681,608992.009,03/31/97 16:54:58
“PosnPnt”,4835678.692,609001.027,03/31/97 16:56:35
“PosnPnt”,4835678.584,609001.345,03/31/97 16:56:36
“PosnPnt”,4835678.571,609001.320,03/31/97 16:56:37
“PosnPnt”,4835678.644,609001.372,03/31/97 16:56:38
GPS File in Ashtech Reliance ASCII Format
(TXT file)
Generic Line
line1, 1
274.337096
1997/08/25 21:11:24.000000,
1997/08/25 21:11:25.000000,
1997/08/25 21:11:26.000000,
1997/08/25 21:11:27.000000,
1997/08/25 21:11:28.000000,
1997/08/25 21:11:29.000000,
1997/08/25 21:11:30.000000,
1997/08/25 21:11:52.000000,
1997/08/25 21:11:53.000000,
1997/08/25 21:11:54.000000,
106
612093.955494,
612094.114538,
612094.257011,
612094.418909,
612094.566163,
612094.762445,
612094.945979,
612097.071026,
612097.122641,
612097.193598,
4829523.731399,
4829523.297356,
4829522.893570,
4829522.445676,
4829521.952000,
4829521.535781,
4829521.078066,
4829508.319582,
4829507.634384,
4829506.968742,
29.440896,
30.102338,
30.760720,
31.465749,
32.320072,
33.021448,
33.708173,
55.519831,
56.631542,
57.766556,
unprocessed,
unprocessed,
unprocessed,
unprocessed,
unprocessed,
unprocessed,
unprocessed,
unprocessed,
unprocessed,
unprocessed,
unprocessed,
unprocessed,
unprocessed,
unprocessed,
unprocessed,
unprocessed,
unprocessed,
unprocessed,
unprocessed,
unprocessed,
unprocessed
unprocessed
unprocessed
unprocessed
unprocessed
unprocessed
unprocessed
unprocessed
unprocessed
unprocessed
DAT31W Operating Manual
A.5 Description of Data File in EM31pro Format
Each record contains 22 characters, including line feed at the end of each record.
Header of the file (contains two records starting with characters E and H)
1
2
3
E M 3
4
5
6
7
1 M K
2
H
8
9
10 11 12 13 14 15 16 17 18 19 20 21 22
V
1
0
4 Survey Type UT ID IM IC
File Name
EM31MK2
V104
Survey Type
UT
ID
-
IM
-
IC
-
10
identification of program file (EM31SH for short EM31)
version number (V1.04)
GPS (if GPS Input Enabled) or GRD (grid)
unit type (0 = meters, 1 = feet)
EM31 Dipole Mode
(0 = Vertical, 1 = Horizontal, 2 = Both)
EM31 survey mode
(0 = Auto, 1 = Wheel, and 2 = Manual)
EM31 component
(0 = Both, 1 = Inphase)
file name, maximum 8 characters
this field depends on EM31 survey mode
Auto Mode
-Time Increment in seconds
Wheel Mode
- Wheel Increment (user units, see IT)
Manual Mode
- Samples/Reading
Line Feed character
File Name
Time/Wheel/Samples -
10
Time/Wheel/Samples
10
-
Header at the start of survey line (contains four records starting with L, B, A, and Z)
1
2
3
4
5
6
7
8
L
Line Name - 8 characters
B
Start Station (Format F11.2)
9
10
Time in milliseconds (Format I8)
Increment (Format F11.2)
A Dir
Z D
D M M
Line Name
Start Station
Time (ms)
Dir
Station Inc.
Date
Time
10
Appendix A:
10 11 12 13 14 15 16 17 18 19 20 21 22
-
Y
Y
Y
Y
H H
:
M M
10
10
:
S
S
10
Line Name, maximum 8 characters
Start Station for the Line, format F11.2
Time when Line was created in ms from start of the file
Direction of the Line (E, W, N, or S)
Station Increment, format F11.3
Date when Line was created, format DD-MM-YYYY
Real Time when Line was created, format HH:MM:SS
Line Feed character
File Format Description
107
Reading
1
2
3
4
5
6
Reading1
I Gn
I
-
Gn
-
7
8
9
10 11 12 13 14 15 16 17 18 19 20 21 22
Reading2
Time Stamp (8 digits)
10
indicator T, or 2
T
First reading at the station (default for Auto mode)
2
second reading at station (possibble only in Manual mode)
information byte, one character parameter,
the ASCII number of this character indicates following:
Bit
Decimal
Value and Meaning
128
1
not used
7
Marker
= 1 trigger pressed
6
64
= 0 otherwise
5
32
Mode
= 1 Vertical
= 0 Horizontal
0
not used
16
4
0
not used
3
8
Range 3
4
2
Range 2
1
2
0
not used
1
0
Range 3 and Range 2 represent sensitivity (gain) as follows
Both components (OPER mode)
Sensitivity Range 2 Range 3
Multiplication Factors
1000
1
1
Conductivity -0.25
100
0
1
Conductivity -0.025
10
1
0
Conductivity -0.0025
Multiplication factor for Inphase is the same for all ranges: -0.025
Inphase component (COMP mode)
Sensitivity Range 2 Range 3
Multiplication Factors
1000
1
1
Inphase
-0.0625
100
0
1
Inphase
-0.00625
10
1
0
Inphase
-0.000625
Conductivity is not recorded in COMP mode.
Multiply Reading by above factors to obtain reasult in mS/m or ppt.
If short EM31 is used divide all Inphase data by 3.35.
Reading1 Reading2 -
Time
10
108
-
five character field containing instrument output.
Conductivity if Both components, Inphase if Inphase was selected.
includes sign (+ or -) and four digits
five character field containing instrument output.
Inphase if Both components, not used if Inphase was selected.
includes sign (+ or -) and four digits.
time stamp of the reading in format HHMMSShh (HH:MM:SS.hh).
Line Feed character
DAT31W Operating Manual
Comment
1
C
2
3 4 5 6 7 8 9 10 11 12 13 14 15 16 17 18 19 20 21 22
Comment (maximum 11 characters)
Time Stamp (HHMMSShh)
10
New Station
1
S
2
3
4 5 6 7 8 9 10 11 12 13 14 15 16 17 18 19 20 21 22
New Station (Format 11.2)
Time Stamp (HHMMSShh)
10
Deleted Records
1
2
3
4
5
6
7
8
9
10 11 12 13 14 15 16 17 18 19 20 21 22
Reading
X Gn
Comment (maximum 11 characters)
X
Time Stamp (HHMMSShh)
10
Time Stamp (HHMMSShh)
10
GPS Data Message Records
Each GPS record (GGA Message) is broken in to several 20 characters strings and placed in the EM31pro
data file which contains 22 characters records, including one character indicator and line feed at the end of
each record. The GPS sequence starts at the line which contains character @ as the first character, then
records that contain continuation of the same message start with character #. The GPS sequence ends with
a line starting with the character !. The last line contains logger time stamp in milliseconds for given GPS
reading. A sample of the GPS message written in EM38pro format is given below.
1
2
3
4
5
6
7
8
9
10 11 12 13 14 15 16 17 18 19 20 21 22
G G A
,
h
h
m m
s
s
s
s
,
,
s
,
d
d
d m m
.
m m m m 10
@ $
G P
# m
.
m m m m m
# m
,
s
,
n
,
q
q
,
p
p
.
p
,
s
a
a
a
a
a
10
#
.
a
a
,
u
,
+
x
x
x
x
.
x
,
M
,
s
s
s
,
10
# a
a
a
*
c
c CR LF
!
.
d
d
m 10
10
H
H M M
S
S
h
h
10
The GPS sequence may contain 5 or 6 records. Component of the GGA message may differ in length,
however they are placed in the same number of columns. Refer to Appendix A (section A.2) for definition
of each component of GGA data message.
Appendix A:
File Format Description
109
A.6 Example of Data File in EM31pro Format
The EM31pro data file records are written in binary format, therefore the file may have different shape
when displayed or printed, depending on particular video or printer settings.
EM31MK2 V123GPS0000
H 122200A
0.200
L500
B
0.00
AW
1.000
Z12222001 00:12:21.58
T¤-0648-0652 00150419
T¤-0652-0656 00150441
T¤-0866-0875 00150462
T¤-0884-0888 00150484
T¤-0990-1002 00150501
@$GPGGA,050745.00,433
#6.59295,N,07936.6514
#5,W,2,7,1,140.81,M,#35,M,5,118*5A
!
00150515
T¤-1012-1011 00150521
T¤-0878-0873 00150540
T¤-0780-0784 00150560
T¤-0918-0929 00150580
T¤-1041-1053 00150599
@$GPGGA,050746.00,433
#6.59298,N,07936.6514
#7,W,2,7,1,141.19,M,#35,M,4,118*57
!
00150608
T¤-1101-1113 00150622
T¤-1284-1294 00150640
T¤-1620-1643 00150660
T¤-1814-1844 00150680
T¤-2149-2160 00150702
@$GPGGA,050747.00,433
#6.59299,N,07936.6515
#0,W,2,7,1,141.19,M,#35,M,5,118*50
!
00150717
T¤-2179-2180 00150725
T¤-1646-1640 00150745
T¤-1511-1507 00150763
T¤-1465-1468 00150783
T¤-1429-1433 00150810
@$GPGGA,050748.00,433
#6.59301,N,07936.6515
#0,W,2,7,1,141.13,M,#35,M,6,118*56
!
00150815
T¤-1420-1424 00150820
T¤-1753-1767 00150841
T¤-1897-1909 00150862
T¤-2020-2029 00150881
T¤-2166-2178 00150904
@$GPGGA,050749.00,433
#6.59303,N,07936.6514
#5,W,2,7,1,140.89,M,-
110
DAT31W Operating Manual
APPENDIX B
B.1 Short Overview of Programs Lynx and ProShell
Two programs, ProShell (includes ProLink) and Lynx, are supplied with the Pro4000 system and can be
used to transfer files between the Pro4000 and a desktop Windows based computer.
The program ProLink is factory installed in the Pro4000 ROM (drive A:). When ProShell is run (type PS to
run ProShell in Pro4000) ProLink is automatically initiated.
Lynx runs on computers equipped with Windows 95 or higher. To install Lynx, insert the Pro4000 Setup
disk (Utility disk #1) into drive A: on your computer and run the Setup program. The Lynx icon will appear
on your desktop after installation is complete. When Lynx is started two Windows Explorer type screens
will be displayed. The top screen, labeled Local, displays the contents of the PC. The bottom screen, labeled
Remote, displays the contents of the Pro4000 assuming a connection is established. Several file management functions can be performed using Lynx, including File Transfer, renaming folders, creating new folders or sub-folders, and deleting files.
B.2 Establishing Communication
To transfer data to and from a base computer, attach the cable (null modem serial communication cable)
between the Pro4000 and the computer COM ports. Run ProShell on the Pro4000 (type command PS to
run ProShell ) and Lynx on the PC computer.
Correct communication ports must be selected on both computers. To set up the serial port on the PC,
from Lynx select the Transfer/Select COM Port menu option. To set up the communication port on the
Pro4000, press <F5>(Xfer) from main screen of ProShell, and then press <F1> to toggle between ports
COM1 and COM2.
Juniper Systems recommends that the Pro4000 is in auto baud rate detection mode (the default setting). In
this mode, the Pro4000 tries to establish communication at 115K baud, and in case communication fails at
this rate, it automatically steps down to the next slowest rate until communication is established.
To start communication click on the Connect button (the green circulating arrows in the centre tool bar) or
select the Transfer/Connect to Remote menu option from Lynx. When connection is established the contents of the Pro4000 Field Computer will be displayed in the Lynx bottom Remote view screen.
Appendix B:
Transferring Files Using Lynx
111
B.3 Transferring Files to the Pro4000 from the PC
Select the folder in the Remote view screen. Transferred files will be saved in this folder.
In the Local view screen select files to be transferred to the Pro4000.
Click the Down arrow button or select Transfer/Send to Remote from the main menu. File transfer starts
immediately. In cases where the selected file exists in the logger the program will prompt for permission to
overwrite.
B.4 Transferring Files from the Pro4000 to the PC
Select the folder in the Local view screen. Transferred files will be saved in this folder.
In the Remote view screen select files to be transferred to the PC.
Click the Up arrow button or select Transfer/Receive from Remote from the main menu. File transfer
starts immediately. If selected files exist in the selected folder in the PC the program will prompt for
permission to overwrite.
When the transferring session is finished click the Disconnect button before disconnecting the serial cable. Otherwise, the Esc key must be pressed on the logger to return the Pro4000 to normal function.
Please refer to Pro4000 Field Computer User’s Manual (Section 5) for more detailed description of ProShell and
Lynx functions.
112
Geonics DAT31W Operating Manual


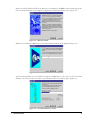
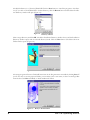
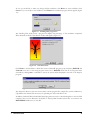
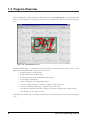
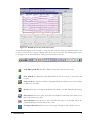


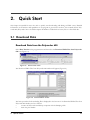

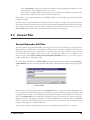

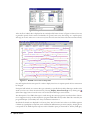

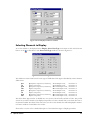


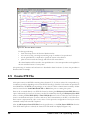
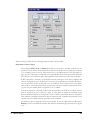
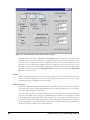


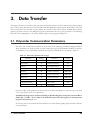
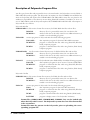

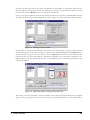
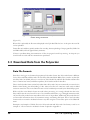
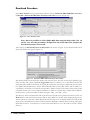


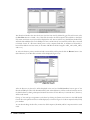

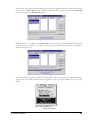
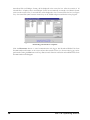

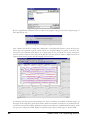
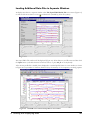


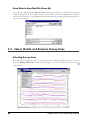
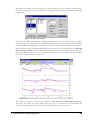
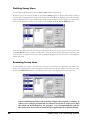
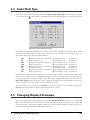
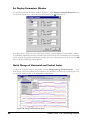
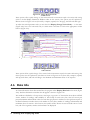
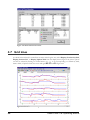
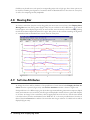
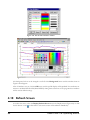
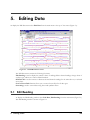
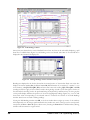

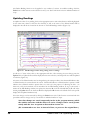

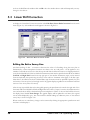
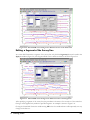

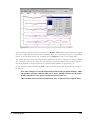


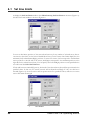
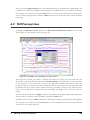


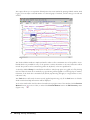

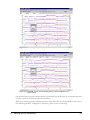
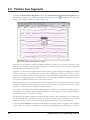
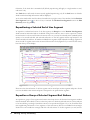
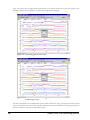
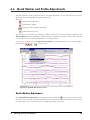


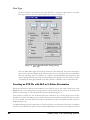
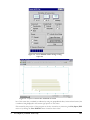

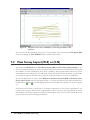

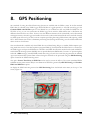
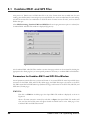
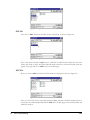
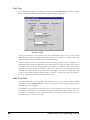
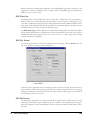
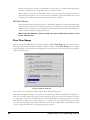
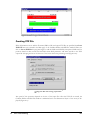
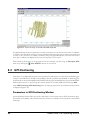
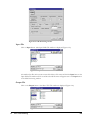
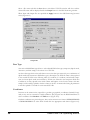
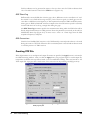
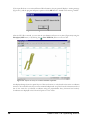
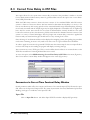
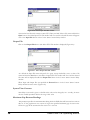
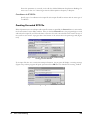


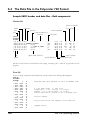


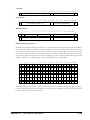
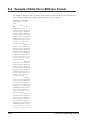


![English [2015v1]](http://vs1.manualzilla.com/store/data/005829431_1-1fdc30543d444fb0915a40c3aab945a8-150x150.png)