1
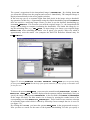
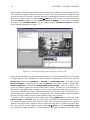
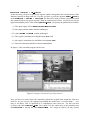
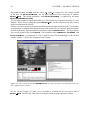
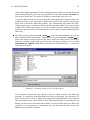
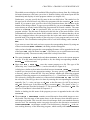
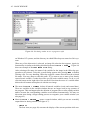
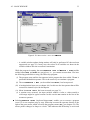
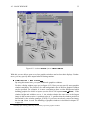
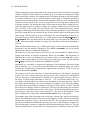
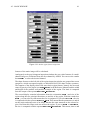
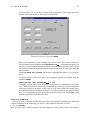
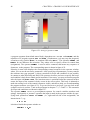
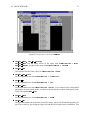
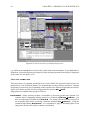
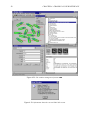
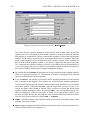
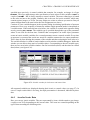
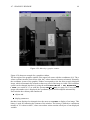
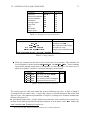
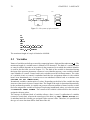
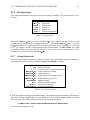
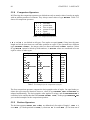
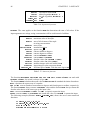
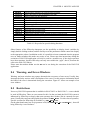
CHAPTER 4. GRAPHICAL USER INTERFACE
40
The frequency of the respective gray values is displayed within the Dynamic data area
of the display.
The selected range of gray values can be used for two major purposes. First, when the
combo box Display is set to Threshold, the image, from which the histogram was
computed, is segmented with a threshold operation with the selected minimum and
maximum gray value. Depending in the setting of the combo box Send, the segmentation
result is either displayed in the graphics window, from which the image was originally
sent (Send = Back), or to the active graphics window (Send = To Active). Second, if
Display is set to Scale, the gray values of the image are scaled such that the gray value
0 of the scaled image corresponds to the minimum selected gray value and the gray value
255 to the maximum selected gray value. Again, the combo box Send determines the
graphics window, in which the result is displayed. This mode is useful to interactively set
a “window” of gray values that should be displayed with a large dynamic range.
If you want to select threshold parameters for a single image, display the image in the
active graphics window and open the histogram tool. For optimum visualization of the
segmentation results, it is best to set the visualization color to a color different from black
or white (see Visualization . Color below). Now set Display to Threshold and
interactively drag the two vertical bars until you achieve the desired segmentation result.
The parameters of the threshold operation can now be read off the two vertical lines.
If you want to select threshold parameters for an image, which is derived from another image, but want to display the segmentation on the original image, e.g., if you want to select
thresholds for a gradient image, two different possibilities exist. First, you can display the
derived image, open the histogram tool, deselect Accept, display the original image, and
then select the appropriate thresholds. This way, only one window is needed for the visualization. For the second possibility you can display the derived image in one window,
make another window active or open a new window, display the original image there,
make the first window active again, open the histogram tool, make the second window
active again, set Send to To Active, and select your thresholds. Although in this case it
is not necessary to deselect Accept, it is advantageous to do so, because this prevents the
histogram from being updated if you click into a graphics window accidentaly.
Visualization
.
Region Info...
This menu item opens a tool for the convenient inspection of shape and gray value features of individual regions. It can, for instance, be used to determine thresholds for operators that select regions based on these features, e.g., select shape or select gray.
Figure 4.16 shows the layout of the region feature inspection window.
The strategy to determine the data from which to compute the features is very similar
to that of the gray histogram inspection window. You can display an image or region by
double-clicking on it in the variable window or you can select a region or an image which
is already displayed, by single-clicking it. If you display or click into an image, only the
gray value features of the entire image will be calculated. If you click into a region that
is not underlaid with an image, only the shape features of this region will be displayed.
If you click into a region that is underlaid with an image or into a region that has gray
value information (e.g., from reduce domain or add channels), both the shape and gray
value features of that region will be displayed. Finally, if you have overlaid an image with
a region, but click into a part of the image that is outside the region, only the gray value