1
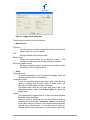
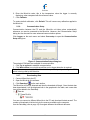
Note: To use this feature the data sets must have been recorded using the same
sampling rate e.g. every 1 minute
There are two modes when using the Multi-graph feature:
Standard mode
The time scale of all data on the graph is the same. The time and date of data recorded
in the first data set included on the graph is used.
For example, if you have a graph whose data was recorded starting 10:00AM on August
11, then all additional data added to the graph will be displayed with the same recording
date.
The MicroLab Lite data table below shows all data in the graph having the same time
scale:
Figure 7: MicroLite data table
Plot sync mode
To display data on the graph using the data’s actual time scale i.e. the time and date
when the data was actually recorded, use the Plot sync feature. This will also shift all
data in the data table accordingly.
Once you’ve added the data to the graph, on the Graph menu, select Plot sync to
enable the feature. To return to Standard mode, unselect Plot sync.
Note: The time scale of all data is rounded to the same resolution as the time scale of
the original data on the graph.
2.6.
Analysis Tools
2.6.1.
Setting the Analysis Tools Parameters
1. Click Analysis on the menu bar, then click Set Functions’ Parameters to open a
dialog box:
21