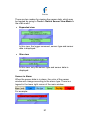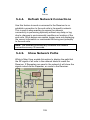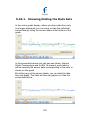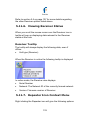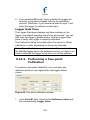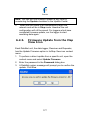
1
Committed to Quality DataNet Solution Wireless intelligent logging network User Guide For DataNet Data Acquisition System DataNet User Guide Supporting DataNet v1.2 June 2009 © Fourier Systems Ltd. Contacting Fourier Systems technical support: Email: [email protected] Web: www.fouriersystems.com/support/contact_support.php Telephone: USA 1-866-771-6682 (toll-free within USA only) For Troubleshooting and FAQs visit the website at: http://www.fouriersystems.com/support/faq/ To download updated versions of the DataNet User Guide and DataNet software/firmware visit: www.fouriersystems.com/support/download_center.php. Information in this document is subject to change without notice. © 2009 Fourier Systems Ltd. All rights reserved. Reproduction of this document in any manner without the prior written consent of Fourier Systems Ltd. is strictly forbidden. Table of Contents CHAPTER 1: WHAT’S NEW 1 CHAPTER 2: DATANET OVERVIEW 3 2.1. DataNet Introduction 3 2.2. What is ZigBee? 5 2.3. The ZigBee Concept 5 2.3.1. ZigBee Mesh Network Operation 6 2.3.2. Why is ZigBee Technology Key for Data Logging? 7 2.4. The DataNet System 2.4.1. The Data Logger 2.4.2. The Receiver/Repeater 2.4.3. Hardware Accessories 2.4.4. DataNet Software CHAPTER 3: 7 7 10 11 11 DATANET IMPLEMENTATION GUIDE 13 3.1. DataNet Network Architecture 14 3.2. Pre-setup Requirements 16 3.3. Launching the Software 16 3.4. Connecting the Receiver 18 3.5. Adding the Data Logger to the Network 20 3.5.1. Charging DataNet Loggers 20 3.5.2. Connecting the DNL910 and DNL920 Loggers to the Network 21 3.5.3. 3.5.4. 3.6. Connecting the Mini DataNet DNL808 and DNL810 Loggers to the Network Loading Map View Background Configuring the Logger 23 25 26 3.7. Viewing Data 3.7.1. Online Data Views 3.7.2. Logger Tooltip 3.7.3. Sensor View 28 29 30 31 3.8. Optimizing the Network 3.8.1. Signal Test Utility 3.8.2. Overcoming RF Obstacles 3.8.3. Showing the Network Path 3.8.4. Adding Repeaters to the Network 3.8.5. Short Range Repeater 32 32 33 34 36 36 3.9. Recommended Approach to Deploying DataNet Units 37 CHAPTER 4: DATANET HARDWARE OVERVIEW 40 4.1. Data Logger Front Panel Layout 4.1.1. DNL910 and DNL920 4.1.2. DNL808 and DNL810 40 40 41 4.2. Data Logger External Connections 4.2.1. DNL910 and DNL920 4.2.2. DNL808 4.2.3. DNL810 42 42 43 44 4.3. DNR900 Receiver/Repeater Front Panel Layout 44 4.4. DNR900 Receiver/Repeater External Connections 45 4.5. Data Logger Sensor Overview 46 4.5.1. 4.5.2. 4.5.3. 4.5.4. 4.5.5. Internal Sensor Types External Sensor Types Sensor Connection External PT-100 and NTC Sensor Connection Programming Limitations for DNL910 and DNL920 4.5.6. 4.5.7. 4.5.8. 4.5.9. 4.5.10. 4.5.11. External Alarm Output Polarity Frequency/Pulse Counter User Defined Sensors Sensor Alarms Sensor Calibration 49 50 52 52 52 53 53 Unit Serial Number and Comment 54 4.6. 46 47 48 48 4.7. Power Supply 4.7.1. DNR900 in Receiver Mode 4.7.2. DNR900 in Repeater Mode 4.7.3. DNL910 and DNL920 Data Loggers 4.7.4. DNL808 and DNL810 Data Loggers 4.7.5. Power Adapter 4.7.6. Data Logger Battery Life 54 54 55 55 56 57 57 4.8. 58 USB Communication Cable 4.9. DataNet Keypad Overview 4.9.1. DNL910, DNL920 and DNR900 Keypad 4.9.2. DNL808 and DNL810 Keypad 59 59 60 4.10. Operating the DNL910 and DNL920 4.10.1. Turning on the Unit 4.10.2. Display Shutdown 4.10.3. Joining a Network 4.10.4. Main Menu Options 4.10.5. Additional Logger Screens 61 61 61 62 65 71 4.11. 73 Operating the DNL808 and DNL810 4.11.1. 4.11.2. 4.11.3. 4.11.4. Turning the Units Off and On 73 Leave Network and Reconnect to a New Network 74 Running Logger Signal Test 75 Call Unit from Software 76 4.12. Operating the DNR900 in Receiver Mode 4.12.1. Turning on the Unit 4.12.2. Receiver Menus 4.12.3. Changing Receiver to Repeater 4.12.4. Additional Receiver Screens 77 77 77 79 79 4.13. Operating the DNR900 in Repeater Mode 4.13.1. Turning on the Unit 4.13.2. Joining a Network 4.13.3. Menu Options 4.13.4. Additional Repeater Screens 80 80 80 83 88 CHAPTER 5: 90 USING THE DATANET SOFTWARE 5.1. Installing DataNet Software 5.1.1. System Requirements 5.1.2. Installation Procedure 5.1.3. Installation Troubleshooting 90 90 91 94 5.2. DataNet Software Layout 5.2.1. Map View 5.2.2. Sensor View 5.2.3. History View 5.2.4. Data Map 5.2.5. DataNet Toolbar Icons 94 95 96 98 99 100 5.3. File Menu Items 5.3.1. Open 5.3.2. Open Project File 5.3.3. Save Project 5.3.4. Save Project As 5.3.5. Exit 106 106 107 107 107 107 5.4. Network Menu Items 5.4.1. Detect Receiver 5.4.2. Lock Network 5.4.3. Form New Network 5.4.4. Refresh Network Connections 5.4.5. Show Network Paths 107 107 108 108 109 109 5.5. Tools Menu Items 5.5.1. Define Sensor 5.5.2. Switch Sensor View Mode 5.5.3. Lock Map View 5.5.4. Options Menu 5.5.5. Email Alarm Notifications 5.5.6. SMS Alarm Notifications 5.5.7. Firmware Update Center 110 110 112 112 112 112 113 113 5.6. Tools > Options Menu Items 5.6.1. Preferences Tab 5.6.2. Email Settings Tab 5.6.3. SMS Settings Tab 5.6.4. Analysis Menu Items 113 114 116 117 118 5.7. Data Recovery 119 5.8. Saving Data 120 5.9. Viewing Archived (Offline) Data 121 5.10. Viewing Online Data 5.10.1. Showing/Hiding the Data Sets 123 125 5.11. Working in Map View 5.11.1. Loading Map View Wallpaper 5.11.2. Moving Icons around the Screen 5.11.3. Logger Icon Context Menu 5.11.4. Viewing Logger Status 5.11.5. Receiver Icon Context Menu 5.11.6. Viewing Receiver Status 126 126 127 127 130 132 133 5.11.7. 5.11.8. Repeater Icon Context Menu Viewing Repeater Status 133 135 5.12. Configuring the Logger 5.12.1. Device Setup Tab 5.12.2. Alarm Setup Tab 136 136 139 5.13. Alarm Notifications Setup 5.13.1. Contacts Tab 5.13.2. Groups Tab 5.13.3. Notifications Setup Tab 5.13.4. Email and SMS Notification Formats 141 142 144 145 147 5.14. Calibration 148 5.14.1. Introduction to DataNet Calibration 149 5.14.2. Calibrating the Data Logger 152 5.14.3. Performing a Two-point Calibration 153 5.14.4. Performing an Offset Calibration 154 5.14.5. Setting the Offset to a Specific Input 155 5.14.6. Calibrating the Internal Temperature Sensor on the DL910 155 5.14.7. Calibrating the External PT-100 Sensor Input 156 5.14.8. Saving Calibration Settings 156 5.14.9. Loading Calibration Settings 156 5.15. Analyzing the Data 5.15.1. Using the Graph Features 5.15.2. Statistical Analysis 157 157 163 5.16. Exporting Data to Excel or CSV Formats 164 5.17. Printing the Data 165 5.18. System Password 166 CHAPTER 6: UPDATING DATANET SOFTWARE AND FIRMWARE 167 6.1. Using the Uptodata Client 167 6.2. Updating DataNet Firmware 6.2.1. Downloading the Firmware File 6.2.2. Firmware Update from the Update Center 6.2.3. Firmware Update from the Map View Icon 172 173 173 177 APPENDIX A: 179 DATANET SPECIFICATIONS A.1. Data Logger Input Types 179 A.2. DNL910 and DNL920 Outputs 180 A.3. Logger Input Specifications DNL910 and DNL920 180 A.4. Sensor Specifications DNL808 and DNL810 182 A.5. General Specifications 182 A.6. System Requirements 185 APPENDIX B: SAFETY INFORMATION AND FCC IDS 186 APPENDIX C: ORDERING INFORMATION 189 APPENDIX D: FIGURES AND TABLES 192 Chapter 1: What’s New This DataNet user guide supports the following DataNet release: • Software version 1.2 • Firmware version 1.89 • New hardware DNL808 and DNL810 Mini DataNet data loggers In addition to bug fixes, the new features in this release include (but are not limited to): DataNet software v.1.2 new features • Support for new Mini DataNet product family, DNL808 and DNL810. Refer to section 2.4.1. • Release of Uptodata client allowing automatic detection and upgrade of new DataNet software and firmware releases from the Fourier server. Refer to Chapter 6:. • External alarm; software activates external alarm connected to Receiver or data logger external alarm output, when alarm is present in the system. Refer to section 4.5.6. • New GUI which differentiates between e-mail and SMS Alarm notification menus. Refer to section 5.13. • Ability to save custom graph view. Refer to section 5.15.1. • Dynamic data statistics, which updates statistics tab according to cropped data on the graph. Refer to section 5.15.1. 1 • Ability to add a Grid format onto the graph background. Refer to section 5.15.1. • Ability to calibrate all Thermocouple types simultaneously rather than one at a time. Refer to section 5.13.4. DataNet firmware v1.89 new features • Support for new Mini DataNet product family, DNL808 and DNL810. Refer to section 2.4.1. • Ability to run DNL910 and DNL920 loggers as Short Range Repeater (option available via the software). Refer to section 3.8.4. • Improved power consumption on DNL910 and DNL920 with up to 6 months battery life. • Contact sensor option on DNL910 and DNL920 Inputs 14. Refer to section 4.5.2. • Hourly synchronization of data logger clock preventing time drift from the PC clock. • Units with no parent search every five minutes in order to reduce power consumption and conserve battery life. • When a logger is stopped data that was not downloaded is automatically downloaded and saved on the PC. • When data logger sends alarm notification message, it also includes the last recorded sample. Refer to section 5.13. • Following reset the units will continue to operate as they were prior to reset i.e. will continue to log data if they doing so before reset. New Receiver/Repeater features Ability to switch Repeater back to Receiver mode even if no network is found. Refer to section 4.13.3. 2 Chapter 2: DataNet Overview This chapter provides a general overview of the DataNet system as well as the concept behind the ZigBee RF protocol. 2.1. DataNet Introduction The Wireless Intelligent Logging Network Fourier Systems next generation data logging system is the DataNet, a 16-bit, mobile data acquisition network based on the innovative and reliable ZigBee technology. This solution provides an intelligent sensor mesh system with 100% data receipt and no data loss. The DataNet system is comprised of a family of data logging units, as well as a Receiver to manage the intelligent network and Repeaters to extend the transmission range. The data loggers measure a broad range of parameters and include models that feature between one and four inputs for direct measurement and recording of PT-100, thermocouple, 0-1 V, 4-20 mA, contact, frequency and pulse sensors, as well as internal temperature and relative humidity sensors. These models range from loggers with graphic display, AC or battery power supply, to models with no display and battery power only. Data is transmitted from the end units to a Receiver connected to a central computer. The system leverages the ZigBee protocol, a 2.4 GHz license-free frequency RF band, to ensure full data integrity. By adding DataNet Repeater units 3 to the network, you can extend the transmission range and form a reliable mesh network of up to 65,000 units. With its high resolution and fast Analog to Digital converter (ADC), DataNet data loggers meet the majority of data acquisition requirements in most industrial applications. Every DataNet logger unit is embedded with a unique serial number and can be loaded with a descriptive comment for safe identification. An internal clock and calendar keeps track of the time and date of every sample measured. DataNet loggers can automatically activate external alarm events when data is outside a specified range. Email and SMS notifications can be sent to predefined contacts. The DataNet system is powered by the powerful DataNet software. The Windows ™ based software is the central management interface of the DataNet network. Data is monitored online and can be displayed in graphs or tables. You can analyze data with various mathematical tools, or export data to a spreadsheet. The software also enables you to configure, calibrate or update the firmware of DataNet units wirelessly. Key DataNet benefits include: • Reliable transmission ensuring no data loss • Long-range monitoring • Ability to constantly expand transmission range by adding additional Repeaters, or turning loggers into Repeaters • Portable units facilitating easy deployment in various environments • Remote programming and firmware updates • 65,000+ possible end units • 16-bit resolution • Low-power consumption 4 • Long battery life • Minimal costs thanks to wireless infrastructure 2.2. What is ZigBee? ZigBee is a standards-based protocol built around the IEEE * 802.15.4 wireless protocol, providing the network infrastructure required for wireless, low power network applications. The mesh network eliminates single points of failure by providing multiple pathways for data to travel. * IEEE is the Institute of Electrical and Electronics Engineers, a non-profit organization dedicated to furthering technology involving electronics and electronic devices. 2.3. The ZigBee Concept The Coordinator: This device creates and maintains the network. Once the network is up and running, the coordinator behaves as just another device on the network. There is only one Coordinator in a ZigBee network. The Router: A router relays data packets/messages between devices on the network and increases the distance between these devices. The End Unit: This device sends and receives information to other devices on the network. It is usually a control or a sensor unit, often battery operated. A ZigBee end unit cannot relay messages. ZigBee Terminology DataNet Terminology Coordinator Receiver Router Repeater End Unit Data Logger 5 ZigBee enables mesh networking which supports a wireless, yet integrated environment with communication between many coordinators, routers and end units in environments where multiple applications are being monitored. 2.3.1. ZigBee Mesh Network Operation Figure 1: ZigBee network diagram In a mesh network, all the router units are aware of their environment meaning a router knows with units are close by. When a router sends a message to a specific unit, it relays the message until it gets to the destination. Network recovery from a unit failure In a mesh network, when a router fails, the network automatically finds a different path via a different router for the message relay. This ensures maximum protection against a network breakdown. 6 2.3.2. Why is ZigBee Technology Key for Data Logging? ZigBee technology has proved to be ideal for data acquisition networks which require meter reading, parametric display of data such as temperature or humidity and responsive action when parameters are crossed. This is due to the fully automated, flexible and reliable nature of the protocol. With the Mesh Network system, the ZigBee standard redresses misbalances in any data logging system, responding to weaknesses, inefficiencies, new network structure (with the additional or removal of devices) through self correction. 2.4. The DataNet System The basic DataNet system will contain at least one of the following units: • DataNet data logger – Part Number DNL808, DNL810, DNL910, DNL920 • Receiver/Repeater unit – Part Number DNR900 • Mini-USB cable • Power adapter (one per DataNet unit ordered) • DataNet Software CD 2.4.1. The Data Logger There are four distinct data logger models compatible with the DataNet system. These are the so-called end units of the system. These loggers support up to four external sensors and two internal sensors, temperature and humidity, depending on the specific model. Data is recorded and stored 7 to the logger’s internal memory and transmitted over the network to the DataNet software running on the PC. The data logger is programmed to consume as little power as possible during operation, in order to conserve the battery life. When not transmitting or recording data the units are in sleep mode and they wake up when needed. The battery for the DNL910 and DNL920 is rechargeable and can run up to several months on one charge, depending on the logger configuration. The battery for the DNL808 and DNL810 is not rechargeable and can run up to ten months before being replaced, depending on the logger configuration. Refer to section 4.7.6 for more information. Note: Battery life depends on the logger sampling rate, transmission rate, type of sensor, network architecture and number of measured sensors. The four DataNet models can be divided into two groups: • DataNet loggers (with LCD) • Mini DataNet loggers (without LCD) DataNet Loggers (with LCD) Part Number: DNL920 Part Number: DNL910 8 Four external channel RF data logger with two internal sensors, Humidity and Temperature Four external channel RF data logger with internal Temperature sensor Transmission Range: Up to 80 m line of sight Transmission Range: Up to 80 m line of sight Memory Capacity: ~59,000 samples Memory Capacity: ~59,000 samples Power supply: AC or battery operated Power supply: AC or battery operated Mini DataNet Loggers (without LCD) Part Number: DNL808 Part Number: DNL810 Single channel RF data logger supporting external temperature NTC 10KΩ probe Dual channel RF data logger with internal Temperature and Humidity sensors. Transmission Range: Up to 80 m line of sight Transmission Range: Up to 80 m line of sight Memory Capacity: ~59,000 samples Memory Capacity: ~59,000 samples Power supply: Battery operated Power supply: Battery operated 9 2.4.2. The Receiver/Repeater The DNR900 Receiver/Repeater unit can be programmed by the user to work in either mode. The Receiver acts as a bridge between the DataNet network and the PC. It is connected to the PC via USB cable and is used to create the network to which you add your data loggers. The Receiver is externally powered but also includes a rechargeable battery for back up (in case the external power fails). Note: Each Receiver can detect up to 8 data loggers and 16 Repeaters. To detect more data loggers, Repeaters are required. The Repeater is externally powered via the USB port but also includes a rechargeable battery for back up (in case the external power fails). These units are considered the backbone of the network, as they enhance the network range by receiving and transmitting the data from Repeater to Repeater until the data reaches the designated end unit or the PC. The Repeaters are the end units’ parent units, meaning each Repeater has specific end units under their responsibility (their children). They route the transmissions to and from the end units to the Receiver (or other Repeaters in the network). Each Repeater holds the data sent to the end units while the end units are in sleep mode. At a specific interval the end unit wakes up and receives the data from its parent (Repeater). Note: Each Repeater can detect up to 24 data loggers and 16 Repeaters including the parent unit. If the number of loggers exceeds this capability, additional Repeaters are required. 10 Part Number: DNR900 Repeater Transmission Range: 800 m line of sight End Units per Receiver: ~65,000 2.4.3. Hardware Accessories The DataNet system includes the following accessories: • Mini-USB cable for connecting PC to DataNet Receiver • Power adapter to power DataNet Receiver, Repeater and data loggers 2.4.4. DataNet Software The user interface for the DataNet system, the DataNet software CD is provided together with the DataNet hardware and includes the following features: • Network management • Data display, management, storage and data diagnostics 11 • Alarm settings: Email and SMS notifications, visual and audible alarms • Wireless sensor definition • Wireless sensor calibration • Wireless firmware update (boot over the air) • Automatic software update (via Fourier server) The software interface is described in detail in Chapter 5:. Note: DataNet is also FDA 21 CFR Part 11 compliant. CFR compliant software must be purchased separately. 12 Chapter 3: DataNet Implementation Guide Fourier Systems strongly suggests first time users of the DataNet system read this chapter before drilling down into the many features of the system described later in the user guide. The Implementation Guide will give you a clear understanding of the basic aspects of setting up the system, and getting your network up and running. Once you are familiar with the technical aspects of setting up the network as outlined in this chapter, please consult section 3.83.9 for Fourier’s recommended approach to initial deployment of the system. Example Below is a diagram depicting a supermarket deployment of a DataNet system, illustrating how the devices may be positioned to provide full coverage within the facility. Figure 2: Example of DataNet network application 13 3.1. DataNet Network Architecture The DataNet network architecture consists of layers of loggers and Repeaters, forming a mesh network monitored by the Receiver unit connected to the workstation PC. The basic architecture is as follows: • Maximum nodes on network: 65,000 • DNR900 Receiver recognizes up to 8 loggers and 16 Repeaters • DNR900 Repeater recognizes up to 24 loggers and 16 Repeaters (including parent unit) • DNL910 and DNL920 in Short Range Repeater mode (refer to section 3.8.5) recognizes up to 24 loggers and 16 Repeaters The diagrams below show the architecture of a typical DataNet mesh network. Repeaters and loggers, which are being used as Short Range Repeaters in Figure 4 (see section), can be added to the network in order to extend the range and improve its robustness. Each such device has end units communicating with it, but this route may change as the RF environment changes. This is the ZigBee’s self correcting mechanism at play. 14 DL 1 DL 8 DL 1 DL 24 RC 1 24 DL DL RP RP 1 16 RP RP 1 15 Figure 3: Standard DataNet mesh network architecture USB DL DL DL DL RC DL DL DL DL DL DL RP DL RP SRR DL RP DL RP DL DL DL DL RP SRR DL DL DL DL DL DL DL DL Figure 4: DataNet network with Short Range Repeaters 15 3.2. Pre-setup Requirements Prior to commencing with the DataNet implementation you must have the following requirements in place: PC • 24/7 availability • Reliable AC power • Sufficient hard disk space to store loggers’ data • One free USB port DataNet devices • One DNR900 DataNet Receiver • At least one DataNet logger DNL910 or DNL920, or Mini DataNet logger DNL808 or DNL810 • At least one DNR900 DataNet Repeater, depending on your environment Mini-USB cable The mini-USB cable connects the DNR900 Receiver to the PC (and is supplied with the PC Suite software kit). 3.3. Launching the Software 1. Install the DataNet software on the PC workstation. Refer to section 5.1: Installing DataNet Software on page 90 for more details. 16 2. Once the software and associated components have been installed, launch DataNet from your DataNet desktop shortcut . 3. The main DataNet window is launched. The default view is called Map View. Figure 5: Main DataNet window 4. Check for DataNet updates. Go to Help > Check for Updates from the DataNet main menu to check for newer versions of DataNet software and firmware released since you purchased your system. For more details on the Update feature go to Chapter 6: Updating DataNet Software and Firmware. 17 3.4. Connecting the Receiver 1. Only once the DataNet software has been installed, connect the DataNet Repeater unit (DNR900) to the Fourier-supplied power adapter. Note: Only use adapters provided by Fourier Systems. Use of the wrong adapter could damage your DataNet units. on 2. Turn on the unit by pressing the Scroll button the front keypad. The unit will beep when turned on. 3. Verify that the unit is in Receiver mode by seeing the following screen on the LCD: DataNet Receiver ID: 123.456.789 The ID will be unique to your Receiver network. If the unit is in Repeater mode, switch it to Receiver mode. Go to section 4.13 for more details. 4. Connect the mini-USB cable to the computer and to the Receiver’s mini-USB port. The DataNet Receiver icon will immediately appear in the top left corner of the Map View. 18 Figure 6: Adding Receiver icon to Map View A green icon indicates that the Receiver is online. Note: If the Receiver is not recognized by the software try connecting the mini-USB cable to another USB port on the PC. Or select Network > Detect Receiver in the main menu. Should you disconnect the Receiver’s USB cable or power adapter (and the battery eventually dies), the Receiver icon will be grayed out: 5. Go to Network > Form New Network. The Receiver will then form a new network based on your RF environment rather than use the network formed in the factory. This will ensure optimal network performance. Refer to section 3.8: Optimizing the Network for more details. Check the DataNet network ID that was formed by the Receiver by placing the mouse cursor over the Receiver icon. The network ID as well as Receiver firmware version and unit serial number is displayed. Figure 7: Receiver tooltip Note: You can move the Receiver icon elsewhere on the screen by going to Tools > Lock Map View and unselecting this option. 19 3.5. Adding the Data Logger to the Network Once you have connected your Receiver and established a network you are ready to add data loggers and build your system. 3.5.1. Charging DataNet Loggers This section refers to charging the DNL910 or DNL920 loggers. The Mini DataNet units are battery operated only. Note: Only use adapters provided by Fourier Systems. Use of the wrong adapter could damage your DataNet units. If the loggers will run from the battery supply make sure to first charge each of the loggers for 16 hours before use in order maximize the battery life. A fully charged battery can last several months, depending on your logger configuration. Refer to section 4.7.6 or more details on battery life. If the loggers will run from the AC power supply, when first connected to the AC adapter the logger will always initiate the 16 hour charge cycle. Note: For loggers measuring data with the internal temperature sensor, it is critical to note that during the charge cycle the logger will heat up thereby causing the internal temperature sensor reading to rise up to 10 ˚C above ambient temperature. Once the charging process is complete, the logger will cool down and the internal temperature sensor readings will return to normal. 20 For loggers remaining connected to AC power, to prevent the logger from heating up again following the initial charge cycle, the logger will receive a one minute trickle charge each day rather than stay continually charged. This is sufficient to ensure the logger doesn’t self-discharge and will maintain the logger’s full charge status. Refer to section 4.7.3 for more details on the DataNet loggers’ power supply. 3.5.2. Connecting the DNL910 and DNL920 Loggers to the Network 1. Turn on the logger by pressing the Scroll button . The unit will beep when turned on. As soon as the unit is turned on, the LCD screen will display the following message: Fourier Systems DataNet Logger 2. The logger will then start scanning for networks. The LCD will indicate how many networks were found in range, and will announce when the scan is complete. Locked networks will not be listed. Scan for network Scan for network Found 2 networks Scan complete To join the network created by your Receiver (there may be other networks created by your colleagues) scroll through the found networks on the LCD (using the logger Scroll button) 21 when you reach the required and press the Enter button network. In the example below, the network required is the second network found. You can also rescan the networks by pressing Enter on the Rescan networks screen, which is reached by scrolling through all the found networks. Network 1: ID: 014.061.082 Network 2: ID: 026.167.85 Rescan networks Note: If the logger did not detect a network, the unit will turn off in order to conserve the battery. 3. Once you select the network, the logger will automatically join that network and a new message will be displayed on the LCD: Joined network: ID: 026.167.85 Note: If the message Join failed appears on the LCD, then rescan for the network and try again. If the logger continually fails to join, then form a new network on the Receiver. 4. The LCD will then indicate the following status message: Fourier Systems Ready 22 If the Receiver is disconnected for any reason, the following message is displayed: Fourier Systems No Receiver 5. When the logger joins the network, the Logger icon will automatically appear in the Map View. symbol indicates the signal strength of the a. The logger in the network. b. The symbol indicates that the logger is running symbol indicates from internal battery supply. The that the logger is running from external power supply. c. The symbol indicates that the logger is a new addition to the network and has not yet been configured (setup). 6. Repeat steps 1-3 for every logger in your system. 7. In order to find the physical location of the logger you can right-click on the Logger icon in Map View and select Call Unit (Beep). The logger will then beep. 3.5.3. Connecting the Mini DataNet DNL808 and DNL810 Loggers to the Network As the Mini DataNet loggers don’t have LCD screens therefore the process of joining these units to the network differs than that of the DataNet models with LCD. 23 Follow the steps below to connect the Mini DataNet loggers to the network. 1. In the main menu, go to Network > Device Filter to first define the Mini DataNet loggers that are allowed to connect to the network. Enter the SN of each Mini DataNet device in the text window and click Add. Click Remove to remove a SN of a logger you don’t want to join the network. Figure 8: Mini DataNet Device Filter dialog If a Mini DataNet logger tries to join the network but it is not in the list then the software will send the Leave 24 Network command to the logger as it tries to connect to the network. When a logger tries to connect to a network and the software is down it will continue to the next available network. If the software is up either the software will accept it or it will send the Leave Network command. 2. Ensure the network is not locked. Go to the Network menu and uncheck the Lock Network menu item. 3. Take the first Mini DataNet unit and give the button on the front panel a short press. The LED will blink orange until the network is found. Once the network is found, the LED will blink green three times. The logger has now joined the network and the logger icon will appear in the Map View. 4. Repeat Steps 1 to 3 for all Mini DataNet loggers you wish to join to the network. 3.5.4. Loading Map View Background Load an image into DataNet showing a map of your facility in order to place the Receiver and Logger icons in their relative positions. As you add more loggers to the system, this will prove very helpful. • Double click the Map View background to browse to the image directory and load the image. Remember to unlock the Map View in order to move the icons around. • Right-click the Map View background and two options will be available: Load Wallpaper and Reset Wallpaper, which resets to the default Fourier wallpaper. 25 Figure 9: Map View background image example 3.6. Configuring the Logger Once you connected your DataNet loggers to the network, you must configure them in order to start acquiring data. 1. Right-click on the Logger icon you wish to configure. Select Setup from the context menu. The Setup window will be launched. 26 Figure 10: Logger Setup window This dialog provides non-editable information such as the serial number, battery level, reception level and firmware version of the current unit. On the Device Setup and Alarm Setup tabs, the user is able to configure the following parameters: Unit's comment Sampling rate Transmission interval Samples averaging Temperature units °C/°F (on the logger LCD. Not applicable for Mini DataNet loggers) 27 Active sensors Custom sensors' names Alarm levels Alarm duration Alarm delay Alarm pre delay 2. Select the sensors you wish to connect to the logger for data acquisition. It doesn’t matter which order you select the sensors. You may only have Input 4 selected, for example, and Inputs 1 to 3 left unselected. 3. Select the sampling rate and transmission interval (rate at which the data is transmitted from the logger to the Receiver). 4. Unless you have Alarm levels you wish to edit (see the Alarms Setup tab), click either Setup and Run (to send the setup and immediately log data), or Setup Only (to send the setup but only log data at your command). 5. If you selected Setup Only in step 4, right-click the Logger icon and select Run from the context menu to start logging data. 6. To stop the logger, right-click the Logger icon and select Stop from the context menu. Note: Running the logger clears the logger memory. All previously recorded data will be erased when you begin a new logging session. 3.7. Viewing Data Once you run the logger, you have several ways of viewing the online data that is being acquired. • Online graph/table/statistics views 28 • Logger icon tooltip • Sensor view 3.7.1. Online Data Views Double clicking the Logger icon or selecting Display Data in the Logger icon context menu will open the online graph. This graph is updated in real-time with the newly recorded data. You can switch between Graph, Table and Statistics views to view the data in different formats. Figure 11: Online data – Graph view 29 Figure 12: Online data – Table view Figure 13: Online data – Statistics view 3.7.2. Logger Tooltip Close the online data window and return to Map View. Scroll over the Logger icon and you will see a tooltip displaying the relevant logger information, including real-time data. 30 Figure 14: Logger tooltip This tool-tip is updated with every newly recorded sample. 3.7.3. Sensor View Click the Sensor View icon in the tool bar to switch to this view. Here, you can monitor the data by viewing data display of each individual sensor, rather than of each logger. Figure 15: Sensor view • If the sensor is in alarm, the sensor box will change color from green to red (just as the Logger icon would). • Double-clicking the individual sensor window will open the data in the online Graph view. 31 Note: By going to Tools > Switch Sensor View Mode you can reduce the size of the sensor window to display only the sensor type and sensor data. Recommended for networks with many loggers. 3.8. Optimizing the Network This section outlines a number of features and suggestions for optimizing the DataNet network and getting the best performance out of the end units and parent units. For example, when you first setup your network, you want to ensure that the loggers are placed in the optimum position in order to receive and transmit data to/from the DataNet software. Refer to the DataNet specifications to guide you on the range of the DataNet units. With this knowledge, and based on the layout of your facility, you should have a good idea of the likely positional layout of your units. 3.8.1. Signal Test Utility Rather than setup the system on a trial and error basis, DataNet has a Signal Test utility built in to the logger firmware, which gives you a clear idea of the strength of the signal of each logger to the Receiver, and the quality of the data link between Receiver and logger. Perform the following test on each logger in your system while deciding where to position the logger: 1. Using the Scroll button, scroll through the main menu on the logger until you reach the following display: 32 Signal level: Run test -> Menu 2. Press the Menu button to run the test. The signal level and link quality will be displayed. As you move the logger further away from the Receiver, you will see these two parameters drop from a maximum of 100%. When the logger is out of range of the Receiver, you will see the following screen: Out of range 3. To exit the Signal test, press the Scroll button. 3.8.2. Overcoming RF Obstacles A universal issue concerning any wireless system is how to overcome a hostile RF environment. DataNet’s ZigBee RF protocol has been designed for these hostile RF environments that routinely exist onsite. ZigBee can overcome competing wireless noise and other problems communicating the data. Its mesh networking capabilities allows it to re-route signal traffic around temporary or permanent physical obstacles, radio-frequency interference, Repeater error or other such failures. The robustness of the system is such that there is no single point of failure, ensuring data recovery from end units on the network. 33 Tips on overcoming RF barriers • When first creating the network in the environment where the loggers will be deployed, form a new network on the Receiver. There may be local interference on the 2.4 GHz free bandwidth. The ZigBee protocol, when forming a new network, selects the least noisy channel (out of 16 available channels). Within this channel the units can change RF slots (by hopping) but cannot move to other channels while running. By running on a channel on a network created in another environment e.g. in the office, this channel may become noisy and therefore transmission range may be less than expected. • When placing units in an indoor or outdoor environment, bear in mind that walls, furniture, metal objects, etc. limit the RF coverage thereby reducing the range of the units. • Add Repeaters (DNR900) in range of end units and parent unit to enhance RF coverage and improve robustness of network. Have as many alternative transmission routes as possible in order to eliminate single points of failure. • When placing Repeater ensure it is not on the limit of its range to the end unit or parent unit (Repeater or Receiver), to avoid periods of unavailability due to changing RF conditions. • Add Short Range Repeaters (DNL910 or DNL920) to overcome RF interference nearby to the loggers. • The higher the Receiver is positioned the better reception quality it will obtain. 3.8.3. Showing the Network Path By going to Network > Show Network Paths in the DataNet main menu, the software will show the actual path that the 34 system uses to communicate between Receiver and logger, for all units in the system. Figure 16: Showing network paths – Example 1 You can also select Show Path from the logger context menu to display the individual path from the unit to the Receiver. Using this option you can see exactly how the system is built. Figure 17: Showing network paths – Example 2 The screenshot above shows a system of three loggers (red squares) and two Repeaters (blue circles) transmitting to the Receiver. 35 The arrows show the path between the units. Note that they are bi-directional, meaning that the system is a two-way system with units both transmitting and receiving data. • A green path indicates a strong signal • A yellow path indicate a medium strength signal • A red path indicates a weak signal 3.8.4. Adding Repeaters to the Network Loggers which aren’t in range of the Receiver can transmit to the Receiver via a Repeater/Short Range Repeater, which is in range. As DataNet is built using mesh networking technology Repeaters (DNR900) can be added to the system to enhance the network range. The Receiver/Repeater is the same device, just configured differently from the main menu when turned on. Refer to section 4.12.3 to learn how to switch the DNR900 unit type to Repeater. 3.8.5. Short Range Repeater You may also enable a logger (DNL910 or DNL920) to operate as a Repeater in addition to its logging capabilities. In this mode the logger is referred to as a Short Range Repeater (SRR) as the unit’s range specification stays at 80 m line of sight and is not increased to the longer range spec of the Repeater. To switch a logger to SRR mode, simply right-click the logger icon in the DataNet software Map View and select Enable Short Range Repeater Mode. 36 Note: In SRR mode the logger must be connected to AC power at all times as the power consumption is much greater. 3.9. Recommended Approach to Deploying DataNet Units Now that you have a general understanding of how the DataNet system functions, you may wish to use Fourier’s recommended approach for initial deployment of the system. This approach will ensure a smooth and efficient deployment of your DataNet units and you may then tweak this approach based on experience you gain while using the system. Note: When deploying the system bear in mind that several factors could cause interference with the system, such as electromagnetic pulses, metal shielding in the vicinity of the transmissions, other devices using the same 2.4 GHz band, etc. Be familiar with your environment before deploying the system. Also refer to section 3.8. 1. After you have charged the DataNet units and are ready to deploy them in your facility, collect all units - data logger end units, Receiver and Repeaters (if relevant) – and bring them to your PC workstation. 2. Connect the Receiver to the PC and form a network. Turn on the units and one by one bring them online so you can view their icons in the DataNet software’s Map View. 3. Configure each of the units via the Setup feature. At this stage it is not necessary to configure the type of sensors you will be using, or sample rate, alarm levels, etc. The point of this step is to configure each of the units with a logger or Repeater name that indicates where in your facility they will be deployed. For example, Room 15 Freezer or Floor 2 Bio Lab. This will make it much easier 37 for you to recognize the units in the Map View once you have deployed them. Once in place, you can reconfigure the units however you like. 4. It is also recommended, if possible, to change the Map View default background to a diagram or map of your facility. You can then move the logger or Repeater icons accordingly so you can have a visual representation of their location in the facility. 5. Take each logger and begin to distribute in your facility in the precise location you would like them to be based. Once in position you can then run the Signal Test on each logger to verify that you have a good signal to the Receiver. If you are out of range and there is no alternative location for the logger, you will most likely have to add at least one Repeater to the network. 6. Once each of the loggers is in position return to the PC and in Map View, verify that each of the loggers is online. You can also use the Show Network Paths feature to see the path of the logger to the Receiver, and the strength of the transmission. 7. If you determine that you need to add Repeater/s to the network in order to bring end units online or enhance the transmission where the signal is weak, then deploy the Repeater/s with the following points in mind: a. There must be an electrical socket accessible at the location of the Repeater as they must be powered externally in order to run for more than a few hours. b. Place the Repeater/s as high from the ground as possible in order to enhance the wireless signal from its antenna. c. Expose the Repeater/s to as many end units as possible. For example, if there is a room with several offline end units requiring a Repeater, position the Repeater next to the room so that it is in range of as 38 many of these end units as possible, so you don’t have to add more Repeaters. 8. After you have deployed the Repeater/s return to the software and using the Show Network Paths feature verify that all end units are now successfully transmitting to the Receiver, either on their own or via a parent Repeater. You can continue to tweak the position of the units until you are satisfied with the quality of the transmission. 9. Now that the units are in place the last step of initial deployment is to reconfigure each unit to start data acquisition. Configure the sensor setup, sample rate, transmission rate, alarm levels, Email/SMS notifications, etc. as you see fit. 39 Chapter 4: DataNet Hardware Overview This chapter details the hardware features of the DataNet system components: the data loggers and the Receiver/Repeater. 4.1. Data Logger Front Panel Layout 4.1.1. DNL910 and DNL920 Apart from the color scheme, the DNL910 and DNL920 data logger models have the same front panel design. LCD screen Menu/Enter button Scroll button Figure 18: DNL910 data logger front panel LCD screen Displays logger status, logger data, Min/Max values and network information. 40 Menu/Enter button Use to enter logger menu options and to execute logger commands. Scroll button Use to scroll though menu items and to power on unit. 4.1.2. DNL808 and DNL810 The DNL808 and DNL810 data logger models have the same front panel design. Multi-function button Dual-color LED indicator Figure 19: DNL808 data logger front panel Multi-function button: Use to execute logger commands. Dual–color LED indicator: Indicates status of logger such as joining network, leaving network, etc. 41 4.2. Data Logger External Connections 4.2.1. DNL910 and DNL920 External connections of the DNL910 and DNL920 are exactly the same. Mini USB port 12 V power socket Negative Center Four sensor Excitation inputs Figure 20: DNL920 data logger external connections Mini USB Port Functional in future models only – to enable data download direct to PC via USB port. 12 V Power Socket To connect logger to external power supply (negative center). Sensor Inputs Pluggable screw terminal blocks marked In-1 to In-4 (from left to right), to connect wide range of sensor types for data acquisition. All four inputs can be used simultaneously. Sensors can be connected in any order. 42 To connect a sensor to the DataNet data logger, unplug the screw terminal, connect the sensor’s wires to the terminals, and then plug the terminal back to the corresponding socket on the input block. Excitation socket Output power socket used to power external sensors, power derived directly from the external power supply adaptor. 4.2.2. DNL808 External antenna External NTC 10 KΩ input External NTC 10 KΩ probe Figure 21: DNL808 data logger external connections External antenna: For extended transmission distance of the logger. 43 External NTC 10KΩ input: Standard input for connecting to NTC probe. External NTC 10KΩ probe: Fourier-supplied NTC probe (part of DNL808 kit). 4.2.3. DNL810 The DNL810 doesn’t have any external connections. It has two internal sensors only, temperature and humidity. 4.3. DNR900 Receiver/Repeater Front Panel Layout LCD screen Menu/Enter button Scroll button Figure 22: Receiver/Repeater front panel LCD screen Displays Receiver/Repeater status and network information. Menu/Enter button Use to enter logger menu options and to execute logger commands. 44 Scroll button Use to scroll though menu items and to power on unit. 4.4. DNR900 Receiver/Repeater External Connections Mini USB port 12 V power socket Negative Center External Alarm Figure 23: Receiver/Repeater external connections Mini USB Port To connect Receiver to PC and be detected by DataNet software. Connect the mini USB Type B plug (rectangle plug) of the supplied USB communication cable to the Receiver and the USB Type A plug (flat plug) to the computer. Refer to section 4.8. 12 V Power Socket To connect unit to external power supply. Plug in an AC/DC 9-12 V adaptor to power the unit. To use as a Receiver or Repeater and maintain network integrity, the unit should be powered at all times. Connecting external power to the unit automatically charges the internal back-up battery. The adaptor should meet the required specifications. Refer to Appendix A: DataNet Specifications. 45 External Alarm Connect external alarm e.g. siren, audible alarm, to this input. Whenever a logger on the network is in alarm status, the external alarm will be activated. Refer to section 4.5.6 for more details. 4.5. Data Logger Sensor Overview This section provides an overview of the hardware specifications of the DataNet data loggers. 4.5.1. Internal Sensor Types The DNL810, DNL910 and DNL920 loggers include internal sensors, depending on the logger model. Sensor Digital Humidity Measurement Range 5% to 95% Accuracy ±3% (in DataNet software) Logger Model DNL920 DNL810 ±4% (on logger LCD) Digital Temperature Temperature PT100 -20 ºC to 50 ºC ±0.5 ºC DNL920 ±0.4 ºC DNL810 DNL910 -20 ºC to 50 ºC 46 ±0.3 ºC 4.5.2. External Sensor Types DNL910 and DNL920 Each of the four input channels of these data logger models are multi-purpose and can be individually configured to any of the following types and ranges. Sensor Measurement Range Accuracy Available Inputs Current 4 – 20 mA ± 0.5 % In-1 to In-4 Contact Open (0) / Close (1) N/A In-1 to In-4 Frequency 20 Hz – 4 KHz N/A In-4 only 1 – 65,536 pulses N/A In-4 only -200 to -60 ºC ±0.5 % In-1 to In-4 Pulse Counter 0 to 4 KHz Temperature PT100 (2-wire) -200 to 400 ºC 60 to 400 ºC ±0.5 % -60 to 60 ºC ±0.3 ˚C Temperature TC-J -200 ºC to 1,000 ºC -200 to -60 ºC ±0.5 % In-1 to In-4 60 to 1,000 ºC ±0.5 % -60 to 60 ºC ±0.5 ˚C Temperature TC-K -200 ºC to 1,000 ºC -200 to -60 ºC ±0.5 % In-1 to In-4 60 to 1,000 ºC ±0.5 % -60 to 60 ºC ±0.5 ˚C Temperature TC-T -200 ºC to 400 ºC -200 to -60 ºC ±0.5 % In-1 to In-4 60 to 400 ºC ±0.5 % -60 to 60 ºC ±0.5 ˚C Voltage 0–1V ± 0.5 % In-1 to In-4 Voltage 0 – 50 mV ± 0.5 % In-1 to In-4 47 DNL808 Sensor Temperature NTC 10 KΩ 4.5.3. Measurement Range Accuracy -50 to 60 ˚C: ±0.3 ˚C -50 to 150 ºC 60 to 150 ˚C: ±0.5 % Sensor Connection Connect the sensor/s to the terminal block/s at the top of data logger: Figure 24: DataNet logger sensor inputs Sensors do not have to be added successively. You may only configure In-4, or configure In-1 and In-3, for example, when setting up the logger via the software. 4.5.4. External PT-100 and NTC Sensor Connection The PT-100 (for the DNL910 and DNL 920) and NTC (for DNL808) sensors, as supplied by Fourier Systems comes prewired to the data logger’s terminal block. The PT-100 positive polarity (red) and ground (white) wires are connected to the + input of the terminal block. The 48 negative polarity (black) wire is connected to the – input on the terminal block. 4.5.5. Programming Limitations for DNL910 and DNL920 The standard sampling rate for all sensors on all inputs is from a maximum of one sample every second to a minimum of one sample every two hours. However, there are certain limitations using a specific combination of sensors, which must be taken into account when programming the DataNet data loggers. Note: The software integrates all programming limitations automatically when configuring the loggers. Please refer to the table below for DataNet programming limitations, where: PT100, Thermocouple J, K or T = A Internal Digital Temperature (on DNL920) = B Sensor Combination 3xA 4xA Maximum Sampling Rate One sample every three seconds A+B (2 x A) + B (3 x A) + B Example Setup In-1: PT-100 In-2: TC-J In-3: TC-J One sample every four seconds Internal: Temp In-1: TC-T In-2: PT-100 49 Sensor Combination (4 x A) + B Maximum Sampling Rate One sample every five seconds Example Setup Internal: Temp In-1: TC-T In-2: TC-J In-3: PT-100 In-4: PT-100 Table 1: Data Logger programming limitations 4.5.6. External Alarm Output The DataNet system supports connection of an external alarm e.g. siren, audible alarm, to the Receiver external alarm input or to In-1 of the DNL910 and DNL920 data loggers. When connected to the Receiver, the external alarm will be activated whenever a logger on the network is in alarm status. When connected to the data logger, the external alarm will be activated only when that specific logger is in alarm status. Once there is no alarm status, the external alarm will be deactivated. Data Logger External Alarm In-1 of the DNL910 and DNL 920 serves either as a standard sensor input or as an external alarm output. Configure In-1 as Alarm Normally Open or Alarm Normally Closed in the logger Setup window in the DataNet software. Normally Open will result in the alarm being activated during alarm status (the circuit will be closed). Normally Closed will result in the alarm being activated when logger is not in alarm and therefore deactivated when there is an alarm (the circuit will be opened). Connect In-1 to your external alarm device. 50 Use the Alarm Setup tab in the Setup dialog to define the logger alarm settings. If these settings are breached then the alarm will be activated. Receiver External Alarm By connecting the external alarm to the Ext Alarm input on the Receiver, any alarm on the entire network will activate the external alarm. Use the Alarm Setup tab in the Setup dialog to define the logger alarm settings. Whenever the Receiver receives an alarm status from any logger on the network, the external alarm will be activated. No additional configuration in the software is required. External Alarm Schematic See the schematic below explaining how to hook up an external alarm to the DataNet unit. - + - + Relay - + + - 3-4 V battery to power relay Alarm device (e.g. siren) Figure 25: External alarm schematic 51 • + from DNR900 goes to – of the Relay inputs • + of Relay input goes to battery that powers the Relay • Load inputs of the Relay go to the Alarm device e.g. siren, lights, etc. • - of the battery goes to – of DNR900. Note: Maximum load of the Relay is 50 mA, 3 V. Refer to Appendix A: DataNet Specifications for the full external alarm output specification. 4.5.7. Polarity Current, voltage, thermocouples and user defined sensors have distinct polarity. Be careful to connect them in the right polarity. 4.5.8. Frequency/Pulse Counter Connect the signal wires to In-4 terminal blocks, and select Frequency or Pulse counter for Input 4 from the logger Setup window in the DataNet software. Inputs 1 to 3 are still available for other sensors. The Frequency/Pulse counter is optically isolated from the internal circuitry and can simultaneously measure a signal source, together with another input. 4.5.9. User Defined Sensors DataNet provides a simple and straightforward tool for defining a limited number of custom sensors. Almost any sensor or transducer with 0 – 1 V or 4 – 20 mA output is 52 accepted by the DataNet logger and its electrical units are automatically scaled to meaningful user-defined engineering units. The sensor definitions are stored in the logger’s memory and are added to the sensors list. The sensor’s readings are displayed in the user defined units only in the DataNet software. Future versions will also support displaying the user defined engineering units on the logger LCD. Refer to section 5.5.1 for more details. 4.5.10. Sensor Alarms Via the software, users can define minimum and maximum alarm levels for each input individually. Users can define prelow and pre-high alarm levels, for an additional level of safety in case the logger is approaching an actual breach of alarm. The DataNet logger display indicates when the sensor reading is in alarm of any type. The symbols AL-H, AL-L, AL-P-H or AL-P-L are visible next to the corresponding input readings. Refer to section 5.13 for more details. 4.5.11. Sensor Calibration The DataNet data logger is shipped fully calibrated. However, further calibration can be applied via the DataNet software. The calibration parameters are sent to the data loggers wirelessly and stored in the logger’s memory. Users may calibrate individual input as well as all inputs at once. Calibration settings may be saved and then loaded into the logger at a later date if the calibration settings have changed. Refer to section 5.13.4 for more details. 53 4.6. Unit Serial Number and Comment Every DataNet data logger and Receiver/Repeater unit is embedded with a unique serial number. The data logger only can be loaded with a descriptive comment to identify its task and location. You may add or edit the comment of any logger on the network via the DataNet software. Every time data is transferred to the computer it is labeled both with the logger’s serial number and comment and is displayed in the graph or data table view. The unit serial number is also marked on a sticker on the back of the product. 4.7. Power Supply 4.7.1. DNR900 in Receiver Mode The Receiver unit is powered via the USB port of the PC, when connected via the mini USB cable. In addition, the unit can run for a limited time (up to three hours) from an internal NiMh rechargeable battery. To charge the internal battery, connect the unit to the AC power supply supplied with the DNR900. The internal battery pack is generally used as a back up power supply in the event the external power supply fails. Note: When in Receiver mode, the unit must be connected to external power at all times. While running on internal power, the unit will run for only several hours before shutting down and therefore shutting down the DataNet network which the Receiver is managing. 54 4.7.2. DNR900 in Repeater Mode When in Repeater mode, the DNR900 must be connected to external AC power at all times using the supplied AC charger. Otherwise, when the internal backup batteries drains and shuts down the unit, all the end units dependent on the Repeater to transmit to the Receiver, will not be detected by the software. The user won’t be able to monitor data readings from these units until the Repeater comes back online. When connected to external power supply, the Repeater battery will not be charged when the unit is turned off. This will allow the system to protect the battery from overheating. 4.7.3. DNL910 and DNL920 Data Loggers The DNL910 and DNL920 data loggers run from an internal NiMh rechargeable battery as well as from external AC power supply. Depending on the logger configuration, from a fully charged battery, the data logger can run for up to several months. Refer to section 4.7.6 for more details on battery life. Note: Charge the data logger units for 16 hours before using them for the first time. When connected to external power supply, the data logger battery will not be charged when the unit is turned off. This will allow the system to protect the battery from overheating. First Time Charging From a fully drained battery, you must charge the battery for 16 hours to bring it to a full charge. Once the charge cycle is complete, the logger will run from the external power supply, without draining (or charging) the internal battery. In order to maintain a fully charged battery and ensure the battery 55 doesn’t self-discharge, the battery charger will daily charge the unit for a minute to maintain the battery capacity. Note: Before storing the DataNet units make sure you have unplugged all the sensors and turned the units off via the keypad. Standard Charging Whenever a logger is reconnected to the charger it will begin the 16-hour charge cycle, no matter what the status of the battery. Once the charging cycle is complete the logger will run from external power supply. Effect of Charging Battery on Temperature Sensor For loggers measuring data with the internal temperature sensor, it is critical to note that during the charge cycle the logger will heat up thereby causing the internal temperature sensor reading to rise by up to 10 ˚C above ambient temperature. Once the charging process is complete, the logger will cool down and the internal temperature sensor readings will return to normal. For loggers remaining connected to AC power, to prevent the logger from heating up again following the initial charge cycle, the logger will receive a one minute trickle charge each day rather than stay continually charged. This is sufficient to ensure the logger doesn’t self-discharge and will maintain the logger’s full charge status. 4.7.4. DNL808 and DNL810 Data Loggers The Mini DataNet loggers are powered by non-rechargeable internal 2/3 AA lithium batteries. There is no external power supply for these loggers. 56 Depending on the logger configuration, the battery can last up to 10 months before they need to be replaced. Replacing the Mini DataNet Battery To replace the batteries on the Mini DataNet loggers, remove the two screws located on the top panel of the logger (where the antenna is connected) and with care pull out the internal compartment containing the logger circuit board and battery. Remove and replace the battery, ensuring the correct polarity of the battery, and push the internal compartment back into place. Secure the panel with the two screws. Note: With the DNL808 also disconnect the external sensor to avoid damaging it. 4.7.5. Power Adapter The DataNet power adapter is used to power the DNR900 and DNL910 and 920 units. The mains adaptor (AC/DC adaptor) converts mains power (from a wall outlet) to a voltage suitable to the DataNet hardware unit. • Output: Capacitor filtered 9 to 12 VDC, 300 mA • Female plug, center negative Note: Only use Fourier-supplied power adapters to avoid damaging the units with incorrect power supply. 4.7.6. Data Logger Battery Life Battery life depends on the logger sampling rate, transmission rate, type of sensor, network architecture and number of measured sensors. • DNL910 and 920 can last up to six months on a charged battery. 57 • DNL808 and 810 can last up to 10 months on a new battery. The table below provides some example scenarios of standard logger configurations and expected battery life. Logger Model DNL910 Sensor Setup Sample Rate Transmission Rate Battery Life • Internal Temperature 15 minutes 15 minutes Five months • 4 x Thermocouple DNL910 1 x PT-100 15 minutes 15 minutes Six months DNL808 1 x NTC 10 KΩ 15 minutes 15 minutes 10 months DNL810 • Internal Temperature 15 minutes 15 minutes 10 months • Internal Humidity Table 2: Data logger battery life scenarios 4.8. USB Communication Cable A mini USB communication cable is supplied as part of the DataNet PC Suite. This cable connects the Receiver to the DataNet PC workstation. When connected to the PC the Receiver can communicate with the DataNet software and manage the DataNet network. The USB cable also powers the Receiver when connected to the PC but it does not charge the internal battery. Note: The USB driver is installed as part of the software installation process. Without this driver the PC won’t detect the Receiver. To avoid compatibility problems do not connect the Receiver to the PC before installing the USB driver. 58 Type B plug Connect to PC USB port Type A plug Connect to Receiver USB port Figure 26: USB communication cable 4.9. DataNet Keypad Overview 4.9.1. DNL910, DNL920 and DNR900 Keypad The DNL910, DNL 920 and DNR900 units each have two buttons on the keypad, which are used to navigate through the LCD menu options, as well as turn on the units. Refer to section 4.10 to learn how to operate the data loggers and sections 4.11 and 4.13 to learn how to operate the Receiver and Repeater. 59 The Menu button functionalities: has two Navigate to the main menu. When pressed from within a submenu, the display will take you back to the main menu. Selecting an option from one of the menus. When pressed on one of the main menu items, it will take you to the sub menu options. The Scroll button functionalities: has two When the unit is off, pressing this button will power the unit on. Scrolls through the menu options. 4.9.2. DNL808 and DNL810 Keypad The DNL808 and DNL810 have one button on the keypad. This button is multi-functional and is used to perform various functions such as: • Turning on/off the unit • Starting signal test • Leaving the network • Locating logger icon in software Map View 60 Refer to section 4.11 to learn how to operate the DNL808 and DNL810 Mini DataNet loggers. 4.10. Operating the DNL910 and DNL920 This section explains how to operate the DNL910 and DNL920 loggers and provides an overview of the menu options on the units’ LCD screen. 4.10.1. Turning on the Unit In order to view the logger menu options, the unit must be powered on by pressing the Scroll button on the keypad. Ensure the logger is charged or connected to the AC adapter. Once the unit is switched on it will emit a short beep and the screen will display a welcome message: Fourier Systems DataNet Logger 4.10.2. Display Shutdown If the logger screen is inactive for thirty seconds it will turn off. However the logger will continue to operate in the background. Press the Scroll button to enable the LCD screen again. The screen will not turn off during firmware upgrade. 61 4.10.3. Joining a Network When a logger is powered on or reset, it will automatically scan for a network after the welcome message has appeared. There are three scenarios that can occur while scanning for a network: Scenario 1: The logger can’t find the last network that it was connected to. For example, the logger is a new unit which was never previously joined a network. Scenario 2: The logger scans and finds the last network it was connected to, and joins that network. Scenario 3: The logger can’t find any networks at all. Scenario 4: The logger found a network but failed to join. The unit will try to reconnect nine times before scanning for the network again. Moving the unit closer to the Receiver can help the logger to join successfully. If the logger still can’t join, form a new network. Scenario 1 If the unit can’t find the last network that it was connected to (for example, it’s a new unit), the unit will display all the networks that are in range: Scan for network Scan for network Found # network Where # is the number of networks found Once the scan has been completed the following screen appears: 62 Scan complete If more than one network was found, the user will need to select the network ID that he wants to connect to. The user uses the Scroll button to scroll through the Network IDs. The relevant network is selected using the Enter button. Network 1: ID: 014.061.082 Network 2: ID: 021.207.175 Rescan networks Once the network has been selected the following screen will be displayed. Joined network: ID: 021.207.175 To rescan the networks, simply select the Rescan Networks option and the logger will start the scanning process again. If only one network was found the system will automatically connect to that network without the user needing to select the network manually. Scan for network Found 1 network Scan complete Joined to network: ID: 021.207.175 The logger display will return to the welcome message, which consists of the logger name (editable via the software) and the network status: 63 • Ready - If connection to the DataNet software is established. • Software is down - If established connection to the Receiver but the DataNet software is down (PC is off, software is not open, etc.) • No Parent Signal – The parent unit, either the Receiver or Repeater, is not detected by the logger therefore the logger is not transmitting its data to the network. Fourier Systems Software down Fourier Systems Ready Fourier Systems No Receiver Scenario 2 When the system scans for networks and finds the last network that it was connected to it will automatically connect to the last known network. Joined Network: ID: 021.207.175 As in Scenario 1, the logger display will then return to the welcome message displaying the unit name and status. Scenario 3 The system can’t find any networks at all. If no networks were found, the unit will display the following screens. Scan for network Found 0 network Scan complete 64 No found networks: Rescan networks 4.10.4. Main Menu Options There are three menu categories on the data logger: • View Data • Status • Min/Max Values Note: If the unit is not in Run mode only the Status menu options will be available. Press the Menu button to reach the main menu display. Scroll through the main menu options (View Data, Status and Min/Max Values) using the Scroll button. Once you reach the main menu option you need, press Enter to select that option and enter the sub menus. View Data Menu View Data Note: View Data is the default page when the unit is running. If there is more than one sensor running, the screen will auto scroll between the sensors showing the sensor name and senor value. These are real-time displays. The display will switch back to the View Data screen after five minutes if none of logger buttons have been pressed. If the sensor breached any of the predefined alarm levels, then the alarm symbol will be displayed alongside the data reading. 65 For example: In-TMP 24˚C AL-Lo The logger display alarm symbols are: • AL-HI : Alarm High • AL-Lo : Alarm Low • AL-P-H : Pre Alarm High • AL-P-L : Pre Alarm Low ` Status Menu Status The Status menu contains the following sub menus, all reachable by using the Scroll button. The sub menus are outlined below in the order in which they appear on the logger display. Name and Status As explained previously, the unit name (or Comment) is displayed on the first row and the second row indicates the logger status. If the logger is running, then the following screen is displayed. Fourier Systems Logger running 66 Mark Unit on PC To indicate the logger icon in the software’s Map View, press the Enter button when this screen is displayed. The logger’s icon located in the Map View will blink a number of times. Batt Level (battery level) If the power adapter is not connected the battery percentage will be displayed. If the power adapter is connected External power will be displayed. Batt Level: 67% Batt Level: External power Signal Level Test The Signal Level test allows the user to check the signal strength and quality of the link between the logger and its parent unit. This test is used to determine optimal positioning of the logger during deployment. Signal level: Run test -> Menu By pressing the Menu button the unit will show the signal level and link quality in percentage terms. If there is no connection with a parent unit, an Out of range message will be displayed. Signal level: 80 Link quality: 95 Out of range 67 • Signal level: Indicates the reception level between end unit and parent unit. If the level falls below 20% then the logger should be placed in a better location or a Repeater should be added. • Link quality: Calculation of the data transmitted with no errors from the logger to the parent unit. If the level falls between 85% then the logger should be placed in a better location or a Repeater should be added. The lower the link quality %, the more retries are needed in order for the logger to send all of its data. Note: The signal level may be low but the link quality can still be 100%. You will not be able to run the Signal Level test when the logger has lost its connection to the network. If you tried, then the following screens are displayed: No Parent signal Fourier Systems No Parent found Logger Version This menu informs the user of the logger firmware version. This is helpful when you need to upgrade the system firmware, to check the current version. Or when contacting Fourier technical support, with any technical issues. Logger version: 2.03.00.01.89.00 The firmware version is commonly referred to by the numbers in bold in the screen above. For example, the firmware version which is supported by this user guide is v1.89. 68 S/N This menu displays the unit’s eight digit SN. S/N 12345678 Network Data This menu displays the unique network ID to which the unit is currently connected. This ID will match the network ID displayed in the software in the Receiver icon’s tooltip in the Map View. Network data: ID: 014.061.082 Device Mode There are two possible device modes: • DataNet Logger Device is operating as standard data logger • Logger – SR RPTR Device is operating as a Short Range Repeater. Refer to section 3.8.5 for more details. Leave Network If this option is selected, the unit will first leave the network and then reset itself. The scan network procedure described in section 4.10.3 will begin. The only exception to this procedure is that even if the last connected network is found during the scan, the unit will not automatically connect to it. 69 Leave network Note: If the logger was in Run mode prior to sending the Leave Network command the software will download all data from the unit first and then force it to leave the network. Reset Unit When the unit is reset, upon start up it will automatically scan for networks. The unit will automatically connect to the previously connected network assuming it was found in the network scan. Following reset the unit will continue to operate according to its last set up instruction. For example, if the logger was in Run mode, then after reset it will continue to run and record data. Turn Off Unit Selecting this option will shut the unit down. You can turn the unit on again by pressing the Scroll button. It is recommended to turn off the unit when it is not in use. Turn off unit 70 Note: Turning off the logger when in Short Range Repeater mode can have adverse affects on your network, as other units may be dependent on the Repeater for transmitting its data to the Receiver. To prevent the SRR from being a point of failure if shut off, ensure the network is robust enough by having alternative routes for the end units to reach the Receiver. Min/Max Values Menu Each sensor’s minimum/maximum readings (taken from the current logging session) will be displayed on two rows. The first row indicates the sensor type, along with the measurement units e.g. V, and the alarm indication if there is an active alarm on this sensor. The second row indicates the minimum and maximum measured value and the units. H and L represent High and Low values, respectively. In-TMP ˚C 26.06H 25.61L 4.10.5. Additional Logger Screens Unit Beep When the DataNet software activates the Call Unit feature, the logger will beep and the following screen will be displayed: Beep Unit Fourier Systems Refer to section 5.11.3 for more details. 71 No Parent Signal/No Parent Found When a logger’s parent unit, such as a Repeater or Receiver, goes offline then the following screen is immediately displayed on the logger: No Parent signal For example, this could happen if the Receiver managing the network has formed a new network, so there is no Receiver managing the previous network. Or if the parent unit is a Repeater, and it goes offline, then the logger will display this message. Once it has determined that the parent signal is lost, it will try to establish a connection with the network via another Repeater but if it fails then the following screen is displayed: Fourier Systems No Parent found You will have to leave the network and rescan for a new network. Loading Firmware When updating the firmware of the data logger via the software’s Firmware Update Center, the logger screen will display the update progress. When complete the main logger status screen will be displayed. Also refer to Chapter 6: Updating DataNet Software and Firmware. 72 Loading firmware Progress: 55% Note: Logger must be in Stop mode before firmware can be updated. 4.11. Operating the DNL808 and DNL810 This section explains how to operate the DNL808 and DNL810 Mini DataNet units using the multi-functional button on the logger front panel. There is no LCD screen on the Mini DataNet models. 4.11.1. Turning the Units Off and On To conserve battery, the Mini DataNet LED does not provide an indication of on/off status. If you wish to operate the logger it is best to first be sure the unit is turned off before continuing. Turning the Unit Off 1. Press and hold the logger button until the LED emits a fixed, red light. 2. Release the logger button. The LED will then blink red three times and switch off. Turning the Unit On and Joining a Network The action of turning on a unit means that it will also have to join a network. 1. Give the logger button a short press. 73 2. The logger will search for a network. The LED will blink orange until either of the following two scenarios occurs: The logger cannot find a network and the LED will blink red three times. The logger will shutdown. Note: The logger won’t find a network if its SN wasn’t entered in the Device Filter, if the Receiver isn’t online or if the network is locked (go to the Network menu to unlock). The logger finds a network and the LED blinks green three times. It has now joined a network. 3. Once the logger has joined the network you may configure it to start recording data. Refer to section 5.12. Rescanning for New Networks To have the logger rescan for a new network (the logger is moving from network to another), from Off status, hold the logger button down until the LED emits a constant orange light. This indicates the logger is rescanning available networks. It will then connect to the network which recognizes its Serial Number, as it was entered in the Device Filter. Note: If there are multiple DataNet networks in your environment make sure that the logger SN is listed in the Device Filter of only one of these networks, otherwise you can’t control which network it will join first and you will have to rescan the networks several times. 4.11.2. Leave Network and Reconnect to a New Network To leave the current network, take the following steps. 1. Turn off the unit by holding the logger button down (see section 4.11.1 above). 74 2. Once shutdown, hold the logger button continuously. The LED will blink green three times, indicating that the unit has joined the old network. Continue to hold the button until the LED turns orange, indicating it has left this network. Release the button. The logger will start scanning for a new network. 3. One of the following scenarios will occur: If the unit finds a new network, the LED will blink green three times and the logger will have joined the new network. If no new network is found, the LED will blink red three times and the logger will shut down. 4.11.3. Running Logger Signal Test You may run a signal test on the logger to check the signal strength to the parent unit. Running Signal Test from Logger 1. Ensure the logger is on and connected to a network. 2. Give the logger button a short press. 3. The LED turns green and after up to 10 seconds starts to blink. The frequency of the blinking indicates signal strength. Very good transmission level: LED blinks at a high frequency means 75% or higher transmission level. Good transmission level: LED blinks at a medium frequency meaning 50% - 69% transmission level. Low transmission level: LED blinks at a slow frequency meaning 25% - 49% transmission level. If in current location there is no connection to the nearest Repeater or Receiver the LED will continuously blink red. 75 4. At the start of the signal test the Logger icon on the Map View blinks. 5. To stop the signal test, give the logger button a short press. After one minute the test will cease in any case. When the test ends, the LED emits a few short red blinks quickly followed by several green blinks. Running Signal Test from DataNet Software Right-click the logger icon on the Map View and select the Signal Test option. The signal test will proceed on the logger as described in Step 3 above. Note: Performing transmission level test consumes a lot of battery power; do not repeat this test too many times. 4.11.4. Call Unit from Software To locate the logger via the software, right-click the logger icon on the Map View and select the Call Device (LED) option. The logger LED will alternate between slow green and red blinks and after several blink it will stop. 76 4.12. Operating the DNR900 in Receiver Mode This section explains how to operate the Receiver using the menu options on the units’ LCD screen, as how to change the DNR900 unit type from Receiver to Repeater. 4.12.1. Turning on the Unit In order to view the Receiver menu options, the unit must be on the keypad. turned on by pressing the Scroll button Ensure the unit is charged or connected to the AC adapter. Once the unit is turned on it will display a series of status messages, finishing with the welcome screen below: DataNet Receiver ID: 021.180.012 4.12.2. Receiver Menus When the unit is selected to work as a Receiver (as opposed to working as a Repeater) the following menus are displayed on the unit. Unit Name When the unit is switched on the following screen is displayed, indicating unit mode (Receiver) and the unique network ID formed by this Receiver. 77 DataNet Receiver ID: 021.180.012 Receiver version This menu informs the user of the Receiver firmware version. This is helpful when you need to upgrade the system firmware, to check the current version. Or when contacting Fourier technical support, with any technical issues. Change Unit Type to Repeater Refer to section 4.12.3 for more details. Reset Unit When the unit is reset, upon start up it will reconnect the network it previously formed and managed. Reset unit Turn Off Unit Selecting this option will shut the unit down. You can turn the unit on again by pressing the Scroll button. When the Receiver is shutdown the network will be down as well, as the end units won’t be able to transmit to the Receiver. Turn off unit It is recommended to turn off the unit when it is not in use. 78 4.12.3. Changing Receiver to Repeater Scroll through the Receiver menu until you reach the menu Change Unit Type to Repeater. Change unit type to Repeater Press the Enter button to proceed with changing the unit to Repeater mode. Once you perform this action, any network the unit may have formed while in Receiver mode will be down, and you will need to form a new network with another Receiver unit, and join your existing loggers to that new network. Note: Once you change the Receiver to a Repeater, you won’t be able to download any data subsequently recorded on any logger which was connected to that Receiver’s network. Once the unit is in Repeater mode, you will need to leave the network it is connected to, and scan for a new network. Only once the Repeater joins the network will other units on that network detect it. Refer to section 4.13 for more details on operating a Repeater and joining a new network. 4.12.4. Additional Receiver Screens Loading Firmware When updating the firmware of the Receiver via the software’s Firmware Update Center, the Receiver screen will display the update progress. When complete the main Receiver status screen will be displayed. 79 Loading firmware Progress: 55% 4.13. Operating the DNR900 in Repeater Mode This section explains how to operate the Repeater and provides an overview of the menu options on the units’ LCD screen. Refer to section 4.12.3 to learn how to switch the DNR900 from Receiver to Repeater mode. 4.13.1. Turning on the Unit In order to view the Repeater menu options, the unit must be turned on by pressing the Scroll button on the keypad. Ensure the unit is connected to the AC adapter. Once the unit is switched on it will emit a short beep and the screen will display a welcome message: Fourier Systems Ready 4.13.2. Joining a Network When a Repeater is powered on or reset, it will automatically scan for a network after the welcome message has appeared. There are three scenarios that can occur while scanning for a network: 80 Scenario 1: The system can’t find the last network that it was connected to. For example, the Repeater is a new unit which was never previously joined a network. Scenario 2: The system scans and finds the last network it was connected to, and joins that network. Scenario 3: The system can’t find any networks at all. Scenario 1 If the unit can’t find the last network that it was connected to (for example, it’s a new unit), the unit will display all the networks that are in range: Scan for network Scan for network Found # network Where # is the number of networks found Once the scan has been completed the following screen appears: Scan complete If more than one network was found, the user will need to select the network ID that he wants to connect to. The user uses the Scroll button to scroll through the Network IDs. The relevant network is selected using the Enter button. Network 1: ID: 014.061.082 Network 2: ID: 021.207.175 81 Rescan networks Once the network has been selected the following screen will be displayed. Joined network: ID: 021.207.175 To rescan the networks, simply select the Rescan Networks option and the logger will start the scanning process again. If only one network was found the system will automatically connect to that network without the user needing to select the network manually. Scan for network Found 1 network Scan complete Joined to network: ID: 021.207.175 The Repeater display will return to the welcome message, which consists of the Repeater name (editable via the software) and the network status: Ready - If connection to the DataNet software is established. Software is down - If established connection to the Receiver but the DataNet software is down (PC is off, software is not open, etc.) No Parent Signal – The parent unit, either the Receiver or another Repeater, is not detected by the Repeater therefore it is not transmitting its data to the network. Fourier Systems Software down Fourier Systems Ready 82 Fourier Systems No Receiver Scenario 2 When the system scans for networks and finds the last network that it was connected to it will automatically connect to the last known network. Joined Network: ID: 021.207.175 As in Scenario 1, the logger display will then return to the welcome message displaying the unit name and status. Scenario 3 The system can’t find any networks at all. If no networks were found, the unit will display the following screens. Scan for network Found 0 network 4.13.3. Scan complete No found networks: Rescan networks Menu Options Use the Scroll button to scroll through the menu options. Name and Status The unit name is displayed on the first row and the second row indicates the Repeater status. Fourier Systems Ready 83 Mark Unit on PC To indicate the Repeater icon in the software’s Map View, press the Enter button when this screen is displayed. The Repeater’s icon located in the Map View will blink a number of times. Batt Level (battery level) • If the power adapter is not connected the battery percentage will be displayed. • If the power adapter is connected External power will be displayed. Batt Level: 67% Batt Level: External power Signal Level Test The Signal Level test allows the user to check the signal strength and quality of the link between the Repeater and its parent unit. This test is used to determine optimal positioning of the Repeater during deployment. Signal level: Run test -> Menu By pressing the Menu button the unit will show the signal level and link quality in percentage terms. If there is no connection with a parent unit, an Out of range message will be displayed. 84 Signal level: 80 Link quality: 95 Out of range • Signal level: Indicates the reception level between end unit and parent unit. If the level falls below 20% then the logger should be placed in a better location or another Repeater should be added. • Link quality: Calculation of the data transmitted with no errors from the Repeater to the parent unit. If the level falls between 85% then the Repeater should be placed in a better location or another Repeater should be added. The lower the link quality %, the more retries are needed in order for the Repeater to send all of its data. Note: The signal level may be low but the link quality can still be 100%. You will not be able to run the Signal Level test when the Repeater has lost its connection to the network. If you tried, then the following screens are displayed: No Parent signal Fourier Systems No Parent found Repeater Version This menu informs the user of the Repeater firmware version. This is helpful when you need to upgrade the system firmware, to check the current version. Or when contacting Fourier technical support, with any technical issues. Rptr version: 2.03.00.01.89.00 85 The firmware version is commonly referred to by the numbers in bold in the screen above. For example, the firmware version which is supported by this user guide is v1.89. S/N This menu displays the unit’s eight digit SN. S/N 12345678 Network Data This menu displays the unique network ID to which the unit is currently connected. This ID will match the network ID displayed in the software in the Receiver icon’s tooltip in the Map View. Network data: ID: 014.061.082 Change Unit Type to Receiver Select this option to change your unit from Repeater to Receiver mode. A new network ID will be formed. Change unit type to Receiver Press the Enter button to proceed with changing the unit to Receiver mode. 86 Leave Network If this option is selected, the unit will first leave the network and then reset itself. The scan network procedure described in section 4.10.3 will begin. The only exception to this procedure is that even if the last connected network is found during the scan, the unit will not automatically connect to it. Leave network Reset Unit When the unit is reset, upon start up it will automatically scan for networks. The unit will automatically connect to the previously connected network assuming it was found in the network scan. Turn Off Unit Selecting this option will shut the unit down. You can turn the unit on again by pressing the Scroll button. It is recommended to turn off the unit when it is not in use. Turn off unit Note: Turning off the Repeater can have adverse affects on your network, as other units may be dependent on the Repeater for transmitting its data to the Receiver. To prevent the Repeater from being a point of failure if shut off, ensure the network is robust enough by having alternative routes for the end units to reach the Receiver. 87 4.13.4. Additional Repeater Screens Unit Beep When the DataNet software activates the Call Unit feature, the Repeater will beep and the following screen will be displayed: Beep Unit Fourier Systems Refer to section 5.11.3 for more details. No Parent Signal/No Parent Found When a Repeater’s parent unit, such as another Repeater or the Receiver, goes offline then the following screen is immediately displayed on the logger: No Parent signal For example, this could happen if the Receiver managing the network has formed a new network, so there is no Receiver managing the previous network. Or if the parent unit is a Repeater, and it goes offline, then this Repeater will display the message above. Once it has determined that the parent signal is lost, it will try to establish a connection with the network via another Repeater but if it fails then the following screen is displayed: Fourier Systems No Parent found 88 You will have to leave the current network and rescan for a new network. Loading Firmware When updating the firmware of the Repeater via the software’s Firmware Update Center, the Repeater screen will display the update progress. When complete the main Repeater screen will be displayed. Loading firmware Progress: 55% 89 Chapter 5: Using the DataNet Software This chapter provides detailed description of the DataNet software features, allowing you to manage your DataNet network and perform a variety of actions on your data loggers, such as setup, calibration, defining new sensors, managing Email and SMS notifications, firmware updates and so on. 5.1. Installing DataNet Software Part of your DataNet package includes a DataNet software CD. Follow the software installation instructions provided below. 5.1.1. System Requirements To work with DataNet your system should be configured according to the following specifications: Software • Windows 2000 SP3, Windows 2003, Windows XP SP2, and Windows Vista • Internet Explorer 5.01 or higher • Minimum screen resolution: 1024 x 768 (800 x 600 not supported) 90 Hardware • Pentium 800 MHz or higher • 256 MB RAM • 250 MB available disk space for the DataNet application 5.1.2. Installation Procedure Please read these instructions before proceeding with the installation process. 1. Insert the DataNet software CD into your computer’s CD drive. The DataNet Installation Wizard automatically starts running. 2. The Wizard first installs Microsoft .NET Framework 2.0. The DataNet software requires this platform in order to run. Follow the installation instructions to install the .NET Framework on your PC. This step can take up to two minutes to complete. Click Finish once installation is complete. 3. The Silicon Laboratories USB driver installation will now launch. The driver is necessary for the computer to detect the DataNet Receiver hardware. 4. Follow the on-screen instructions to continue the installation process. The default installation location is C:\SiLabs. 91 Figure 27: Installing Silicon Labs USB driver – Step 1 5. The following window will pop up. Make sure to select the checkbox to launch the driver installer, and click Finish. Figure 28: Installing Silicon Labs USB driver – Step 2 92 6. In the subsequent window, click Install to install the driver. Figure 29: Installing Silicon Labs USB driver – Step 3 The installation of the driver could take up to one minute or more, depending on the system. Figure 30: Installing Silicon Labs USB driver – Step 4 7. Once installed click Finish to close the USB driver Install Wizard dialog. 8. The main DataNet Installation Wizard now resumes. Follow the installation instructions to install DataNet on your computer. Once the installation process is completed click Finish. 9. The DataNet software and components have now been installed. Double click the DataNet shortcut on your desktop to launch the software. 93 10. Connect the DataNet Receiver to a USB port on your computer. It will automatically detect the Receiver as new hardware. After a few seconds you will see a message stating that the device is ready for use. You may now begin to configure your DataNet network. 5.1.3. Installation Troubleshooting When connected to the PC USB port the Receiver was not detected by the software. Ensure that the USB driver was installed properly. Go to Control Panel > Add/Remove Programs (in WinXP), and check that the driver is installed: If not, you should run the Silicon Labs setup file to install the USB driver: CP210x_VCP_Win2K_XP_S2K3.exe setup.exe to install the driver. If the driver is installed, ensure that there is no other device sharing the USB com port with the DataNet Receiver. If you didn’t select the Launch CP210x VCP Driver Installer checkbox during step 2 of the driver installation wizard (see section 5.1.2), then the driver wasn’t installed. Run the wizard again and be sure to select the checkbox. 5.2. DataNet Software Layout This section provides an overview of the default DataNet window view as well as a guide to all of the icons available throughout the software. 94 The most commonly used tools and commands are displayed on two toolbars. Tools that relate to all aspects of the program are located in the main (upper) toolbar. Tools specific to the graphs are located on the graph (lower) toolbar. Refer to section 5.2.5 for a description of these toolbars 5.2.1. Map View When DataNet is first launched, the default window that is opened is the Map View (see screenshot below). You can also switch to Map View at any time by clicking the Map View button in the main toolbar. This view is used to monitor the location and network connection of all of the data loggers and Repeaters in the network, in addition to the Receiver. Icons are used to represent each of the DataNet units, and using the mouse the user can select specific actions to be performed on the unit. Figure 31: Main window - Map View 95 Refer to section 5.11 for more details on working in Map View. 5.2.2. Sensor View Clicking the Sensor View button in the main toolbar switches the main DataNet window to a display where sensor data is represented in individual windows. All sensors which are currently online will be displayed in this view. If a logger is currently offline then its data will not be visible. Figure 32: Main window – Sensor View 96 There are two modes for viewing the sensor data, which may be toggled by going to Tools > Switch Sensor View Mode in the main menu. • Expanded view In this view, the logger comment, sensor type and sensor data is displayed. • Slim view In this view, only the sensor type and sensor data is displayed. Sensor in Alarm When the sensor data is in alarm, the color of the sensor window will change according to the alarm type. There is a legend in the lower right corner of the main window: For example: 97 This screenshot indicates that the Internal Digital Temperature reading is in High alarm, while the Internal Relative Humidity reading is at normal levels. Additional Features • The sensor windows may be dragged and placed anywhere on the screen. • Double clicking the sensor window will open the Data Display window, where the real-time sensor data is displayed in graph or table view. • Scrolling over the sensor window with the mouse cursor will bring up a tooltip displaying the following data: Logger comment Battery level Last sample time Sensor type and reading 5.2.3. History View Clicking the History View button in the main toolbar will switch the main window to view archived, offline data stored in the DataNet directory on the workstation. You must first open the archived data file by clicking Open File on the main toolbar. When you open the data file it 98 will be displayed in the History View, otherwise, the History View window will be blank. Refer to section 5.9: Viewing Archived (Offline) Data on page 121 for more details on opening files in History View. Figure 33: Main window – History View In History View, the user may view the data in graph or table format by clicking the relevant tabs, as well as view a number of Statistics taken from the data set. To learn the functionality of the lower graph toolbar, refer to section 5.2.5 below. 5.2.4. Data Map The History View window also includes the Data Map pane, on the left of the window. 99 The Data Map displays all data sets opened in History View, saved in the current project file, and includes nodes for each sensor in the data set. Clicking the sensor label removes the data from the graph. When the label is black, the data is not displayed on the graph. The sensor data plot color is matched to the color of the sensor label in the Data Map. Each data set is preceded by a Logger icon , which can be expanded or collapsed to display the associated sensor data. in the lower graph toolbar removes Clicking the Tree icon the Data Map pane altogether allowing a full screen graph view. Data Map Figure 34: Data Map 5.2.5. DataNet Toolbar Icons This section outlines all of the toolbar icons available in the software. 100 Main (Upper) Toolbar Icons Figure 35: Main toolbar icons The main toolbar is always available at the top of the DataNet application, no matter what window view the user is in. This toolbar cannot be moved or hidden. • Open file - Opens archived logger data file stored on the PC • Map view - Switches main window to Map view, where the units connected to the DataNet network are represented • Sensor view - Switches main window to Sensor view, where data from each running sensor is displayed in a simple view • History view - Switches main window to History view, where archived logger data can be viewed and analyzed • Alarm mute/unmute - Mutes or unmutes an audible alarm in the system when a sensor reading has breached the user-defined alarm level • Email Alarm Notifications - Configuration window for Email alarm notifications • SMS Alarm Notifications - Configuration window for SMS alarm notifications 101 • GSM Modem - Indicates if GSM modem is connected (green icon) or disconnected (grey icon) • Temperature unit toggle - Display all data in Celsius • Temperature unit toggle - Display all data in Fahrenheit Table 3: Main toolbar icon list Map View Icons The following icons representing the various statuses of the DataNet units are viewed in Map View. Using these icons the user is aware of the online/offline status of each unit, as well as the battery level and signal level of the loggers and Repeaters. Alarm status is also indicated: Green = Normal ; Red = Alarm • Receiver is online and connected to the PC. • Receiver is offline, possibly as USB cable has been disconnected or it was removed from external power supply (and backup battery drained). • Logger newly acquired by network and awaiting Setup. Running from internal battery supply. 102 • Logger newly acquired by network and awaiting Setup. Running from external power supply. • Logger which has received its Setup but is in Stop mode. Running from internal battery supply. • Logger which has received its Setup but is in Stop mode. Running from external power supply. • Logger in Run mode and running on battery supply. Green indicates there are no alarms. • Logger in Run mode and running on external power supply. Green indicates there are no alarms. • Logger in Run mode with an alarm alert. • Logger in Run mode with an alarm alert. • Logger is offline and is no longer detected on the network. Its power supply may have failed or it’s out of range of the Receiver. • Logger is processing a command sent from the software. • Logger is downloading data. Running from internal battery supply. Running from external power supply. 103 • Repeater is online and is running from external power supply. • Repeater is offline and is no longer detected on the network. Its power supply may have failed or it’s out of range of the Receiver. Table 4: Main toolbar icon list Graph (Lower) Toolbar Icons The graph toolbar is located at the bottom of the open graph view, when the user is either in Online Data Display: Or History View: The toolbar cannot be moved or hidden. • Data Map (in History View only) – Hides or shows the Data Map pane in the History View window. • Plot Legend (in Display Data View only) – Hides or shows the sensor labels from the bottom of the graph. • Autoscale - Returns the data to its default scale. • Zoom in – Zooms in on the graph data. • Pan graph – Pans the graph along the x or y axis. 104 • Select first cursor – Adds a cursor to the designated plot on the graph • Select second cursor – Adds a second cursor to the designated plot on the graph. • Grid – Adds a grid to the graph background • Add Custom View (in History View only) – adds the open, customized graph view to the Data Map • Copy graph – Copies the graph to your clipboard, to be copied to a document or spreadsheet, for example. • Graph properties – Opens the Graph Properties window. • Export to Excel – Export the open data sets to Excel format. • Print – Opens the Print dialog. Available for graph, table and statistics views. Table 5: Lower graph toolbar icon list Data Map Icons • Displayed internal Temperature sensor data set • Hidden internal Temperature sensor data set • Displayed internal Humidity sensor data set • Hidden internal Humidity sensor data set 105 • Displayed external sensor data set • Hidden internal sensor data set • Displayed graph function • Hidden graph function • Parent node for all logger data sets. Click to expand or collapse all child nodes. • Logger data set. Click to expand or collapse the data set containing all measured inputs of the specific logger. • Parent node for all custom graph views. Click to expand or collapse all child nodes. • Displayed custom graph view. When hidden the icon is grayed out. Table 6: Data Map icons 5.3. File Menu Items 5.3.1. Open Select Open to access archived data files for each logger in your network. Shortcuts: You can also click the Open icon Ctrl+O to open archived files. 106 or press 5.3.2. Open Project File Opens project files of offline data, containing data from one or more loggers, as opposed to standard data files containing data from only one logger. 5.3.3. Save Project This feature lets the user save multiple data sets and custom graph views into a single Project File. Only available in History View. 5.3.4. Save Project As Use this feature to save an existing Project file under a different name. 5.3.5. Exit Exits the DataNet application. 5.4. Network Menu Items Except for Detect Receiver and Device Filter items, all of the Network menu items are also accessible via the Receiver context menu, by right-clicking the Receiver icon in Map View. 5.4.1. Detect Receiver When the Receiver is connected to the USB port it is automatically detected by the software. If you connect the Receiver while it is switched off, and then switch the Receiver 107 on, the software won’t detect the unit. You will have to use the Detect Receiver feature. The Receiver may also lose power and go offline while connected to the USB, in which case you will also need to detect it manually. If no Receiver is detected by the software an error message will pop up stating that the Receiver was not detected. 5.4.2. Lock Network By locking the network you do not allow any additional units to join the network. During the network scan, the logger will not even detect the network if it is locked. By unlocking the network you leave it open for any unit to join the network, even if you do not wish them to. 5.4.3. Form New Network Select this option to form a new network using the current Receiver or another Receiver if you are building more than one network. The Receiver will then form a new network based on your RF environment. This will ensure optimal network performance. Refer to section 3.8 for more details on optimizing the performance. Once a new network is formed, any loggers connected to the old network will need to rescan and join the new network. This must be done manually by going to each logger and resetting it via the LCD menu options. Note: Ensure all data is first downloaded from the loggers before forming a new network. Once a new network is created you won’t be able to recover the loggers’ data. 108 5.4.4. Refresh Network Connections Use this feature to send a command to the Receiver to reestablish connection to the end units in its specific network. This is useful when wanting to ensure the network connectivity is performing optimally without any delay or lag due to changes in environmental conditions or location of the end units. Such delays can explain logger icons not displaying the correct information or commands not being sent promptly to the end units. Note: The software automatically refreshes the network connections every 30 seconds. 5.4.5. Show Network Paths While in Map View, enable this option to display the path that the RF signal of all units in the network takes to reach the Receiver. If Repeaters are used in the network it will show the signal routed via the Repeater, en route to the Receiver. 109 The paths are color-coded so you can also see the transmission strength. A legend appears at the bottom of the window. • Red = Low (0 to 33% strength) • Yellow = Medium (33.4 to 66.6%) • Green = High (66.7 to 100%) You can also enable this feature for specific loggers by opening the context menu on the Logger icon in Map View and selecting Show Network Paths. 5.5. Tools Menu Items 5.5.1. Define Sensor DataNet enables the user to define custom sensors. This is a useful tool for when the data logger is communicating with many sensor types from different vendors. Any additional sensor that you would like to connect to the logger must comply with the following restrictions: The sensor’s output must be either voltage in the range of 0 to 1 V, 0 to 50 mV, current in the range of 4 to 20 mA or Pulse in the range of 0 to 65535 pulses. 1. Click Tools > Define New Sensor and the Define New Sensor dialog will open. 110 Figure 36: Define New Sensor dialog 2. Click Add to enable the fields. 3. Select the Base sensor from the drop-down menu (depending on whether your sensor’s output is 0 to 1 V, 0 to 50 mV, 4 to 20mA, or measuring pulses). 4. Enter the sensor name and sensor unit. 5. Enter two calibration values (two real values and the corresponding output values of the sensor). 6. Click Close. To use the custom defined sensor: 1. Enter the Setup dialog for the data logger you want to configure. 2. Select the Input you wish to use and from the Sensor Type drop-down menu, select the custom sensor, which now appears in this list. 111 3. Proceed with the setup as you would normally do. 5.5.2. Switch Sensor View Mode While in Sensor View, selecting this option will switch the sensor view between large and small window sizes. By reducing the size of the sensor window you display only the sensor type and sensor data. Enlarging the size of the sensor window will display sensor type, sensor data and logger name. 5.5.3. Lock Map View While in Map View, with Lock Map View selected the Map View icons are in a fixed position and can’t be moved. You must unselect this option in order to freely move the icons anywhere on the screen. This is essential if working with a custom background image. 5.5.4. Options Menu Refer to section 5.6 for more details. 5.5.5. Email Alarm Notifications The Email Alarm Notifications dialog is where the user can configure all notifications to be sent via Email to a predefined contact list. Refer to section 5.13 for details. 112 5.5.6. SMS Alarm Notifications The SMS Alarm Notifications dialog is where the user can configure all notifications to be sent via SMS to a predefined contact list. Refer to section 5.13 for details. 5.5.7. Firmware Update Center The Firmware Update Center is where the DataNet firmware updates are managed. Please refer to section 6.2 for more details. 5.6. Tools > Options Menu Items The Options dialog is divided into three main tabs: • Preferences • Email Settings • SMS Settings 113 5.6.1. Preferences Tab Figure 37: Options > Preferences tab The Preferences tab includes the following options: Minimize DataNet to system tray When this checkbox is selected, the DataNet icon will appear in the computer’s system tray in the lower right of the screen when the application is minimized. Simply double-click the icon to maximize the application to full screen. Map View background Use this option to toggle between Stretch and Center views for the background image used in Map View. 114 Set decimal places for… For each DataNet sensor, internal or external, you may select between 0 and 6 decimal places to be used when displaying the data in the software. Date format Choose between four date formats to be used throughout the software when displaying data e.g. in the Graph display. Ignore regional settings when exporting to CSV Selecting this option will ensure that data will be corrected exported to a CSV file and will not use any custom regional settings in the Windows OS which might adversely affect the layout of the data in the CSV file. Path for DataNet data files The default path for saving all data recorded by the data loggers is: C:\Program Files\Fourier Systems\DataNet\DataNet data files\ Click Browse to change the path e.g. to a network path. Save text data files Select this checkbox if you would like DataNet to also save the logger data to a text file. The default path is: C:\Program Files\Fourier Systems\DataNet\DataNet data text files\ and clicking Browse will let you change this path. 115 Enable automatic data download when DataNet is launched Select this checkbox if you want to have automatic download of data when the DataNet software is launched. If there are many loggers in the system with fast sampling rates, then the download could burden the network. Therefore in some cases disabled this feature is advised. 5.6.2. Email Settings Tab DataNet’s alarm notification feature enables sending of Emails to notify the user of any alarm in the system. First select the Send Email notifications check box. Fill in the fields accordingly so that DataNet will be able to send Emails to predefined Email contacts when your loggers have breached certain alarm levels. Make sure to enter the field correctly e.g. with no extra spaces or typos. Refer to section 5.12.2 for setting Alarm levels on the logger and to section 5.13 for managing the Email alarm notifications. Note: DataNet supports SMTP and MIME encoding, and POP3 mail protocols. 116 Figure 38: Options > Email Settings tab 5.6.3. SMS Settings Tab DataNet’s alarm notification feature enables sending of SMS’s to notify the user of any alarm in the system. First select the Send SMS notifications check box. Using the SMS feature requires connection of a GSM modem and SIM card to the DataNet PC, or even just a cellular phone with an active SIM card. You must select the COM port which the GSM modem/cellular phone is connected to in order for the software to detect it. Note: When using a cellular phone as a modem, ensure that the PC software suite is disabled before connecting the phone to the PC com port. Otherwise the com port will not be available for the DataNet software. Once the configuration is complete, DataNet will be able to send SMS’s to predefined SMS contacts when your loggers have breached certain alarm levels. 117 Refer to section 5.12.2 for setting Alarm levels on the logger and to section 5.13 for managing the SMS alarm notifications. Figure 39: Options > SMS Settings tab Note: Once the GSM modem is online you will see the green GSM icon 5.6.4. appear in the DataNet upper toolbar. Analysis Menu Items The Analysis menu items are enabled when viewing offline data in History View. The Analysis options available are: • Functions Parameters • Dew Point • FO Pasteurization • Histogram 118 • Export to Excel • Export to CSV Export to Excel You may export offline data to Excel by selecting this menu in the lower item or by clicking the Export to Excel icon graph toolbar in History View. The data is opened in an Excel worksheet and includes pertinent information such as logger name, SN, sensor names, alarm levels as well as the actual data readings. Refer to section 5.16 for more information. Export to CSV You may export offline data to CSV file format by selecting this menu item. Upon selecting this option, you will be prompted to save the file either in the default DataNet directory or in directory of your choosing. The data is opened in CSV file format and includes pertinent information such as logger name, SN, sensor names, alarm levels as well as the actual data readings. Refer to section 5.16 for more information. 5.7. Data Recovery The ability to recover data when part of the system goes offline or is shutdown is a key feature of the DataNet system. When the data loggers are acquiring data they transmit to the Receiver at the predefined rate, either directly or via one or more Repeaters. There may be occasions when the data transmission fails and the data is not updated in real-time in the software window. When this happens, the software has several ways of recovering the data so the user will always be able to view all 119 samples recorded by the logger. The online system will never lose data i.e. the data integrity will always been maintained. If the end unit tries to send data to the Receiver but fails, it will continually try to send the data until it succeeds. In such a case, the software or workstation may be shutdown or its parent unit, the Repeater, may be offline. Or the end unit itself may go offline due to a drained battery. Once the end unit has reconnected with the network, for instance when the software is reopened or the Repeater is back online, it will be able to complete the transmission of all its data and the software will be updated with this data. The data recovery is all completed automatically and the user is not required to perform any specific actions. Note: In the Tools > Option menu, select the checkbox to enable automatic data download when the software is launched. Otherwise you will have to perform manual download from the Logger context menu. 5.8. Saving Data As soon as a logger starts to record data the software creates a data file to which it writes the logger data. Logger data files are stored in the following default location: C:\Program Files\Fourier Systems\DataNet\DataNet data files A folder is created for each data logger and is named according to the logger Serial Number. In this folder is stored the data files. A file is created for each day that the logger is recording data. The file name format is the date followed by the file extension e.g. 2007-12-30.dat. 120 The data is saved automatically by the software. There is no need for the user to save the data manually. The data is saved to the data file as follows: • Every 15 minutes • When the software is closed • When the user opens an archived data file, the file is updated with all data not saved to that point You can also save the data in a text file format. Refer to section 5.6.1 for more details. 5.9. Viewing Archived (Offline) Data The user can view the logger data online or can choose to open archived data. Archived data is all data that was logged by a specific logger and recorded by the software into the DataNet directory on the PC. Follow the instructions below to open archived data. 1. Click the Open icon to launch the Open Data Files dialog. 2. Select the logger from the list of loggers in the dialog. 3. Using the calendar define the date and time period for which you wish to view your data and click OK. 121 Figure 40: Open Data Files dialog 4. In the Sync Data dialog, you can select the sampling rate at which you wish to display the data. The default option is the original rate. Click OK. 122 Figure 41: Sync Data dialog The data is opened in History View. Refer to section 5.2.1 for an explanation of the History View. You may display data sets from more than one logger and display them all in History View, using the Data Map to navigate through the data. Refer to section 5.2.4 for more details regarding the Data Map. 5.10. Viewing Online Data You can view the data from any of your network loggers in real-time, as the data is being recorded and transmitted to the PC: • While the logger is running double click the Logger icon in the Map View. • While the logger is running open the logger context menu and select Display Data. 123 Figure 42: Online data window The data displayed in this window is the data that was transmitted by the logger in the current software session. Data transmitted during a previous session of the software being open will not be displayed. For example, when you setup the logger it creates a new online session. This data can be viewed by opening archived data. Refer to section 5.9. You may view the data in a graph or table by clicking the relevant tabs in the online data window. While in either or these views, the data is constantly being updated in real-time in the respective view according to the transmission rate of the logger. 124 5.10.1. Showing/Hiding the Data Sets In the online graph display, where you have data from only one logger displayed, you can show or hide the individual sensor data by using the sensor labels at the bottom of the graph. In the screenshot above you can see two labels, Internal Digital Temperature and Int RH. At present, each label is active meaning the sensor data corresponding to the label is shown on the graph. By clicking any of the sensor labels, you can hide the data from the graph. The label will then be grayed out. See the screenshot below: 125 Note: You can hide all of the sensor labels (not plots) from the graph by clicking the Plot Legend icon 5.11. . Working in Map View The Map View is the main view from which you monitor your online network. It is in this view that you can see all the icons representing the units in your system, the Receiver, loggers and Repeaters too, if relevant. Refer to section 5.2.1 for a quick overview of the Map View and section 5.2.5 for a list of all the Map View icons. 5.11.1. Loading Map View Wallpaper You can load an image file representing a map of your facility in which the network is operating. You can then move the unit icons into their actual positions on the map. • Double-click on the Map View background to go straight into the Open dialog and locate the image file. • Right-click on the Map View background to open the Wallpaper dialog and have the option to either Load or Reset the wallpaper. Note: When deploying the system for the first time it is highly recommended to use a map of the facility to make the deployment work efficiently. 126 5.11.2. Moving Icons around the Screen Go to Tools > Lock Map View and ensure this menu item is not selected in order to freely move the unit icons around the screen. When you have finished placing the icons into position you may then lock the Map View so as not to mistakenly place an icon out of position. 5.11.3. Logger Icon Context Menu Right clicking the Logger icon will give the following options: Display Data Displays the logger’s data in Graph view. The graph displays the data in real-time. There is also the option to display the data in Table view or to view the data statistics. Download Data Downloads all data in the logger memory to the DataNet software. When logger is downloading the data, the Logger icon in Map View will appear as follows: Cancel Download When logger is downloading data you may cancel the download per logger by selecting this menu item. 127 Note: This feature works only if there are no other commands in the queue following the Download process. For example, If the data is downloading and you sent the command Call Unit to the logger, and then selected Cancel Download, the download will not be cancelled. Reset Alarm When the logger is in a state of alarm, this option will reset the alarm state to normal on both the logger and the software. The visual and audible alarms will return to normal. If after reset the logger is still in alarm conditions, then the visible and audible alarms will return. Call Unit (Beep) This feature sends a command to the logger to beep for several seconds. This is useful when trying to physically locate a logger in your facility. Calibration Refer to section 5.13.4 on page 147 for an overview of the Calibration feature. Note: A logger can’t be calibrated while it is in Run mode. The option will be grayed out. You must Stop the logger first. Update Firmware Refer to section 6.2 on page 172 for an overview of the Update Firmware feature. 128 Leave Network Selecting this feature will kick the logger off the network. The logger will reset and will start scanning for a new network to join. You will be prompted to enter a password when selecting this feature. Note: The default password is 1234. Setup Refer to section 5.12 on page 135 for an overview of how to setup the logger. Multi-Setup By using multi-setup you can select more than one logger on the Map View and send the same configuration to all of the loggers. When this option is selected, a dialog will open listing all of the loggers in the multi-setup selection. Stop Sends a command to the logger to stop logging data. Run Sends a command to the logger to start logging data. This command will also clear the existing logger memory. Show Network Path Displays the path of the logger RF data transmission to the Receiver. The Transmission Strength legend appears in the bottom right of the screen when this feature is enabled. Refer to section 5.4.5 for more details. 129 Enable/Disable Short Range Repeater Changes the unit between Logger mode and Short Range Repeater (SRR) mode, whereby the logger operates as both a logger and Repeater (with range of 80 m line of sight). Note: In SRR mode the logger must be connected to AC power at all times as the power consumption is much greater. The logger tooltip and logger LCD menu will both indicate that the unit is in SRR mode. Remove This option removes from the Map View any icons of loggers that are not on the network anymore and so are irrelevant. 5.11.4. Viewing Logger Status When you scroll the mouse cursor over the Logger icon a tooltip will pop up displaying data relevant to the Logger status at the time. Logger Tooltip The tooltip will always display the following data, even if offline: • Serial Number • Logger Name/Comment When the logger is online and running the following tooltip is displayed: 130 In online mode, the logger also displays: • Device mode – Logger or Short Range Repeater • The power status (% Battery left or Connected to AC) • Reception quality: Strength of RF signal between logger and Receiver • Version number: Firmware version of the logger • Last sample time: If logger is running, time stamp of last recorded sample. • Real-time Sensor values: All sensor values are displayed, including sensor name and alarm status. Command Queue Progress The tooltip is updated with specific commands being performed by the logger. For example, if the logger is downloading data to the software you can see the progress in the tooltip. In addition, the Logger icon has a blue progress indicator so you can monitor the progress without using the tooltip. 131 Common commands include Download, Setup, Stop, Run, Beep and more. 5.11.5. Receiver Icon Context Menu Right clicking the Receiver icon will give the following options: • Update Firmware • Lock Network • Form New Network • Refresh Network Connections • Show Network Path Update Firmware Selecting this option will launch the Receiver firmware update process. Refer to section 6.2 for more details. 132 Refer to section 5.4 on page 107 for more details regarding the other Receiver options listed above. 5.11.6. Viewing Receiver Status When you scroll the mouse cursor over the Receiver icon a tooltip will pop up displaying data relevant to the Receiver status at the time. Receiver Tooltip The tooltip will always display the following data, even if offline: • Unit type (Receiver) When the Receiver is online the following tooltip is displayed: In online mode, the Receiver also displays: • Serial Number • Network: The Network ID of the currently formed network • Version: Firmware version of Receiver 5.11.7. Repeater Icon Context Menu Right clicking the Repeater icon will give the following options: 133 Setup Repeater Setup lets the user change the name of the unit. Once the name has been changed, click Setup (or Close to close the dialog without making any changes). Multi-Setup By using multi-setup you can select more than one Repeater on the Map View and send the same configuration to all of the Repeaters. Call Unit (Beep) This feature sends a command to the Repeater to beep for several seconds. This is useful when trying to physically locate a Repeater in your facility. Leave Network Selecting this feature will kick the Repeater off the network. You will be prompted to enter a password when selecting this feature. Note: The default password is 1234. Update Firmware Selecting this option will launch the Repeater firmware update process. Refer to section 6.2 for more details. Show Network Path Displays the path of the Repeater RF data transmission to the Receiver. The Transmission Strength legend appears in the bottom right of the screen when this feature is enabled. Refer to section 5.4.5 for more details. 134 Remove This option removes from the Map View any Repeater icons that are not on the network anymore and so are irrelevant. 5.11.8. Viewing Repeater Status When you scroll the mouse cursor over the Repeater icon a tooltip will pop up displaying data relevant to the Repeater status at the time. Repeater Tooltip The tooltip will always display the following data, even if offline: • Unit type (Router) • Serial Number • Repeater Name/Comment When the Repeater is online the following tooltip is displayed: In online mode, the Repeater also displays: • The Power status (% battery left or Connected to AC) • Reception quality: Strength of RF signal between logger and Receiver • Version: Firmware version of Repeater 135 5.12. Configuring the Logger DataNet software allows you to configure each logger in your network wirelessly. You do not need to have the loggers near your workstation, other than for the initial setup when you need to connect the sensors (if you’re using external sensors). You can also refer to section 3.6 on how to configure the logger. To configure the logger once it’s online on the network, rightclick the Logger icon in the Map View and select Setup. You have two tabs, Device Setup tab and Alarm Setup. The main logger configuration is performed on the Device Setup tab. Any alarm levels you wish to configure is performed on the Alarm Setup tab. 5.12.1. Device Setup Tab Comment This is the name of the logger. It is advisable to name the logger according to the location in the facility. Note: The Comment field in the software and on the logger display supports all standard alphanumeric characters except for the following: ', ", ~, &, \ Sampling Rate Sampling rate is one sample per second to one sample per 2 hours. However, there are programming limitations you must be aware of when configuring the loggers. The sampling rate will vary depending on the number and type of sensors you setup. Refer to section 4.5.5 on page 49. 136 Transmission Interval You can define how often the logger will actually transmit to the network. You may wish to have the logger transmit with every sample, if you have slower sampling rates, or less frequently, if you have a fast sampling rate. The transmission interval must be a multiple of the sampling rate, so for example if the sampling rate is 3 seconds, then the minimum transmission rate must be every 3 seconds, and then every 6 seconds, 9 seconds, and so on. This parameter was designed to ease the burden on the network if you have many loggers as each logger can transmit at different rates. Averaging Points You can choose have online averaging of up to 10 points around the real value in order to smooth the data readings, if they are a little noisy. The recommended averaging is 4 samples. Temperature Units Toggle between °C and °F. This applies to the readings displayed on the logger LCD as well as in the software. Active Sensors Depending on the logger model, you can activate up to two internal sensors and four external sensors. Simply select the inputs you want to use and then select the sensor types from the adjacent drop-down menu. You don’t have to select the external sensor input in any order. You may select only Input 4 if you desire. Note: On the DNL920 you cannot run the humidity sensor without running the temperature sensor in parallel. 137 This is because when using the DNL920 data logger and selecting the internal humidity sensor in the Device Setup dialog, the internal digital temperature sensor will automatically be selected as well. This sensor provides the temperature compensation necessary for the humidity sensor to reach the 3% accuracy as stated in the sensor specifications. It is not used for recording temperature. The internal digital sensor is used to record temperature on the DNL920. Custom Sensor Names You can also give the sensor a custom name, which will appear in the software when viewing the data. This is convenient when using several of the same type of sensors and you wish to differentiate between them in terms of their environment or material it is measuring. Recording Time This field displays the length of time the logger memory will be able to record for depending upon the number of sensors used and sampling rate. Setup and Run Clicking Setup and Run will send the setup to the logger and immediately start logging data. Setup Only Clicking Setup Only will send the setup to the logger but it will not actually start logging data. You will need to select Run from the Logger context menu or go back into the Setup dialog. 138 Close Clicking Close will close the Setup dialog without saving any of your configurations. Note: Running the logger clears the logger memory. All previously recorded data will be erased when you begin a new logging session. 5.12.2. Alarm Setup Tab A major feature of the DataNet system is the ability to configure alarm levels into the loggers so any breach of these levels as recorded on the data logger is monitored by the software, and the user is notified via Email/SMS/audible and visual indicators. The Alarm Setup tab lets you configure each sensor for the following alarms: • Low • Pre-Low • Pre-High • High • Contact Open / Contact Close (when the Contact sensor is selected) Using the Pre Alarms gives the user ample warning of a possible breach of real alarm levels, so necessary measures can be taken to prevent such a breach. Simply select the check box for the type of alarm you wish to be notified. You can select all alarms too. Enter the alarm value in the text box. 139 Figure 43: Alarm Setup tab Alarm Delay and Pre-alarm Delay The time until the alarm (or pre-alarm) is activated. You may not want to have the alarm sound immediately after the alarm level is breached as you are only interested in a condition where the alarm level lasted a certain amount of time. For example, if monitoring change of temperature in a freezer, you would only be interested in a High alarm which lasted more than one minute as anything else could just be caused by the freezer door opening for a few seconds, as opposed to a power failure leading to rise in temperature. Alarm Duration The duration of the alarm that is set off by one or more sensors breaching the alarm level. 140 Sound Alarm during Pre-alarm You also have the option to sound the alarm in the software during a pre-alarm scenario, not just for a standard alarm. Once you have configured your alarms, you may return to the Device Setup tab or click one of the Setup buttons at the bottom of the tab. 5.13. Alarm Notifications Setup Once you have completed the logger alarm setup in section 5.12.2 above, you can now configure DataNet to send alarm notifications via Email or SMS. From the Tools menu select one of the following options, depending on the type of notifications required: • Email Alarm Notification • SMS Alarm Notification or SMS icons located in the upper Or click the Email toolbar in order to launch the notification dialog. Note: To enable sending of Email or SMS first define the Email and SMS settings in the Tools > Options dialog. Connect a GSM modem to the PC if sending SMS’s. Refer to section 5.6 on page 113 for more details. The Alarm Notifications dialog also lets you manage your contact list of alarm notification recipients. 141 Figure 44: Alarm Notifications Setup dialog As the Email and SMS Alarm Notifications must be defined separately, they each have separate dialogs. However the interface is identical and the contacts are stored in the same database. The Email/SMS Notifications dialog is divided into the following tabs: • Notifications Setup • Contacts tab • Groups tab 5.13.1. Contacts Tab The first step is to create the contacts who shall be receiving the notifications. The ability to manage contacts is possible from both the Email and SMS Notifications dialogs. 1. Click the Contacts tab and then click Add Contact. 142 Figure 45: Adding a contact 2. In this dialog you must first enter the contact name in the Name field. That is the only mandatory field but if you don’t enter at least the phone number or Email then they won’t receive any alarm notifications. The other fields in the dialog are as follows: Title: Corporate position Phone number: The number the DataNet software will use to send the SMS notification. Note: The phone number field supports the following characters: 0-9, # , *, -, ( ), + Email: The address the DataNet software will use to send the Email notification. Workday Start and End: You can define the hours in which the contact will be eligible to receive the notifications i.e. so they don’t receive SMS or Email while in the office, or vice versa. 143 Vacation: You can define when the contact is on vacation so they won’t receive any notifications over this period. Number of SMS resends: The number of times DataNet will send follow-up SMS’s with the alarm notification. The maximum is nine resends per alarm. The gap between each resend is five minutes. Note: In order to stop receiving SMS resends, you can simply send an SMS with ‘OK’ in the message body to the GSM SIM card’s phone number. 3. When the contact details have been entered, click OK. 4. The contact will be added to the Contacts tab. You may choose to add another contact, edit an existing contact or remove a contact from the list. 5.13.2. Groups Tab 1. Click the Groups tab and then click Add Group. The Group Details dialog will open. Figure 46: Adding a group 144 2. Enter a Group name and add your existing contacts to the group by selecting the checkbox next to the Contact name. 3. Click OK to create the Group. In the Groups tab you may choose to add a group, edit an existing group or remove a group from the list. 5.13.3. Notifications Setup Tab 1. Once the contacts have been created you may start defining which contacts should receive the alarm notifications. 2. The pane on the left-hand side of the Notifications Setup tab displays all the units, loggers or Repeaters, which have been configured in your network. You must define the alarm notifications for each unit in turn. Select the first unit you wish to define. 3. The Email or SMS tab is now active for the unit selected in step 1 above. In this tab, select the type of alarm for which the notification should be sent in the event that the predefined alarm level is breached. 4. Only the sensors which were configured in the logger Setup, with alarms levels, are enabled in this tab. In addition, any online Repeater will be enabled for sending battery alarm or reception alarm notifications. 145 Figure 47: SMS and Email notification setup 5. Select the checkboxes according to the type of sensor alarm for which notifications should be sent. You may also select the following alarms: a. Battery alarm: Notification will be sent for low battery alarm when battery level is at or drops below 10%. When the battery level goes above 10% again, when unit is connected to AC power, another email notification is sent stating the battery is charging. b. Reception alarm: An Offline alarm notification will be sent when there is no RF reception from a unit. When the unit is back online, an Online notification is sent. c. Normalized: Notification will be sent when the logger return to normal levels having been in alarm. 6. Click the Contact button adjacent to each of the sensors which have defined alarms. In the Select Contact dialog, select the contact and/or group that will receive the notification. 146 7. You can also click Check All to select all the sensor alarms for notification. Note: If the logger transmission rate is slower than the sampling rate, an alarm notification is still sent even if the logger transmission time hasn’t passed. For example, if the sampling rate is every 5 minutes, and the transmission rate is every 10 minutes, if a logger reaches a high alarm after 7 minutes a notification will be sent. The system won’t wait until the scheduled transmission time. 5.13.4. Email and SMS Notification Formats Email Notification Format When the Email notification is sent the recipient receives the Email in the following format: Email Header: DataNet Alarm Internal Temperature (Last recorded 25.47C) Low Alarm Email Body: DataNet Alarm Comment: Factory 1/F S/N: 808932 08-07-09 13:53:41 Internal Temperature Low Alarm Last recorded 25.47 C The Email header contains the sensor type, last recorded sample, and alarm type. 147 In addition the Email body contains the logger comment, serial number, time stamp of last sample and value of last sample. SMS Notification Format When the SMS notification is sent the recipient receives the SMS in the following format. (The logger comment is displayed in the first row). Factory 1/F Sensor: Internal Digital Temperature – High Alarm last recorded 29.59 C 5.14. Calibration The DataNet data loggers are shipped fully calibrated with a calibration certificate. However, DataNet does provide a simple and efficient process for users wishing to calibrate the DataNet data loggers themselves. The process itself can be performed wirelessly, over the network, but as with any data logger calibration a calibrator or other type of calibration instrument is necessary. The Calibration options are accessible via the Logger context menu in the Map View (right-clicking the Logger icon). Before performing logger calibration, the logger must be in Stop mode. In addition, all of the calibration options are accessible with a password making it difficult for nonauthorized users of the system to tamper with the loggers’ calibration settings. Note: The default password is 1234. The password can be changed in the password dialog box. 148 The Calibration option menu options are: • Calibration: Opens the main Calibration dialog • Save Calibration: Saves the logger’s current calibration settings • Load Calibration: Loads a logger’s previously saved calibration settings. • Reset Calibration: Resets the logger’s calibration settings so that the raw hardware data is obtained, without any software calibration applied to these values. • Restore Factory Calibration Default: Restores the logger’s calibration settings to the factory calibration i.e. the calibration settings it received prior to shipment from Fourier. 5.14.1. Introduction to DataNet Calibration Although the DataNet data loggers come fully calibrated, the software enables you to calibrate any of the DataNet sensors, on any input. The calibration parameters are sent to the data logger and stored in its memory. DataNet employs two different calibration methods: Twopoint calibration and Offset calibration. Each sensor can be calibrated using the Two-point calibration method, and then tweaked using offset calibration, except for the Thermocouples. These sensors require offset calibration only. 149 Sensor Type Calibration Method Current 4 – 20 mA Two-point calibration Humidity (Internal) Digital Two-point calibration Temperature (Internal) Digital Two-point calibration Temperature (Internal) PT-100 Two-point calibration and offset Temperature PT-100 2-wire Two-point calibration and offset Temperature Thermocouple J Offset calibration Temperature Thermocouple K Offset calibration Temperature Thermocouple T Offset calibration Voltage 0 to 1 V Two-point calibration Voltage 0 to 50 mV Two-point calibration Calibration Tips Prior to any two-point calibration it is recommended to restore factory calibration defaults. Prior to calibrating any of the thermocouple sensor types, calibrate the Voltage 50 mV sensor as this will set the gain (slope) of all thermocouple sensor types. After calibrating 50 mV, TC-J, TC-K or TC-T sensor types for all inputs you can refine the offset calibration for each input individually. 150 You may calibrate all thermocouple sensor types at once, or individually. Prior to calibrating the PT-100 input, you must first perform Reset Calibration in the Calibration dialog. Two-point Calibration The two-point calibration sets the gain (slope) and offset (intercept) of the sensor's conversion function. Use the two-point calibration to calibrate all DataNet sensors except for the Thermocouples. In some cases you may need to refine your calibration using the fine offset tuning tool. Offset Calibration To calibrate the Thermocouple temperature sensors: TC-J, TC-K and TC-T, first calibrate the 50 mV sensor type. That will set the slope for all Thermocouple temperature sensors. Then proceed to adjust the offset using the Offset calibration technique. 151 5.14.2. Calibrating the Data Logger Figure 48: Calibration dialog 1. From the Map View, open the Logger context menu and select Stop. 2. Select Calibration > Calibrate and enter the password in the Password dialog. 3. Select the sensor you wish to calibrate from the Sensor drop-down menu. 4. If calibrating an external sensor, select the inputs to calibrate. Select All or an individual input, 1 to 4. 5. Click Setup to send the sensor setup to the logger. Note: The calibration process does not delete the logger’s setup prior to calibration. Once Calibration is complete the original logger setup will be restored. 152 6. If you selected All inputs, then by default the logger will be setup to log data on Input 1 during the calibration process. Otherwise, if you selected a specific input, it will setup the logger to calibrate on that input. Logger Data Pane The Logger Data pane displays real-time readings on the logger, at a default sampling rate of one per second. You can also view the logger’s general status. Use the Logger Data pane to verify your logger is properly calibrated. The Calibration dialog will enable either Two-point or Offset calibration, or both, depending on the sensor selected. Note: The calibrated sensor parameters will be saved both in the DataNet logger and in the software memory, so there is no need to calibrate the logger every time you run the software. 5.14.3. Performing a Two-point Calibration To perform a two-point calibration, you must have two reference points to input against the real logger sensor values. Figure 49: Two-point calibration window 1. In the Point #1 field, enter the first Reference Value and the corresponding Logger Value. 153 2. In the Point #2 field, enter the second Reference Value and the corresponding Logger Value. Note: If you are using a calibrator and the logger is currently displaying the real value to be calibrated, press the Copy button to copy the real value to the Logger Value text box. 3. Press Send Calibration to send these values to the logger memory. 4. Compare the real value in the Logger Data pane to the reference value. If the values are within an acceptable margin of error you may close the Calibration window, or move on to the next sensor or input. 5. If the values are still not accurate enough, you can perform Offset calibration to tweak with values further. Note: Fourier strongly recommends calibrating using the default Reference values that appear in the two Reference value text boxes for each sensor. 5.14.4. Performing an Offset Calibration If, after the Two-point calibration procedure, the logger still exhibits some offset value use the Offset calibration tool to correct it. The offset value is the difference between the value displayed by the DataNet logger and the reference value. For example if the calibrator is set to 0 °C and the logger reads 1 °C the offset value is +1, but if the logger reads −1 °C then the offset value is −1. To perform an Offset calibration, simply select the Offset calibration radio button to enable the Offset text box. For 154 Thermocouples you will only have the option to perform an Offset calibration. Enter the offset value in the text box and click Send Calibration. Continue to adjust the offset accordingly until satisfied with the readings. 5.14.5. Setting the Offset to a Specific Input After setting the offset to all inputs simultaneously, you can set the offset of each input separately for even better accuracy. To set the offset of a specific input: 1. Measure two known reference values making sure to use the input you need to calibrate. 2. Enter the offset value as described in section 5.14.4 above, making sure to select the correct input number instead of All. 3. You can repeat the procedure for every input. 5.14.6. Calibrating the Internal Temperature Sensor on the DL910 The DNL910’s internal temperature sensor is a PT-100 sensor. Calibration of this sensor is performed by calibrating the external PT-100 input i.e. two-point calibration followed by offset calibration. 1. In the Calibration dialog, select PT-100 in the Sensor drop-down menu and select All inputs. 2. Press Setup to proceed. 155 3. Connect a calibrator or an actual PT-100 sensor to Input1. Calibrate the input using the reference values. Once this calibration procedure is complete both the logger’s internal temperature sensor (PT-100) and external PT-100 inputs will be calibrated. 5.14.7. Calibrating the External PT-100 Sensor Input PT-100 calibration is a standard 2-point calibration followed by offset calibration. Once the PT-100 sensor has been selected in the Sensor drop-down menu, click the Reset Calibration button. Then proceed with the 2-point calibration procedure. Before each calibration this step must be performed otherwise the calibration will not be accurate. 5.14.8. Saving Calibration Settings At any time you may manually save the logger’s calibration settings locally to your PC. 1. Open the logger context menu, select Calibration > Save Calibration and enter the password to access this feature. 2. The Save As dialog will open. Name the calibration file (with extension .dcf) and save it either in the default Calibration folder in the DataNet directory or in a folder of your choice. 5.14.9. Loading Calibration Settings You can load a previously saved DataNet .dcf calibration file at any time to restore a logger’s restore specific calibration settings. 156 1. Open the logger context menu, select Calibration > Load Calibration and enter the password to access this feature. 2. In the Open dialog, browse to the calibration file you need and click Open. The logger will be updated with the new calibration settings. 5.15. Analyzing the Data When in offline (History View) or online data displays, you have a number of features for analyzing the on-screen data. The features for analyzing data while in the graph display are practically the same when in offline or online mode. 5.15.1. Using the Graph Features The following section explains how to use the numerous graph analysis features, including an overview of the graph toolbar options. Please first refer to section 5.2.5: DataNet Toolbar Icons for a full overview of the graph toolbar. Autoscaling Click Autoscale on the graph toolbar to view the full data display, thereby restoring the axis range to its default settings. Zooming To zoom in to a specific area of the graph: 1. Click Zoom in on the graph toolbar. 157 2. Drag the cursor diagonally to select the area you want to magnify. Release the mouse button to zoom in to the selected area. 3. Click Zoom in tool. a second time to disable the zoom 4. Click Autoscale to restore the default display. Panning Use the Pan tool to pan along the x or y axis or after zooming in, to see any part of the graph that is outside the zoomed area. on the graph toolbar, then click anywhere 1. Click Pan on the graph and drag the mouse to view another area. 2. Click the Pan icon a second time to disable the Pan tool. The Cursor You can display up to two cursors on the graph simultaneously. Use the first cursor to display individual data recording values. Use two cursors to display the difference between two coordinate values, to display the frequency of periodic data or to select a range of data points. 158 Figure 50: Example of using two cursors When using two cursors, the Statistics feature will calculate statistics according to the data set between the two cursors. To display the first cursor: on the graph toolbar. You can drag the Click 1st Cursor cursor with the mouse onto any other point on the plot, or onto a different plot. For finer cursor movements use the forward and backward keys on the keyboard. The coordinate values of the selected point will appear in the information bar at the bottom of the graph window. To display the second cursor: Click 2nd Cursor and drag the cursor with the mouse onto any other point on the plot. The information bar will now display the difference between the two coordinate values. 159 To remove the cursors: Click the cursor icons a second time. Grid Click the Grid icon to add a grid to the background of the graph view. To remove the grid, click the icon again. Figure 51: Graph with grid in background Add Custom View Whenever the graph in History View is modified, either by using the Zoom tool, changing the scale, panning the graph, etc. you have the option to add this customer graph view to the Data Map, under the Custom Views node. This will enable you to save projects which include the custom graph view for future reference. Click the Add Custom View icon 160 to perform this function. Copying the Graph Click the Copy Graph icon to copy the graph to the clipboard, and paste it into another application, such as a word processing or spreadsheet application. Displaying Alarm Levels Open the Alarm drop-down menu and select the relevant sensor to display its alarm levels. The Stretch/Compress Axis Tool Move the cursor onto one of the graph axes. The cursor icon changes to the double arrow symbol (↔), indicating that you can stretch or compress the axis scale. Drag the cursor to the desired location. Repeat the procedure for the other axis if necessary. To select a data set to display on the Y-axis, click on the data set’s name in the Y-axis list. To display more than one curve, click on the data sets you want. Formatting the Graph You can change the plot line’s color and width. The color of the Y-axis matches the corresponding plot’s color and will automatically change with any change made to the color of the corresponding plot. on the graph toolbar to open 1. Click Graph properties the Graph properties dialog box. 161 2. Select the Style tab, and unselect the Use system line properties checkbox. 3. Select the axis you want to format in the Axis drop-down menu. 4. Select the color and line width. 5. Click OK. 6. To restore the default formatting, select the Use system line properties checkbox again. Manual Scaling 1. Click Graph properties on the graph toolbar to open the Graph properties dialog. 2. Select the Axis Scaling tab and with the Group plots by units checkbox unselected, select the axis to manually scale from the drop-down menu e.g. Date & Time axis. 3. Uncheck the Autoscale check box and enter the custom values in the text box i.e. a time range, in the case of the Time & Date axis, or a set of values. 4. Click OK. 5. To restore auto scaling select the Autoscale checkbox. Manual Scaling - Grouping Plots by Unit You may choose to group all of the sensors measuring the same unit, to the same scale. For example, if you have several temperature sensors in your data set, all measuring Celsius, you can apply a common scale when displaying the data from these sensors. on the graph toolbar to open 1. Click Graph properties the Graph properties dialog. 162 2. Select the Axis Scaling tab and select the Group plots by units checkbox. 3. In the Axis drop-down menu select the unit by which you wish to group the plots. 4. Uncheck the Autoscale check box and enter the custom values in the text box. 5. Click OK. 6. To restore auto scaling select the Autoscale checkbox. Figure 52: Grouping plots by units 5.15.2. Statistical Analysis DataNet also provides some basis statistics regarding the open data sets. While in History View or online Data Display view, click the Statistics tab. For each of the sensors in the data set, you will have the following statistics displayed: • Minimum / Maximum values • Average value 163 • Number of samples You will also see the Logger name and SN, as well as the start and end time of the statistics data range. While in online mode these statistics are updated in real-time. If you zoom onto a section of the graph, the statistics are dynamic and will therefore display statistics of the zoomed graph, not of the whole graph. If using the cursors, the statistics will be calculated according to the data set between the two cursors. Figure 53: Statistics View 5.16. Exporting Data to Excel or CSV Formats DataNet supports exporting data to Excel or CSV file formats (CSV stands for comma separated values). To export to Excel, click Export to Excel in the online or offline lower graph toolbar, or go to Analysis > Export to Excel (while viewing data in History View). The data currently displayed on the graph is exported. Data from more than one data logger may be exported simultaneously. DataNet will then open a new Excel workbook displaying the data as well as other pertinent information such as logger comment, serial number and the alarm level setup. Data that exceeds any of the alarm levels will be indicated. 164 Figure 54: Example of data exported to Excel Only offline data opened in History View can be exported to CSV and is available under the Analysis menu. 5.17. Printing the Data You are able to print data by clicking the Print icon from the lower toolbar in Graph, Table or Statistics tabs of the offline or online data displays. Clicking the Print icon will open the Print Setup dialog where you will need to select the printer to print to. When printing a table, you can select the specific data range you wish to print. You are able to adjust the date and time in order to narrow the data range. 165 Figure 55: Printing a table 5.18. System Password Throughout the software you will be required to enter a password to perform certain functions such as calibration or firmware update. Note: The default password is 1234. To change the password: 1. In the Password dialog box, click Change Password to open the Change Password dialog box. 2. Enter the current password in the Current Password text box. 3. Enter the new password in the New Password text box. 4. Enter the new password a second time in the Confirm New Password text box to confirm your new password. 5. Click OK. Note: The password must include at least 4 characters and is case sensitive. 166 Chapter 6: Updating DataNet Software and Firmware The release of DataNet v1.2 supports automatic software and firmware update whenever DataNet is launched, as long as the PC is connected to the Internet. The update process is managed by Fourier’s new Uptodata client. This client checks for updated software and firmware files located on the Fourier server, and if any have been detected they are downloaded and updated on the user’s PC. The user can also have DataNet automatically update the network units’ firmware or can choose to do so manually. A major benefit of the DataNet system is that units’ firmware is updated over the air from the DataNet software, so that the DataNet user does not have to ship any units back to the factory for upgrading. Without moving one deployed unit out of position in the network, the user can send a new firmware file wirelessly to all of the data logger end units and Repeaters. The Receiver firmware is updated via the USB cable. In addition to automatic firmware update, the user can also manually update the firmware via the DataNet Firmware Update Center or from the logger/Repeater icon in Map View. Refer to the relevant sections in this chapter for more details. 6.1. Using the Uptodata Client Use the Uptodata client to perform automatic checks for updated DataNet software and firmware versions, including updated versions of the DataNet user guide. Once 167 downloaded, DataNet software and firmware is automatically updated. However, you also have the option to manually update firmware rather than automatically. To use the Uptodata client follow the instructions below. 1. Launch DataNet and ensure the PC is connected to the Internet. 2. Launch the Uptodata update client from the DataNet main menu: Help > Check for Updates. The client dialog will state when you last checked for updates and when the last update was actually made. Figure 56: Uptodata dialog main window 168 Note: Select the Check for updates every time DataNet starts up checkbox to enable automatic check for new software and firmware files. 3. Click the Check for updates button. The update client connects to the Fourier Systems server and searches for software and firmware files more up to date than those installed on the user’s PC. Once the search is complete, the available software and firmware files will be displayed in the dialog. See the screenshot below for an example. The firmware file version is indicated according to the Fourier release date. Figure 57: Uptodata client showing available updates 169 Note: To search for files which are actually older than those on the PC, click Reset update date so that the update client will delete all records of previous updates on that PC. 4. To proceed with the software and firmware update, click the Update button. DataNet will be shutdown and the files will be downloaded from the Fourier server. a. If you don’t want the DataNet units’ firmware to be automatically updated once the software starts up again (depending on the number of units deployed, this can take some time), unselect the Auto firmware update on startup checkbox. You can always manually update the firmware later by using the Firmware Update Center. Refer to section 6.2 for more details. b. Select the Create backup copy for old components checkbox in order to create a backup folder containing all the components of the previous software version which will be updated. The backed up files are located in a folder in the default DataNet directory, with the time stamp of when the update was made. 170 Note: Updating the DataNet software does not result in any of the DataNet data files being deleted or affected in any way. 5. Once the files have been successfully downloaded to the DataNet installation directory on the PC, the software will be updated automatically and a system message will verify a successful update. The firmware file, named DataNetFirmware.dfw, will also be downloaded to the DataNet directory. Note: The firmware file combines firmware for all DataNet hardware units into one file. There is no need to download separate files for each type of unit e.g. DNR900, DNL910, DNL920, DNL808 and DNL810. 6. Another dialog will open prompting the user to run DataNet following a successful update. Select the Run DataNet checkbox and click OK. Otherwise, you may run the software at a later time. 171 7. The DataNet software is launched, and if you requested automatic firmware update, as long as the Receiver is connected and the network is online, the firmware update process will begin. If you didn’t, you may also manually update the firmware at the time of your choosing, using the Firmware Update Center. Note: If the update was canceled for any reason and was not completed, none of the previous installation files will be affected. 6.2. Updating DataNet Firmware There are several ways to update firmware for your DataNet hardware units. • Automatically, using the Uptodata client. Refer to section 6.1 above. • Manually, using the Firmware Update Center • Manually, using the context menu on the logger/Repeater icons in the Map View 172 6.2.1. Downloading the Firmware File 1. There are two ways to obtain the DataNet firmware file. a. Using the Uptodata client to download from the Fourier server. Refer to section 6.1 above. b. Downloading the latest firmware version directly from the Fourier Download Center at: www.fouriersystems.com/support/download_center.php. 2. Uptodata downloads the firmware file, named DataNetFirmware.dfw, to the DataNet directory on the PC. The default path is: C:\Program Files\Fourier Systems\DataNet. Note: The firmware file combines firmware for all DataNet hardware units into one file. There is no need to download separate files for each type of unit e.g. DNR900, DNL910, DNL920, DNL808 and DNL810. If you download the firmware file from the Fourier Download Center make sure to copy the file to the same path listed above. Once the file is downloaded the next step is to update the DataNet units. 6.2.2. Firmware Update from the Update Center 1. Once the downloaded firmware file is in the DataNet directory, go to Tools > Update Center from the main menu. Enter the password in the Password dialog to access the Update Center. 173 If no firmware file is detected in the DataNet directory, then an error message is displayed and the Update Center opens with a blank screen. Copy the firmware file to the directory and reopen the Update Center. Note: The default password is 1234. 2. The Update Center dialog lists all units in the network and displays pertinent information such as available firmware versions, firmware update status and unit info. Figure 58: Firmware Update Center dialog 174 Available Firmware Versions At the top of the Update Center dialog, available firmware versions are displayed. The information is taken from the firmware file DataNetFirmware.dfw stored in the DataNet directory C:\Program Files\Fourier Systems\DataNet. There are three classifications of DataNet units: • Receiver/ Repeater (DNR900) • DataNet data logger (DNL910 and 920) • Mini DataNet data logger (DNL808 and 810) The same firmware file is used for all units. Unit Status Options • Offline – unit is offline and firmware status can’t be determined. • No update required – Unit has latest firmware installed. • Uploading firmware file – Firmware file is being uploaded to the unit. Progress is displayed in percentages. • Updating firmware – Once firmware file is uploaded then the actual firmware update begins, overwriting the existing firmware on the unit. • Downloading – Logger unit is first downloading all data before beginning the firmware update. • Waiting to upload firmware – Unit is in a queue to upload the firmware, as the network can update two units at a time. 175 Unit Information Additional information provided in the Update Center includes: • The unit comment/name • Serial number • Current firmware version • Unit status • Update progress 1. If the unit status is Requires an update, then select the checkbox in the Update column adjacent to the unit you wish to update. You may select as many units as you like to update, but only two units can be updated at a time. 2. As soon as you select the Update checkbox, the command will be sent to the unit to begin uploading the firmware. The firmware is first uploaded to the unit’s memory and then installed. Even if the update is stalled halfway due to the unit shutting down, for example, the unit will not lose its current firmware and so will continue to be operable. 3. When the upload begins the Update Center status will change to Uploading firmware file and the unit display will read Loading firmware. The progress will also be displayed on both hardware and software. 4. When the upload is complete the unit will reset itself and the Update Center will display the status No update required. The firmware version will be updated as well. 176 Note: You can quit the firmware update at any time by unselecting the Update checkbox in the Update Center. 5. When the unit resets it will automatically rejoin the network and will be in Stop mode. However the unit configuration will still be saved. For loggers which have completed firmware update, run the logger to start recording data again. 6.2.3. Firmware Update from the Map View Icon Each DataNet unit, the data logger, Receiver and Repeater, has the Update Firmware option in its Map View icon context menu. 1. To perform a direct update from a specific unit, open the context menu and select Update Firmware. 2. Enter the password in the Password dialog box. 3. A DataNet system message will prompt you to confirm the update. Click Yes. 177 4. The firmware will begin updating and you can monitor its progress in the unit’s tooltip as well as in the Firmware Update Center itself. 178 Appendix A: DataNet Specifications A.1. Data Logger Input Types DNL910 and DNL920 External Inputs Internal Inputs Four external inputs with selectable sensor type for each input: DNL910 • PT-100 Temperature • 4 to 20 mA • DNL920 0 to 1 V • • Digital Temperature 0 to 50 mV • • Digital Relative Humidity PT-100 (2-wire) • Contact (Open/Closed) • Thermocouple J, K or T • Pulse counter (Input 4 only) • Frequency (Input 4 only) • User-defined sensors DNL808 External Input Internal Inputs NTC 10 KΩ None DNL810 External Input Internal Inputs None Digital Temperature Digital Humidity 179 A.2. DNL910 and DNL920 Outputs Alarm Output (Output 1) External Power Excitation (transducers usage) Open collector 12 VDC @ 2 A Close position resistance: 50 Ω Max. Load: 50 mA, 3 V DC Overload protection 50 mA reset fuse A.3. Logger Input Specifications DNL910 and DNL920 Internal PT-100 Temperature Internal Digital Temperature Relative Humidity Internal Digital (DNL910) (DNL920) (DNL920) Type: PT-100 Type: Digital sensor Range: 5 to 95 % Range: -20 to 50 ˚C Range: -20 to 50 ˚C Resolution: 0.5% Resolution: 0.1 ˚C Resolution: 0.1 ˚C Accuracy: Accuracy: ±0.3 ˚C Accuracy: ±0.5 ˚C 3% (DataNet software) 4% (Logger LCD) 180 Temperature Thermocouple J Temperature Thermocouple K Temperature Thermocouple T Range: -200 to 1,000 ˚C Range: -200 to 1,000 ˚C Range: -200 to 400 ˚C Resolution: 0.1 ˚C Resolution: 0.1 ˚C Resolution: 0.1 ˚C Accuracy: Accuracy: Accuracy: -200 to – 60 ˚C ±0.5 % -200 to – 60 ˚C ±0.5 % -200 to – 60 ˚C ±0.5 % 60 to 1,000 ˚C ±0.5 % 60 to 1,000 ˚C ±0.5 % 60 to 400 ˚C ±0.5 % -60 to 60 ˚C ±0.5 ˚C -60 to 60 ˚C ±0.5 ˚C -60 to 60 ˚C ±0.5 ˚C Cold junction compensation: ±0.3 ˚C Cold junction compensation: ±0.3 ˚C Cold junction compensation: ±0.3 ˚C Temperature PT-100 Pulse Counter Frequency (2-wire) (Input 4 only) (Input 4 only) Range: -200 to 400 ˚C Zero crossing detector Zero crossing detector Resolution: 0.1 ˚C) Range: 20 Hz to 4 KHz Accuracy: Range: 1 to 65,536 counts -200 to - 60 ˚C ±0.5 % Resolution: 1 count Input impedance: 470 Ω 60 to 400 ˚C ±0.5 % Frequency range: 0 to 4 KHz -60 to 60 ˚C ±0.3 ˚C Input signal: 0 to 5 V Input signal: 0 to 5 V Input impedance: 470 Ω 4 to 20 mA 0 to 1 V 0 to 50 mV Range: 4 to 20 mA Range: 0 to 1 V Range: 0 to 50 mV Resolution: 4.76 μA Resolution: 200 μV Resolution: 3 μV Accuracy: ±0.5 % Accuracy: ±0.5 % Accuracy: ±0.5 % Loop impedance: 21 Ω Input impedance: 25 MΩ Input impedance: 25 MΩ Maximum voltage: 5.2 V Maximum voltage: 5.2 V Maximum load: 30 mA, 5.2 V 181 Contact Range: Open/Close A.4. Sensor Specifications DNL808 and DNL810 NTC 10 KΩ (DNL808) Internal Digital Temperature Internal Digital Relative Humidity (DNL810) (DNL810) Range: -50 to 150 °C Temp range: -20 to 50 °C RH range: 5 to 95 % Resolution: 0.06 °C Temp resolution: 0.04 °C RH resolution: 0.5 % Accuracy: Temp accuracy: ±0.4 °C RH accuracy: ±3 % -50 to 60 ˚C ±0.3 ˚C 60 to 150 ˚C ±0.5 % A.5. General Specifications DataNet Logger Sampling Features • Memory capacity: ~59,000 samples • Sampling rate: 1 per sec to 1 per every 2 hours • Sampling resolution: 16-bit • Channel separation: 80 dB DataNet RF Network Communication • Frequency: 2.4 GHz • Network units: 65,000 • Data rate: 250 Kbps 182 • Full mesh network architecture supported • 128-bit network security encryption • Worldwide license-free DNR900, DNL910 and 920 Hardware Specifications Display • 2-row LCD • 16 character display Power Supply • Internal rechargeable 4.8 V, 800 mAh NiMH battery (2 batteries in series) • Built-in battery charger • External 12 V DC input @ 300 mA 3.6 VA • Battery Life: Up to six months Operating Temperature Range • -20 to 50 ˚C • Water and dust proof: IP54 DNR900 PC Communication • USB 2.0 compliance • Mini USB type B cable Casing • Plastic ABS box • Dimensions: 97 x 93 x 27 mm 183 • Weight: 200 gr • Table and wall mounting DNL808 and DNL810 Hardware Specifications Power Supply • Internal 2/3 AA lithium battery • Battery voltage range: 2V - 3.6 V • Battery life: Up to 10 months depending on sampling rate Casing • Dimensions: 68 x 68.6 x 26.5 mm (without the cradle and the external antenna) • Weight: Logger: 53 gr; Cradle: 10 gr; External Antenna: 17.5 gr • Table and wall mounting Operating Temperature Range • -30 to 75 ˚C • Water and dust proof: IP54 Man Machine Interface Full keyboard operation Standards Compliance CE, FCC 184 A.6. System Requirements Software Hardware OS Platform: Windows 2000 SP3, Windows 2003, Windows XP SP2, and Windows Vista Processor: Pentium 800 MHz or higher Browser: Internet Explorer 5.01 or higher Storage Memory: 250 MB available disk space for the DataNet application Screen Resolution: Minimum 1024 x 768 185 Memory: 256 MB RAM Appendix B: Safety Information and FCC IDs The DataNet system complies with relevant safety regulations for data processing devices. Please contact Fourier Systems with any questions regarding DataNet safety issues. FCC ID for DataNet System DNR900: FCC ID: XGO-DNR900 This device complies with Part 15 of the FCC Rules. Operation is subject to the following two conditions: (1) This device may not cause harmful interference and (2) This device must accept any interference received, including interference that may cause undesired operation. DNL920: FCC ID: XGO-DNL920 This device complies with Part 15 of the FCC Rules. Operation is subject to the following two conditions: (1) This device may not cause harmful interference and (2) This device must accept any interference received, including interference that may cause undesired operation. DNL910: FCC ID: XGO-DNL910 This device complies with Part 15 of the FCC Rules. Operation is subject to the following two conditions: (1) This device may not cause harmful interference and (2) This device must accept any interference received, including interference that may cause undesired operation. DNR800: FCC ID: XGO-DNR800 This device complies with Part 15 of the FCC Rules. Operation is subject to the following two conditions: (1) This device may not cause harmful interference and (2) This device must accept any interference received, including interference that may cause undesired operation. 186 DNL804: FCC ID: XGO-DNL804 This device complies with Part 15 of the FCC Rules. Operation is subject to the following two conditions: (1) This device may not cause harmful interference and (2) This device must accept any interference received, including interference that may cause undesired operation. DNL808: FCC ID: XGO-DNL808 This device complies with Part 15 of the FCC Rules. Operation is subject to the following two conditions: (1) This device may not cause harmful interference and (2) This device must accept any interference received, including interference that may cause undesired operation. DNL810: FCC ID: XGO-DNL810 This device complies with Part 15 of the FCC Rules. Operation is subject to the following two conditions: (1) This device may not cause harmful interference and (2) This device must accept any interference received, including interference that may cause undesired operation. DataNet Battery The DataNet DNR900, DNL910 and 920 devices are supplied with internal rechargeable 4.8 V NiMH batteries as well as connection to AC power. The Mini DataNet DNL808 and 810 data loggers are supplied with 1 x 2/3 AA lithium battery. • Do not tamper or drop the battery to avoid leakage of hazardous chemicals contained within. • Do not puncture, incinerate, disassemble or expose the battery to temperatures above 122 ºF (50 ºC). • Keep the battery away from children. 187 • Dispose of the battery only in accordance with local regulations concerning potentially hazardous waste. Do not throw in the garbage bin. • Remove the battery when not using the DataNet loggers for a significant period of time e.g. when the DataNet loggers are placed in long-term storage. DataNet AC Power Adapter • Only use the AC adapter provided by Fourier Systems. • Verify that your power outlet is suitable for the voltage of the AC adapter. • If the AC adapter is connected to an AC outlet, make sure the area around the outlet is accessible and the adapter is not covered while in operation. • Do not place the AC adapter on heat-sensitive material. • Do not charge the DataNet while situated in a carrying case or without sufficient airflow surrounding the loggers. • Do not expose the adapter to direct sunlight or water. • Do not tamper with the adapter components. DataNet Operating Environment • DNR900, DNL910 and DNL 920: -20 to 50 ˚C • DNL808 and DNL810: -30 to 75 ˚C 188 Appendix C: Ordering Information For the full list of DataNet products, and place DataNet orders please visit www.fouriersystems.com/order or contact your local Fourier distributor: DataNet Product Suite Part Number Product Name Product Description DNR900 Receiver/Repeater Two-mode module for creating and managing DataNet ZigBee network, and extending network transmission range DNL910 Data Logger Internal Temperature PT-100 sensor Four channels: mA, V, mV, TCK/J/T, PT-100, Pulse, Frequency, Contact DNL920 Data Logger Internal Digital RH and Temperature sensors Four channels: mA, V, mV, TCK/J/T, PT-100, Pulse, Frequency, Contact 189 Part Number DNL808 DNL810 Product Name Data Logger Product Description External NTC 10 KΩ sensor input Data Logger • Battery operated • Product includes NTC probe Internal Digital Temperature and Humidity sensors Battery operated DN-PCSUITE Software CD and Accessories PC Suite including USB communication cable, software CD and digital user guide 12504 GSM Modem GSM modem connecting to PC and integrates with DataNet software to enable sending of SMS alarm notifications DT332 NTC temperature sensor and cable NTC 10 kΏ temperature sensor for use with DNL808 190 • Range: -50 to 150 °C • 2.5 m cable length Part Number 12753 12752 12751 Product Name PT-100 temperature sensor and cable PT-100 temperature sensor and cable PT-100 temperature sensor and cable Product Description PT-100 temperature sensor • Range: -70 to 400 °C • 2.5 m cable length PT-100 temperature sensor • Range: -70 to 400 °C • 4 m cable length PT-100 temperature sensor • Range: -70 to 400 °C • 6 m cable length 12655 1 m mini-USB communication cable For connection between Receiver and PC 13330 3 m mini-USB communication cable For connection between Receiver and PC 12928 Replacement internal battery (for Mini DataNet) Replacement internal battery for DNL808 and 810 191 2/3 AA 3.6 V lithium Appendix D: Figures and Tables List of Figures FIGURE 1: ZIGBEE NETWORK DIAGRAM 6 FIGURE 2: EXAMPLE OF DATANET NETWORK APPLICATION 13 FIGURE 3: STANDARD DATANET MESH NETWORK ARCHITECTURE 15 FIGURE 4: DATANET NETWORK WITH SHORT RANGE REPEATERS 15 FIGURE 5: MAIN DATANET WINDOW 17 FIGURE 6: ADDING RECEIVER ICON TO MAP VIEW 19 FIGURE 7: RECEIVER TOOLTIP 19 FIGURE 8: MINI DATANET DEVICE FILTER DIALOG 24 FIGURE 9: MAP VIEW BACKGROUND IMAGE EXAMPLE 26 FIGURE 10: LOGGER SETUP WINDOW 27 FIGURE 11: ONLINE DATA – GRAPH VIEW 29 FIGURE 12: ONLINE DATA – TABLE VIEW 30 FIGURE 13: ONLINE DATA – STATISTICS VIEW 30 FIGURE 14: LOGGER TOOLTIP 31 FIGURE 15: SENSOR VIEW 31 FIGURE 16: SHOWING NETWORK PATHS – EXAMPLE 1 35 FIGURE 17: SHOWING NETWORK PATHS – EXAMPLE 2 35 FIGURE 18: DNL910 DATA LOGGER FRONT PANEL 40 FIGURE 19: DNL808 DATA LOGGER FRONT PANEL 41 FIGURE 20: DNL920 DATA LOGGER EXTERNAL CONNECTIONS 42 FIGURE 21: DNL808 DATA LOGGER EXTERNAL CONNECTIONS 43 FIGURE 22: RECEIVER/REPEATER FRONT PANEL 44 FIGURE 23: RECEIVER/REPEATER EXTERNAL CONNECTIONS 45 192 FIGURE 24: DATANET LOGGER SENSOR INPUTS 48 FIGURE 25: EXTERNAL ALARM SCHEMATIC 51 FIGURE 26: USB COMMUNICATION CABLE 59 FIGURE 27: INSTALLING SILICON LABS USB DRIVER – STEP 1 92 FIGURE 28: INSTALLING SILICON LABS USB DRIVER – STEP 2 92 FIGURE 29: INSTALLING SILICON LABS USB DRIVER – STEP 3 93 FIGURE 30: INSTALLING SILICON LABS USB DRIVER – STEP 4 93 FIGURE 31: MAIN WINDOW - MAP VIEW 95 FIGURE 32: MAIN WINDOW – SENSOR VIEW 96 FIGURE 33: MAIN WINDOW – HISTORY VIEW 99 FIGURE 34: DATA MAP 100 FIGURE 35: MAIN TOOLBAR ICONS 101 FIGURE 36: DEFINE NEW SENSOR DIALOG 111 FIGURE 37: OPTIONS > PREFERENCES TAB 114 FIGURE 38: OPTIONS > EMAIL SETTINGS TAB 117 FIGURE 39: OPTIONS > SMS SETTINGS TAB 118 FIGURE 40: OPEN DATA FILES DIALOG 122 FIGURE 41: SYNC DATA DIALOG 123 FIGURE 42: ONLINE DATA WINDOW 124 FIGURE 43: ALARM SETUP TAB 140 FIGURE 44: ALARM NOTIFICATIONS SETUP DIALOG 142 FIGURE 45: ADDING A CONTACT 143 FIGURE 46: ADDING A GROUP 144 FIGURE 47: SMS AND EMAIL NOTIFICATION SETUP 146 FIGURE 48: CALIBRATION DIALOG 152 FIGURE 49: TWO-POINT CALIBRATION WINDOW 153 FIGURE 50: EXAMPLE OF USING TWO CURSORS 159 FIGURE 51: GRAPH WITH GRID IN BACKGROUND 160 FIGURE 52: GROUPING PLOTS BY UNITS 163 FIGURE 53: STATISTICS VIEW 164 FIGURE 54: EXAMPLE OF DATA EXPORTED TO EXCEL 165 FIGURE 55: PRINTING A TABLE 166 193 FIGURE 56: UPTODATA DIALOG MAIN WINDOW 168 FIGURE 57: UPTODATA CLIENT SHOWING AVAILABLE UPDATES 169 FIGURE 58: FIRMWARE UPDATE CENTER DIALOG 174 List of Tables TABLE 1: DATA LOGGER PROGRAMMING LIMITATIONS50 TABLE 2: DATA LOGGER BATTERY LIFE SCENARIOS 58 TABLE 3: MAIN TOOLBAR ICON LIST 102 TABLE 4: MAIN TOOLBAR ICON LIST 104 TABLE 5: LOWER GRAPH TOOLBAR ICON LIST 105 TABLE 6: DATA MAP ICONS 106 194 195