1
FACULDADE DE ENGENHARIA DA UNIVERSIDADE DO PORTO
A Computational Platform for Assessing
the Impact of Alternative Splicing in
Cancer
Vítor Amálio Maia Martins Moreira
Mestrado Integrado em Engenharia Informática e Computação
Supervisor: Rui Camacho (Departamento de Engenharia Informática da FEUP)
Second Supervisor: Pedro Ferreira (Swiss Institute of Bioinformatics)
June 23, 2014
© Vítor Amálio Maia Martins Moreira, 2014
A Computational Platform for Assessing the Impact of
Alternative Splicing in Cancer
Vítor Amálio Maia Martins Moreira
Mestrado Integrado em Engenharia Informática e Computação
Aprovado em provas públicas pelo Júri:
Presidente: Ana Paiva (PhD)
Vogal Externo: Sérgio Matos (PhD)
Orientador: Rui Camacho (PhD)
____________________________________________________
July 11, 2014
Abstract
Cancer is a disease that affects millions of individuals around the world every year. Although it
is known by this single name it may have different causes. One such cause is based on an
abnormal working of the genetic mechanisms. The emergence of high-throughput sequencing
has brought substantial advances in cancer genomics research. The current pace of advance of
this technology made it possible to assay with high depth of coverage the DNA and the
transcriptomes (RNA-Seq) of tumour samples and cancer cell lines. Aberrant RNA processing
of genes plays an important role in cancer.
The goal of this thesis is twofold: automate, as much as possible, the analysis process of
genetic data for cancer studies; and develop a computational platform that makes the powerful
computational resources required for such analysis easily manageable and in a scalable fashion.
With these two goals in mind we have implemented part of a pipeline that performs the analysis
from the RNA-Seq data (the set of reads) to the determination of the possible protein domains
that may be in the origin of the disease. The platform also allows the enrichment of the analysis
by searching for information in relevant databases available on the internet. We have also
developed it in a way that hides the computational resources from the user making it easy to use
by the life sciences experts. The platform is also very easy to manage enabling the
use/updating/removing of resources on different operating systems and without impact to the
analysis process. It also enables the execution of the complete set or individual steps of the
analysis pipeline.
Although the platform is general purpose, the current version is tuned for to the application
of methods that use high-throughput information from the transcriptome of cancer samples to
identify events of aberrant splicing and their impact in the transcript structure. The developed
platform was tested in case studies using different cell lines from databases available on the
ENCODE project web site.
i
ii
Resumo
O cancro é uma doença que afeta milhões de pessoas em todo o mundo todos os anos. Apesar de
ser conhecida por este nome, pode ter diferentes causas. Uma dessas causas é baseada num mau
funcionamento dos mecanismos genéticos. O surgimento do sequenciamento de alto rendimento
trouxe avanços substanciais na área de investigação da genómica do cancro. Com o passo atual
de desenvolvimento desta tecnológica, é possível determinar com grande cobertura o DNA e os
transcriptomas (RNA-Seq) de exemplos células cancerígenas e de linhas celulares. O
processamento aberrante de genes tem um papel importante no cancro.
O objetivo desta tese é duplo: automatizar o quanto possível o processo de análise de dados
genéticos para o estudo do cancro; e desenvolver uma plataforma computacional que permita o
uso de poderosos recursos computacionais para estudos que envolvam análise de informação de
alto rendimento do transcriptoma de amostras cancerígenas de forma fácil e escalável. Com
estes dois objetivos em mente implementámos parte das sequências de tarefas que executam a
análise a partir dos dados RNA-Seq (o conjunto de reads) até à determinação dos possíveis
domínios de proteínas que possam estar na origem da doença. A plataforma permite o
enriquecimento da análise ao procurar por informação em bases de dados relevantes disponíveis
na internet. A plataforma foi desenvolvida de maneira a esconder os recursos computacionais do
utilizador, fazendo com que esta seja simples de usar por parte dos especialistas das ciências
vivas. A plataforma é também muito fácil de gerir ao permitir utilização/atualização/remoção de
recursos em diferentes sistemas operativos e sem impacto no processo de análise. Também
permite a execução individual de cada passo da sequência de tarefas.
Apesar de a plataforma ser de uso geral, a versão atual está otimizada para a aplicação de
métodos que usam informação de alto rendimento de transcriptomas de amostras de cancro para
identificar ocorrências de splicing alternativo e o seu impacto na estrutura transcrita. A
plataforma desenvolvida foi testada em casos de estudo usando diferentes linhas celulares de
bases de dados disponíveis na página web do projeto ENCODE.
iii
iv
Acknowledgements
I would like to thank my supervisor at FEUP, Professor Rui Carlos Camacho de Sousa Ferreira
da Silva, for his suggestions and reviews on both the solution developed and this document. I
would also like to thank my co-supervisor from the Swiss Institute of Bioinformatics, Doctor
Pedro Gabriel Ferreira, for his help in understanding the pipelines related with alternative
splicing analysis.
Vítor Moreira
v
vi
Contents
1.
Introduction ............................................................................................................. 1
1.1
Context ............................................................................................ 1
1.2
Motivation and Goals ...................................................................... 2
1.3
Project ............................................................................................. 2
1.4
Structure of the Thesis..................................................................... 3
2.
Basic Concepts and Survey on Technology .......................................................... 4
2.1
Basic Biological Concepts .............................................................. 4
2.2
Software for the Biological Analysis .............................................. 6
2.2.1
Standard File Formats for Bioinformatics Data .............................. 7
2.2.2
Genomic Assemblage Software .................................................... 13
2.2.3
Databases....................................................................................... 14
2.3
Data Mining .................................................................................. 15
2.3.1
Data Analysis Algorithms ............................................................. 15
2.3.2
Data Analysis Tools ...................................................................... 16
2.4
Algorithm Evaluation Methods and Measures .............................. 18
2.5
Web Services ................................................................................. 19
2.5.1
Representational State Transfer..................................................... 20
2.5.2
Web Frameworks .......................................................................... 21
2.6
Job Scheduling .............................................................................. 21
2.7
Chapter Conclusions ..................................................................... 23
3.
A Website for Alternative Splicing Analysis ...................................................... 24
3.1
Web Service .................................................................................. 24
3.1.1
3.2
3.3
4.
Main Use Cases ............................................................................. 24
Architecture ................................................................................... 26
3.2.1
Database Architecture ................................................................... 28
3.2.2
Web Service Architecture ............................................................. 30
Chapter Conclusions ..................................................................... 34
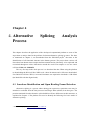
Alternative Splicing Analysis Process ................................................................. 35
4.1
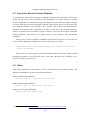
Junctions Identification and Open Reading Frame Detection ....... 35
vii
4.1.1
4.2
Search for Known Proteins Domains ............................................ 39
4.3
Other.............................................................................................. 39
5.
A.
Obtaining the Junctions Type Count ............................................. 37
Conclusions ............................................................................................................ 40
5.1
Achievement of Objectives ........................................................... 40
5.2
Future Work .................................................................................. 41
Web Service User Manual .................................................................................... 45
A.1
Introduction ................................................................................... 45
A.2
Installation ..................................................................................... 45
A.2.1
Prerequisites .................................................................................. 45
A.2.2
Compiling ...................................................................................... 46
A.2.3
A.3
Installing ........................................................................................ 48
A.2.3.1 Web Service
49
A.2.3.2 Worker Bot
51
User Guide .................................................................................... 52
A.3.1
Sign In ........................................................................................... 52
A.3.2
Login ............................................................................................. 53
A.3.3
Web Service Menu ........................................................................ 54
A.3.4
Clusters .......................................................................................... 55
A.3.4.1 Create Cluster
A.3.5
A.3.6
A.3.7
A.3.8
55
Files ............................................................................................... 56
Jobs................................................................................................ 59
A.3.6.1 Add Job
59
A.3.6.2 Job Details
61
Projects .......................................................................................... 62
A.3.7.1 Create Project
62
A.3.7.2 Project Details
63
Users.............................................................................................. 64
A.3.8.1 Pending User
64
viii
List of Figures
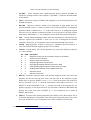
Figure 2.1: Diagram showing the translation of mRNA and the synthesis of proteins
by a ribosome.
5
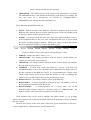
Figure 2.2: Principles of alternative splicing.
6
Figure 2.3: SAM file example with tabs replaced with spaces for readability.
9
Figure 2.4: Range of score values and it corresponding grey colour.
10
Figure 2.5: GTF file example with tabs replaced with spaces for readability.
10
Figure 2.6: Range of score values and it corresponding grey colour.
11
Figure 2.7: BED file example with tabs replaced with spaces for readability.
12
Figure 2.8: FASTA file example.
13
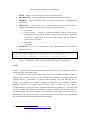
Figure 3.1: Web service use cases.
26
Figure 3.2: Web service architecture.
27
Figure 3.3: Web service project layers.
27
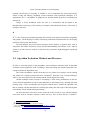
Figure 3.4: Database schema of the web service.
29
Figure 3.5: Web service initial menu.
30
Figure 3.6: BAM to SAM conversion job example.
31
Figure 3.7: Markdown example.
32
Figure 3.8: File browser.
33
Figure 4.1: Exon skipping alternative splicing.
36
Figure 4.2: Mutually exclusive exons alternative splicing.
36
Figure 4.3: Alternative 3’ alternative splicing.
36
Figure 4.4: Alternative 5’ alternative splicing.
37
Figure 4.5: Intron retention alternative splicing.
37
Figure A.1: Web service example configuration file.
49
Figure A.2: Worker bot example configuration file.
51
Figure A.3: Sign in form.
52
Figure A.4: User account menu.
53
Figure A.5: Login menu.
53
Figure A.6: Web service menu.
54
Figure A.7: Cluster accounts listing.
55
ix
Figure A.8: Add cluster account.
55
Figure A.9: File browser.
56
Figure A.10: Edit file description.
56
Figure A.11: File description.
57
Figure A.12: Rename file dialog.
57
Figure A.13: Delete file confirmation dialog.
57
Figure A.14: Project's file browser.
58
Figure A.15: Add job example.
60
Figure A.16: Job details.
61
Figure A.17: Add project.
62
Figure A.18: Project details.
63
Figure A.19: Pending users menu.
64
Figure A.20: Users listing.
64
x
List of Tables
Table 2.1: REST operations for user collection.
20
Table 2.2: REST operations for user item.
20
xi
Abbreviations
API
Application Programming Interface
ASP
Active Server Pages
BAM
Binary Sequence Alignment
BED
Annotation Track Format
cDNA
Complementary DNA
CRUD
Create, Read, Update and Delete
CSS
Cascading Style Sheets
DB
Database
DNA
Deoxyribonucleic Acid
FEUP
Faculty of Engineering of the University of Porto (Faculdade de Engenharia da
Universidade do Porto)
FTP
File Transfer Protocol
GNU
GNU's not UNIX!
GPL
GNU General Public License
GTF
Gene Transfer Format
HTML
HyperText Markup Language
HTTP
Hypertext Transfer Protocol
IIS
Internet Information Services
JS
JavaScript
JSON
JavaScript Object Notation
mRNA
Messenger RNA
MVC
Model–View–Controller
NGS
Next Generation Sequencing
NoSQL
Not Only SQL
ORF
Open Reading Frame
OS
Operating System
OSI
Open Source Initiative
REST
Representational State Transfer
RGB
RGB colour model (red, green ,blue)
RNA
Ribonucleic Acid
xiii
RNA-Seq
RNA Sequencing
SAM
Sequence Alignment/Map
SHA
Secure Hash Algorithm
SQL
Structured Query Language
Stderr
Standard Error
Stdin
Standard Input
Stdio
Standard Input/Output
Stdout
Standard Output
SVM
Support Vector Machine
URL
Uniform Resource Locator
XML
Extensible Markup Language
xiv
Chapter 1
1. Introduction
This chapter gives an introduction to the problem being addresses by the thesis work and
describes the solution adopted and implemented. We also provide a motivation for the work
done and summarize the contributions.
1.1 Context
Cancer is a disease that affects millions of individuals around the world every year. Although it
is known by this single name it may have different causes. One such cause is based on an
abnormal working of the genetic mechanisms. Aberrant alternative splicing has been recognised
as having a very important role in cancer development (Sette, Ladomery, and Ghigna 2013),
(Venables 2004). The emergence of high-throughput sequencing, especially with the next
generation sequencing (NGS) techniques, has brought substantial advancements in cancer
genomics research. Newer NGS techniques are faster, cheaper and, with advancements in
computing, allow us to analyse the process using cheap, off-the-shelf hardware. The current
pace of advancements of this technology made it possible to assay with high depth of coverage
the DNA and the transcriptomes (RNA-Seq) of tumour samples and cancer cell lines. Aberrant
RNA processing of genes plays an important role in cancer.
Along with the advancements on sequencing technology, molecular biology has seen an
incredible increase in the number and diversity of software developed to solve a wide range of
biological problems and to speed up a large number a tedious task expert biologist have to
perform. Data analysis in molecular biology has also seen considerable advancements with the
crucial help of informatics. Despite the reported advancements in software applied to biological
issues, there are important problems that have to be addressed. For complex studies the required
information is scattered among a lot of different sources in the internet and encoded in different
1
Introduction
formats. Complex analysis (using genetic data for example) requires powerful computational
resources. The available software used in complex analysis may encompass the use of a lot of
tools (the user must know how to use them all). There are a lot of complex analyses that have to
be done routinely by biologist. To all of these problems (bio)informatics may give a very useful
contribution as we expect to show with our work.
1.2 Motivation and Goals
Advances in the study of the effect of aberrant alternative splicing in cancer may have an
enormous social impact. Insights on the mechanism that originates cancer may suggest
processes to prevent or reduce its occurrence. There is also an enormous amount of both data
and software tools available on the web. The software available is usually collections of
programs that solve a small part of biological problems. Our main motivation is to contribute to
the availability of software that may speed-up and facilitate the work of biologist and physicians
who are involved in the fight against cancer. We also take advantage of real data available on
the web.
More specifically we are particularly motivated by the crucial help that informatics can
provide to the studies requiring the analysis of massive amounts of (genetic) data.
1.3 Project
In this thesis we propose and have implemented a computational platform that may improve the
analysis process by expert biologists when studying the effect of aberrant alternative splicing in
the development of cancer. The platform is easy to use and allows the management of users,
computational resources and experiments. It enables the execution of tasks to be distributed
among several machines running different environments. Users have control over their
experiments and can share information among them by making their resources public. There is
also (implemented with the topic of aberrant alternative splicing in mind) the possibility to
search for information on available databases on the internet in a user transparent manner. The
platform provides a way to fetch, store and retrieve large amounts of data that are typical in
human genomic based studies. General contributions of this thesis include:
A general purpose architecture to run jobs in several machines running different
operating systems;
A web based interface that makes it easy for the user to automate processes requiring
the execution of several tasks;
A software tool to be used in a collaborative process among researchers sharing any
information they think useful to others;
A ubiquitous computational tool accessible from any place with access to the web.
2
Introduction
Contributions specific for the study of aberrant alternative splicing include:
A platform running "standard" tools used in aberrant alternative splicing studies;
The possibility of chaining tools to build a pipeline that accepts the aligned reads as
input and produces the aberrant alternative splicing results;
An automatic process (using the API from the adequate web resource) to fetch the final
information of the analysis concerning the domains of missing parts of the proteins
encoded by the gene under analysis.
1.4 Structure of the Thesis
The rest of the thesis is structured as follows.
Chapter 2 describes the biological processes related to the domain of genetic-based cancer
and molecular biology basic concepts. We also survey the main technologies that we have used
in the development of the proposed computational platform.
Chapter 3 details the computational platform developed and how it works both internally
and from an end user's perspective.
Chapter 4 describes the biological processes important for alternative splicing analysis and
how they can be executed using our proposed computational platform.
Chapter 5 concludes this thesis and outlines future improvements.
3
Chapter 2
2. Basic Concepts and Survey on
Technology
We first introduce basic biological concepts necessary to understand the scope of this thesis. We
then describe the process of sequencing programs and the state-of-the-art in algorithms used to
study the impact of alternative splicing.
The rest of the chapter addresses the technological tools and alternatives to implement the
computational platform.
2.1 Basic Biological Concepts
The genome is composed by a set of genes, and it contains all of our hereditary information.
The genes are found in chromosomes and made of deoxyribonucleic acid (DNA). Genes
determine the various characteristics of all living organisms by telling our cells how to make
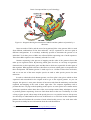
proteins, as seen in Figure 2.1. Proteins do not give a human being big ears, per se, but their
production is determined by your genes and that will be responsible for one's physical traits.
4
Basic Concepts and Survey on Technology
Figure 2.1: Diagram showing the translation of mRNA and the synthesis of proteins by a
ribosome1.
Genes are made of DNA, and the sum of an organism's DNA is the genome. DNA is made
from different combinations of four base molecules -ACGT- repeated over and over again in
different configurations. It is nowadays technically possible to determine the genome of an
individual. To do that, pieces of RNA are collected (RNA sequencing) out of small sequences.
These short RNA sequences are commonly referred to as reads.
Genome sequencing is the process of mapping out the order of the genome's bases that
make up an organism's DNA. By knowing which genes do what, we can map an organism's
characteristics to their equivalent genes and thus know which are responsible for what parts of
that organism. When applied to diseases, this allows us to know which genes are responsible for
their development. The human genome is made up of over 3 billion of these base molecules,
and we are not one of the most complex species on earth as other species possess far more
molecules.
In order to obtain the whole human genome, one first splits it into pieces which are then
sequenced and reassembled in the original order to get to the original genome. As you can
imagine, this process is error prone because of incorrect reads from the machinery used and the
repetition and mapping of the reads in their right order. The computer algorithms used to
perform this have varying results depending on the species as some species have smaller strains
with many repetitions where others have wider, more unique strains. Many techniques are used
to perform genome sequencing. Some are faster than others at the cost of reliability. It is like
solving a jigsaw puzzle, where many of the puzzle pieces are very similar, however, this process
isn't necessary to understand for the success of this thesis as we will focus on the computational
platform that will facilitate the execution of tasks related to this process. Our work starts after
the genome assembly but uses information about the reads distribution.
1
Image taken from Wikipedia - http://en.wikipedia.org/wiki/DNA_Translation
5
Basic Concepts and Survey on Technology
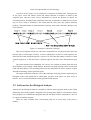
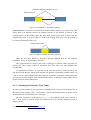
A gene (as seen in Figure 2.2) is composed of a sequence of smaller parts. These parts are
of two types: exons and introns. Exons and introns alternate in sequence to make up the
complete gene. Only the exons convey information to encode the proteins as introns are
noncoding regions. It happens that at different times and circumstances a different set of exons
may be active (may be translated). This means that the same gene may produce different
products. This phenomenon is called alternative splicing. Some of the alternative products may
cause diseases.
Figure 2.2: Principles of alternative splicing.
This process happens inside our cells and is responsible for our physical traits and some
diseases such as certain types of cancer. To assess which genes are active in each organism, one
must take the initial assembled genome, or parts of it, and count the number of times a certain
sequence appears in it. The more times a sequence appears, the more active that particular gene
is.
Once that count has been established, one can use it to compare to known traits and assay
the probability of developing certain diseases. Software tools help us produce these counts from
reads and others help us view and analyse the necessary information in order to produce a report
about the functioning of those particular genes.
The output of the RNA sequence (one of the techniques for doing genome sequencing) is a
histogram of the reads which tell us which genes (or parts of the genes) are more active or
inactive. This is useful information to study genomic based diseases.
2.2 Software for the Biological Analysis
Software for the Biological analysis is divided by function. Most programs abide by the UNIX
philosophy where each program is designed to do one thing only and do it well. Because of this,
most programs are command-line programs that take the input of others and produce a new set
of outputs for another program.
There are many available tools, each dealing with one or more steps of the process,
notably:
6
Basic Concepts and Survey on Technology
Read aligners align reads to a reference genome, such as the human genome;
Read mappers work similarly to read aligners but try to identify splice junctions;
Differential expression programs assemble reads and estimate their abundance for
further analysis;
Visualizers take input from differential expression analysis and present commonly used
visualizations.
There are some publically available genome browsers2 online that allow us to visualize and
retrieve genomic information from a number of species. Some of the most well-known projects
are:
The Ensembl genome database project3;
The UCSC (University of California Santa Cruz) genome browser4.
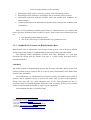
2.2.1 Standard File Formats for Bioinformatics Data
Many formats exist to represent the various stages of this process. One of the most common
formats is the SAM (Sequence Alignment/Map) format and its binary equivalent, BAM.
The following format descriptions are taken from either Wikipedia5 or a web page
describing the format from the format's web page or a public format description from a
renowned institution.
SAM/BAM
The SAM6 (Sequence Alignment/Map) format7 and its binary equivalent, BAM, are the most
common formats used for sequence data. It is used by many bioinformatics tools. Both format
store the same information.
The SAM format is a TAB-delimited text format consisting of a header section, which is
optional, and an alignment section. If present, the header must be prior to the alignments.
Header lines start with "@", while alignment lines do not. Each alignment line has 11
mandatory fields for essential alignment information such as mapping position, and a variable
number of optional fields for flexible or aligner specific information.
Each alignment line has 11 mandatory fields:
2
List of genome browsers - http://en.wikipedia.org/wiki/Genome_browser
Ensembl - http://www.ensembl.org/
4
UCSC Genome Browser - http://genome.ucsc.edu/
5
Wikipedia is a free encyclopaedia - http://en.wikipedia.org
6
SAMtools - http://samtools.sourceforge.net/
7
SAM format - http://samtools.sourceforge.net/SAMv1.pdf
3
7
Basic Concepts and Survey on Technology
1. QNAME – Query template name. Reads/segments having identical QNAME are
regarded as coming from the same template. A QNAME "*" indicates the information
is unavailable;
2. FLAG – Reference sequence NAME of the alignment. See the full specification for a
detailed description;
3. RNAME – Reference sequence NAME of the alignment. If @SQ header lines are
present, RNAME (if not "*") must be present in one of the SQ-SN tag. An unmapped
segment without coordinate has a "*" at this field. However, an unmapped segment
may also have an ordinary coordinate such that it can be placed at a desired position
after sorting. If RNAME is "*", no assumptions can be made about POS and CIGAR;
4. POS – 1-based leftmost mapping position of the first matching base. The first base in a
reference sequence has coordinate 1. POS is set as 0 for an unmapped read without
coordinate. If POS is 0, no assumptions can be made about RNAME and CIGAR;
5. MAPQ – Mapping quality. It equals
8,
rounded to the nearest integer. A
value 255 indicates that the mapping quality is not available;
6. CIGAR – CIGAR string. The CIGAR operations are given in the following table (set
"*" if not available).
Op BAM Description
M 0
Alignment match (can be a sequence match or mismatch)
I
1
Insertion to the reference
D
2
Deletion from the reference
N
3
Skipped region from the reference
S
4
Soft clipping (clipped sequences present in SEQ)
H
5
Hard clipping (clipped sequences NOT present in SEQ)
P
6
Padding (silent deletion from padded reference)
=
7
Sequence match
X
8
Sequence mismatch
7. RNEXT – Reference sequence name of the primary alignment of the next read in the
template. For the last read, the next read is the first read in the template. If @SQ
header lines are present, RNEXT (if not "*" or "=") must be present in one of the SQSN tag. This field is set as "*" when the information is unavailable, and set as "=" if
RNEXT is identical RNAME. If not "=" and the next read in the template has one
primary mapping (see also bit 0x100 in FLAG), this field is identical to RNAME at the
primary line of the next read. If RNEXT is "*", no assumptions can be made on
PNEXT and bit 0x20;
8. PNEXT – Position of the primary alignment of the NEXT read in the template. Set as
0 when the information is unavailable. This field equals POS at the primary line of the
next read. If PNEXT is 0, no assumptions can be made on RNEXT and bit 0x20;
8
Phred quality score - http://en.wikipedia.org/wiki/Phred_quality_score
8
Basic Concepts and Survey on Technology
9. TLEN – signed observed Template length. If all segments are mapped to the same
reference, the unsigned observed template length equals the number of bases from the
leftmost mapped base to the rightmost mapped base. The leftmost segment has a plus
sign and the rightmost has a minus sign. The sign of segments in the middle is
undefined. It is set as 0 for single-segment template or when the information is
unavailable;
10. SEQ – Segment sequence. This field can be a "*" when the sequence is not stored. If
not a "*", the length of the sequence must equal the sum of lengths of M/I/S/=/X
operations in CIGAR. An "=" denotes the base is identical to the reference base. No
assumptions can be made on the letter cases;
11. QUAL – ASCII of base quality plus 33 (same as the quality string in the Sanger
FASTQ format). A base quality is the phred-scaled base error probability which equals
. This field can be a "*" when quality is not stored. If not a "*", SEQ
must not be a "*" and the length of the quality string ought to equal the length of SEQ.
@HD VN:1.5 SO:coordinate
@SQ SN:ref LN:45
r001 163 ref 7 30 8M2I4M1D3M
r002
0 ref 9 30 3S6M1P1I4M
r003
0 ref 9 30 5S6M
r004
0 ref 16 30 6M14N5M
r003 2064 ref 29 17 6H5M
r001
83 ref 37 30 9M
=
*
*
*
*
=
37 39
0
0
0
0
0
0
0
0
7 -39
TTAGATAAAGGATACTG
AAAAGATAAGGATA
GCCTAAGCTAA
ATAGCTTCAGC
TAGGC
CAGCGGCAT
*
*
* SA:Z:ref,29,-,6H5M,17,0;
*
* SA:Z:ref,9,+,5S6M,30,1;
* NM:i:1
Figure 2.3: SAM file example with tabs replaced with spaces for readability.
The SAM/BAM format (as seen in Figure 2.3) is a bit complex and is not fully explained
in this document. For a more detailed description, see the format's specification9.
GTF
GTF10 (Gene Transfer Format) is a file format used to hold information about a gene and is the
output format of differential expression software such as Cufflinks. It is an extension of the
GFF11 (General Feature Format) which has 9 tab-separated required fields but with the last field
different, as seen in Figure 2.5.
1. SEQNAME – The name of the sequence. Must be a chromosome or scaffold;
2. SOURCE – The program that generated this feature;
3. FEATURE – The name of this type of feature. Some examples of standard feature
types are "CDS", "start_codon", "stop_codon", and "exon";
9
SAM format - http://samtools.sourceforge.net/SAMv1.pdf
GTF format - http://www.genome.ucsc.edu/FAQ/FAQformat.html#format4
11
GFF format - http://www.genome.ucsc.edu/FAQ/FAQformat.html#format3
10
9
Basic Concepts and Survey on Technology
4. START – The starting position of the feature in the sequence. The first base is
numbered 1;
5. END – The ending position of the feature (inclusive);
6. SCORE – A score between 0 and 1000. If the track line USESCORE attribute is set to
1 for this annotation data set, the score value will determine the level of grey in which
this feature is displayed (higher numbers = darker grey). If there is no score value,
enter ".". Figure 2.4 shows the Genome Browser's translation of BED score values into
shades of grey:
≤ 166
167-277
278-388
389-499
500-611
612-722
723-833
834-944
≥ 945
Figure 2.4: Range of score values and it corresponding grey colour.
7. STRAND – Valid entries include "+", "-", or "." (for don't know/don't care);
8. FRAME – If the feature is a coding exon, frame should be a number between 0-2 that
represents the reading frame of the first base. If the feature is not a coding exon, the
value should be ".";
9. ATTRIBUTE – A list of tag-value pairs, providing additional information about each
feature. Attributes must end in a semi-colon, and be separated from any following
attribute by exactly one space.
AB000381
AB000381
AB000381
AB000381
AB000381
Twinscan
Twinscan
Twinscan
Twinscan
Twinscan
CDS
CDS
CDS
start_codon
stop_codon
380
501
700
380
708
401
650
707
382
710
.
.
.
.
.
+
+
+
+
+
0
2
2
0
0
gene_id
gene_id
gene_id
gene_id
gene_id
"001";
"001";
"001";
"001";
"001";
transcript_id
transcript_id
transcript_id
transcript_id
transcript_id
"001.1";
"001.1";
"001.1";
"001.1";
"001.1";
Figure 2.5: GTF file example with tabs replaced with spaces for readability.
BED
BED12 is a file format used to hold sequence annotations. It has 3 mandatory fields and 9
optional ones, as seen in Figure 2.7. The order of the optional fields must be preserved where
previous fields are not left empty. This format is sometimes called BED6 or BED12 depending
on the number of fields it has.
The first three required BED fields are:
1. CHROM – The name of the chromosome (e.g. chr3, chrY, chr2_random) or scaffold
(e.g. scaffold10671);
2. CHROMSTART – The starting position of the feature in the chromosome or scaffold.
The first base in a chromosome is numbered 0;
12
BED format - http://www.genome.ucsc.edu/FAQ/FAQformat.html#format1
10
Basic Concepts and Survey on Technology
3. CHROMEND – The ending position of the feature in the chromosome or scaffold.
The CHROMEND base is not included in the display of the feature. For example, the
first
100
bases
of
a
chromosome
are
defined
as
CHROMSTART=0,
CHROMEND=100, and span the bases numbered 0-99.
The 9 additional optional BED fields are:
4. NAME – Defines the name of the BED line. This label is displayed to the left of the
BED line in the Genome Browser window when the track is open to full display mode
or directly to the left of the item in pack mode;
5. SCORE – A score between 0 and 1000. If the track line useScore attribute is set to 1
for this annotation data set, the score value will determine the level of grey in which
this feature is displayed (higher numbers = darker grey). Figure 2.6 shows the Genome
Browser's translation of BED score values into shades of grey:
≤ 166
167-277
278-388
389-499
500-611
612-722
723-833
834-944
≥ 945
Figure 2.6: Range of score values and it corresponding grey colour.
6. STRAND – Defines the strand - either "+" or "-";
7. THICKSTART – The starting position at which the feature is drawn thickly (for
example, the start codon in gene displays);
8. THICKEND – The ending position at which the feature is drawn thickly (for example,
the stop codon in gene displays);
9. ITEMRGB – An RGB value of the form RGB (e.g. 255,0,0). If the track line
ITEMRGB attribute is set to "On", this RBG value will determine the display colour of
the data contained in this BED line. NOTE: It is recommended that a simple colour
scheme (eight colours or less) be used with this attribute to avoid overwhelming the
colour resources of the Genome Browser and your Internet browser;
10. BLOCKCOUNT – The number of blocks (exons) in the BED line;
11. BLOCKSIZES – A comma-separated list of the block sizes. The number of items in
this list should correspond to BLOCKCOUNT;
12. BLOCKSTARTS – A comma-separated list of block starts. All of the
BLOCKSTART positions should be calculated relative to CHROMSTART. The
number of items in this list should correspond to BLOCKCOUNT.
Track definition lines can be used to configure the display further, e.g. by grouping
features into separate tracks. Track lines should be placed at the beginning of the list of features
they are to affect.
The track line consists of the word "track" followed by space-separated key=value pairs see the example below. Valid parameters used by Ensembl are:
11
Basic Concepts and Survey on Technology
1. NAME – unique name to identify this track when parsing the file;
2. DESCRIPTION – Label to be displayed under the track in Region in Detail;
3. PRIORITY – integer defining the order in which to display tracks, if multiple tracks
are defined;
4. USESCORE – a value from 1 to 4, which determines how scored data will be
displayed. Additional parameters may be needed, as described below:
Tiling array;
Colour gradient – defaults to Yellow-Green-Blue, with 20 colour grades.
Optionally you can specify the colours for the gradient (cgColour1, cgColour2,
cgColour3) as either RGB, hex or X11 colour names, and the number of
colour grades (cgGrades);
Histogram;
Wiggle plot.
5. ITEMRGB – if set to "on" (case-insensitive), the individual RGB values defined in
tracks will be used.
track name="pairedReads" description="Clone Paired Reads" useScore=1
chr22 1000 5000 cloneA 960 + 1000 5000 0 2 567,488, 0,3512
chr22 2000 6000 cloneB 900 - 2000 6000 0 2 433,399, 0,3601
Figure 2.7: BED file example with tabs replaced with spaces for readability.
FASTA
FASTA13 is a text based file format used to hold nucleotide or amino acid sequences which are
represented using single-letter codes.
A sequence in FASTA format begins with a single-line description, followed by lines of
sequence data, as seen in Figure 2.8. The definition line (defline) is distinguished from the
sequence data by a greater-than (>) symbol at the beginning. The word following the ">"
symbol is the identifier of the sequence, and the rest of the line is the description (optional).
Normally, identifiers are simply protein accession, name or Entrez gi's (e.g., Q5I7T1,
AG10B_HUMAN, 129295), but a bar-separated NCBI sequence identifier (e.g., gi|129295) will
also be accepted. Any arbitrary user-specified sequence identifier can also be used (e.g.,
CLONE00073452) but you are advised to use sufficiently long unique words in such case.
There should be no space between the ">" and the first letter of the identifier. It is recommended
that all lines of text be shorter than 80 characters in length.
13
FASTA format - http://genetics.bwh.harvard.edu/pph/FASTA.html
12
Basic Concepts and Survey on Technology
>gi|129295|sp|P01013|OVAX_CHICK GENE X PROTEIN (OVALBUMIN-RELATED)
QIKDLLVSSSTDLDTTLVLVNAIYFKGMWKTAFNAEDTREMPFHVTKQESKPVQMMCMNNSFNVATLPAE
KMKILELPFASGDLSMLVLLPDEVSDLERIEKTINFEKLTEWTNPNTMEKRRVKVYLPQMKIEEKYNLTS
VLMALGMTDLFIPSANLTGISSAESLKISQAVHGAFMELSEDGIEMAGSTGVIEDIKHSPESEQFRADHP
FLFLIKHNPTNTIVYFGRYWSP
Figure 2.8: FASTA file example.
2.2.2 Genomic Assemblage Software
Here we present the tools that are being considered for each phase. Descriptions are taken from
their respective web pages.
Cufflinks
Cufflinks14 (Trapnell et al. 2010), (Roberts, Trapnell, et al. 2011), (Roberts, Pimentel, et al.
2011), (Trapnell et al. 2013) assembles transcripts, estimates their abundances, and tests for
differential expression and regulation in RNA-Seq samples. It accepts aligned RNA-Seq reads
and assembles the alignments into a parsimonious set of transcripts. Cufflinks then estimates the
relative abundances of these transcripts based on how many reads support each one, taking into
account biases in library preparation protocols.
TopHat
TopHat15 (Trapnell, Pachter, and Salzberg 2009), (Langmead, Trapnell, et al. 2009), (Kim and
Salzberg 2011), (Kim et al. 2013) is a fast splice junction mapper for RNA-Seq reads. It aligns
RNA-Seq reads to mammalian-sized genomes using the ultra-high-throughput short read aligner
Bowtie, and then analyses the mapping results to identify splice junctions between exons.
Bowtie
Bowtie16 (Langmead, Trapnell, et al. 2009), (Langmead, Schatz, et al. 2009), (Trapnell, Pachter,
and Salzberg 2009) is an ultra-fast, memory-efficient short read aligner. It aligns short DNA
sequences (reads) to the human genome at a rate of over 25 million 35-bp reads per hour.
Bowtie indexes the genome with a Burrows-Wheeler index to keep its memory footprint small:
typically about 2.2 GB for the human genome (2.9 GB for paired-end). A more recent version
named Bowtie 217 (Langmead and Salzberg 2012), (Langmead, Trapnell, et al. 2009) exists.
14
Cufflinks - http://cufflinks.cbcb.umd.edu/
TopHat - http://tophat.cbcb.umd.edu/
16
Bowtie - http://bowtie-bio.sourceforge.net
17
Bowtie 2 - http://bowtie-bio.sourceforge.net/bowtie2
15
13
Basic Concepts and Survey on Technology
Other
There are many other software packages for the various stages of the process that won't be
enumerated here because of their large number, including variations of these made to scale in
computer clusters.
On the SEQAnswers wiki18, an on-line community for next generation sequencing, there
are more than 600 software packages listed for solving one or more stages of the processes
involved in next generation sequencing.
2.2.3 Databases
The ENCODE project19 aims to identify all functional elements in the human genome sequence.
There are several types of data referenced, including RNA-Seq data. We can obtain data aligned
to a reference genome from there.
There are various cell lines referenced in the ENCODE project that are taken from human
tissue samples and later transformed in a laboratory so that they can be replicated and
researched throughout various laboratories around the world. Some of these cell lines are
derived from cancer tissues. You can find more information about the different cell lines on the
project’s page20.
This is the description from the two samples we will use taken from the project’s page:
K562 and GM12878.
“K562 is an immortalized cell line produced from a female patient with chronic
myelogenous leukemia (CML). It is a widely used model for cell biology, biochemistry, and
erythropoiesis.”
“GM12878 is a lymphoblastoid cell line produced from the blood of a female donor with
northern and western European ancestry by EBV transformation.”
The mapped data can be obtained from here:
http://genome.crg.es/encode_RNA_dashboard/hg19/
18
SEQAnswers wiki - http://seqanswers.com/wiki/
The ENCODE project - http://www.genome.gov/10005107
20
The ENCODE project common cell types - http://www.genome.gov/26524238
19
14
Basic Concepts and Survey on Technology
2.3 Data Mining
Here we present the algorithms that are being considered for the data analysis phase and
software packages that can be used to apply them. Descriptions are taken from Wikipedia21
and/or their web pages for the tools.
2.3.1 Data Analysis Algorithms
Decision Trees
A decision tree is a flowchart-like structure in which internal node represents test on an
attribute, each branch represents outcome of test and each leaf node represents class label
(decision taken after computing all attributes). A path from root to leaf represents classification
rules.
Rule Induction Algorithms
Rule induction algorithms are an area of machine learning in which formal rules are extracted
from a set of observations. The rules extracted may represent a full scientific model of the data,
or merely represent local patterns in the data.
Many branches of machine learning apply this technique, namely inductive logic
programming.
Support Vector Machines
Support vector machines (SVMs), also known as support vector networks, are supervised
learning models with associated learning algorithms that analyse data and recognize patterns,
used for classification and regression analysis. Given a set of training examples, each marked as
belonging to one of two categories in the case of classification, an SVM training algorithm
builds a model that assigns new examples into one category or the other, making it a nonprobabilistic binary linear classifier. An SVM model is a representation of the examples as
points in space, mapped so that the examples of the separate categories are divided by a clear
gap that is as wide as possible. New examples are then mapped into that same space and
predicted to belong to a category based on which side of the gap they fall on.
In addition to performing linear classification, SVMs can efficiently perform a non-linear
classification using what is called the kernel trick, implicitly mapping their inputs into highdimensional feature spaces.
21
Wikipedia is a free encyclopaedia - http://en.wikipedia.org
15
Basic Concepts and Survey on Technology
Ensembles
In statistics and machine learning, ensemble methods use multiple models to obtain better
predictive performance than could be obtained from any of the constituent models. Unlike a
statistical ensemble in statistical mechanics, which is usually infinite, a machine learning
ensemble refers only to a concrete finite set of alternative models, but typically allows for much
more flexible structure to exist between those alternatives.
Random Forrest
Random forests are an ensemble learning method for classification (and regression) that operate
by constructing a multitude of decision trees at training time and outputting the class that is the
mode of the classes output by individual trees.
K-NN
K-Nearest neighbours’ algorithm (or k-NN for short) is a non-parametric method used for
classification and regression. In both cases, the input consists of the k closest training examples
in the feature space. The output depends on whether k-NN is used for classification or
regression.
Inductive Logic Programming
Inductive logic programming (ILP) is a sub field of machine learning which uses logic
programming as a uniform representation for examples, background knowledge and hypotheses.
Given an encoding of the known background knowledge and a set of examples represented as a
logical database of facts, an ILP system will derive a hypothesised logic program which entails
all the positive and none of the negative examples.
This is a good candidate to start with as it has been used in these types of problems, mainly
because of its ease of handling multi-relational data. ILP can build complex but comprehensible
models that make it easy to explain the phenomena that produced them.
2.3.2 Data Analysis Tools
Here we will describe packages used for the data analysis part. Some of these tools are used by
other tools.
CummeRbund
16
Basic Concepts and Survey on Technology
CummeRbund22 is an R package that is designed to aid and simplify the task of analysing
Cufflinks RNA-Seq output. R is program and programming language used in statistical analysis.
RapidMiner
RapidMiner23 is a software platform developed by the company of the same name that provides
an integrated environment for machine learning, data mining, text mining, predictive analytics
and business analytics. It is used for business and industrial applications as well as for research,
education, training, rapid prototyping, and application development and supports all steps of the
data mining process including results visualization, validation and optimization.
RapidMiner is developed on a business source model which means the core and earlier
versions of the software are available under an OSI-certified open source license. A Starter
Edition is available for free download; Personal, Professional and Enterprise Editions are
available.
KMINE
KNIME24, the Konstanz Information Miner, is an open source data analytics, reporting and
integration platform. KNIME integrates various components for machine learning and data
mining through its modular data pipelining concept. A graphical user interface allows assembly
of nodes for data pre-processing (ETL: Extraction, Transformation, Loading), for modelling and
data analysis and visualization.
Since 2006, KNIME has been used in pharmaceutical research, but is also used in other
areas like customer data analysis, business intelligence and financial data analysis.
WEKA
Weka25 (Waikato Environment for Knowledge Analysis) is a popular suite of machine learning
software written in Java, developed at the University of Waikato, New Zealand. Weka is free
software available under the GNU General Public License.
Orange
Orange26 is a component-based data mining and machine learning software suite, featuring a
visual programming front-end for explorative data analysis and visualization, and Python
22
CummeRbund - http://compbio.mit.edu/cummeRbund/
RapidMiner - http://rapidminer.com/
24
KNIME - http://www.knime.org/
25
Weka - http://www.cs.waikato.ac.nz/~ml/weka/
26
Orange - http://orange.biolab.si/
23
17
Basic Concepts and Survey on Technology
bindings and libraries for scripting. It includes a set of components for data preprocessing,
feature scoring and filtering, modelling, model evaluation, and exploration techniques. It is
implemented in C++ and Python. Its graphical user interface builds upon the cross-platform Qt
framework.
Orange is freely distributed under the GPL. It is maintained and developed at the
Bioinformatics Laboratory of the Faculty of Computer and Information Science, University of
Ljubljana, Slovenia.
R
R27 is a free software programming language and software environment for statistical computing
and graphics. The R language is widely used among statisticians and data miners for developing
statistical software and data analysis.
The Bioconductor project provides R packages for the analysis of genomic data, such as
Affymetrix and cDNA microarray object-oriented data-handling and analysis tools, and has
started to provide tools for analysis of data from next-generation high-throughput sequencing
methods.
2.4 Algorithm Evaluation Methods and Measures
In order to assess the quality of the algorithms, some techniques commonly used in algorithm
evaluation will be applied to avoid overfitting28, where the testing data and the actual data vary
enough to hinder the algorithms used.
One of these techniques consists on having two sets of data to test against; one for training
and another for verifying (train/test and cross validation29). Hold-out is one of such techniques,
where a part of the data is used for training and the remaining part for testing.
Another technique which can help is resampling30, where many permutations of data are
used to train the algorithms in order to add randomness to the training set by omitting data from
training using a series of techniques and using the omitted data to validate the algorithm, and
then re-training with the same data but switching the testing data with a part of the training data
until all data is used in both training and testing.
An associated error rate will be used to assure the result, in order to cope with the inherent
errors that such an enormous amount of data can have. One of these metrics is named F-
27
R - http://www.r-project.org/
Overfitting - http://en.wikipedia.org/wiki/Overfitting
29
Cross Validation - http://en.wikipedia.org/wiki/Cross-validation_(statistics)
30
Resampling - http://en.wikipedia.org/wiki/Resampling_(statistics)
28
18
Basic Concepts and Survey on Technology
measure31, which takes into account both the precision and the recall of the test to compute the
final score.
2.5 Web Services
Web services are a technology that works over computer networks by providing a means of
communication between machines using a communication interface that is understood by all
machines. This is usually implemented on top of HTTP32 (Hypertext transfer protocol) protocol
used to access the internet from a web browser in conjunction with other web standards and
formats.
The usefulness of web services is that they sit on top of well-established and standard
protocols that are widely available on nearly all computer systems and thus can have a broader
reach. The HTTP protocol works by requesting an operation pointed at a hyperlink that will in
turn reply with an appropriate response. For example, when we navigate on a web browser to
Google's search engine hyperlink (http://www.google.com), we are performing the GET request
method on that hyperlink and will get Google's initial web page as a response. There are other
request methods we can specify that allow us to perform more operations. These standards are
referred to as web APIs (application programming interfaces).
Many standards exist that sit on top of these technologies. They vary in the way that the
web service's API is specified and used and in which format the messages should be transferred.
The two most widely used formats to transmit structured documents or data objects over the
internet are JSON33 and XML34.
Another big advantage of having web services sit on top of HTTP is that the same API can
be used by both web browsers and programs that consume that API. If the web service detects
that a web browser is making the request, it can return an HTML document to display in the
browser. If the web service detects that a consumer application is making the request, it can
return a simpler response with the data in one of the named document formats to be processed
by the application in its own way.
Detecting which client is accessing the API can be done either by analysing the HTTP user
agent (a header in the protocol that identifies the browser or HTTP library being used), or by
having the programs that consumes that API specify that they do not want a visual response in
HTML but a JSON or XML response to process in their own way. This can be done in a number
of ways and varies depending on the standard used.
31
F-measure - http://en.wikipedia.org/wiki/F-measure
HTTP protocol - http://en.wikipedia.org/wiki/HTTP
33
JSON - http://en.wikipedia.org/wiki/JSON
34
XML - http://en.wikipedia.org/wiki/XML
32
19
Basic Concepts and Survey on Technology
2.5.1 Representational State Transfer
One of such web service (or web API) standards is representational state transfer35 (REST). It
differs from other web service standards by being simpler and relying on a small subset of the
HTTP protocol. It is also not a protocol definition but an architectural style of achieving
common operations. This means we are not forced to implement the web service in a specified
way but have the liberty to deviate from the reference style to accommodate our solution. The
REST protocol works based on these simple aspects:
A base URL, such as http://www.example.com/resource/;
Standard HTTP methods (usually GET, PUT, POST and DELETE);
Here are two examples (Tables 2.1 and 2.2) of how the management of users can look like
using REST:
URL
GET
PUT
POST
DELETE
http://www.example.com/users/
Gets a list with all the users.
Not usually used.
Adds a new user to the collection.
Deletes all users.
Table 2.1: REST operations for user collection.
URL
GET
PUT
POST
DELETE
http://www.example.com/user/Item1
Gets the user that corresponds to Item1.
Updates the user's attributes.
Not usually used.
Deletes this user.
Table 2.2: REST operations for user item.
Because REST is an architectural style, we are not forced to implement these specific
operations using these HTTP methods. One common modification is to use POST for both
adding elements and editing them. Distinction between both operations is then done by
appending /edit to the end of the URL. This is not a specification but a common usage style.
These modifications have many reasons to be, namely firewall restrictions or web browser
incompatibilities.
35
Representational state transfer - http://en.wikipedia.org/wiki/Representational_state_transfer
20
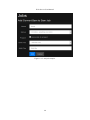
Basic Concepts and Survey on Technology
2.5.2 Web Frameworks
Many web frameworks support writing RESTful web APIs. Because many of the described
steps are common and repetitive, they abstract away the burden of implementing REST from
scratch using only an HTTP framework and provide much functionality that eases the
development of these APIs. Some of these common functionalities are:
Routing – Allows the specification of the URL and which method should be executed
for each request. It takes care of figuring out which route will handle which request;
Model binding – Allows sending of data in an easy way as a response to a request;
View engines – Allows the usage of view engines that make it easier to create dynamic
web pages;
Localization – Makes it easy to have web pages translated into multiple languages
without having to modify a lot of files in the process;
Testing – Provides mechanisms to test REST routes to make sure they are working
properly;
Content negotiation – Allows the client to negotiate what type of content it wants in an
easy way. Whether it is an HTML page or a JSON/XML response.
Many web frameworks provide mechanisms to deal with these issues and other common
36
ones . For the solution we are developing, Routing, model binding, content negotiation and
view engine support are the most important ones.
2.6 Job Scheduling
Since most bioinformatics applications are command-line based and abide by the Unix
philosophy of having programs chained together to produce a final result from a set of inputs,
the web service that will manage the data analysis will be a job scheduling37 application where
jobs are created by the user to perform a specific task and ran in a worker bot that will be idle
until a task is given to it.
Because job scheduling is a problem that has been addressed many times before, there are
already many solutions available. There are also some solutions made specifically for
bioinformatics.
Sequence Manipulation Suite
36
37
List of web application frameworks - http://en.wikipedia.org/wiki/Comparison_of_web_application_frameworks
Job Scheduling - http://en.wikipedia.org/wiki/Job_scheduler
21
Basic Concepts and Survey on Technology
Sequence Manipulation Suite is a collection of JavaScript programs for generating, formatting,
and analysing short DNA and protein sequences. It is commonly used by molecular biologists,
for teaching, and for program and algorithm testing.
This suite does not offer user management or a workspace for each user.
EMBOSS
EMBOSS38 is "The European Molecular Biology Open Software Suite". EMBOSS is a free
Open Source software analysis package specially developed for the needs of the molecular
biology (e.g. EMBnet) user community. The software automatically copes with data in a variety
of formats and even allows transparent retrieval of sequence data from the web. Also, as
extensive libraries are provided with the package, it is a platform to allow other scientists to
develop and release software in true open source spirit. EMBOSS also integrates a range of
currently available packages and tools for sequence analysis into a seamless whole. EMBOSS
breaks the historical trend towards commercial software packages.
Because EMBOSS is a collection of tools for the most common bioinformatics operations,
there are a few web interfaces that use it39 and provide user account management and a
workspace per user.
There are also some workflows40 or pipelines that use EMBOSS and work similar to job
schedulers as they allow job management and distributed computing.
Other
There are many other job scheduling solutions41 that offer many features common to these types
of problems like:
Script storage where missing scripts are automatically transferred to the target system;
Event driven where jobs are ran when a worker bot is available;
Agents where host systems install a program that connects to the central job server;
Multi-platform;
Stdout/Stderr transfer;
File events where a job is started when a file is created;
File transfer to transfer files from/to the server;
Authentication and role-based security;
User interfaces.
38
EMBOSS - http://emboss.sourceforge.net/
EMBOSS interfaces - http://emboss.sourceforge.net/interfaces/
40
EMBOSS workflows - http://emboss.sourceforge.net/interfaces/#workflows
41
Job scheduling solutions - http://en.wikipedia.org/wiki/List_of_job_scheduler_software
39
22
Basic Concepts and Survey on Technology
2.7 Chapter Conclusions
In this chapter we outlined some of the tools and algorithms we will use to perform our work.
Some of the algorithms are best suited for large amounts of data while others are not.
The biological analysis tools are not thoroughly mentioned since they will not all be used
and the ones mentioned are most likely to be chosen as they are usually paired together.
Because the focus will be on the computational platform, the tools are not that important.
One advantage of using the tools mentioned is that they were made to work well with each
other and were partially developed by the same people.
Regarding the algorithms tools, they themselves pose challenges related to data integration.
The algorithms themselves can have different behaviour depending on the size of the
training sets and the amount of data to analyse.
23
Chapter 3
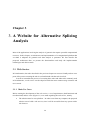
3. A Website for Alternative Splicing
Analysis
Most of the applications involving the analysis of genomic data require powerful computational
resources. In this chapter, an architecture and implementation of a computational platform that
we think is adequate for genomic-scale data analysis is presented. We first describe the
proposed architecture then we present the functionalities and lastly the implementation
technologies and choices made.
3.1 Web Service
In bioinformatics, the tasks described in the previous chapter are not user friendly and are error
prone if the person executing the task is not familiarized with the tools involved.
In order to streamline the process of executing these tasks and other tasks commonly used
in bioinformatics, a web service was developed to tackle the most common usage scenarios and
user’s needs.
3.1.1 Main Use Cases
Before starting the development of the web service, a set of requirements (both functional and
non-functional) and use cases (Figure 3.1) were made regarding the web service, namely:
The solution must be cross platform – In order to run from any computer, the proposed
solution was to build a web service, since it will be accessible from any system with a
web browser.
24
A Website for Alternative Splicing Analysis
The solution must be user friendly – Since the target audience is not tech-savvy, the
solution should be simple to use and hide the inherent complexity in the underlying
process.
The solution must work well with tablets – In today’s world, many of the interactions
with the internet are made from touch screens, whether phones or tablets. Therefore, it
is necessary to have the solution work well with touch centric devices by avoiding
certain user interface choices such as small buttons and relying on the mouse to
perform specific tasks (such as mouse hover tooltips42).
The solution must have the notion of users and authentication – It should not be
possible to access any of the web service’s functionality without authenticating first
with the system. New user accounts should also be validated by an administrator
account before being allowed to access the system.
The solution must allow the creation of projects – A project is a mere description of an
experiment where a user can try new things and have its own personal areas to work
in.
The solution must allow the creation of jobs – A job is a background task that is to be
executed by the solution and have its output saved for later use.
The solution must be able to run jobs in a different computer – In order to have a job
run in a more powerful computer or have more than one computer available to run
jobs, the solution should be able to send jobs to another computer and have the results
sent back when done.
The solution must be able to download files – A user should be able to download files
produced by the solution.
The solution must allow file descriptions – A user should be able to add a description
to a file describing it in more detail.
The solution must enforce edit restrictions – A user should not be able to alter or delete
another user’s artefacts unless he is an administrator.
The solution must use open source technologies – The solution should not use
technologies with restrictive licenses that prevent usage in commercial applications or
require the purchase of a license to use.
42
Mouse hover - http://en.wikipedia.org/wiki/Mouseover
25
A Website for Alternative Splicing Analysis
Web Service
Create User Account
Manage Files
Guest
User
Manage Jobs
«extends»
«extends»
Manage Projects
Manage Clusters
«extends»
Validate New User
Accounts
Administrator
Manage Users
Figure 3.1: Web service use cases.
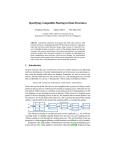
3.2 Architecture
The web service’s high level architecture consists of a server that manages the logic and a
number of worker bots (Clusters) that are idle and ping the web service for pending jobs, as
seen in Figure 3.2. Worker bots download all necessary files from the server before running a
job and then upload back the results. This allows the service to have many worker bots
executing tasks asynchronously.
26
A Website for Alternative Splicing Analysis
GetPending()
Cluster 1
GetPending()
Web service
User 1
Cluster 2
User 2
Figure 3.2: Web service architecture.
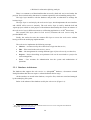
Internally, the web service is split into the following projects (Figure 3.3):
WebService – contains the web service web logic including views and JavaScript.
Uses the logic layer to access the database;
WebService.Common – Contains common code between all projects such as settings
code;
WebService.Common.Logic – contains the code to interface with the database;
WebService.Common.WS – contains the code to interface with the web service via
the REST API;
WebService.Self – program that creates a self-hosting web service instance;
WebService.Aspnet - program that creates a web service instance hosted under
Microsoft's Internet Information Services43 (IIS);
WebService.WorkerBot – program that uses the WS layer to access the web service.
WebService.WorkerBot
WebService.Self
WebService.Aspnet
WebService.Common.WS
WebService
WebService.Common.Logic
WebService.Common
Figure 3.3: Web service project layers.
43
Internet Information Services
27
A Website for Alternative Splicing Analysis
There is a common set of functionalities that are used by both web service and worker bot
projects. These include utility functions for common operations such as handling settings files.
The logic layer interfaces with the database and provides an abstraction to manage the
business logic.
The logic layer is used only by the web service layer, which implements the user interface
and a REST API to access it remotely. The web service layer is used by both the Self and
Aspnet projects which are stub projects with minimum functionality that create an instance of
the web service layer in different contexts (a self-hosting application or an IIS44 hosted one).
The common WS layer (short for web service) consumes the web service using the
provided REST API.
Finally, the worker bot uses the common WS layer to access the web service without
having to know the underlying implementation.
The web service implements the following concepts:
Clusters – Accounts used by the worker bots to login into the service;
Files – Files stored in the web service’s server;
Jobs – Job management for creating different types of jobs to be run by a worker bot;
Projects – Project describing an experiment. Jobs can be associated to a project for
easier management;
Users – User accounts for authentication into the system and authorization of
operations.
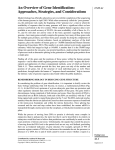
3.2.1 Database Architecture
The database that supports the web service is a MongoDB45 database, a document oriented
NoSQL database that does not require a schema definition before usage.
All the artefacts are stored in the database, except for files, which are stored and managed
by the underlying file system.
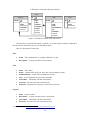
Below is the schema of the database used by the web service (Figure 3.4):
44
45
IIS – Internet Information Services, a set of Internet-based services for servers using Microsoft Windows.
MongoDB - http://www.mongodb.org/
28
A Website for Alternative Splicing Analysis
Users
Projects
PK
PK,FK1 _id
PK,FK2 _id
login
name
passhash
createdate
isadmin
iscluster
pending
name
description
createdate
ownerid
Files
Jobs
_id
PK
name
status
commandname
args
createdate
ownerid
projectid
_id
name
description
Figure 3.4: Database schema of the web service.
All tables have a generated id named _id which is a 24 char unique identifier composed of
the current time, machine id, process id and random data46.
Here is a description of each field:
Files
Name – File’s path that acts as a unique identifier for a file;
Description – A string with the file’s description.
Name – Job’s name;
Status – Current status of the job. New jobs can be pending or ready;
CommandName – Name of the command to execute;
Args – List of arguments to pass to the command;
CreateDate – Timestamp with the creation date;
OwnerId – Id of the user who created the job;
ProjectId – Optional id of a project to associate the job with.
Jobs
Projects
46
Name – Project’s name;
Description – A string with the project’s description;
CreateDate – Timestamp with the creation date;
OwnerId – Id of the user who created the project.
MongoDB ObjectId - http://docs.mongodb.org/manual/reference/object-id/
29
A Website for Alternative Splicing Analysis
Users
Login – string used to uniquely identify a user and sign in into the web service;
Name – User’s name;
PassHash – User’s password in hashed form;
CreateDate – Timestamp with the creation date;
IsAdmin – Boolean value indicating whether the user is an administrator or not;
IsCluster – Boolean value indicating whether the user is a cluster account or not;
Pending – Optional boolean value indicating whether the user account is pending
validation by an administrator account.
MongoDB allows the creation of arrays as values of a field. This is used in the job’s args
field to store a variable length array of strings that are used as arguments for the job’s
command.
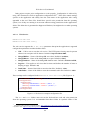
3.2.2 Web Service Architecture
The web service requires an account to be able to create new jobs. Most operations require
authentication before being used. A menu bar is shown at the top of the page with access to the
various functionalities, as seen in Figure 3.5.
Figure 3.5: Web service initial menu.
30
A Website for Alternative Splicing Analysis
A user can create an account from the web service. An admin account must approve new
user accounts before these can be used, for security reasons. Administrator accounts must be
created manually for security reasons by a person with direct access to the database.
Cluster accounts are a special kind of account used by worker bots to ping the service for
pending jobs. We can have more than one worker bot account configured to execute more jobs
asynchronously.
Jobs are defined by a name and a command to execute with a list of parameters whose
meaning varies depending on the job. For a download job, the parameters are the download
URL and an optional new file name.
Currently there are these types of job:
Bam2Sam – Converts a BAM file to the SAM format, as seen in Figure 3.6;
Download – Downloads a file to a folder from an URL;
InterProScan – Uses the InterProScan47 sequence search web service to scan FASTA
files for known proteins;
Orf Find – Runs an ORF finder job using a FASTA file as input and outputs an ORF
file;
Sam2Bam – Converts a SAM file to the BAM format;
Sam2Fasta – Converts a SAM file to the FASTA format.
Figure 3.6: BAM to SAM conversion job example.
47
InterProScan web service - http://www.ebi.ac.uk/Tools/webservices/services/pfa/iprscan5_soap
31
A Website for Alternative Splicing Analysis
The worker bot checks the command name and constructs the command to execute and
takes care of downloading the necessary files from the server and uploading the newly created
files to the server. A job can have an associated project, in which case the projects associated
files can be used as input and the output is saved in the project’s folder.
Because of the generic nature of the job not having specific information such as the
command-line to execute, but the action to perform and the list of parameters, a worker bot can
execute the job using whatever tools there are on the platform and correct and improve the
command pipeline to execute for each action without needing to alter the job. For instance, to
execute a conversion job, we can use one program and later on change that program to a
different version as long as the job's parameters are used in the same way. This is useful when
upgrading the pipeline with a different program to test performance or accuracy, as a worker bot
can use a newer version than another bot.
Once a job is completed, the program’s stdout and stderr output are saved and
synchronized with the service so the user can see their output (if any).
The worker bots poll the web service every 10 seconds for a pending job. We can monitor
the status of the worker bots by viewing the clusters page and see the last polling time.
Projects exist to allow the user to describe the project and the files associated with it.
Projects have a description which uses markdown48 (Figure 3.7) as a text description to allow
for richer descriptions.
Project Title
=======
Project Title
Introduction
----------Paragraphs are separated by a blank line.
1.1 Introduction
Text attributes *italic*, **bold**,
`monospace`.
Paragraphs are separated by a blank line.
A [link](http://example.com).
Text attributes italic, bold, monospace.
Testing files:
A link.
Testing files:
* genome.reference.gtf
* testing.set.bam
genome.reference.gtf
testing.set.bam
Figure 3.7: Markdown example.
48
Markdown - http://en.wikipedia.org/wiki/Markdown
32
A Website for Alternative Splicing Analysis
File management is done using the files browser where a user can browse public files and
project’s specific files, as seen in Figure 3.8. He can also delete files and add descriptions to
them to better know what they are and where they came from.
Figure 3.8: File browser.
The web service and the worker bot can be configured using App.config files located in the
program’s folders. These can be used to configure server name, port, and the location of the data
folders.
Before running the web service and the worker bot, these must be configured with valid
paths to a folder to store the data files and a folder for the stdio files. Default folder names are
used in case these are not set.
The web service is written in C# using the Nancy49 web framework, a lightweight web
framework designed to be simple, modular and easy to extend where a user can choose which
functionalities to use. Authentication is provided by Nancy’s forms authentication module. The
view engine used to process the HTML pages is the Razor view engine50.
On the client side, Twitter Bootstrap51 is used as a front-end framework for creating
common interface components such as forms, buttons and lists. This allows us to focus on the
business logic. Bootstrap takes advantage of the various screen resolutions to rearrange content
based on screen size. Bootstrap allows us to change the appearance simply by modifying the
default cascading style sheet (CSS) file. The default template is a modified version of the
cyborg52 theme.
JQuery is used for common user interface tasks on the client side.
The worker bot uses the RestSharp53 REST API to communicate with the web service.
All dependencies are managed using NuGet54, the package manager used by .NET.
The web service was tested in both Windows and Linux machines (using Mono55 - an open
source implementation of .NET).
49
Nancy web framework - http://nancyfx.org/
Razor view engine - http://razorengine.codeplex.com/
51
Twitter Bootstrap - http://getbootstrap.com/
52
Cyborg theme for bootstrap by Thomas Park - http://bootswatch.com/cyborg/
53
RestSharp - http://restsharp.org/
54
NuGet package manager - http://www.nuget.org/
50
33
A Website for Alternative Splicing Analysis
3.3 Chapter Conclusions
Due to the nature of bioinformatics tools being mostly command-line based, the web service is
designed to be a generic job scheduling56 application, where new jobs can be added to the web
service and processed by background workers. Some of the solutions named in Chapter 2 were
studied before starting the implementation but they were dismissed because they were not quite
what was required.
The .NET framework was chosen because it has many of its components available as open
source57 with a big user community and good development tools. The Nancy framework was
chosen because of its simplicity and ease of use and for allowing for a bit more freedom in
comparison to standard model-view-controller (MVC) frameworks.
Other technologies and frameworks were considered, namely node.js58 and other free
frameworks but were dismissed either because of their poorer development tools or because of
difficulties achieving true cross platform targeting because of OS specific modules in these
frameworks.
The same binary file is used to run on both Windows and Linux machines without
modifications.
MongoDB is used as a database because the application does not require the full power of
a SQL database and because it is simpler to model the database as we do not need to explicitly
define a data schema. It also allows us to store variable arrays more easily in comparison to a
relational database, as it is the case with a job’s parameter list.
File management uses the file system for storing files. This allows us to use the underlying
operating system’s file API to manage files.
The worker bot transfers files from and to the web service’s server. This adds overhead to
the process but allows for more flexibility as web can have the server running on a standard
computer but the worker bot running on a faster machine.
Because worker bots have their own accounts, we can have multiple worker bots executing
pending jobs in parallel by having several worker bots configured and thus have a more scalable
solution. Note however that due to the transfer of files from and to the central server, this one
might become a performance bottleneck due to the network traffic involved in the file transfers
and the internal sharing of the same hard disk drive. It is therefore recommended not to use a
high number of worker bots on the same web server.
55
Mono - http://www.mono-project.com/
Job scheduler - http://en.wikipedia.org/wiki/Job_scheduler
57
.NET foundation - http://www.dotnetfoundation.org/
58
Node.js software platform - http://nodejs.org/
56
34
Chapter 4
4. Alternative
Process
Splicing
Analysis
This chapter describes the application of the developed computational platform to some of the
steps taken to analyse data for the problem of aberrant alternative splicing in cancer. The data,
as mentioned in Chapter 2, was downloaded from the ENCODE project59 that aims at the
identification of all functional elements in the human genome. The project hosts various cell
lines taken from human tissue samples and later transformed in a laboratory to be replicated and
researched throughout various laboratories around the world. The samples we use are cancer
cell lines: K562 and GM12878.
The very first step in the whole process is to download the data. When using the platform
to downloading the K562 cell line CSHL1 took 1 hour 50 minutes and 13 GB were downloaded.
For GM12878 cell line CSHL2, 1 hour and 54 minutes was required to download 15 GB of data
(the BAM file with the aligned reads).
4.1 Junctions Identification and Open Reading Frame Detection
Alternative splicing is a process where during gene expression a particular exon may be
included or excluded from the final processed messenger RNA (mRNA) from that gene. The
proteins translated from the alternative spliced mRNA will have differences in their structure, as
explained in Chapter 2. The platform was used to identify the following five basic modes of
alternative splicing:
59
The ENCODE project - http://www.genome.gov/10005107
35
Alternative Splicing Analysis Process
Exon skipping – also known as cassette exon, where the exon can be spliced out of the
transcript or retained with its flanking introns. This is the most common mode of alternative
splicing in mammals (Figure 4.1).
Exon skipping
Figure 4.1: Exon skipping alternative splicing.
Mutually exclusive exons – One of two exons is retained in mRNAs after splicing, but not both
in a mutually exclusive manner (Figure 4.2).
Mutually exclusive
exons
Figure 4.2: Mutually exclusive exons alternative splicing.
Alternative 3’ acceptor site – An alternative 3' splice junction (acceptor site) is used, changing
the 5' boundary of the downstream exon (Figure 4.3).
Alternative 3'
Figure 4.3: Alternative 3’ alternative splicing.
Alternative 5’ donor site – An alternative 5' splice junction (donor site) is used, changing the 3'
boundary of the upstream exon (Figure 4.4).
36
Alternative Splicing Analysis Process
Alternative 5'
Figure 4.4: Alternative 5’ alternative splicing.
Intron retention – An intron can remain in the mature mRNA molecule or be spliced out. This
differs from exon skipping because the retained sequence is not flanked by introns. If the
retained intron is in the coding region, the intron must encode amino acids in frame with the
neighbouring exons, or a stop codon or a shift in the reading frame will cause the protein to
become non-functional (Figure 4.5).
Intron retention
Figure 4.5: Intron retention alternative splicing.
There are two more modes of alternative splicing, although they are less frequent
(alternative first exon and alternative last exon).
One useful measure to extract is the count of each type of junction. Many programs can
achieve this. They usually require an annotation file (GTF) and a file with mapped reads
(SAM/BAM).
As explained in Chapter 2, if a genome has an error and misses it's ending frame, it will
end when it finds the next ending frame and this will generate a potentially harmful protein. As
such, we can use open reading frame (ORF) analysis to correlate which open reading frames are
more present in tissue samples with certain diseases and try to determine if those ORFs have a
greater impact in causing that disease.
4.1.1 Obtaining the Junctions Type Count
In order to get the number of gene types from a SAM/BAM file, one needs an annotation file of
the whole human genome (GTF). An up-to-date version of the human genome sequence can be
obtained from the GENCODE project web page60.
The GTF format has a field named gene_status that indicates if the gene is known or
61
new. These fields are present in both the annotation file (GTF) and the mapped read file to
analyse (BAM):
60
The GENCODE project - http://www.gencodegenes.org/
37
Alternative Splicing Analysis Process
The name of the chromosome;
The starting position of the feature in the chromosome;
The ending position of the feature in the chromosome.
In order to count the number of each type of function, we must count the gene_status
field which can be one of these values:
KNOWN – the gene is known;
NOVEL – the gene is new;
PUTATIVE – the gene is not known but it is believed to be a gene by its open reading
frame.
To achieve this, we run the following command to convert a BAM file to a BED with12
fields:
samtools view -h infile.bed | awk '{if(($6 ~ /N/)|| $1 == "@SQ")
print}'
|
samtools
view
-bS
|
bamToBed
-bed12
-i
stdin
>
outfile.bed
This command will rearrange the data in the BAM file to the BED format. It takes an
infile.bam as input and outputs an outfile.bed. After this step, a command is ran to cross
reference this file with a GTF file and count the gene status column.
This will give us a count of the known and unknown genes:
KNOWN
548118
NOVEL
1626827
PUTATIVE
1532709
Another very important step in the analysis process is the identification of open reading frames.
ORFs are the regions of the nucleotide sequence from the start codon to the stop codon. Gene
finding is usually started by searching for open reading frames.
An ORF is a sequence of DNA that starts with start codon “ATG” (not always) and ends
with any of the three termination codons (TAA, TAG, TGA). There is a task in the platform to
execute this as well.
61
GENCODE GTF format - http://www.gencodegenes.org/gencodeformat.html
38
Alternative Splicing Analysis Process
4.2 Search for Known Proteins Domains
A useful analysis that can be performed is searching for known proteins domains. The interest
of the last step relies on the possibility of this information to be quite relevant to explain
diseases. When there is an aberrant splicing, the translation of DNA into RNA might be stopped
too early which may have the consequence that the coded protein will be too short and some
very important domains of such protein will be missing. This is done using InterProScan62
(Zdobnov and Apweiler 2001), (Quevillon et al. 2005), a web service for automated sequence
analysis of proteins that can identify regions of interest, based on the InterPro consortium
member databases. This allows us to quickly detect a novel sequence with considerable
confidence.
There are two versions available: a standalone version and a web service. We use the web
service with the following command (C# version of the web service client):
IPRScan5CliClient –email [email protected] –sequence infile.fasta –
outfile outfilename
The web service version requires a valid email address and a FASTA file as input with the
nucleotide sequences to scan. This tool can be used from a BAM file by converting it to a
FASTA file using our web service.
4.3 Other
Other steps important for data analysis involve conversion between standard formats. The
following commands are used to convert between formats:
BAM to SAM (using SAMtools):
samtools view -h –o outfile.sam infile.bam
SAM to BAM (using SAMtools):
samtools view –bS infile.sam > outfile.bam
SAM to FASTA (using EMBOSS):
seqret infile.sam outfile.bam
62
InterProScan web service - http://www.ebi.ac.uk/Tools/webservices/services/pfa/iprscan5_soap
39
Chapter 5
5. Conclusions
This chapter describes the solution developed regarding goals achieved and the contributions
that were made. Some suggestions for improvements are also made.
5.1 Achievement of Objectives
During this thesis, the development of the web service to automatize the execution of the
bioinformatics jobs was completed. It is multi-platform, having been tested in both Windows
and Linux. The web framework is divided into 2 main parts: the web service itself and the
worker bot that uses the web service to run tasks from another computer. The web service meets
all the requirements set in terms of functionality, namely being multi-platform, having a user
interface that works well with small screens and touch screens, user accounts and
authentication, management of files, management of projects describing experiences,
management of jobs to be run on worker bots, being able to run jobs from another computer,
taking care of file transfers between both computers automatically.
Jobs in the web service are generic enough to allow the creation of new types of jobs
without having to rewrite the underlying logic by abstracting away command-line programs and
storing only the name of the command or action to perform and a list or arguments to pass to the
command. This allows us to maintain backwards compatibility by ignoring newer arguments
and change the programs used in a job without having to alter existing jobs, as long as the new
command interprets the arguments in the same order as before.
In summary, the thesis work provides: a general purpose architecture to run jobs in several
machines running different operating systems; makes available to the community a web based
interface that makes it easy for any user to automate processes requiring the execution of several
tasks; a software tool capable of collaborative work among researchers sharing any information
they think useful to others; a ubiquitous computational tool accessible from any place with
access to the internet. The work was tested in a very specific domain, namely with procedures
40
Conclusions
mainly used to test the impact of aberrant alternative splicing in cancer. The proposed and
developed platform enables: running "standard" tools used in aberrant alternative splicing
studies; the possibility of chaining tools to build a pipeline that accepts the aligned reads as
input and produces the aberrant alternative splicing results; an automatic process (using the API
from the adequate web resource) to fetch the final information of the analysis concerning the
domains of missing parts of the proteins encoded by the gene under analysis, using the
InterProScan web service.
5.2 Future Work
Few issues were left unresolved in the web service. Most features were implemented. There are,
however, some aspects that can be improved, namely the web service could return different
views depending on the command executed and show the data in a more obvious way for the
user to analyse. Although this was not implemented, it is fairly easy to do and merely requires
the job view route in the web service to return a different view depending on the command
name and create the custom views using HTML and JavaScript.
Another issue that exists is the download command that is executed remotely only to have
the downloaded file sent back to the server. This is because of the distributed nature of the web
service and the fact that the download command is a job. An option to run downloads locally
could be added in the future.
When transferring files from the web service, worker bots will overwrite existing files with
the same name in their workspace, even if these are the same as the ones in the server. An
improvement could be done by checking the file sizes and modification dates or by using an
error detection code or a cryptographic hashing algorithm to verify that the files are the same.
Regarding the existing types of jobs, more jobs useful for alternative splicing analysis
could be added to add more functionality to the solution.
Adding unit testing to the web service’s public API and to helper functions is a future
improvement to ensure it works correctly with future changes. The web framework used
provides a way to test the web service63 and one of the many unit testing libraries can be used to
test other code.
Although the complete set of modules of the pipeline, starting at the raw RNA-Seq set of
(unaligned) reads and ending at the identification of the missing domains of proteins, is very
easily accommodated in the proposed framework, we have concentrated only on the pipeline
stages concerning the analysis of the gene expression (generation and analysis of ORFs). To
make the whole process complete the steps that compute the gene expression from raw reads
need to be incorporated.
63
Testing Nancy applications - http://github.com/NancyFx/Nancy/wiki/Testing-your-application
41
Conclusions
It is quite common in molecular biology to have tasks that are frequently done and are
composed by a set of steps (a pipeline). A nice extension of the proposed web interface is an
interface where a computer scientist could "assemble" easily such type of pipelines. He/she
would upload or indicate the software to be used (if already available), scripts to convert
between file formats if necessary, and the pipeline would be stored as a single software tool.
Some steps in the pipeline could even get information from web data bases to be used in the
pipeline analysis, relieving the user from collecting some of the useful information from several
web sites (for example reference genomes). As users, biologists would only need to provide the
input file(s) and get the results without the need to call several programs and with the need to
know the inner working of the process. This work is partially done, however it can be improved
further by making it easier to build job pipelines.
We would also be very interested in a near future to use Data Mining tools to help in the
analysis process. Tasks like the use of clustering as a tool for outliers' detection could be useful
for identifying and explaining junctions with an origin in aberrant alternative splicing.
Classification methods that discriminate between "normal" and aberrant alternative splicing
could also help in the explanation of the phenomena. However for a proper and complete use of
such approaches, we need more time to enrich the information available in the ENCODE
project's database that we used.
42
References
Kim, D., G. Pertea, C. Trapnell, H. Pimentel, R. Kelley, and S. L. Salzberg. 2013. "TopHat2:
accurate alignment of transcriptomes in the presence of insertions, deletions and gene
fusions." Genome Biol no. 14 (4):R36. http://www.ncbi.nlm.nih.gov/pubmed/23618408.
doi: 10.1186/gb-2013-14-4-r36.
Kim, D., and S. L. Salzberg. 2011. "TopHat-Fusion: an algorithm for discovery of novel fusion
transcripts."
Genome
Biol
no.
12
(8):R72.
http://www.ncbi.nlm.nih.gov/pubmed/21835007. doi: 10.1186/gb-2011-12-8-r72.
Langmead, B., and S. L. Salzberg. 2012. "Fast gapped-read alignment with Bowtie 2." Nat
Methods no. 9 (4):357-9. http://www.ncbi.nlm.nih.gov/pubmed/22388286. doi:
10.1038/nmeth.1923.
Langmead, B., M. C. Schatz, J. Lin, M. Pop, and S. L. Salzberg. 2009. "Searching for SNPs
with
cloud
computing."
Genome
Biol
no.
10
(11):R134.
http://www.ncbi.nlm.nih.gov/pubmed/19930550. doi: 10.1186/gb-2009-10-11-r134.
Langmead, B., C. Trapnell, M. Pop, and S. L. Salzberg. 2009. "Ultrafast and memory-efficient
alignment of short DNA sequences to the human genome." Genome Biol no. 10
(3):R25. http://www.ncbi.nlm.nih.gov/pubmed/19261174. doi: 10.1186/gb-2009-10-3r25.
Quevillon, E., V. Silventoinen, S. Pillai, N. Harte, N. Mulder, R. Apweiler, and R. Lopez. 2005.
"InterProScan: protein domains identifier." Nucleic Acids Research no. 33 (suppl
2):W116-W120. http://nar.oxfordjournals.org/content/33/suppl_2/W116.abstract. doi:
10.1093/nar/gki442.
Roberts, A., H. Pimentel, C. Trapnell, and L. Pachter. 2011. "Identification of novel transcripts
in annotated genomes using RNA-Seq." Bioinformatics no. 27 (17):2325-2329. <Go to
ISI>://WOS:000294067300001. doi: DOI 10.1093/bioinformatics/btr355.
Roberts, A., C. Trapnell, J. Donaghey, J. L. Rinn, and L. Pachter. 2011. "Improving RNA-Seq
expression estimates by correcting for fragment bias." Genome Biol no. 12 (3):R22.
http://www.ncbi.nlm.nih.gov/pubmed/21410973. doi: 10.1186/gb-2011-12-3-r22.
Sette, Claudio, Michael Ladomery, and Claudia Ghigna. 2013. "Alternative Splicing: Role in
Cancer Development and Progression." International Journal of Cell Biology no.
2013:2. http://dx.doi.org/10.1155/2013/421606. doi: 10.1155/2013/421606.
Trapnell, C., D. G. Hendrickson, M. Sauvageau, L. Goff, J. L. Rinn, and L. Pachter. 2013.
"Differential analysis of gene regulation at transcript resolution with RNA-seq." Nature
Biotechnology no. 31 (1):46-+. <Go to ISI>://WOS:000313563600021
http://www.ncbi.nlm.nih.gov/pmc/articles/PMC3869392/pdf/nihms439296.pdf.
doi:
Doi
10.1038/Nbt.2450.
Trapnell, C., L. Pachter, and S. L. Salzberg. 2009. "TopHat: discovering splice junctions with
RNA-Seq."
Bioinformatics
no.
25
(9):1105-11.
http://www.ncbi.nlm.nih.gov/pubmed/19289445. doi: 10.1093/bioinformatics/btp120.
Trapnell, C., B. A. Williams, G. Pertea, A. Mortazavi, G. Kwan, M. J. van Baren, S. L.
Salzberg, B. J. Wold, and L. Pachter. 2010. "Transcript assembly and quantification by
RNA-Seq reveals unannotated transcripts and isoform switching during cell
differentiation."
Nat
Biotechnol
no.
28
(5):511-5.
http://www.ncbi.nlm.nih.gov/pubmed/20436464
43
References
http://www.ncbi.nlm.nih.gov/pmc/articles/PMC3146043/pdf/nihms190938.pdf.
doi:
10.1038/nbt.1621.
Venables, Julian P. 2004. "Aberrant and Alternative Splicing in Cancer." Cancer Research no.
64 (21):7647-7654. http://cancerres.aacrjournals.org/content/64/21/7647.abstract. doi:
10.1158/0008-5472.can-04-1910.
Zdobnov, Evgeni M., and Rolf Apweiler. 2001. "InterProScan – an integration platform for the
signature-recognition methods in InterPro." Bioinformatics no. 17 (9):847-848.
http://bioinformatics.oxfordjournals.org/content/17/9/847.abstract.
doi:
10.1093/bioinformatics/17.9.847.
44
Appendix A
A. Web Service User Manual
A.1 Introduction
This document describes the necessary steps to have the web service up and running.
A.2 Installation
A.2.1 Prerequisites
The solution is written in C# and targets the .NET framework 4.0. In order to run the solution,
you need one of the following frameworks installed on the operating system:
.NET framework 4.0 or newer64;
Mono 3.2.8 or newer65.
The solution has two main projects. Their prerequisites are:
Web service
MongoDB66 – The web service requires a valid connection to a MongoDB database.
The MongoDB database doesn't need to be on the same computer.
Worker bot
64
Microsoft .NET framework - http://www.microsoft.com/net
Mono - http://mono-project.com/Main_Page
66
MongoDB - http://www.mongodb.org/
65
45
Web Service User Manual
A command-line shell – The worker bot uses a shell to run jobs locally. On Windows,
cmd.exe is used and is installed with the system. On Linux, Bourne shell67 (sh) is used
and either that or a compatible shell must be installed;
A list of packages – The worker bot uses command-line programs to run the jobs and
these programs must be installed and be available to be run from the default shell.
Currently, these are the required programs:
Wget68 – Wget is a program to download content from HTTP and FTP servers.
o
It is usually installed on Linux and can be installed on Windows using Gow69;
EMBOSS70 – EMBOSS is a collection of command-line programs for
o
bioinformatics. Some of those programs are used by some jobs;
o
SAMtools71 – SAMtools is used to work with SAM/BAM files.
o
InterProScan – InterProScan72 in a web service that uses EMBOSS tools in the
background to search for proteins in their database from FASTA sequences.
The web service uses the C# client (IPRScan5CliClient) which can be
found on the web service’s web page.
On Linux based systems, most of these programs can be installed easily using the default
package manager. On Debian73 based operating systems, you can use the following commands
to install all the necessary dependencies (requires root access):
apt-get
apt-get
apt-get
apt-get
apt-get
To
install
install
install
install
install
install
the
mongodb
mono-runtime
emboss
samtools
wget
InterProScan
client,
you
need
to
download
the
C#
client
(IPRScan5CliClient.exe) to a folder that will be available from any command-line prompt.
On a Debian based system, this folder can be /usr/bin. After that, make sure the program can
be run without the .exe extension. Simply rename the file to remove the extension. Mono must
be installed to run the program. On Windows, you do not need to rename the program, but
simply make it available from the command-line prompt.
A.2.2 Compiling
The root of the solution should look like this:
67
Bourne shell - http://en.wikipedia.org/wiki/Bourne_shell
Wget - http://www.gnu.org/software/wget/
69
Gnu on Windows - http://github.com/bmatzelle/gow/wiki
70
EMBOSS - http://emboss.sourceforge.net/
71
SAMtools - http://samtools.sourceforge.net/
72
InterProScan web service - http://www.ebi.ac.uk/Tools/webservices/services/pfa/iprscan5_soap
73
Debian operating system - http://www.debian.org/
68
46
Web Service User Manual
/WebService/*
/WebService.Aspnet/*
/WebService.Common/*
/WebService.Common.Logic/*
/WebService.Common.WS/*
/WebService.Self/*
/WebService.WorkerBot/*
WebService.sln
Each project folder contains a .csproj project file for compilation. The root of the folder
has a .sln file that compiles the whole application (WebService.sln).
To compile the code, you need to have a version of Visual Studio74 or MonoDevelop75 that
supports C# 4.0 projects and NuGet76 packages (these should be automatically restored when
building). Visual Studio 2010 or newer and the latest version of MonoDevelop (Mono > 3.2.8)
should be able to compile the project.
The solution uses MSBuild77 for compilation. It is a build automation tool from Microsoft
that uses an XML based project file format. Besides being able to compile from Visual Studio
or MonoDevelop, you can also compile using the command-line using MSBuild in Windows or
XBuild78 in any platform supported by Mono.
To compile the project, simply run:
msbuild.exe WebService.sln
xbuild.exe WebService.sln
This command compiles the solution in its default configuration, which is Debug. To
compile in Release mode, use:
msbuild.exe WebService.sln /property:Configuration=Release
xbuild.exe WebService.sln /property:Configuration=Release
Note: Compiled binaries with either MSBuild or XBuild should work without modifications
on all platforms. It is not recommended to mix and match binaries compiled with both versions.
Each project is compiled to each of the project’s bin folder (bin/Debug or bin/Release).
After building the project, all the necessary dependencies for the web service project should be
in the WebService.Self bin folder:
/Content/*
/Views/*
74
Visual Studio express editions - http://www.microsoft.com/express/download/
MonoDevelop - http://monodevelop.com/
76
NuGet package manager - http://www.nuget.org/
77
MSBuild - http://msdn.microsoft.com/en-us/library/dd393574.aspx
78
XBuild - http://www.mono-project.com/Microsoft.Build
75
47
Web Service User Manual
MongoDB.Bson.dll
MongoDB.Driver.dll
Nancy.Authentication.Forms.dll
Nancy.dll
Nancy.Hosting.Self.dll
Nancy.ViewEngines.Razor.dll
System.Web.Razor.Unofficial.dll
WebService.Common.dll
WebService.Common.Logic.dll
WebService.dll
WebService.Self.exe
WebService.Self.exe.config
The Content folder contains static web content files, namely CSS, JavaScript and static
HTML pages.
The Views folder contains the Razor view engine’s views files (.cshtml) that render the
HTML views at runtime.
The other project in the solution is the worker bot. All the necessary dependencies should be
in the WebService.WorkerBot bin folder:
Newtonsoft.Json.dll
RestSharp.dll
WebService.Common.dll
WebService.Common.WS.dll
WebService.WorkerBot.exe
WebService.WorkerBot.exe.config
A.2.3 Installing
In order to install either the web service or the worker bot, all it is needed is to copy the
necessary files into their destination and to run the application (the .exe file).
To run the .exe on Windows simply run it as administrator or call it from an administrator
command-line, since a user mode command-line will fail to open the necessary port. On Mono,
you must first append mono to the command-line:
mono WebService.Self.exe
48
Web Service User Manual
Both projects require prior configuration to work properly. Configuration is achieved by
using .NET framework’s built in application configuration files79. These files contain settings
specific to the application and usually have the same name of the application with .config
appended to the end. These files should have special write permission from the operating
system, even if they are running in an account without writing permissions in the application’s
folder. This behaviour is guaranteed to happen on Windows, but might not be on other operating
systems.
A.2.3.1 Web Service
WebService.Self.exe
WebService.Self.exe.config
The web service supports the –h or --help parameters that print the application’s supported
configuration parameters and their default values:
URL – URL to use to start the web service. The HTTP protocol string must be present
otherwise an exception will be thrown. Default is http://localhost:8080;
MongoDBHost – Name of the MongoDB server host. Default is localhost;
MongoDBPort – Name of the MongoDB server port. Default is 27017;
MongoDatabase – Name of the MongoDB database name. Default is WebServiceDB;
PageSize – This applies to all views that list items and defines the number of items to
display per page. Default is 10;
DataFolder – Name of the folder to store the data files. Default is ./data;
StdioFolder – Name of the folder to store the command's stdio files. Default is ./stdio.
These settings can be configured in the WebService.Self.exe.config file (Figure A.1):
<?xml version="1.0" encoding="utf-8"?>
<configuration>
<appSettings>
<add key="DataFolder" value="./data" />
<add key="StdioFolder" value="./stdio" />
</appSettings>
</configuration>
Figure A.1: Web service example configuration file.
The data and stdio folders must exist on the disk and have read and write permission
from the operating system. It is recommended that these folders be symbolic links80 if the
79
80
.NET framework application configuration files - http://msdn.microsoft.com/en-us/library/ms229689
Symbolic links - http://en.wikipedia.org/wiki/Symbolic_links
49
Web Service User Manual
folders are on a different disk or a network drive to avoid problems that might arise from
parsing unusual paths.
For security reasons, the web service doesn't allow the creation of administrator accounts.
Users cannot create new user accounts without an administrator first allowing such an account.
Administrator accounts must be created manually by directly importing users to the database.
This can be done using mongoimport, a program that comes with MongoDB:
mongoimport
--host
localhost:27017
-d
WebServiceDB
--collection
users --file users.json –upsert
This command will import users to the default database (WebServiceDB) on the default
host (localhost) into the users collection from a JSON file (users.json). The
users.json file looks like this:
{ "_id" : { "$oid" : "000000000000000000000001" }, "login" :
"admin", "name" : "Administrator", "passhash" :
"753068535f964205070a59af8a0c64aacc9883d03febd7ab8d2b92ed29c3dd93",
"createdate" : { "$date" : "2014-01-01T00:00:00.000+0100" },
"isadmin" : true }
Please note that the oid must not be 0, otherwise the system will stop working correctly.
Notice the isadmin boolean set to true, indicating an administrator account. The passhash
provided is for the password demodemo. You can change the password using the web service.
The password hash stored in the database is composed of a SHA25681 hash of the SHA182
password hash with a salt appended to it. The password salt value is defined in
WebService.Common/Settings.cs as PassSalt.
PassHash = SHA256(SHA1(password) + PassSalt)
The web service uses Twitter Bootstrap83 theming (version 3) for its user interface. The
default theme is a custom theme based on the ones found in bootswatch.com by Thomas Park.
You can alter the theme by replacing the files bootstrap.css and bootstrap.min.css
located in the Content folder with new ones.
Note however that the fonts file path should start with fonts/ and not ../fonts/. Most
themes haven't got this path correctly and must be manually changed.
81
SHA256 hashing algorithm - http://en.wikipedia.org/wiki/SHA-2
SHA1 hashing algorithm - http://en.wikipedia.org/wiki/SHA-1
83
Twitter Bootstrap - http://getbootstrap.com/
82
50
Web Service User Manual
A.2.3.2 Worker Bot
WebService.WorkerBot.exe
WebService.WorkerBot.exe.config
The worker bot supports the –h or --help parameters that print the application’s supported
configuration parameters and their default values:
URL – URL pointing to the web service. The HTTP protocol string must be present
otherwise an exception will be thrown. Default is http://localhost:8080;
Login – Name of the cluster account to use to authenticate. This account must exist on
the web service this worker bot is connecting to;
PassHash – Hash of the password used to authenticate using the SHA1 hashing
algorithm;
LocalBot – Boolean value indicating if bot is sharing the data and the stdio folders
with the web service in the same computer. This prevents the worker bot from trying to
download remote files and upload the results back. Default is false;
DataFolder – Name of the folder to store the data files. Default is ./data;
StdioFolder – Name of the folder to store the command's stdio files. Default is ./stdio.
These settings can be configured in the WebService.WorkerBot.exe.config file (Figure
A.2):
<?xml version="1.0" encoding="utf-8" ?>
<configuration>
<appSettings>
<add key="URL" value="http://localhost:8080/" />
<add key="Login" value="Cluster1" />
<add key="PassHash" value="5863d9e4cbdf522eaa62e0747fceb1c5b249ba13" />
<add key="DataFolder" value="./data" />
<add key="StdioFolder" value="./stdio" />
<add key="LocalBot" value="true" />
</appSettings>
</configuration>
Figure A.2: Worker bot example configuration file.
If the worker bot is running in the same computer, it is recommended that both the web
service and worker bot share the data and stdio folders. To do this, make sure that both
configuration files point to the same folders on the disk or create symbolic links in one of the
program’s root folder that link to the other program’s folders. You also need to set the
LocalBot parameter to true. Both folders should have read and write permission from the
operating system.
51
Web Service User Manual
A.3 User Guide
You can use the web service by first opening the web service's URL using a web browser. In
order to access the web service, you must first login into the web service or create a new user
account.
A.3.1 Sign In
You can sign in using the sign in link in the top right corner of the home page. You need to
enter the following fields to sign in (Figure A.3):
Login – Unique account login. Must be at least 3 characters long;
Name – User name. Must be at least 3 characters long;
Password – Password used to authenticate into the web service. Must be at least 4
characters long.
Figure A.3: Sign in form.
52
Web Service User Manual
A.3.2 Login
In order to access the web service, you must first login into the web service. You can do this by
using the top menu login and entering your login and password (Figure A.4). If you try to access
a restricted page, you will be redirected to a sign in page.
Figure A.4: User account menu.
One logged in, you will see a welcome message with access to your user profile, where
you can change your password, your jobs and projects and a logout form (Figure A.5).
Figure A.5: Login menu.
53
Web Service User Manual
A.3.3 Web Service Menu
After logging into the web service, you have access to a menu with all the functionality
provided by the web service (Figure A.6).
Figure A.6: Web service menu.
The menu gives access to the following items:
Clusters – Manages cluster accounts used by worker bots;
Files – Simple file viewer to view and download files stored in the server;
Jobs – Manages jobs to be run by worker bots;
Projects – Manages projects describing experiments;
Users – User account management.
54
Web Service User Manual
A.3.4 Clusters
Cluster accounts are used by worker bots to access the web service. You can list cluster
accounts and check their status by viewing the last activity. Cluster accounts, when in use poll
the web service every 10 seconds, which means that if a cluster account is idle, it should have a
last activity below 10 seconds (Figure A.7).
Figure A.7: Cluster accounts listing.
A.3.4.1 Create Cluster
You can create a cluster account from the clusters menu. You need to enter the following fields
to create an account (Figure A.8):
Login – Unique account login. Must be at least 3 characters long;
Password – Password used to authenticate into the web service. Must be at least 4
characters long.
Figure A.8: Add cluster account.
55
Web Service User Manual
A.3.5 Files
You can use the files menu to browse files in the server (Figure A.9).
Figure A.9: File browser.
You can perform the following actions:
Add a description to a file (Figure A.11);
Edit that description (Figure A.10);
Rename a file (Figure A.12);
Delete a file (Figure A.13).
File descriptions use Markdown and come with an editor for easier editing.
Figure A.10: Edit file description.
56
Web Service User Manual
Figure A.11: File description.
Figure A.12: Rename file dialog.
Figure A.13: Delete file confirmation dialog.
57
Web Service User Manual
Folders are used by projects for their own files and identify themselves with the project's
name for easy identification (Figure A.14). You can also navigate between folders using the
folder bar at the top or by using the links present in sub folders:
(.) – Root folder;
(..) – Up one folder.
Figure A.14: Project's file browser.
58
Web Service User Manual
A.3.6 Jobs
Jobs are actions that are to be performed by an available worker bot. There currently are these
types of jobs:
Bam2Sam – Converts a BAM file to the SAM format;
Download – Downloads a file to a folder from an HTTP or FTP server;
InterProScan – Uses the InterProScan84 sequence search web service to scan FASTA
files for known proteins;
Orf Find – Runs an ORF finder job using a FASTA file as input and outputs an ORF
file;
Sam2Bam – Converts a SAM file to the BAM format;
Sam2Fasta – Converts a SAM file to the FASTA format.
A.3.6.1 Add Job
You can add a job from the menu. You need to enter the following fields to create a job (Figure
A.15):
Name – Job name;
Status – Job status from the following:
o
Pending – awaiting execution. Use this to create a job but not have it executed
right away;
o
Ready – ready for execution by a worker bot. Use this to signal the job is to be
executed when a worker bot is available.
Project – Optional field associating a job to one of the user's projects. This will run the
job in that project's work area and create new files there instead of in the root folder.
You also have access to input files located inside that project's work area.
List of parameters – Each job takes a list of parameters that vary from job type.
Usually it is an input file or more and a name of an output file.
84
InterProScan web service - https://www.ebi.ac.uk/Tools/webservices/services/pfa/iprscan5_soap
59
Web Service User Manual
Figure A.15: Add job example.
60
Web Service User Manual
A.3.6.2 Job Details
Once the job is executed, it will change its state depending on whether it is executing or it has
already finished with success or because of an error (Figure A.16):
Executing – Job is being executed by a worker bot;
Completed – Job execution has completed without errors;
Error – Job execution was halted because of an error. This usually means the
command-line ran in the worker bot encountered a problem which can be due to an
incorrect parameter or another unforeseen error. If the job ran with errors, but
successfully, the state should be completed.
Figure A.16: Job details.
The standard output and standard error streams are saved so you can check a job's success.
Once you stop needing these files, you can delete the using the small delete button next to the
output label.
You can also edit a job. Usually you do this to change its state. Manually editing job
parameters is not recommended.
Deleting jobs can be done after the job ran and you don't need it anymore. Stdio files
related to that job are also deleted. All files produced by that job are not, so you can use them in
other jobs.
61
Web Service User Manual
A.3.7 Projects
Projects are descriptions of experiments a user wants to have for reference. Each project has its
own working folder, so users can have a separate work area for each project. Jobs that are
associated to projects will output their files on that job's work area.
A.3.7.1 Create Project
You can create projects from the clusters menu. You need to enter the following fields to create
a project (Figure A.17):
Name – Project name;
Description – Project description. Descriptions use Markdown and come with an editor
for easier editing.
Figure A.17: Add project.
62
Web Service User Manual
A.3.7.2 Project Details
Once the project is created, you can add jobs associated with it and view the project's files. The
description is useful to describe the experiment and to add links to the files and special notes
regarding the experiment (Figure A.18).
Figure A.18: Project details.
63
Web Service User Manual
A.3.8 Users
User accounts are used for authentication. They are created using the singed in menu link as
described in the beginning of this guide.
A.3.8.1 Pending User
When a new user is created by a guest, it is created in a pending state and you can't login into
the system using that account until an administrator clears the pending state. Administrators are
notified in the menu bar when pending users exist (Figure A.19).
Figure A.19: Pending users menu.
You can clear the pending state by clicking the clear pending button in the users listing
(Figure A.20).
Figure A.20: Users listing.
64