1
Map Intelligence Server Tools & Administration Guide
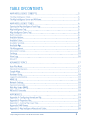
ii
Map Intelligence extends the "no programming" paradigm into mapping and merges location and spatial
analytics into enterprise decision support and Business Intelligence applications.
Map Intelligence enables bi-directional analysis between data visualized on maps and other more traditional
representations such as tables of data, charts and reports. In this environment a user can easily discover
previously hidden information and data relationships.
Map Intelligence reduces the time needed to develop the applications from weeks and months to days and
hours. In many cases organizations have given up before solving the technical challenges that Map Intelligence
solves.
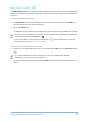
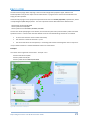
Map Intelligence has two principal components:
The Map Intelligence Client (MI Client) is comprised of a number of configuration screens that enable you to
design your mapping application. Using the MI Client you select the underlying map you want to use and build
the different MI Custom layers to be used in your analysis. Once this has been done, your application is
finished, and in operation the MI Client sends a request to the Map Intelligence Server to display your
application in a web browser.
For further information on the MI Client, refer to the Map Intelligence Client User Manual.
The Map Intelligence Server is the powerhouse behind the mapping application you designed using the MI
Client. It processes all the information sent from the MI Client to produce your application which you view and
interact with in the browser MI Viewer. For further information on the MI Viewer refer to the MI Viewer User
Manual.
The Map Intelligence Server is supplied with a number of administration tools that include license
administration and customizing default settings.
Figure 1. The Map Intelligence Platform
Map Intelligence Server Tools & Administration Guide
3
The Map Intelligence Tools page allows you to exercise the Map Intelligence server without a client, to
perform ancillary functions and to administer Map Intelligence.
For the location of other documents cross-referenced in this guide see Appendix E - Map Intelligence
Manuals and Guides on page30.
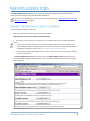
To open the Map Intelligence Tools page
Open your web browser and navigate to the following address:
http://localhost:<Server_Port_Number>/mapIntelligence/
The browser can be opened on any machine on the network with access to the Map Intelligence
server.
<Server_Port_Number> being the port number allocated, based on the value you stated in the
Server Settings dialog box during installation. (For further information on Server Settings and ports
used by Map Intelligence, refer to the Map Intelligence Server Installation Guide.
It is important to type mapIntelligence with a small ‘m’ and a capital ‘I’ when entering the address
into your web browser.
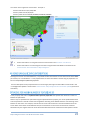
The Map Intelligence Tools page will now be visible. The Map Intelligence Tools page allows you to
exercise the Map Intelligence server without a client, to perform ancillary functions and to administer
Map Intelligence.
Figure 2. Map Intelligence Tools page.
Map Intelligence Server Tools & Administration Guide
4
The Map Intelligence Test will confirm that the Map Intelligence installation was successful by displaying your
default map. The GIS Provider must be running to perform the test. If no errors appear your installation was
successful.
TO RUN THE MAP INTELLIGENCE TEST
1.
In the Map Width field enter the width of the map to be displayed, by default this is set to 5000 (km or
miles depending on the units of the default map).
2.
Click the Test Map button.
The MI Viewer will open, displaying your default map. If no errors appear your installation was successful.
The first time you use the MI Viewer, a few tips on how to interact with the MI Viewer are displayed, to
close these Quick Tips click the Close button .
If you close the Quick Tips, long-pressing the Help button
further information see the MI Viewer User Manual).
reopens the Quick Tips screens (For
TO CLOSE THE MAP INTELLIGENCE TEST SESSION
1. To end your current Map Intelligence session, from the MI Viewer Toolbar, click the End Session button
.
It is recommended that you end your session, when you have finished working with Map
Intelligence, to free up resources for other users.
2.
You can now close the browser or click the browser Back button to return to the Map Intelligence Tools
screen.
Map Intelligence Server Tools & Administration Guide
5
The Map Intelligence Query Tool allows you to view a list of all maps available on the server along with the
associated layers and attributes.
1.
Click the Map Query button to open the Map Intelligence Query Tool.
2.
To return to the Map Intelligence Tools page, click the Home button on the top menu bar.
The Batch Geocoder converts addresses to coordinates on a scheduled or ad hoc basis. For further information
refer to the Batch Geocoder User Guide.
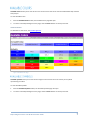
Available Hatches allows you to view all the hatches on the server that can be used to shade Relationship and
Area Group layers.
To view Available Hatches
1.
Click the Available Hatches button, the Available Hatches page will open.
2.
To return to the Map Intelligence Tools page, click the Home button on the top menu bar.
Figure 3. Available Hatches page.
Map Intelligence Server Tools & Administration Guide
6
Available Colors allows you to view all the colors on the server that can be used to shade Relationship and Area
Group layers.
To view Available Colors
1.
Click the Available Colors button, the Available Colors page will open.
2.
To return to the Map Intelligence Tools page, click the Home button on the top menu bar.
ADDING COLORS
To add Colors to the server, see File Management.
Figure 4. Available Colors page.
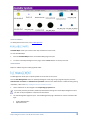
Available Symbols allows you to view all the images on the server that can be used as point symbols
representing a location.
To view Available Symbols
1.
Click the Available Symbols button, the Available Symbols page will open.
2.
To return to the Map Intelligence Tools page, click the Home button on the top menu bar.
Map Intelligence Server Tools & Administration Guide
7
Figure 5. Available Symbols page.
ADDING SYMBOLS
To add Symbols to the server, see File Management.
Available Maps allows you to view all the maps available from the server.
To view Available Maps
1.
Click the Available Maps button, the Available Maps page will open.
2.
To return to the Map Intelligence Tools page, click the Home button on the top menu bar.
ADDING MAPS
Maps are added using the underlying GIS Provider.
File Management allows you to upload symbols and color files to the server.
Click the File Management button on the Map Intelligence Tools page. A login page will appear, enter the
Administrator username and Administrator password entered in the Administrator credentials dialog during
installation, refer to the Map Intelligence Server Installation Guide.
1.
These credentials can be changed in the mapsettings.properties file.
If you have previously entered a password protected area during the current Map Intelligence session
you will not be prompted for a Username and Password.
2.
The File Management page will open. The File Management page is divided into 2 sections based on file
type:
Symbol Management
Upload Color File
Map Intelligence Server Tools & Administration Guide
8
Figure 6. File Management page.
3.
Click the Browse… button next to section for the file to type you wish to upload and navigate to the
location of the file.
4.
Click the Upload button. A message box will appear confirming the file was uploaded successfully, click the
OK button.
Map Intelligence accepts symbols only in gif format to be compatible with the underlying map
provider.
You can view the Symbols or Color files by clicking on the Available Symbols or Available Colors
buttons on the main Tools page.
COLOR FILE STRUCTURE
Colors can be also be added to the server using files in the “…\mapIntelligence\colors” directory. For example
the “default.colour” file shows the structure:
the name of the color set
the unique names for the colors with their values either as hexadecimal constants or comma separated
RGB values.
New color files should also follow this structure.
You need to re-start the Map Intelligence server for the changes to take effect.
USING SYMBOLS WITH THE POINT GRADIENT TOOL
When adding new Symbols to the server, an average pixel color is also allocated for use with the Point Gradient
tool. If you wish to change the color that has been allocated, you need to change the RGB color for the unique
image file in the WEB-INF/properties/gradient.image-conversion.properties file.
For example:
triangle-white.gif = 255,255,255
triangle-orange.gif = 218,156,9
triangle-purple.gif = 106,74,151
triangle-lightblue.gif = 173,215,243
Symbol names are case sensitive.
If no RGB color is associated with an image, a default color will be used, usually black.
Map Intelligence Server Tools & Administration Guide
9
The Administer Licenses page is discussed in the Map Intelligence Server Installation Guide found in the Map
Intelligence Server software or on support.pb.com/ekip/index?page=content&id=RE15215
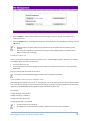
The Settings page allows changes to Map Intelligence Settings
Click the Settings button on the Map Intelligence Tools page. A login page will appear, enter the Administrator
username and Administrator password entered in the Administrator credentials dialog during installation,
refer to the Map Intelligence Server Installation Guide.
1.
These credentials can be changed in the mapsettings.properties file.
If you have previously entered a password protected area during the current Map Intelligence
session you will not be prompted for a Username and Password.
1.
When amending the settings page, exit the field, by pressing the tab key or clicking in another field. The
field is highlighted in purple to show a change to the default setting has been made.
2.
To save the new settings, click the Save Changes button at the bottom of the screen.
3.
To restore any changes, click the Restore Defaults button at the bottom of the screen.
4.
Click the Home button to return to the Map Intelligence Tools page.
The following parameters can be amended:
MAXIMUM DECIMAL PLACES
This parameter specifies how many decimal places to display for numbers in the MI Viewer. The default value is
2 but this can be changed if you are dealing with precise measurements and wish to see aggregates in more
detail (must be less than 340 and greater or equal to 0).
USE INTERNAL MAP ZOOM
If the Yes radio button is selected, the default zoom level will be taken from the map and not from the “Default
Zoom Level” defined in these settings.
DEFAULT ZOOM LEVEL
If a request does not specify the width of the map to display, and there are fewer than two points in the
request, then Map Intelligence cannot determine an appropriate width to display the map. In such cases, the
value in this parameter is used as the width for the map. The default value is 1.0 (km or miles, depending on
settings set in the Settings section of the MI Client: refer to the Map Intelligence Client User Manual.
DEFAULT MAP VIEW WIDTH
This parameter specifies the default width of the map in pixels as it appears in the browser.
Map Intelligence Server Tools & Administration Guide
10
If Map View Width settings are supported by your MI Client, Map View Width settings configured here may be
overridden by the Layer Designer in the MI Client.
DEFAULT MAP VIEW HEIGHT
This parameter specifies the default height of the map in pixels as it appears in the browser.
If the Default Map View Height settings are supported by your MI Client, Map View Height settings configured
here may be overridden by the Layer Designer in the MI Client.
NULL VALUES
When a point is missing a value, the displayed value is determined by this parameter.
FETCH MAP NAMES FROM GIS PROVIDER
When the Yes radio button is selected, Map Intelligence will delegate to the concrete GIS Provider
implementation the task of fetching the list of available map names.
GEOCODER
A geocoder takes street addresses and converts them to geographical coordinates. Map Intelligence is designed
to run with a variety of geocoders.
This setting is only relevant if a Geocoder has been licensed and configured. For further information refer
to the Geocoder Installation Guide.
USE TRANSPARENT BACKGROUND / MAP BACKGROUND COLOR
By default the map background color is set to white (FFFFFF). To select an alternative map background color,
enter the hexadecimal RGB color value in the Map Background Color field. For example, FF00FF is magenta. To
make the map background transparent, select the Yes button for Use Transparent Background option.
SHOW REGION BUILT-IN LABEL
This setting is applicable to Map Intelligence IGP.
When the Yes radio button is selected (default settings), the GIS Provider built-in label will be included in the
final text used for labeling regions.
Click the No radio button to exclude any GIS Provider built-in label from participating in the final text used for
labeling regions.
SHOW REGION VALUES ON REGION LABELS
When the Yes radio button is selected (default settings), then the region aggregate value will be included in the
final text used for labeling regions.
If a built-in layer is themed twice, once with colors and another with hatches, the hatched layer sits on top of
the color layer, therefore the values shown on the region label will be the values for the hatch layer.
In some instances, for example, to prevent labels overlapping, the GIS server makes a best attempt to
decide which labels to show and which labels to hide. Sometimes the server may succeed in placing and
rendering the lower layer label but not the upper one. If you zoom in on those regions, and provided
there is enough space around the expected width to be occupied by the label, the GIS server will
successfully render the label.
Map Intelligence Server Tools & Administration Guide
11
Click the No radio button to exclude the region aggregate value from participating in the final text used for
labeling regions. If in addition, the previous settings is No then the regions will not be labeled.
Map Intelligence IGP Users: If in addition, the Show Region Built in Label settings is Yes then the value
will be enclosed in parentheses and separated from the built-in label by one white space; otherwise, the
final text for the label will consist of the string representation of the region aggregate value.
USE THE ORIGINAL SYMBOL SIZES
Symbols that mark points in Map Intelligence layers can either be scaled with the map to keep a standard size
relative to the zoom level or they can be fixed at their original size (in pixels).
When the Yes radio button is selected (default setting), the symbols retain their original size in pixels. Layer
Designers can then create symbols with different sizes, which can be added to the symbols directory. The
symbols of different size can be used to represent values on the points. (See Available Symbols - Adding
Symbols).
MAP FONT
This is the font to be used when rendering the labels of map features for Map Intelligence layers. The field can
be left blank if you are using the default font which is San Serif. If you need to render characters other than
standard Latin then a Unicode font must be used - e.g. Arial Unicode MS.
MAP FONT SIZE
The size of the font to be used when rendering the labels of map features (in points). The default size is 10.
CHARACTER SET FOR CSV FILE EXPORT
The character set to be used for encoding CSV output files, an example would be for the Thai language TIS-620.
This field can be left blank if you are using the default character encoding IS0-8859-1 (Latin Alphabet No. 1).
IGNORE CASE FOR AREA GROUPS
If set to false, this parameter indicates that the values in the ID Column field of an Area Group layer must
match the case of the values in the map layer, otherwise the case of the values is ignored.
ABORT ON NON-NUMERIC DATA AGGREGATIONS
The Abort on Non-numeric Data Aggregations option allows you to change the behavior when an aggregation
function detects non-numeric data. If No (the default) is selected then a numeric aggregation will just ignore
non-numeric data and carry on to completion. If Yes then the aggregation is aborted.
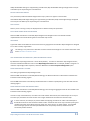
OPACITY OF COLORED CIRCULAR REGIONS IN RADIUS LAYERS
A number from 0 to 1 that indicates the opacity of all colored circular regions in radius relationship layers.
Figure 7. Opacity set to 1
Figure 8. Opacity set to 0.5
Map Intelligence Server Tools & Administration Guide
Figure 9.Opacity set to 0.2
12
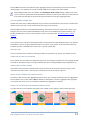
OPACITY OF COLORED REGIONS
A number from 0 to 1 that indicates the opacity of all colored region layers.
Figure 10. Opacity set to 1
Figure 11. Opacity set to 0.8
Figure 12.Opacity set to 0.5
OPACITY OF HATCHES ON LAYERS
A number from 0 to 1 that indicates the opacity of all hatched layers.
Figure 13. Opacity set to 1
Figure 14. Opacity set to 0.8
Figure 15.Opacity set to 0.5
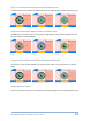
COLOR OF HATCHES ON LAYERS
The RGB setting for the hatch color as a six hexadecimal digit (3 byte) number representing Red, Green and
Blue. The default value is Black (000000).
Figure 16. hatch color set to Red (FF0000)
Figure 17. Hatch color set to Green
(00FF00)
Map Intelligence Server Tools & Administration Guide
Figure 18. Hatch color set to Yellow
(FFFF00)
13
OPACITY OF CIRCULAR REGION BORDERS IN RADIUS RELATIONSHIP LAYER
A number from 0 to 1 that indicates the opacity of all the circular region borders in a radius relationship layer.
Figure 19. Border opacity set to 1
Figure 20. Border opacity set to 0.5
Figure 21. Border opacity set to 0.2
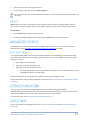
COLOR OF CIRCULAR REGION BORDERS IN RADIUS RELATIONSHIP LAYER
The RGB setting for the border color as a six hexadecimal digit (3 byte) number representing Red, Green and
Blue. The default value is Black (000000).
Figure 22. Border color set to Red
(FF0000)
Figure 23. Border color set to Blue
(0000FF)
Figure 24. Border color set to Yellow
(FFFF00)
THICKNESS OF CIRCULAR REGION BORDERS IN RADIUS RELATIONSHIP LAYER
The thickness in points or pixels (depending on the GIS provider) of the circular region borders as a positive
integer.
Figure 25. Border thickness set to 5
Figure 26. Border thickness set to 3
Figure 27. Border thickness set to 1
USE MAP BORDER ATTRIBUTES
If Yes, then, the map's attributes are used, otherwise the following settings are used. The default setting is No.
Map Intelligence Server Tools & Administration Guide
14
OPACITY OF REGION BORDERS
A number from 0 to 1 that indicates the opacity of all region borders.
Figure 28. Border opacity set to 1
Figure 29. Border opacity set to 0.5
Figure 30. Border opacity set to 0.2
COLOR OF REGION BORDERS
The RGB setting for the border color as a six hexadecimal digit (3 byte) number representing Red, Green and
Blue. The default value is Black (000000).
Figure 31. Border color set to Red
(FF0000)
Figure 32. Border color set to Green
(00FF00)
Figure 33. Border color set to Yellow
(FFFF00)
THICKNESS OF REGION BORDERS
The thickness in points or pixels (depending on the GIS provider) of the region borders.
Figure 34. Border thickness set to 5
Figure 35. Border thickness set to 3
Map Intelligence Server Tools & Administration Guide
Figure 36. Border thickness set to 1
15
View Logs displays a list of log files for Map Intelligence. The file may be viewed or downloaded from this page.
The log files show server activity from the time of installation. The default size for the log file is 10MB. When a
log file reaches 10 MB in size, a new log file will be created, the older log file (with “.1” extension) appears at
the bottom of the list. The default setting for log file generation is to overwrite the older file after two files
have been created.
The size can be changed by editing the code line <param name="maxFileSize" value="10MB"/> in the
logConfig.xml file located in the properties directory, (example …\tomcat\webapps\mapIntelligence\WEBINF\properties).
<!-- log all trace/debug messages (exception timing events) to a file -->
<appender name="TRACE-DEBUG" class="org.apache.log4j.RollingFileAppender">
<param name="file" value="@trace_debug_file@"/>
<param name="maxFileSize" value="10MB"/>
<layout class="org.apache.log4j.PatternLayout">
<param name="ConversionPattern" value="%d|%-6p|%t|%c{1}||%m%n"/>
</layout>
<filter class="au.com.forge.log.AllExceptTimingFilter"/>
</appender>
Click the View Logs button on the Map Intelligence Tools page. A login page will appear, enter the
Administrator username and Administrator password entered in the Administrator credentials dialog during
installation, refer to the Map Intelligence Server Installation Guide.
1.
These credentials can be changed in the mapsettings.properties file.
If you have previously entered a password protected area during the current Map Intelligence session
you will not be prompted for a Username and Password.
Figure 37. Log File page.
Map Intelligence Server Tools & Administration Guide
16
1.
To view a log file, click on the log file name link.
2.
To save a log file, right click and select “Save Target as …”
File saving instructions are for Microsoft Internet Explorer, these may vary depending on the browser you
are using.
About allows you to view some important server and environment properties, including Product Version,
Server Version and Type, Updates Applied, Client Details, Web Server Information and System Information.
To view About
1.
Click the About button, the About page will open.
2.
To return to the Map Intelligence Tools page, click the Home button on the top menu bar.
The following section provides relates to Map Intelligence Advanced Topics. For the location of Technical
Notes referenced see Appendix E - Map Intelligence Manuals and Guides on page30.
The Auto Pilot Mode (APM) controls some of the Map Intelligence Tools depending on the document being
manipulated by the MI Client. For example, based on the name of a business intelligence document, a Layer
Designer can control:
what plugins must be excluded;
what plugins must be deactivated, and
what plugins must be activated and how.
1. An excluded plugin will not even appear in the list of plugins usually visible when the user clicks
the Tools menu button in the MI Viewer.
Auto Pilot mode requires some programming and access to the Map Intelligence server.
Further Information relating to Auto Pilot Mode can be found in the Technical Note: Auto Pilot Mode in Map
Intelligence.
The ming, bing, osmming and wmsming interface directories (under mapIntelligence/WEBTEMP/templates/wms/application/) may have an optional file called overlays.json that if present can define a
list of external WMS layers that allow users to display these layers in the interface
For information refer to the Technical Note: Extended Overlays.json.
Further Information on Google Maps refer to the MI Viewer User Manual and the Technical Note: Google
Maps Plugin.
Map Intelligence Server Tools & Administration Guide
17
Further Information on Hardware sizing refer to the Technical Note: Hardware Sizing.
If you want to customize the look and feel of the Map Intelligence legend refer to the Technical Note: Legend
Customization.
For further information relating to the MING UI refer to Technical Note: Map Intelligence Next Generation
(MING) and the MI Viewer Manual.
Further Information on Network Settings refer to the Technical Note: Map Intelligence Network Settings.
For further information relating to the Spectrum Geocoder refer to Technical Note: Spectrum Geocoder.
Map Intelligence allows you to view a Map Intelligence session in any WMS Client for further information refer
to Technical Note: Web Map Services (WMS) implementation.
For further information relating to the WIGeoGIS Geocoder refer to Technical Note: WIGeoGIS Geocoder.
Map Intelligence Server Tools & Administration Guide
18
The web.xml file can be found in the \tomcat\webapps\mapIntelligence\WEB-INF directory. This file can be
used to modify the Map Intelligence session-timeout properties.
session-timeout
This is the time in minutes of inactivity before the session will expire. In the code below, the session is
configured for 30 minutes. Change this setting to suit your needs and save the web.xml file. The server must
be re-started before the settings take effect.
<session-config>
<session-timeout>30</session-timeout>
</session-config>
Map Intelligence Server Tools & Administration Guide
19
In some instances, you may not want to have a certain plugin(s) available for use in Map Intelligence. If this is
the case, you will want to disable one or more plugins.
In the plugin.properties file, type a # at the beginning of the plugin to be disabled. For example, to disable the
Selection plugin:
#forge.selection=au.com.forge.mapIntelligence.plugin.selection.SelectionPlugin
This will ‘comment out’ that particular plugin, rendering it inoperative in Map Intelligence and removing it
from the view of the end user.
2.
Save and close the plugin.properties file.
The plugin.properties file is located in the mapIntelligence\WEB-INF\properties directory.
The forge.extent.history.marquee and the forge.extent.history plugins will cause errors in Map
Intelligence if they are disabled.
You must re-start the server before the changes take effect.
The Z-order of the layers indicates the order that the layers are stacked in the final image produced by Map
Intelligence. There are properties in the plugins.properties file for this purpose:
1.
The first property determines the Z-order of background-image plugins - i.e. those that generate their
result as a single-point point layer such as Google maps, contour, etc... It is named 'zOrder' in the
'plugins.properties' file, with a sensible default value, and can be edited to alter the Z-order of the plugins'
corresponding background-image layers (top to bottom). It should not be necessary to alter this property.
2.
The second property specifies which of those plugins should have its layer rendered BELOW the map's
built-in layers. To specify that the layer corresponding to a background-image plugin should be rendered
BELOW the built-in layers, properties of the following form could be added (PLUGIN-ID being the unique ID
of the plug-in): base.PLUGIN-ID=true
For example to specify that the Google maps plugins should have its layers BELOW the built-in layers the
following property should be present in the 'plugin.properties' file:
base.forge.webServices.google=true
The Export plug-in now makes use of an "export.properties" file to determine whether or not to display
particular export selectors. If the properties file is not present then all selectors are shown, otherwise only
those that are present or not commented out are shown. These properties must be set manually.
Map Intelligence Server Tools & Administration Guide
20
The Point clusters plugin while exposing a minimal set of configuration properties (layer, distance and
threshold) offers a way for the expert Server Administrator or programmer to control the classification and
styling of cluster symbols.
It does that by relying on some properties expected to be found in the cluster.properties properties file, found
in mapIntelligence\WEB-INF\properties. The most important of these follow with their default values:
cluster.break.values=10,100,1000
cluster.symbol.sizes=20,30,40
cluster.symbol.colors=0x4169E1,0xFFB90F,0xFF0000
The first one allows specifying the class breaks, the second the symbol sizes (circle diameter) and the third the
symbol fill colours. If values other than the defaults are to be used the following constraints are checked:
all 3 lists must have the same number of elements;
the minimum number of elements is 2; and
the class break values must be positive, in ascending order with the lowest greater than or equal to 5.
if any of these conditions is violated the default values are used instead.
Examples
The values used in Figure 38. Point clusters - Example 1. are:
cluster.break.values=25,200
cluster.symbol.sizes=20,30
cluster.symbol.colors=0x00FF00,0xFF0000
Figure 38. Point clusters - Example 1.
Map Intelligence Server Tools & Administration Guide
21
The values used in Figure 39. Point clusters - Example 2.
cluster.break.values=10,75,150,1000
cluster.symbol.sizes=20,30,40,50
cluster.symbol.colors=0xFFFF00,0x0000FF,0x00FF00,0xFF0000
Figure 39. Point clusters - Example 2.
Further information on using Point clusters can be found in the MI Viewer User Manual.
Further information on controlling Point clusters using the Auto Pilot Mode can be found in the
Technical Note: Auto Pilot Mode in Map Intelligence.
Starting from version 4.2 of the MI Server, it is possible to alter the behavior of a few UI elements of the MING
(all variants) on a site wide basis. A new properties file to control this feature named ‘ming.ui.properties’ can
found in mapIntelligence\WEB-INF\properties.
For a full description of the properties which can be changed, their type and their effect can be found in the
“UI Configuration Options” section of the Technical Note: Map Intelligence Next Generation (MING) (Version 12
and above).
A new property now exists in implementation.spectrum.properties that specifies the maximum number of
features to optimize for.
When a layer is specified to be optimized using the optimizeFeatures property, the value specified determines
how many features it should consider retrieving before switching to the default behavior and retrieving all the
features on the screen. For example, assume the limit is set to 50. If there are more than 50 features on the
screen which have values associated with them, then all features on the current screen will be retrieved.
Otherwise only the regions that have values associated with them will be retrieved from the Spectrum Server.
Map Intelligence Server Tools & Administration Guide
22
How this all works
For each request, Map Intelligence will generate the values for the features on the screen.
It then retrieves the geometries of those features as required and caches them for later use via a JCS
cache.
If all the features on the screen were retrieved, the envelope of the current screen is recorded so the
features aren't required to be retrieved again in a subsequent request within that envelope.
If only the features that have values are retrieved from the screen then the envelope isn't recorded so
subsequent requests will continue to query the server for its features that are contained with the current
screen envelope.
When to use what:
1.
Optimize Features: When there are a high number of features on the screen but of which only a small
subset actually have values. For example, there are over 40,000 zip codes in the US. If only 1000 were
being themed (ie: have data) and are spread across the country, it makes sense to not retrieve all the
features on the screen for the whole of the US, but just the 1000 on the screen that have values. This will
happen for each request.
2.
Default Behavior: In the above example, if every zip code (over 40,000) had a value associated with it then
it makes more sense to get all of them once and have them cached so we don't need to retrieve them
again for each subsequent request.
3.
To cater for both examples above, we'd set the zip code layer as optimized using the optimizeFeatures
property and set the limit to something sensible like 2000.
Only the name of the layer should be specified, not the full path and should be prepended by the name
"optimizeFeatures.". Spaces in the name should be converted to periods so "New Layer" becomes
"New.Layer"
optimizeFeatures.layerName1=1000
optimizeFeatures.My.Other.Layer=2000
optimizeFeatures.Layer.3=2000
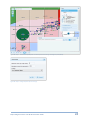
The property select.visible.features found in the ming.api properties file controls how selections from custom
layers which have their visibility flag turned on are handled.
The default value of this property is TRUE indicating that features from custom layers which have their visibility
flag turned on and the width of the current view's extent is within the layer's zoom range, will be selected.
Changing this property to FALSE relaxes the constraint and features are always selected as long as their custom
layer's visibility flag is turned on. When this is the case features are selected even if their symbol is not
rendered / visible in the thematic map because the width of the current view's extent is outside the layer's
zoom range.
The example screenshots below step through the differences.
Map Intelligence Server Tools & Administration Guide
23
Figure 40. Step 1 - The MI Viewer (MING) after an initial request and zooming in showing the points (Boats).
Figure 41. Step 2 - Change the point layer zoom range.
Map Intelligence Server Tools & Administration Guide
24
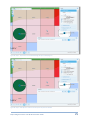
Figure 42. Step 3 - The points are not rendered although the layer’s visibility flag is on.
Figure 43. Step 4 - Select by box an area that contains points. No points are selected.
Map Intelligence Server Tools & Administration Guide
25
Figure 44. Step 5 - Change 'select.visible.features' to false and Step 4. Points are now selected.
.
Map Intelligence Server Tools & Administration Guide
26
MI Clients using the Map Intelligence Agent make requests to the Map Intelligence server for map and map
layer information for the internal maps from the map provider. The Map Intelligence Agent is built using this
infrastructure.
The following information is retrieved:
A list of the names of the maps served by the underlying map server.
For each map: a list of the layers that comprise the map.
For each layer: the list of fields that comprise the layer (but not the geometries).
For a number of features in each layer, the values of each field in the feature (see below for how to set
the maximum number of features that are returned for each layer).
The map and layer information elements are fetched when map enabling reports. The process can be slowed
down considerably by the Agent then Map Intelligence Server having constantly to request the underlying map
server for map and layer data. To improve performance, the Map Intelligence server now has the ability to
“cache” map and map layer information.
Caching is not turned on by default in the installation. The behavior is driven by a properties file in the WEBINF/properties directory called caching.properties.
You must edit the caching.properties file directly then re-start the server for caching to take effect.
The first property you must set is as follows:
forge.data.cache.enable=true
and this enables caching.
If you simply set this property to true, the cache will only persist for as long as the server is running, and will
have to be filled again the next time the server is stopped and started. You may only want to set this property if
your maps are changing frequently and you do not want to administer any data saved on disc. You will have to
re-start the server when you change the map data though.
The second property that you can set is:
forge.data.cache.persistent=true
If you set this property to true then the map and layer data elements in the cache are made persistent to disc.
Please note that the comment in the caching.properties file is no longer valid for the file name and the
location. The file is now located in the WEB-INF/data directory and is named for the map provider. For
example, with the MapXtreme version, the file is called mapinfo-data.xml.
The third and final property relates to the maximum number of features that can be saved for each map layer.
It is:
forge.data.cache.feature.limit=100
The value of 100 is the default setting.
Map Intelligence Server Tools & Administration Guide
27
If your map data are changed then you will need to flush the cache. How you do this will depend on whether or
not you have made the cache persistent.
If the cache is not persistent then flushing the cache is simply a matter of re-starting the server.
If the cache is persistent then you will also have to remove the cache file located here:
WEB-INF/data and called after the map provider as:
<map provider name>-data.xml
Do this once you have stopped the server and before you re-start it.
Map Intelligence Server Tools & Administration Guide
28
Name
ID
Description
Server default
-
The ‘Server default’ GUI becomes whatever has been set in the “gui=”
property in the “wms.properties” file (mapIntelligence\WEBINF\properties). If that property is not set then the OpenLayers basic
GUI is presented.
MI BING
bing
Uses Microsoft Bing - http:/www.bing.com/maps/
MI OSM
osmming
Uses a combination of OpenStreetMap (OSM) (street view) and Google
Maps (terrain and satellite views) - http://www.openstreetmap.org/
Open Layers
openlayers
This viewer is also the ‘default’ when no specific GUI configuration
parameter is specified in an MI Request or set in the ‘wms.properties’.
Google Earth
networklink
This viewer is suited for use by the Google Earth application.
MI Flex viewer*
flexviewer
This viewer is built on Esri's ArcGIS Viewer for Flex. It can be used in a
similar way to the other viewers although currently it has less
functionality.
The customGUIs.txt file contains the current user interfaces and their meanings. Some of the viewers in the list
may not be included in particular installations (e.g. the Flex viewer). Viewers can be removed from the list by
editing the CustomGUIs.txt (…\tomcat\webapps\mapIntelligence).
Map Intelligence Server Tools & Administration Guide
29
Product documentation and support information for Spectrum
Map Intelligence SP and the clients are located here:
TM
Spatial for Business Intelligence, including
support.pb.com/ekip/index?page=content&id=RE15215
Additional support information and documentation for Spectrum
TM
Spatial are located here:
support.pb.com/spectrum
Map Intelligence Server Tools & Administration Guide
30


![ArcMap [v10.0- v.10.2] User manual](http://vs1.manualzilla.com/store/data/005724954_1-1f5d2da94c774511c91b8b97dbbbcd93-150x150.png)
![Intergraph Geomedia [6.1-2013] User manual](http://vs1.manualzilla.com/store/data/005689587_1-58c82d14f3ba8ebe92b5c45af00d079c-150x150.png)

![MapInfo [v9.5 - v10.0] User manual PDF](http://vs1.manualzilla.com/store/data/005662542_1-c58f11f989f54f88b5c049879cd1b1b4-150x150.png)