1
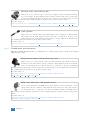
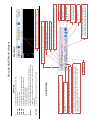
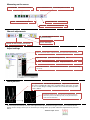
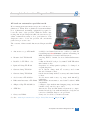
ATIS
Automotive Test and Information System
Information
Copyright c 2014 TiePie engineering.
All rights reserved.
Revision 1.0, March 2014
Despite the care taken for the compilation of this user manual, TiePie engineering can not
be held responsible for any damage resulting from errors that may appear in this manual.
Contents
1 Automotive Test and Information System (ATIS)
1.1
1.2
1
The main menu . . . . . . . . . . . . . . . . . . . . . . . . . . . . . . . . . . . . .
2
1.1.1
Basic scope . . . . . . . . . . . . . . . . . . . . . . . . . . . . . . . . . . .
2
1.1.2
Brands . . . . . . . . . . . . . . . . . . . . . . . . . . . . . . . . . . . . . .
2
1.1.3
Help . . . . . . . . . . . . . . . . . . . . . . . . . . . . . . . . . . . . . . .
2
1.1.4
Scope options . . . . . . . . . . . . . . . . . . . . . . . . . . . . . . . . . .
2
Navigation bar . . . . . . . . . . . . . . . . . . . . . . . . . . . . . . . . . . . . .
3
2 Basic Scope
5
2.1
Fault codes . . . . . . . . . . . . . . . . . . . . . . . . . . . . . . . . . . . . . . .
6
2.2
Intermittent fault finding . . . . . . . . . . . . . . . . . . . . . . . . . . . . . . .
6
2.3
Engine Management Systems Petrol . . . . . . . . . . . . . . . . . . . . . . . . .
6
2.4
Engine Management Systems Diesel . . . . . . . . . . . . . . . . . . . . . . . . .
6
2.5
ABS (Anti lock Breaking System)
. . . . . . . . . . . . . . . . . . . . . . . . . .
7
2.6
Ignition measurements . . . . . . . . . . . . . . . . . . . . . . . . . . . . . . . . .
7
2.7
Current measurements . . . . . . . . . . . . . . . . . . . . . . . . . . . . . . . . .
7
2.8
CAN-bus measurements . . . . . . . . . . . . . . . . . . . . . . . . . . . . . . . .
7
2.9
Ohm scope . . . . . . . . . . . . . . . . . . . . . . . . . . . . . . . . . . . . . . .
8
2.10 Alternator measurements . . . . . . . . . . . . . . . . . . . . . . . . . . . . . . .
8
2.11 Connector and wire measurements . . . . . . . . . . . . . . . . . . . . . . . . . .
8
2.12 Generic scope settings . . . . . . . . . . . . . . . . . . . . . . . . . . . . . . . . .
8
2.13 Engine power measurements . . . . . . . . . . . . . . . . . . . . . . . . . . . . . .
8
2.14 Common rail measurements . . . . . . . . . . . . . . . . . . . . . . . . . . . . . .
9
2.15 Pressure and vacuum measurements . . . . . . . . . . . . . . . . . . . . . . . . .
9
2.16 Temperature and air contitioner measurements . . . . . . . . . . . . . . . . . . .
9
2.17 Duty cycle measurements . . . . . . . . . . . . . . . . . . . . . . . . . . . . . . .
9
2.18 Leak current measurements . . . . . . . . . . . . . . . . . . . . . . . . . . . . . .
9
2.19 Relative compression tests . . . . . . . . . . . . . . . . . . . . . . . . . . . . . . . 10
2.20 Stable and smooth engine running measurements . . . . . . . . . . . . . . . . . . 10
Contents
I
2.21 Air Conditioning measurements . . . . . . . . . . . . . . . . . . . . . . . . . . . . 10
2.22 Turbo pressure control systems measurements . . . . . . . . . . . . . . . . . . . . 10
2.23 Frequency measurements . . . . . . . . . . . . . . . . . . . . . . . . . . . . . . . . 10
2.24 Top Dead Center determination measurements . . . . . . . . . . . . . . . . . . . 11
3 Brands
13
3.1
Search a car using the search dialog . . . . . . . . . . . . . . . . . . . . . . . . . 13
3.2
Search a car using lists . . . . . . . . . . . . . . . . . . . . . . . . . . . . . . . . . 15
3.3
Select the measurements . . . . . . . . . . . . . . . . . . . . . . . . . . . . . . . . 16
3.4
3.3.1
Measurement information . . . . . . . . . . . . . . . . . . . . . . . . . . . 19
3.3.2
Measurement types . . . . . . . . . . . . . . . . . . . . . . . . . . . . . . . 19
3.3.3
Controls . . . . . . . . . . . . . . . . . . . . . . . . . . . . . . . . . . . . . 20
The oscilloscope
. . . . . . . . . . . . . . . . . . . . . . . . . . . . . . . . . . . . 20
4 Help
23
5 Scope options
25
6 Measurement examples
27
6.1
No start problem . . . . . . . . . . . . . . . . . . . . . . . . . . . . . . . . . . . . 27
6.2
Holding back when idling . . . . . . . . . . . . . . . . . . . . . . . . . . . . . . . 28
6.3
More automotive diagnostic measurement examples . . . . . . . . . . . . . . . . . 29
6.3.1
Common . . . . . . . . . . . . . . . . . . . . . . . . . . . . . . . . . . . . 30
6.3.2
Miscellaneous . . . . . . . . . . . . . . . . . . . . . . . . . . . . . . . . . . 30
6.3.3
Sensors . . . . . . . . . . . . . . . . . . . . . . . . . . . . . . . . . . . . . 31
6.3.4
Actuators . . . . . . . . . . . . . . . . . . . . . . . . . . . . . . . . . . . . 34
6.3.5
Combination measurements . . . . . . . . . . . . . . . . . . . . . . . . . . 36
7 Quick Reference chart
39
8 A complete Automotive Diagnostics Kit
43
II
Automotive Test and Information System (ATIS)
1
The ATS5004D Automotive oscilloscope with the Automotive Test and Information System
(ATIS) application form a complete automotive diagnostic tool. ATIS contains many schematics, error code descriptions, location and functionality descriptions of many components and,
the most important, lab scope reference signals for every component and measurement. ATIS
is a complete reference for the mechanic while diagnosing complex automotive problems. In
ATIS, the ATS5004D Automotive oscilloscope can be launched with one click, the required
settings and reference signals are loaded automatically. The only thing left for the mechanic
is connecting the test leads and start the measurement. This approach of working with the
automotive oscilloscope ensures an optimal automotive oscilloscope measurement and is time
saving.
ATIS can be started in two ways, by double clicking the shortcut Start ATIS on the desktop
and through Start >Programs >ATIS >Start ATIS. The start screen of ATIS then appears,
see figure 1.1
Figure 1.1: ATIS start screen
For online information about ATIS see: www.tiepie-automotive.com/products/ATIS
Automotive Test and Information System (ATIS)
1
1.1 The main menu
It contains buttons for the following options of the ATIS automotive diagnostic system:
1.1.1
Basic scope
Clicking this button opens an extended menu with all standard automotive measurements. It also contains measurements for additional sensors and accessories.
To read more, go to chapter 2
1.1.2
Brands
Clicking this button opens the brands menu. Through the brands icons a specific
car, engine and motor management system can be selected. Schematics, measurements at component level, functioning of specific components example scope
signals and automotive lab scope connection information are available here. To
read more, go to chapter 3
1.1.3
Help
This button opens the help pages, with information to optimally use the automotive
oscilloscope. To read more, go to chapter 4
1.1.4
Scope options
This button opens the pages with information about the additional sensors and
accessories, to aid diagnosing car problems. To read more, go to chapter 5 and the
website about the automotive lab scope ATS5004D,
www.tiepie-automotive.com/products/Automotive scope ATS5004D.
2
Chapter 1
1.2 Navigation bar
At the top of the screen a gray navigation bar is visible, this navigation bar always stays in sight
while using ATIS. By clicking a button on this bar, quick navigating through ATIS is possible.
When hovering the mouse over an icon, explanatory text about the function of the button will
be shown.
Figure 1.2: ATIS navigation menu
The following buttons are found on the naviagtion bar:
Home brings you back to the main screen of ATIS.
Basic scope brings you to the automotive oscilloscope common menu.
Search brings you to a quick search screen where you can search for information per
brand, model, type and engine code.
Brands brings you the brand selection screen where you can search for information per
brand, model, type and engine code.
New opens a document with the latest additions in ATIS.
Help opens the ATIS and scope documentation in pdf. Requires a pdf reader to be
installed.
Close closes ATIS.
When in the Brands menu a motor management system is selected, an additional button
becomes available:
Active system The last selected motor management system for the selected car is brought
to front, to allow performing further measurements on this system.
Automotive Test and Information System (ATIS)
3
4
Chapter 1
2
Basic Scope
The Basic scope menu is a fast way to obtain information and perform measurements that are
not brand/model related. This can be very usefull when a specific car is not (fully) supported in
the brands section. This menu also contains settings and measurements related to the additional
sensors and accessories.
The Basic Scope menu is opened by clicking the button Scope in the main menu, see figure
2.1
Figure 2.1: ATIS main menu
This opens the following screen with options.
Figure 2.2: ATIS Basic Sccope menu
Basic Scope
5
2.1 Fault codes
This section allows to obtain information on fault codes. By entering the fault
code the corresponding information will be shown. When the fault code is available in the ATIS database, the meaning of the fault code will be shown, including
an explanation. Usually, also a diagram of the related component will be shown.
Only universal codes, like P0xxx codes are available. Brand specific codes are
available through the Brands menu. Select Brand >Model >Type >Motor management type. The brand specific codes can now be entered above the diagram.
In the current ATIS version, this button is not functional yet, it wil be come available with the
next ATIS update.
2.2 Intermittent fault finding
The button Intermittent fault finding opens a section that helps to capture
difficult problems that only occur intermittently. Many common measurement
situations are covered. These are divided in categories, diesel and petrol. Both
measurements with automatic trigger and manual trigger are available. With
manual trigger, the operator can stop the measurement by pressing the manual
trigger button or the space bar on the computer. This measurement is particularly
usefull for capturing problems while driving the car and analyzing the signals in
a later stage. Automatic trigger stops the measurement based on the measured
signals, e.g. when the fuel pump stops and thus the engine stops.
2.3 Engine Management Systems Petrol
The menu EMS Petrol is divided in Sensors and Actuators.
Sensors lists all sensors in groups. Examples are: Load sensor, rpm and/or position sensors. Select a group and a new sub group will come available. For load
sensors these are e.g. MAF sensor, MAP sensor, etc. When selecting a sub group,
common measurement information will be shown.
Actuators will list all actuator groups.
2.4 Engine Management Systems Diesel
The menu EMS Diesel is divided in Sensors, Actuators and Timing.
Sensors lists all sensors in groups. Examples are: Load sensor, rpm and/or position sensors. Select a group and a new sub group will come available. For load
sensors these are e.g. MAF sensor, MAP sensor, etc. When selecting a sub group,
common measurement information wil be shown.
Actuators will list all actuator groups.
Timing will list measurements to check and adjust the timing of EDC systems.
6
Chapter 2
2.5 ABS (Anti lock Breaking System)
The menu ABS is divided in Sensors, Actuators and Intermittent.
Sensors lists all ABS related sensors in groups. Select a group and a new sub
group will come available. When selecting a sub group, common measurement
information wil be shown.
Actuators will list all ABS related actuator groups.
Intermittent will show information and measurements for ABS related intermittent problems.
2.6 Ignition measurements
The menu Ignition is divided in primary and secundary measurements. In both,
divisions are made for the various ignition types. Select the proper ignition type
and the required settings are loaded into the automotive lab scope. Primary
measurements can be performed with cables directly or with 1:10 attenuators,
when indicated. Secundary measurements are performed with Ignition Pickup
TP-IP250 or with the Coil-on-Plug probe TP-COP750.
2.7 Current measurements
The Current menu consists of two sections. The first section is for the 80 A Current clamp TP-CC80. Various measurements with different maximum currents
are available. The second section is for the 600 A Current clamp TP-CC600. Various measurements with different maximum currents are available. This section
also includes a charge voltage current measurement. Before starting a current
measurements, the current clamp needs to be set and calibrated. Images accompanying the measurement will explain this.
2.8 CAN-bus measurements
The menu CAN-bus is divided in measurements for different CAN-bus systems.
Examples are High speed C-CAN-bus, Low speed A-CAN-bus, LIN-bus etc. For
each system, a quality measurement and a data trafic load measurement are
available.
Quality opens a short measurement giving a good impression of the message on
the CAN-bus.
Data transport opens a long measurement giving a good impression of the
amount of data trafic on the CAN-bus. This setting can be used to detect data overload.
Basic Scope
7
2.9 Ohm scope
The menu Ohm scope is for specific resitance measurements. Measurements
with different ohm scales are available. Important: before performing ohm
measurements, the Ohm scope requires calibration. For instructions, click the
buttn i (information).
2.10 Alternator measurements
The Alternator ripple menu consists of two groups. One group is for 12 Volt
and one group for 24 Volt systems. For each system, measurements for alternator
ripple and for charging voltage/current can be selected.
2.11 Connector and wire measurements
This menu contains multiple measurements. All measurements select a low voltage scale for an accurate display of voltage drop over connectors and wiring. See
also
www.tiepie-automotive.com/Measurement examples/Common/Connection Test.
2.12 Generic scope settings
Generic Scope allows to perform non autmotive related scope measurements
without having to make all settings. Available options are Live scope and
Transient recorder. Live scope measurements are most suitable for fast signals
like e.g. injector signals. Transient recorder measurements are most suitable for
slow signals like e.g. potentionmeters. For both options, settings for various
voltage ranges are available.
2.13 Engine power measurements
Measurements in the Power menu require an Accelerometer TP-ACC20. The
Accelerometer TP-ACC20 is connected to the rear of the instrument. To determine the power of the car, the total weight of the vehicle, including passager(s)
needs to be entered. The engine power test can then be executed by accelerating
the car a few times at maximum acceleration. These measurements cannot fully
replace a dynamometer, but do give a good impression of the current status. See
also www.tiepie-automotive.com/nl/Articles/Miscellaneous/PowerMeasurement.
8
Chapter 2
2.14 Common rail measurements
The menu Common rail can only be used win combination with the RFS 400
(Injector Return Flow Instrument) and FHP 400 (High Pressure Instrument).
RFS 400: Using the automotive oscilloscope the return flow of injectors can be
measured and compared. The RFS 400 can be extended with the CSR 100 to
measure the return flow of piezo injectors.
FHP 400: Using the automotive lab scope, the high pressure and the pump flow of
the common rail systme ca nbe measured. This allows to perform a fast diagnosis
on the high pressure part with the pump still installed in the vehicle.
2.15 Pressure and vacuum measurements
The Pressure menu requires the use of the APS 260 or FPS 700.
The APS 260 allows to measure air and turbo pressure using the automotive lab
scope. Also vacuum in the inlet manifold can be measured. Even pressure waves
in cylinders, caused by valves, can be detected, to verify proper operation of inlet
valves.
The FPS 700 allows to measure high pressures, up to 6 Bar. Think of fuel pressure
or high turbo pressures.
2.16 Temperature and air contitioner measurements
The Temperature menu requires the use of the TMS 150. This option allows
to measure four tempteratures simultaneously, using the scope. This can be used
to diagnose an air conditioner system. After extension with pressure sensors,
aircon systems can be fully checked. Overheating and undercooling cn be shown
automatically, for a quick diagnosis.
2.17 Duty cycle measurements
Duty cuycle allows to measure duty cycle driven signals and display the duty
cycle as a graph in the scope. The scope measures a longer time (recorder). This
way it is easy to check varying duty cycle signals of e.g. turbo valves and idle
control systems.
2.18 Leak current measurements
The menu Leak curent allows to perorm current measurements over a long time.
Measurements of one and twelve hours are available. The measuremnts are set
to a sensitive input range, to be able to detect and track hidden consumers.
Basic Scope
9
2.19 Relative compression tests
The menu Compression tests allows to check the difference in compression in
cylinders. Engines with two up to twelve cylinders can be tested. The relative
compression is measured using th estarting current. The best cylinder is assigned
100%, the others are compared to that cylinder. Results are shown in a bar graph.
See also
www.tiepie-automotive.com/Measurement examples/Miscellaneous/
Relative Compression Test.
2.20 Stable and smooth engine running measurements
The menu Stable running test allows to examine whether each cylinder contributes equally. By accurate measuring, it is possible to determine each increase
in rpm, per cylinder, per combustion. This is usually done in relation to a known
reference point, cylinder one.
For petrol systems, it is advised to use the ignition coil as reference point. For
diesel systems it is recommended to use an injector as reference point.
2.21 Air Conditioning measurements
The menu Air conditioning contains measurements specifically for air conditioning system sensors and actuators. It also includes measurements for the TMS
150 and APD 300, to verify the functionality of an air conditioning system.
2.22 Turbo pressure control systems measurements
The Control Systems menu contains a four channel measurement to diagnose
vacuum and presuure regulated control loops. This measurement also shows a
duty cycle signal as graph in the recorder. This measurement requires the APS
260. The following signals can be measured in one scope screen: turbo pressure
valve, turbo pressure sensor, MAF sensor and actual turbo pressure measured by
the APS 260.
2.23 Frequency measurements
The menu Frequency contains a measurement to convert the frequency of a
signal into a frequency graph. This allows to monitor the frequency change of a
signal during a longer time. This can be used to monitor the behaviour of Mass
Air Flow sensors and other frequency modulated components.
10
Chapter 2
2.24 Top Dead Center determination measurements
The menu TDC allows to determine the Top Dead Center (TDC) position of
an engine. After measuring the crankshaft signal, combined with battery voltage
and cranking the engine (without letting it start), the exact TDC position can be
determined in the crankshaft signal. In a next measurement, this TDC position
can be used in combination with e.g. ignition or injection for exact timing.
Basic Scope
11
12
Chapter 2
3
Brands
The menu Brands contains information that is specifically collected and measured by brand,
model and engine type. The measurements are performed on actual cars and when new cars are
introduced, these are measured as well and these measurements are added to the database. This
way, the database will grow to a large and important source of measurement and diagnostic
infomation. While trouble shooting this will aid the scope user as he can compare measured
signals to known correct signals.
3.1 Search a car using the search dialog
The Brands menu is opened by clicking the button Brands in the main menu, see figure 3.1
Figure 3.1: ATIS main menu
After the brands selection, a new selection menu for brands appears, see figure 3.2.
Figure 3.2: Brand selection menu
Select the required brand from the popup menu, we use Vokswagen as example. See figure 3.3
Brands
13
Figure 3.3: Selection Volkswagen
After selecting the brand, one of the following options needs to be selected:
1 Model: Select the required model from the drop down menu (e.g. Golf V)
2 Engine code: Select the required engine code form th edrop down menu (e.g. BAG)
3 Searching: Enter one of the following search keys:
Engine code (e.g. BAG)
System name (e.g. Motronic)
Type name (e.g. FSI)
4 System: Entering a motor management system can help narrowing the search fo a specific
vehicle
5 Fuel: Entering a fuel type can help narrowing the search for a specific vehicle
To speed up the search, enter as many information as possible. The list to select from is then
small. In our example, we search for a Volkswagen Golf V petrol, see figure 3.4
Figure 3.4: Selection Volkswagen Golf V petrol
When enough information is collected to search, a button Start search becomes available, see
1 . Clicking it will perform the search and show the search result(s).
When the engine code is required to search, but the location of the engine code is unknown,
clicking the button engine code 3 after the model search will show where the engine code
can be found.
14
Chapter 3
3.2 Search a car using lists
The button 2 in figure 3.4 offers a different way of searching a specific car, it uses overview
lists. Clicking it opens the overview shown in figure 3.5
Figure 3.5: Brands overview screen
From this overview, pick the brand that needs to be measured.
In our example, Volkswagen is selected. Click the Volkswagen button. A list of models, as
shown in figure 3.6 is shown.
Figure 3.6: Vokswagen model select screen
Brands
15
1 Back jumps to the previous screen, this simplifies fast browsing back
2 jumps back to the brand selection overview
3 double click a model to narrow the search
For our example, we select the Volkswagen Lupo.
Figure 3.7: Vokswagen Lupo type select screen
1 jumps back to the model selection overview
2 shows pphotographs of possible engine code locations
3 double click a type to narrow the selection. Each row contains type, engine code, production
year and fuel. This allows to select the exact car. The types are alphanumerically ordered
by fuel, starting with petrol and then diesel.
4 This column shows the engine codes.
For our example, we select the Volkswagen Lupo 1.4TDI AMF 55kW 05/’99 - 10/’99 Diesel.
3.3 Select the measurements
The correct car has now been selected, this opens the type screen shown in figure 3.8.
1 jumps back to the type selection overview
2 double click a system to perform measurements on that system.
16
Chapter 3
Figure 3.8: Vokswagen Lupo type select screen
From this selected type, information on the Engine Management System (EMS), the Anti lock
Breaking System (ABS) and the CAN-Bus system are available. It is also visible whether the
available information is originally from this specific car or information from a different car with
the same electrical system.
For our example we select the EMS Pump/Injector.
Figure 3.9: Vokswagen Lupo 1.4 TDi AMF type screen
This opens the type screen as shown in figure 3.9
Brands
17
1 The tab sheets allow fast toggling between schematics, component locations and measurements. The full electrical diagram is often divided in multiple parts in ATIS. These parts
are found on the tab sheets Diagram1, Diagram2, Diagram3 etc.
The tab sheet Location shows a photograph or figure with component numbers. The
numbers correspond with the numbers in the button column at the right of the screen.
This simplifies finding components in the vehicle.
After selecting technical information (e.g. component selection or fault code information),
a tab sheet is added for easy navigation.
2 This input box allows to enter brand specific or EOBD fault codes. The ATIS database
is then checked for relevant information. When available in ATIS, a detailed explanation
of the meaning of the fault code is given, usually accompanied by a diagram and possible
causes. This makes working with fault codes a lot more understandable.
3 This button column allows to select a specific component. Selecting one will open a new
screen with information and measured values for that component.
The text on the button can be blue, green or black.
• Blue: information originally for this specific car or a car with the same electrical
system.
• Green: Generic scope settings
• Black: Component is not selectable yet, select another.
The diagrams have a number of tool buttons, found in the upper left corner:
Restore the original Diagram size
Zoom in on the diagram
Zoom out on the diagram
Print the diagram
For our example we select the component 034 EGR Duty cycle solenoid, which opens a
screen as shown in figure 3.10
18
Chapter 3
Figure 3.10: Measurement 034 EGR Duty cycle solenoid
3.3.1
Measurement information
1 These photographs show at which terminals of the component the automotive oscilloscope
needs to be connected.
Left click the photograph to get a popup screen with information on the specific component. This information describes the component, how it functions, what signals it has and
what power it requires.
Note: The photographs shows the use of piercing probes. These are no longer used, use
the special TiePie engineering TP-BP85 Back probes instead.
2 The image shows how the oscilloscope and test leads need to be connected to the component
(number of channels, which test pin or clamp, whether or not attenuators are required).
Left click the image to get a popup screen with a written description on how to connect
the automotive lab scope and test leads.
3 The tab sheets allow to view different aspects of the component. Each different measurement
that can be performed on the component has its own tab sheet with measured values and
connecton diagrams.
3.3.2
Measurement types
The following types of measurements are available through the tab sheets:
• Measurement: Combi This is a measurement of two or more signals of the selected
component and a different component. It can be e.g. a two channel measuremnt on a
crankshaft signal and a camshaft signal. This measurement is usefull in examining timing
problems between crankshaft and camshaft.
Brands
19
• Measurement: Continuous Each component in ATIS has a continuous measurement
defined. This measurement allows to measure the component’s signal(s) continuously
over a longer time, without data loss. This measurement is very usefull for capturing
intermittent problems with a component; it can be triggered by a manual trigger button
or the space bar.
• Measurement: Signal This is usually a standard single channel scope measurement on
the component’s main signal. It is the default measurement that is selected when the
component screen is opened.
• Measurement: Power supply This measurement allows to check the component’s
power supply(s). When a passive component is selected that has no power supply, this
measurement is not available.
• Measurement: Resistance When the selected component is resistance based, e.g. a
throttle position potentiometer, a resistance measurement is available to check the component’s resistance using the Ohm scope.
• Test sheet Opens a screen with exact measurement values for this component, measured
in different circumstances.
• Any other component specific measurements
3.3.3
Controls
Below the images in the component screen, four buttons are found:
opens a screen that describes the measurement conditions. Each component has its
own measurement conditions, in which it needs to be measured, like e.g. while cranking, while
accelerating, while idling or dusing cruising. When these conditions are met, the measurement
can be compared to the reference signals included in ATIS.
launches the Multi Channel oscilloscope software. The automotive oscilloscope is
started with the correct settings and reference signals loaded for this particular measurement
opens a screen with the Diagnostic information for this component. This information
explains what the possible defects can be wit hcertain measured values. This info can be a great
help when trouble shooting and can inform what is to be measured next to find the exact cause
of the problem.
opens the Help screen for the scope. It explains the most common functions and buttons
in the scope.
3.4 The oscilloscope
The scope is best started through the ATIS program. After selecting the scope button in the
component screen, the Multi Channel oscilloscope software is launched and the automotive
oscilloscope is loaded with the correct settings and reference signals.
The Multi Channel oscilloscope software has a good Auto setup function. This function examines the signal and determines the best settings to display the signal properly. This functions
well, provided that the signals have the correct values and that the component does not intermittently show disturbances. When the signal differs from the expected signal, the technician
will not always easily recognize this, as the automotive lab scope is constantly changing its
20
Chapter 3
settings. Therfore it was decided not to use the auto setup function and only use predefined
fixed settings in combination with a reference signal. Only then the measured signal can be
safely compared to the reference signal and a proper diagnose can be made.
Figure 3.11: Scope settings
Figure 3.11 shows a scope setting loaded after clicking the Scope button in ATIS. This is a
combined measurement of a crankshaft signal and a camshaft signal. The gray signals are the
two reference signals of the sensors.
The
button in the graph toolbar is used to show or hide the reference signals.
Brands
21
22
Chapter 3
4
Help
The menu Help contains reference documentation on ATIS and the automotive oscilloscope.
The Help menu is opened by clicking the button Help in the main menu, see figure 4.1
Figure 4.1: ATIS main menu
The documentation is opened as PDF document. This requires a PDF reader to be installed on
the computer. If no PDF reader is installed, the ATIS DVD contains a free PDF reader. After
installing this the documentation can be read.
Help
23
24
Chapter 4
5
Scope options
The menu Scope options contains information on the additional sensors and accessories for
the automotive oscilloscope.
The Scope options menu is opened by clicking the button Scope options in the main menu, see
figure 5.1
Figure 5.1: ATIS main menu
This menu shows all developments and full descriptions and specifications.
Scope options
25
26
Chapter 5
Measurement examples
6
The setup for intermittent problems is preferred when trouble shooting problems that occur
during driving, starting or idling. All four channels are then connected to important components
that are essential for a good running engine, but that may cause the problem.
A few real life measurement examples are shown that were performed on car systems that failed
occasionally or constantly. The setup using the manual trigger can be used in most situations.
6.1 No start problem
Figure 6.1 shows the complete signals when starting the engine of a car with a starting problem.
The power line and the ground for the fuel pump and a valve control signal are measured.
Figure 6.1: Full signal when starting
Because of the high sample frequency and the large amount of samples, it is possible to zoom
in very far, without losing detail. When is zoomed in on one of the valve control pulses, see
figure 6.2 the problem becomes visible. The positive power for the fuel pump drops to just 5
Volt. The ground level rises about 0.7, leaving just 4.5 Volt power for the fuel pump, instead
of 12 Volt. This causes the pump to fail and the engine not to start
Measurement examples
27
Figure 6.2: Zoomed in to problem area
6.2 Holding back when idling
This example shows measurements on a car with an engine that occasionally holds back when
idling. Crankshaft, camshaft, injector and ignition coil were measured. Using a special feature
of the Multi Channel oscilloscope software, an rpm graph is created from the crankshaft signal
and also displayed.
Figure 6.3: Full signal when idling, engine holds back
28
Chapter 6
The measurement shown in figure 6.3 clearly shows a drop in the rpm, also visible in the
crankshaft signal.
Figure 6.4: Zoomed in to rpm drop
When zooming in to the area where the engine rpm drops (see figure 6.4), it appears that all
signals are present and in good order. Problem searching went on and in the end it appeared
that the MAF sensor was defective.
6.3 More automotive diagnostic measurement examples
This TiePie automotive diagnostics section shows
measurement examples from a number of sensors
and actuators that are used in the automotive
industry. The examples explain how the sensors
and actuators work and how the lab scope needs
to be setup in order to measure their signals and
check for correct functioning.
For each sensor and actuator a diagram is included, showing the connections to the ECU,
power supply and other components. Also the
measuring positions are shown in the diagram.
A picture shows how to connect the Automotive scope ATS5004D with a Measure lead TPC1812B and Back Probe TP-BP85 to the sensor or actuator.
The examples are all found on the TiePie Automotive website
www.tiepie-automotive.com/Measurement examples.
Measurement examples
29
6.3.1
Common
In these articles, extra functionality of the Multi Channel oscilloscope software for measuring
on sensors and actuators is described.
Performing a SureConnect connection test
The connection test function of the Multi Channel oscilloscope software is briefly
explained, with explanation how to do a connection test.
Read the article on
www.tiepie-automotive.com/Measurement examples/Common/Connection Test
Performing a recorder mode measurement
The recorder mode of the Multi Channel oscilloscope software is briefly explained,
with an example of its use during a measurement on sensors and actuators.
Read the article on
www.tiepie-automotive.com/Measurement examples/Common/Recorder Mode
Performing a resistance measurement
The resistance measurement in the Multi Channel oscilloscope software is briefly explained.
Read the article on
www.tiepie-automotive.com/Measurement examples/Common/Resistance Measurement
Performing an intermittent fault measurement
Instructions for performing an intermittent fault measurement with an automotive
oscilloscope, with explanation and example.
Read the article on
www.tiepie-automotive.com/Measurement examples/Common/Intermittent fault measurement
6.3.2
Miscellaneous
Miscellaneous measurements with measured data.
Performing a power measurement
Engine power measurement (kW and hp) with accelerometer and lab scope, performed
while driving a vehicle, without dyno or other test facilities.
Read the article on
www.tiepie-automotive.com/Measurement examples/Miscellaneous/Power Measurement
30
Chapter 6
Performing a relative compression test
The relative compression test in the Multi Channel oscilloscope software is briefly
explained, with instructions on how to perform a relative compression test with just
a lab scope and current clamp.
Read the article on
www.tiepie-automotive.com/Measurement examples/Miscellaneous/Relative Compression Test
6.3.3
Sensors
This list contains measurements on common automotive sensors with measured data.
Manifold Absolute Pressure (MAP) sensor
With a lab scope a Manifold Absolute Pressure (MAP) sensor is measured under the
following conditions: key on, cranking, idle, 2000 RPM, 3000 RPM and back to idle
with an engine at operating temperature. The signal from the sensor is shown and
can be downloaded. To help determining whether a MAP sensor is functioning correctly, different
possible deviations from the example signal are mentioned along with probable causes.
Read the article on
www.tiepie-automotive.com/Measurement examples/Sensors/MAP Sensor
Mass Air Flow (MAF) hot wire sensor
With a lab scope a Mass Air Flow (MAF) sensor is measured under the following
conditions: key on, cranking, idle, 2000 RPM, 3000 RPM and back to idle with an
engine at operating temperature. The signal from the sensor is shown and can be
downloaded. To help determining whether a MAF sensor is functioning correctly, different possible
deviations from the example signal are mentioned along with probable causes.
Read the article on
www.tiepie-automotive.com/Measurement examples/Sensors/MAF HotWire
Mass Air Flow (MAF) vane sensor
With a lab scope an air flow sensor is measured under the following conditions: key
on, cranking, idle, 2000 RPM, 3000 RPM and back to idle with an engine at operating
temperature. The signal from the sensor is shown and can be downloaded. To help
determining whether an air flow sensor is functioning correctly, different deviations from the example
signal are mentioned along with possible causes.
Read the article on
www.tiepie-automotive.com/Measurement examples/Sensors/MAF Airvane
Measurement examples
31
Camshaft sensor Hall
With a lab scope a Hall effect camshaft sensor is measured during cranking of an
engine. The signal from the sensor is shown and can be downloaded. To help determining whether a Hall effect camshaft sensor is functioning correctly, different possible
deviations from the example signal are mentioned along with probable causes.
Read the article on
www.tiepie-automotive.com/Measurement examples/Sensors/Camshaft Sensor Hall
Camshaft sensor inductive
With a lab scope an inductive camshaft sensor is measured during cranking of an
engine, as well as during idling. The signal from the sensor is shown and can be
downloaded. To help determining whether an inductive camshaft sensor is functioning
correctly, different possible deviations from the example signal are mentioned along with probable
causes.
Read the article on
www.tiepie-automotive.com/Measurement examples/Sensors/Camshaft Sensor Inductive
Acceleration pedal sensor
With a lab scope an acceleration pedal position sensor is measured with the key
turned on and no running engine. The signal from the sensor is shown and can
be downloaded. To help determining whether an acceleration pedal position sensor is
functioning correctly, different possible deviations from the example signal are mentioned along with
probable causes.
Read the article on
www.tiepie-automotive.com/Measurement examples/Sensors/Acceleration Pedal Sensor
Coolant temperature sensor
With a lab scope a coolant temperature sensor is measured from an engine in a warming
up stage. The signal from the sensor is shown and can be downloaded. To help
determining whether a coolant temperature sensor is functioning correctly, different
possible deviations from the example signal are mentioned along with probable causes.
Read the article on
www.tiepie-automotive.com/Measurement examples/Sensors/Coolant Temperature Sensor
32
Chapter 6
Crankshaft sensor Hall
With a lab scope a Hall effect crankshaft sensor is measured during cranking of an
engine. The signal from the sensor is shown and can be downloaded. To help determining whether a Hall effect crankshaft sensor is functioning correctly, different
possible deviations from the example signal are mentioned along with probable causes.
Read the article on
www.tiepie-automotive.com/Measurement examples/Sensors/Crankshaft Sensor Hall
Crankshaft sensor inductive
With a lab scope an inductive crankshaft sensor is measured during cranking of an
engine, as well as during idling. The signal from the sensor is shown and can be downloaded. To help determining whether an inductive crankshaft sensor is functioning
correctly, different possible deviations from the example signal are mentioned along with probable
causes.
Read the article on
www.tiepie-automotive.com/Measurement examples/Sensors/Crankshaft Sensor Inductive
Throttle valve position sensor single
With a lab scope a throttle valve position sensor is measured with the key turned on
and no running engine. The signal from the sensor is shown and can be downloaded.
To help determining whether a throttle valve position sensor is functioning correctly,
different possible deviations from the example signal are mentioned along with probable causes.
Read the article on
www.tiepie-automotive.com/Measurement examples/Sensors/Throttle Valve Position Sensor Single
Throttle valve position sensor dual
With a lab scope a throttle valve position sensor is measured with the key turned on
and engine off. The signal from the sensor is shown and can be downloaded. To help
determining whether a throttle valve position sensor is functioning correctly, different
possible deviations from the example signal are mentioned along with possible causes.
Read the article on
www.tiepie-automotive.com/Measurement examples/Sensors/Throttle Valve Position Sensor Dual
Measurement examples
33
Lambda sensor (zirconia)
With a lab scope a zirconia lambda sensor is measured on an idling engine at operating
temperature. The signal from the sensor is shown and can be downloaded. To help
determining whether a zirconia lambda sensor and its heating is functioning correctly,
different possible deviations from the example signals are mentioned along with probable causes.
Read the article on
www.tiepie-automotive.com/Measurement examples/Sensors/Oxygen Sensor Zirconia
Broadband lambda sensor
With a lab scope a broadband oxygen sensor signal voltage is measured. The sensor
signal is shown and can be downloaded. To help determining whether the broadband
oxygen sensor is functioning correctly, different deviations from the example signal are
mentioned along with possible causes.
Read the article on
www.tiepie-automotive.com/Measurement examples/Sensors/Oxygen Sensor Broadband
ABS sensor inductive
With a lab scope an inductive ABS sensor is measured on a wheel that is turned by
hand. The signal from the sensor is shown and can be downloaded. To help determining whether an inductive ABS sensor is functioning correctly, different possible
deviations from the example signal are mentioned along with possible causes.
Read the article on
www.tiepie-automotive.com/Measurement examples/Sensors/ABS Sensor Inductive
6.3.4
Actuators
This list contains measurements on common automotive actuators with measured data.
Canister purge valve
With a lab scope a canister purge valve signal voltage is measured on an idling engine
at operating temperature. The signal from the sensor is shown and can be downloaded.
To help determining whether the canister purge valve is functioning correctly, different
possible deviations from the example signal are mentioned along with possible causes.
Read the article on
www.tiepie-automotive.com/Measurement examples/Actuators/Canister Purge Valve
34
Chapter 6
Indirect injection current
With a lab scope an injector current is measured on an idling engine at operating
temperature. The measured current is shown and can be downloaded. To help determining whether the injector is functioning correctly, different possible deviations from
the example signal are mentioned along with possible causes.
Read the article on
www.tiepie-automotive.com/Measurement examples/Actuators/Indirect Injection Current
Indirect injection voltage
A lab scope is used to measure an injector signal voltage on an idling engine at operating temperature. The signal from the sensor is shown and can be downloaded.
To help determining whether the injector is functioning correctly, different possible
deviations from the example signal are mentioned along with possible causes.
Read the article on
www.tiepie-automotive.com/Measurement examples/Actuators/Indirect Injection Voltage
Direct injection servo hydraulic voltage and current
Lab scope measurement of servo hydraulic injector voltage and current on an idling
engine at operating temperature. The measured voltage and current is shown and can
be downloaded. To help determining whether the servo hydraulic injector is functioning correctly, different possible deviations from the example signal are mentioned along with possible
causes.
Read the article on
www.tiepie-automotive.com/Measurement examples/Actuators/
Direct Injection ServoHydraulic Voltage Current
Direct petrol-injection voltage and current
Lab scope measurement of direct petrol injector voltage and current on an idling
engine at operating temperature. The signals from the direct petrol injector are shown
and can be downloaded. To help determining whether the direct petrol injector is
functioning correctly, different deviations from the example signal are mentioned along with possible
causes.
Read the article on
www.tiepie-automotive.com/Measurement examples/Actuators/
Direct Petrol Injection Voltage Current
Measurement examples
35
Throttle valve control motor DC
With a lab scope a throttle valve control motor signal voltage is measured with the
key on and engine off. The signal from the actuator is shown and can be downloaded.
To help determining whether the throttle valve control motor is functioning correctly,
different deviations from the example signal are mentioned along with possible causes.
Read the article on
www.tiepie-automotive.com/Measurement examples/Actuators/Throttle Valve Position DC Motor
COP ignition
With a lab scope a COP ignition is measured with a Coil-on-Plug probe TP-COP750.
The signal from the COP ignition is shown and can be downloaded. To help determining whether the COP ignition is functioning correctly, different deviations from
the example signal are mentioned along with possible causes.
Read the article on
www.tiepie-automotive.com/Measurement examples/Actuators/COP Ignition
6.3.5
Combination measurements
This list contains measurements on combinations of common automotive actuators and sensors
with measured data.
Fuel pressure sensor and fuel metering valve
With a lab scope a fuel pressure sensor and fuel metering valve signal voltage are
measured on an engine under various conditions. The signal from the fuel pressure
sensor and metering valve are shown and can be downloaded. To help determining
whether the fuel pressure sensor and metering valve are functioning correctly, different deviations from
the example signal are mentioned along with possible causes.
Read the article on
www.tiepie-automotive.com/Measurement examples/CombinationMeasurements/
Fuel Pressure Sensor And Metering Valve
EGR valve DC motor and position sensor
Lab scope measurement of an EGR valve position DC motor and position sensor on an
engine under various conditions. The signal from the DC motor and position sensor
are shown and can be downloaded. To help determining whether the EGR valve is
functioning correctly, different deviations from the example signal are mentioned along with possible
causes.
Read the article on
www.tiepie-automotive.com/Measurement examples/CombinationMeasurements/
EGR Valve Position DCMotor And Sensor
36
Chapter 6
Turbo pressure regulation system
Lab scope measurement of a turbo charge pressure regulation system on a car during
acceleration. The signals from the turbo charge pressure regulation system are shown
and can be downloaded. To help determining whether the turbo charge pressure
regulation system is functioning correctly, different deviations from the example signals are mentioned
along with possible causes.
Read the article on
www.tiepie-automotive.com/Measurement examples/CombinationMeasurements/
TurboChargePressureRegulation
Measurement examples
37
38
Chapter 6
Quick Reference chart
7
The next pages show a Quick Reference chart for the Multi Channel oscilloscope software.
It shows the most used options and controls.
Quick Reference chart
39
General Settings
Start/stop measurement (click on the screen first).
Zoom in on time scale.
Zoom out on time scale.
Scroll through the zoomed in pattern (move right).
Scroll through the zoomed in pattern (move left).
Undo zoom, one step each time.
fully zoom out (time scale only).
Connection test (check if the probe makes contact with the wire).
To trigger the recording and display it on the screen (in live scope only).
Triggering can be repeated because the scope is still recording in the
background.
Press the cross button in the right corner to exit the scope.
Sample rate (kHz)
The combination of the amount of samples buffered and sample rate decides the total
measuring time on the screen. Example: The time between each measuring point with a
sample rate of 125kHz is (1/125000) 0.008 mSec. The total timescale = 0.008 * 2000
measuring points = 16 mSec.
‘One Shot’ measuring. Press the ‘one shot’ button to make a one screen recording.
‘Start/stop’ measuring. Key ‘S’ Start/stop (click on the
screen first).
Amount of samples (measurement points) on the screen.
‘Quit Scope’
‘S’
‘Arrow Up’
‘Arrow down’
‘Arrow right’
‘Arrow left’
‘U’
‘T’
‘C’
‘Spacebar’
Shortcuts
Click on the channel you want to add and drag it into the window.
Time out is when the signal height does not exceed the
scope’s trigger within a certain amount of (trigger time out)
time, the scope will start writing a signal on the screen.
Adjust sample rate.
Decrease/increase time per
division (Live scope only)
Show connection test
window
‘Print’ pattern
Tool settings
Re-load button. This will restore the saved settings and sample pattern again.
Attach pattern automatically to an e-mail.
Option ‘Save’ to save a pattern.
In the sub menus under ‘File’ are various general controls and edits.
Add Channel
Menu bar MultiChannel software
Measuring on the screen
Use ‘cross hairs’ (measurement window).
Erase all measurements on screen
Click on this button to copy the recorded pattern to reference.
Sample pattern visible/non visible.
Add a comment baloon into the scope screen.
Channel-adjustments
Changing volt scale (will deactivate auto
range automatically).
Activate ‘auto range’.
SelectAC- DC and resistance measurement.
Adjust settings
Show ‘instrument ribbon’. Click on the arrow to open the instrument ribbon.
Right click to adjust e.g volt scale settings, scale range etc.
To change volt scale click on a voltage and drag it up or down.
Time scale has been zoomed in to the left. The full recording returns by clicking
the ‘T’ key.
Zoom function
It is possible to zoom in and out by ‘grabbing’ the edges of the scroll bar with
the mouse and drag the edge of the scroll bar to where you prefer. To zoom
in on a section, drag a rectangle around the area of interest and let go of the
mouse button.
Zoomed in section. If you want to return to previous zoom or
full screen press on the ‘U’ key (undo). It may be necessary to
undo zoom several times.
The more experienced scope user can make adjustments. We recommend using the scope menu in ATIS under the
button ‘Generic scope’, where you can select the pre-settings which you prefer and further adjust them to your own
wishes.
“Generic scope” button
42
Chapter 7
A complete Automotive Diagnostics Kit
8
All tools an automotive specialist needs.
Motor management systems in cars get more and more sophisticated. When these sophisticated systems malfunction, sophisticated measuring equipment is required to
locate the cause of the problem. With the TiePie engineering Automotive Diagnostics Kit, the automotive specialist obtains all necessary tools to perform most of the
diagnostic tests to locate the problem, all conveniently
packed in a protective case.
The contents of this versatile Automotive Diagnostics Kit
are:
1
Automotive scope ATS5004D
4
Measure lead TP-C1812B
1
Back Probe TP-BP85 - Set
2
Ignition Pickup TP-IP250
1
Current clamp TP-CC80
1
Current clamp TP-CC600
1
Accelerometer TP-ACC20
4
Differential attenuator TP-DA10
1
Alligator Clip TP-AC50B Set
1
ATIS Lite
1
Carry case BB451
50 MS/s four channel automotive oscilloscope with differential inputs, SureConnect resistance measuring, 50
MHz bandwidth, 12 bit and 128 KS memory.
3 m long, BNC to banana, low noise differential measure
lead.
8 thin and flexible back probes, 1000 V CAT III with 4
mm banana socket.
Capacitive secondary ignition pickup to be clamped on
a spark plug wire.
80 A current clamp with 2% accuracy and 4 mm
shrouded banana sockets.
600 A current clamp with 3% accuracy and 4 mm banana
sockets.
Accelerometer with 2 axes, 2 g range with 420 mV/g
sensitivity.
Differential 1:10 attenuator, rated 300 V with 25 MHz
bandwidth.
5 alligator clips with 10 mm clamping range and 4 mm
banana socket, rated for up to 60 V.
Automotive Test and Information System is a comprehensive knowledge base with information to help the automotive technician diagnose car problems.
Carry case for all above mentioned items.
See also: www.tiepie-automotive.com/products/Automotive Diagnostics Kit
A complete Automotive Diagnostics Kit
43
If you have any suggestions and/or remarks regarding this manual, please contact:
TiePie engineering
Koperslagersstraaat 37
8601 WL SNEEK
The Netherlands
Tel.:
Fax:
E-mail:
Site:
+31 515 415 416
+31 515 418 819
[email protected]
www.tiepie-automotive.com