1
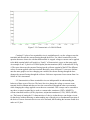
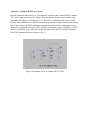
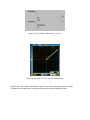
Edit the simulation command to match the values shown in fig. 11. Note that a second source
needs to be swept as well. The second source is the voltage applied to the base. Note that the
number of steps for the second source is the number of curves that will appear in the final plot.
One can use as many steps as desired but if the steps are too close together the plot will appear
too busy. It is better to pick a few key points. The second source is stepped from 0 to 2V in
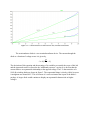
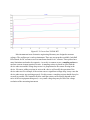
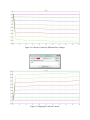
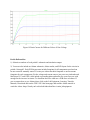
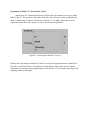
increments of 0.2V resulting in 10 curves. Plotting the current through the collector gives the
result shown in fig. 12.
Figure 11 DC Sweep for BJT I-V Plots
Figure 12 Collector Current for Different Base Voltages