1
Experiment 2: Diode I-V Characteristic Curves
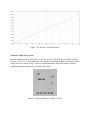
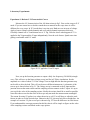
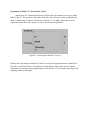
Measure the I-V characteristics for the 1N4148 diode. An example test set-up is shown
below in fig. 23. The procedure is the same as for the resistor. However, keep in mind that the
diode’s voltage range of interest is fairly low around 0-1.5V. At high voltages there will be
significant current flow and it may be excessive for the function generator.
Figure 23 Test-Set-up for Diode I-V Curves
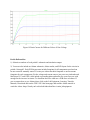
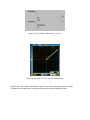
Print out the scope image and label the X and Y axes with the appropriate units by hand. Since
the diode is a non-linear device it is difficult to really define a single value of error. Instead,
comment on if you can see the straigthening out of the diode’s I-V curve and to what degree the
sampling resistor is affecting it.