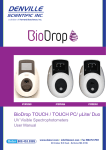
1
User’s Manual Quawell Quawell Q5000 UV-Vis SPECTROPHOTOMETER USER’S MANUAL V1.0.1 Rev 07-01-2010 -1- User’s Manual Quawell CONTENTS 1. Overview .................................................................................................. 5 What Is The Q5000 ................................................................................... 5 How to Operate ....................................................................................7 2. The Patent-Pending Technologies ........................................................ 8 3. Installation ...............................................................................................9 Computer Requirements ...........................................................................9 Software Setup .........................................................................................9 4. Main Menu ..............................................................................................10 The Measurement Tab............................................................................10 The Tools Tab .........................................................................................10 5. Application module interface...................................................................13 Checkbox Panel........................................................................................13 Current Data Display Windows.................................................................13 Main Function Panel.................................................................................13 Graph Area...............................................................................................13 Data Table................................................................................................13 6. Saving the Data and information.............................................................14 7. Nucleic Acids .........................................................................................15 Overview ..................................................................................................15 Nucleic Acid Screen Features ..................................................................15 Measurement Range ...............................................................................17 Sample Volume ........................................................................................17 8. Microarray ...............................................................................................18 Overview ..................................................................................................18 -2- User’s Manual Quawell Microarray Screen Features .....................................................................18 Measurement Range ...............................................................................20 9. Protein A280 ...........................................................................................21 Overview ..................................................................................................21 Protein 280A screen features ...................................................................21 Measurement Range ...............................................................................23 10. Labeled Proteins ....................................................................................24 Overview ..................................................................................................24 Proteins and Labels screen features ........................................................24 Measurement Range ...............................................................................26 11. UV-Vis Measurement .............................................................................27 Overview ..................................................................................................27 UV-Vis Measurement screen features .....................................................27 12. Cell Cultures ...........................................................................................29 Overview ..................................................................................................29 Cell Culture Module Screen Features ......................................................29 13. The Predefined Fluorescent Dyes List .................................................31 Dye Editor ................................................................................................31 14. Light Integration .....................................................................................32 Adjust the light integration ........................................................................33 15. Potential Sources of Error ....................................................................34 Sample Overlap .......................................................................................34 Sample Homogeneity..............................................................................34 Effect of evaporation ................................................................................35 Insufficient sample volume .......................................................................35 16. Troubleshooting.....................................................................................36 -3- User’s Manual Quawell USB Connection Error..............................................................................36 Sample Accuracy and Reproducibility ......................................................36 17. Maintenance ............................................................................................37 18. Appendices .............................................................................................38 A. Instrument specifications .....................................................................38 B. Absorbance calculation ........................................................................39 C. Concentration Calculation (Beer’s Law) ..............................................40 D. Contact Information .............................................................................41 -4- User’s Manual Quawell 1. OVERVIEW What Is The Q5000? Quawell Q5000 is a micro-volume UV-Vis spectrophotometer. Its full spectrum (200-850nm) allows Q5000 to measure nucleic acids, microarray probes, purified proteins, and fluorescent and fluorescently-dyed proteins; monitor the density of suspended cellular, bacterial and yeast cultures; and perform general laboratory UV-Vis absorbance measurements. A unique technology used in the Q5000 holds 0.5-2.5 ul samples between upper and lower measurement surfaces without the use of a cuvette, and measures the sample in about 5 seconds with a high degree of accuracy and reproducibility. How to Operate Operation of the Q5000 is simple and efficient. The Q5000 automatically performs all necessary measurements and calculations. The data are accumulated in the module data window and are easily exported to an Excel spreadsheet. 1. Lift the upper arm, add 2-2.5 ul sample to the lower measurement surface and close the upper arm. -5- User’s Manual Quawell 2. Click the “Measure” button to complete all measurements and calculations. 3. Lift the upper arm and remove the sample from both upper and lower surfaces with soft dry paper. -6- User’s Manual Quawell 4. Export the data to an Excel worksheet by clicking the “Report” button. -7- User’s Manual Quawell 2. THE PATENT-PENDING TECHNOLOGIES Figure 1: Initially the sample is loaded and the upper arm is closed. Figure 2: The upper arm is lifted by the actuator, due to molecular effects, the sample is broken into two separate parts, one part is attached to lower surface and the other part is attached to upper surface. Figure 3: After reaching its home position, the upper arm is lowered. A liquid column is formed when the upper arm is lowered to the position where the two droplets touch. The measurement is then performed at this position without moving the upper arm upwardly again. -8- User’s Manual Quawell 3. INSTALLATION Computer Requirements Microsoft Windows XP, Vista or later Microsoft Office 2003 or later CPU: 400MHZ or higher 64MB RAM USB port Monitor: 1024x768 Software Setup Note: Do not connect Q5000 to PC before installing the software. Insert the CD into CD driver and double click the file “setup” in the folder CD-RAM\Q5000 V1.0.0. Follow the prompts to finish installation of the software. Connect Q5000 to PC with the USB cable and the driver will be installed automatically. “Version Conflict” If you install Q5000 software in a computer with Windows Vista, please click option “Yes” when “Version Conflict” message appear as below: “A file being copied is older than the file currently on your system. It is recommended that you keep your existing file. Do you want to keep this file?” -9- User’s Manual Quawell “Abort”, “Retry” and “Ignore” option When you see a message that requires you select from options “Abort”, “Retry” or “Ignore”, please click option “Ignore” and continue to install Q5000 software. - 10 - User’s Manual Quawell 4. MAIN MENU Q5000 main menu contains two tabs, the Measurement tab and the Tools tab. The default is Measurement tab. The “Exit” buttons in both tabs will exit the Q5000 program. The Measurement tab: 1. Nucleic Acids 2. Microarray 3. UV-Vis Measure 4. Protein A280 5. Labeled Protein 6. Cell Culture - 11 - User’s Manual Quawell The Tools tab: 1. Light Integration: Allows the user to adjust the light integration. 2. Dye List: edit the dye data Software Version Number: it is on the top right side of the menu. Please check our website www.quawell.com on the bottom of the main menu for software upgrades and product news. - 12 - User’s Manual Quawell 5. APPLICATION MODULE INTERFACE The following is the Q5000 sample measurement user interface. The window is divided into five different areas: Checkbox panel Current data display windows Graph area Main function panel Data table 1. Checkbox Panel: contains online-help and other options. The user can select the option based on the particular need. 2. Current data display windows: display the data and information of the sample being measured. 3. Main function Panel: contains all main functions for sample measuring and data handling. 4. Graph area: displays the absorbance (Y-axis) and spectrum ( X-axis). 5. Data Table: used for holding and displaying the accumulated data. The maximum number of rows is 1000. - 13 - User’s Manual Quawell 6. SAVING THE DATA AND INFORMATION Note: Q5000 program does not save the data automatically. All data and information for the sample being measured will be lost if it is not saved. User can save the data using the “Report” function to export the data from the data table to an Excel spreadsheet. - 14 - User’s Manual Quawell 7. NUCLEIC ACIDS Overview The Q5000 measures nucleic acid absorbance, automatically calculates concentration, and displays the data on the screen. Nucleic Acid Screen Features Select Nucleic Acid from the Q5000 main menu and the user interface shown below will appear on the screen. 340 nm Baseline: the absorbance of nucleic acid at 340nm should be very - 15 - User’s Manual Quawell nearly zero. If the Baseline option is checked, the absorbance value of the baseline is subtracted from the absorbance at 260 nm and all spectra are referenced to this zero. The default value is check. Graph Display: The Y-axis indicates the absorbance value and the X-axis is for the wavelength. The maximum absorbance value is automatically adjusted to the highest absorbance value. The user is also allowed to manually enter the absorbance value. Sample ID - #: there are two windows that display the sample ID information. The left window displays the sample ID input by the user. The default is “My Sample”. The right window displays the ID number for that sample ID. The ID number begins at 1 and increases by 1 for each measurement. Changing the Sample ID will automatically reset the ID number to 1. Sample Type – EC: chose the sample type for the sample to be measured. There are 3 different sample types for nucleic acids: dsDNA, ssDNA and RNA. The default is dsDNA. The sample type is disabled after blanking. The extinction coefficient of the sample selected will appear in the EC window. SW and Abs (10mm): user selected wavelength and corresponding absorbance. The selected wavelength and absorbance are not utilized in any calculations. 260 nm Abs (10mm): absorbance of the sample at 260 nm. 280 nm Abs (10mm): absorbance of the sample at 280 nm. - 16 - User’s Manual Quawell 260/280: ratio of absorbance at 260 nm and 280 nm. 260/230: ratio of absorbance at 260 nm and 230 nm. ng/ul: sample concentration in ng/ul. Measurement Range (dsDNA) Concentration 1 to 5000 ng/ul Reproducibility 1-100 ng/ul >100 ng/ul 2 ul Abs accuracy (1 mm) 2% 2% Sample Volume There is no specific requirement for the sample volume; however for the best accuracy and reproducibility we recommend 2-2.5ul. - 17 - User’s Manual Quawell 8. MICROARRAY Overview The Microarray module analyzes fluorescently-labeled nucleic acid probes. It simultaneously measures the concentration of the fluorescent tag and the nucleic acid at appropriate wavelengths. Microarray Screen Features Select Microarray from the Q5000 main menu and the application interface will appear on the screen. - 18 - User’s Manual Quawell 340 nm Baseline: the absorbance value of the 340 nm baseline is only used for the sample concentration calculation reported at 260 nm. The default of 340 nm baseline is checked. 750 nm Baseline: it normalizes the visual spectrum display and calculates a baseline between 400 nm and 750 nm for dye concentration. Graph Display: The Y-axis indicates the absorbance value and the X-axis is for the wavelength. The maximum absorbance value is automatically adjusted to the highest absorbance value. The user is also allowed to manually enter the absorbance value. Sample ID - #: there are two windows that display the sample ID information. The left window displays the sample ID input by the user. The default is “My Sample”. The right window displays the ID number for that sample ID. The ID number begins at 1 and increases by 1 for each measurement. Changing the Sample ID will automatically reset the ID number to 1. Sample Type – EC: chose the sample type for the sample to be measured. There are 3 different sample types for nucleic acids: dsDNA, ssDNA and RNA. The default is dsDNA. The sample type is disabled after blanking. The extinction coefficient of the sample selected will appear in the EC window. SW and Abs (10mm): user-selected wavelength and corresponding absorbance that are not utilized in any calculations. 260/280: ratio of absorbance at 260 nm and 280 nm. ng/ul: sample concentration in ng/ul. Dye1 and Dye 2 Selection Windows 1. Dye1 or Dye2 drop-down list: displays the dye that is pre-predefined - 19 - User’s Manual Quawell using the Dye List Editor. Please see Section 11 for details on how to predefine the list. 2. Abs: absorbance of Dye1 or Dye2. 3. pmol/nl: concentration of Dye1 or Dye2 in pmol/nl. 4. Vertical Lines: the green line indicates the peak position of the wavelength for Dye 1, and the blue vertical line indicates the peak position of the wavelength for Dye 2. Measurement Range (Cy3) Concentration (pmol/nl) Reproducibility 0.2-100 +/- 0.2% - 20 - User’s Manual Quawell 9. PROTEIN A280 Overview Protein A280 measures the protein’s absorbance at 280 nm and calculates the concentration. Since no protein standards are required, Protein A280 is fast and convenient. Protein A280 Screen Features Select Protein A280 from the Q5000 main menu and the module interface will appear on the screen. - 21 - User’s Manual Quawell 340 nm Baseline: the absorbance value of 340 nm baseline is only used for the sample concentration calculation reported at 280 nm. The default of 340 nm baseline is checked. Graph Display: The Y-axis indicates the absorbance value and the X-axis is for the wavelength. The maximum absorbance value is automatically adjusted to the highest absorbance value. The user is also allowed to manually enter the absorbance value. Sample ID - #: there are two windows that display the sample ID information. The left window displays the sample ID input by the user. The default is “My Sample”. The right window displays the ID number for that sample ID. The ID number begins at 1 and increases by 1 for each measurement. Changing the Sample ID will automatically reset the ID number to 1. Sample Type: chose the sample type for the sample to be measured. There are 4 different sample types for protein measurement: 1Abs = 1mg/ml, BSA, IgG, and Lysozyme. The default is 1Abs = 1mg/ml. The sample type is disabled after blanking. The extinction coefficient of the sample selected will appear in the EC window. SW and Abs (10mm): the user selected wavelength and corresponding absorbance. The user-selected wavelength and absorbance are not utilized in any calculations. Ads260 (10mm): absorbance of the sample at 260 nm. Abs280 (10mm): absorbance of the sample at 280 nm. 260/280: ratio of the absorbance at 260 nm and 280 nm. mg/ml: sample concentration in mg/ml. - 22 - User’s Manual Quawell Measurement Range (BSA) Absorbance accuracy Concentration Reproducibility 0.05 -100 mg/ml 2% - 23 - (1mm) Abs 0-0.2 0.002abs Abs 0.2-1 0.02abs User’s Manual Quawell 10. LABELED-PROTEINS Overview The Labeled-Proteins function will simultaneously measure both protein and fluorescent dye concentrations at appropriate wavelengths. Proteins and Labels Screen Features Select Proteins and Labels from the Q5000 main menu and the module interface will appear on the screen. - 24 - User’s Manual Quawell 340 Baseline: the absorbance value of 340 nm baseline is only used for the sample concentration calculation reported at 280 nm. The default of 340 nm baseline is checked. 750 Baseline: it normalizes the visual spectrum display and calculates a baseline between 400 nm and 750 nm for dye concentration. Graph Display: The Y-axis indicates the absorbance value and the X-axis is for the wavelength. The maximum absorbance value is automatically adjusted to the highest absorbance value. The user is also allowed to manually enter the absorbance value. Sample ID - #: there are two windows that display the sample ID information. The left window displays the sample ID input by the user. The default is “My Sample”. The right window displays the ID number for that sample ID. The ID number begins at 1 and increases by 1 for each measurement. Changing the Sample ID will automatically reset the ID number to 1. Sample Type: chose the sample type for the sample to be measured: 1. 1Abs = 1mg/ml 2. BSA 3. IgG 4. Lysozyme SW and Abs (10mm): the user selected wavelength and corresponding absorbance. The wavelength can be selected by using the up/down arrows or input the number in the wavelength box. The user-selected wavelength and absorbance are not utilized in any calculations. Abs280 (10mm): absorbance of the sample at 280 nm. 260/280: ratio of the absorbance at 260 nm and 280 nm. - 25 - User’s Manual Quawell mg/ml: sample concentration in mg/ml. Dye1 and Dye 2 Selection Windows 1. Dye1 or Dye2 drop-down list: displays the dye that is pre-predefined using the Dye List Editor. See Section 11 for details on how to predefine the list. 2. Abs: absorbance of Dye1 or Dye2. 3. uM: concentration of Dye1 or Dye2 in uM. 4. Vertical Lines: the green line on the absorbance-wavelength graph indicates the peak position of the wavelength for Dye 1, and the blue vertical line indicates the peak position of the wavelength for Dye 2. Measurement Range Concentration Reproducibility 0.1 -20 mg/ml (BSA) 2% 0.2-100 uM (Cy3) 2% - 26 - User’s Manual Quawell 11. UV-VIS MEASUREMENT Overview The Q5000 can function as a general-use laboratory spectrophotometer. The UV-Vis measurement module provides the operator with a sample absorbance range from 220 to 850 nm. UV-Vis Measurement Screen Features Select UV-Vis from Q5000 main menu and the module interface will appear on the screen. - 27 - User’s Manual Quawell Graph Display: The Y-axis indicates the absorbance value and the X-axis is for the wavelength. The maximum absorbance value is automatically adjusted to the highest absorbance value. The user is also allowed to manually enter the absorbance value. Sample ID - #: there are two windows that display the sample ID information. The left window displays the sample ID input by the user. The default is “My Sample”. The right window displays the ID number for that sample ID. The ID number begins at 1 and increases by 1 for each measurement. Changing the Sample ID will automatically reset the ID number to 1. 1) nm: select the wavelength by using the up/down arrows. Abs 1 (1mm): corresponding absorbance at 1) nm. 2) nm: select the wavelength by using the up/down arrows. Abs 2 (1mm): corresponding absorbance at 2) nm. Baseline: if selected, the absorbance value of the baseline is subtracted from the absorbance of Abs1 and Abs2. Vertical Lines: the green line on the absorbance-wavelength graph indicates the peak position of the wavelength for 1)nm, and the blue vertical line indicates the peak position of the wavelength for 2)nm. - 28 - User’s Manual Quawell 12. CELL CULTURES Overview The Q5000 allows laboratories to monitor the density of suspended cell and microbial cultures by measuring their light scatter at 600 nm. Cell Cultures Screen Features Select Cell Cultures from Q5000 main menu and the module interface will appear on the screen. Graph Display: The Y-axis indicates the absorbance value and the X-axis is for the wavelength. The maximum absorbance value is automatically - 29 - User’s Manual Quawell adjusted to the highest absorbance value. The user is also allowed to manually enter the absorbance value. Sample ID - #: there are two windows that display the sample ID information. The left window displays the sample ID input by the user. The default is “My Sample”. The right window displays the ID number for that sample ID. The ID number begins at 1 and increases by 1 for each measurement. Changing the Sample ID will automatically reset the ID number to 1. 600 nm Abs (1mm): absorbance at 600nm Baseline: if selected, the absorbance value of the baseline is subtracted from the absorbance at 600nm. Selected nm: user select wavelength. Abs (1mm): absorbance at selected nm. Green vertical line: indicates the peak position of the wavelength for selected nm. - 30 - User’s Manual Quawell 13. THE PREDEFINED FLUORESCENT DYES LIST The list works with both the Microarray and Labeled Proteins modules. list contains a pre-defined list of fluorescent dyes as shown below. Additional fluorescent dyes can be added by the user as needed. - 31 - This User’s Manual Quawell 14. LIGHT INTEGRATION This module is used for adjusting the light integration. The integration number is set to normal before shipping. The light integration and detector systems are functioning normally if the red and black spectra appear as in the image below. However, if the image appears as below, with the light integration spectrum too high or too low, the light integration can be adjusted with this feature. - 32 - User’s Manual Quawell Adjusting the light integration: 1. Select the module from the horizontal tab and the path from the vertical tab. 2. The original integration number appears in the window “Original Value”. 3. Enter the number in the window “Enter new light integration value (1-12)”. 4. Click the “Check” and the black spectrum will display in the window. 5. Increase the integration value from 1 up to12, stopping when the black and red spectra are close. If you have questions about the light integration, please contact your local distributer or Quawell at [email protected]. - 33 - User’s Manual Quawell 15. POTENTIAL SOURCES OF ERROR Sample Overlap Sample residue on either measurement surface will affect the result. We suggest that the user: Clean the two surfaces with dry soft lab paper after each sample measurement. Clean the surfaces with 2 ul de-ionized after measuring highly concentrated samples. Thoroughly clean the surfaces and surrounding area with de-ionized water after completing all measurements. Before sample measurement blank the machine as described: 1. Open the appropriate application module. 2. Lift the upper arm and add 2.5 ul of blanking reagent to the lower surface. 3. Lower the upper arm and click the Blank button. 4. Lift the upper arm and clean the blanking reagent from both surfaces with de-ionized water. 5. Add 2.5 ul blanking reagent to the lower surface. 6. Lower the upper arm and click the Measure button. 7. If the value in the Abs260 window is higher than 0.004, repeat these blanking steps. Sample Homogeneity Non-homogenous samples would cause significant deviation in the data generated by any measurement system, including the spectrophotometer. - 34 - User’s Manual Quawell Effect of Evaporation Sample evaporation could cause a 1-2% deviation in the sample’s concentration. Insufficient Sample Volume We recommend 2.5 ul for normal sample measurements. - 35 - User’s Manual Quawell 16. TROUBLESHOOTING USB Connection Error This error screen usually indicates that the Q5000 and PC connection failed. To correct the error, unplug the USB cable, wait for 2-3 seconds, and plug it again. Sample Accuracy and Reproducibility If the sample data are inaccurate and/or not reproducible please refer to Section 13 “POTENTIAL SOURCES OF ERROR”. - 36 - User’s Manual Quawell 17. MAINTENANCE The primary maintenance requirement of the Q5000 spectrophotometer is to keep the measurement surfaces clean. Upon completion of a measurement, wipe the sample from the upper and lower surfaces. Clean the surfaces and surrounding area with de-ionized water to prevent sample carryover and residue buildup. - 37 - User’s Manual Quawell 18. APPENDICES A. Instrument Specifications Minimum Sample Size 0.5ul Optic Path Length 0.2-1mm (auto selected) Light Source Xenon flash lamp Wavelength Range 200-850 nm Wavelength Resolution 1nm Wavelength Accuracy 1 nm Absorbance Range 0.01 -100 Absorbance Precision 0.002 Abs (1mm) Absorbance Accuracy 1% Detector Type 3648 element linear silicon CCD array Detection Limit 1ng/ul (dsDNA) Max Concentration 5,000 ng/ul (dsDNA) Measurement Cycle <8 seconds Dimensions 145 mm x 210 mm Weight 2 kg Operating Voltage 12 vdc Power Consumption 15 W (operating) Power Consumption 1.5 W (standby) surface Construction 303 stainless steel and quartz fiber Software Compatibility Windows® XP and Vista (32 bit) CE Approval Units sold in Europe - 38 - User’s Manual Quawell B. Absorbance Calculation When the Q5000 Spectrophotometer is “blanked”, a spectrum is taken of a reference material (blank) and stored in memory as an array of light intensities by wavelength. When a measurement of a sample is taken, the intensity of light that was transmitted through the sample is recorded. The sample intensities along with the blank intensities are used to calculate the sample absorbance according to the following equation: I sample Abs log I blanc Thus, the measured light intensity of both the sample and of the blank are required to calculate the absorbance at a given wavelength. - 39 - User’s Manual Quawell C. Concentration Calculation (BEER’S LAW) The Beer-Lambert equation is used to correlate the calculated absorbance with concentration: A=E*b*c Where A is the absorbance represented in absorbance units (A), E is the wavelength-dependent molar absorptive coefficient (or extinction coefficient) with units of liter/mol-cm, b is the path length in cm, and c is the analyze concentration in moles/liter or molarities (M). - 40 - User’s Manual Quawell 17. CONTACT INFORMATION Quawell Technology, Inc. P.O. Box 612738 San Jose, CA 95161 Tel: (408) 329-6241 www.quawell.com E-mail: [email protected] - 41 -