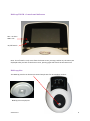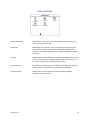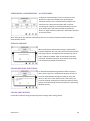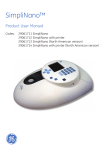
1
#1005369 #1005366 #1005363 BioDrop TOUCH / TOUCH PC/ µLite/ Duo UV Visible Spectrophotometers BioDrop User TOUCH Manual / TOUCH PC/ µLite/ Duo UV Visible Spectrophotometers User Manual Order 800.453.0385 www.densci.com • [email protected] • Fax 908.757.7551 84 October Hill Road • Holliston MA 01746 CONTENTS: HEALTH & SAFETY General Safety 1 1 General Hazards Unpacking & Installation Instrument Connections Equipment Operation 4 4 5 Controls and Indicators 5 Intended Users 5 Instrument Preparation 7 Post Run Procedures 8 Performance Validation 8 User Maintenance 8 Troubleshooting 8 Customer Support Contacts 10 Service, Repair or Return 10 Disposal 10 INTRODUCTION TO THE BIODROP SPECTROPHOTOMETER 12 USE WITH RESOLUTION PC SOFTWARE 12 FREQUENTLY USED ICONS 13 PERFORMING A MEASUREMENT 20 TYPES OF BOXES 15 SETTINGS 16 Date and Time 16 Regional 17 Data Output 17 User Interface 17 Instrument Settings 18 Version 2.0 Instrument Information 18 Instrument Settings 18 i USER ACCESS 19 Adding a user 19 Editing a user 19 Deleting a user 19 Editing user access 20 APPLICATIONS 21 Single Wavelength 22 Concentration via factor 23 Wavescan 25 Kinetics 27 Trace Manager – Overlaying & manipulating wavescan and kinetics files 30 Standard Curve 33 Equation Editor 36 LIFE SCIENCE APPLICATIONS 43 Nucleic Acid Applications 45 DNA, RNA & Oligo 48 CyDye DNA 48 Tm Calculation 50 Protein Applications BCA, Bradford, Lowry & Biuret Protein Assays 54 54 Determination of Protein Concentration using the BCA protein assay 54 Determination of Protein Concentration using direct UV methods 59 Protein UV 60 Protein A280 62 SAVING & PRINTING Saving Sample Data 63 63 Internal 63 USB 63 USB csv 64 Automatic Saving 65 Manual Saving 65 Version 2.0 ii Exporting Data SAMPLE MANAGER 66 66 Deleting data from the internal memory 67 Accessing Sample Manager from the main screen 68 Accessing Sample Manager from within an application 68 Recalled files 69 SAVING METHODS 70 Methods saved to the internal memory 70 Methods folder 71 Renaming methods folder 71 Locking saved methods 71 Deleting saved methods 72 Backing up method folders to USB 72 Favourites folder 72 Saving methods to USB 73 PRINTING 73 Built –in Printer 73 Print via computer (PVC) 73 Automatic printing 74 Manual printing 74 Built-in Printer Installation 75 Built-in Printer Paper Refill 77 TECHNICAL SPECIFICATIONS 79 TABLE OF ICONS 80 GLOSSARY OF BOXES 85 Version 2.0 iii HEALTH & SAFETY Safety Conformance This equipment has been designed to conform to the following directives 2006/95/EC 2004/108/EC 2002/96/EC 2011/65/EU 2006/42/EC Low voltage equipment safety directive EMC directive EU Directive on Waste Electrical and Electronic Equipment (WEEE) EU ROHS directive Machinery directive Standards, to which conformity is declared include: EN61010-1:2010 EN61010-2-101:2002 EN61326-1:2006* EN ISO 12100:2010 Safety requirements for electrical equipment for measurement, control and laboratory use. General requirements Safety requirements for electrical equipment for measurement, control and laboratory use. Particular requirements for in vitro diagnostic (IVD) medical equipment Electrical equipment for measurement, control and laboratory use -EMC Requirements Safety of machinery – Basic concepts, general principles for design * This equipment has been tested and found to comply with the limits for a CLASS A digital device, pursuant to part 15 of the FCC Rules Hazards and Warnings This section describes potential hazards which may exist in the operation of these units. A number of warning labels and symbols are affixed to your instrument. These symbols are used to inform you of potential dangers which may exist or where caution is required. Before installing your new unit, please take time to familiarise yourself with these warnings and symbols. This instrument is subject to the following identified hazards: This unit uses a Xenon lamp which is a high energy light source. DO NOT look closely at the cuvette holder or the micro-volume sample port when performing a measurement as prolonged exposure to the light source may result in permanent eye damage. High voltages exist within the power supply unit and the Xenon lamp housing. Repair and maintenance should only be carried out by individuals trained to work on these instruments. Version 2.0 1 There are no bio-hazardous materials within the unit; however, this unit may be exposed to bio-hazardous samples during normal laboratory use. We recommend the following decontamination procedures of this instrument to protect users: remove cuvettes and cuvette holders and wash with appropriate disinfectant for the bio hazard in question, rinsed with distilled water and then allowed to dry. The exterior may be wiped with a suitable disinfectant cleaning wipe. In addition, we recommend the following: Include an appropriate decontamination certificate for equipment returned for repair. Ensure that the operator of the equipment is provided with a safe working environment. Use, store and dispose of any chemicals in accordance with manufacturer’s guidelines and local safety regulations. Provide suitable ventilation when working with volatile solvents or toxic substances. Dispose of solvents and chemicals that may be classed as hazardous waste in accordance with local regulatory practice. Determine if personal protective equipment (PPE) is required for handling laboratory samples. All models can be connected to and operated from a PC. Those without a user interface cannot be operated without a PC. To preserve the integrity of the measuring equipment it is essential that the attached PC itself conforms to basic safety and EMC standards and is set up in accordance with the manufacturers’ instructions. If in doubt, consult the information that came with your PC. The following safety precautions should be observed when operating a PC To reduce the chance of eye strain, set up the PC display with the correct viewing position, free from glare and with appropriate brightness and contrast settings To reduce the chance of cross contamination from biological samples, use appropriate personnel protection measures and disinfectant wipes on keyboard and mouse. Emergency Procedure In the event of contamination, malfunction or hazard occurring, the operator should disconnect the unit, by removing the power cord, and isolate for decontamination and/or repair. Version 2.0 2 Unpacking and Installation Units weigh less than 4kg. No special handling is required. Please keep the original packaging for transport for service or repair as it has been specifically designed to protect the unit from damage during transit. Inspect the instrument and its power supply for any signs of damage caused during transit. If any damage is discovered, do not use the instrument and report the problem to your supplier. Ensure your proposed installation site conforms to the environmental conditions for safe operation o Indoor use o 5 to 40 °C o Maximum relative humidity 90% up to 31 °C decreasing linearly to 50% at 40 °C Extremes of temperature may require recalibration of the unit for optimal performance. If the instrument has been stored in a cold environment then it should be allowed to come to room temperature before turning on the instrument to avoid compromising the internal calibration procedure. The instrument must be placed on a stable, level bench or table capable of taking its weight with sufficient space around the instrument for air to circulate freely. The equipment is operated using an 18 VDC power supply adapter unit. Always use the power supply adapter and mains cords supplied. Local mains power requirements are as follows o 100 to 240 VAC~ o 50 or 60 Hz The UK style mains cord plug has a user replaceable 3A fuse. Replace only with the same rating and type 3A BS1362. The unit maximum power rating is 50VA. The instrument should be positioned so that the power supply cable may be readily removed in the event of a hazard or malfunction. Locate the instrument in an atmosphere free from dust and corrosive fumes. Use the dust cover to further protect the instrument when not in use or powered. Version 2.0 3 Instrument Connections USB connector for PC connection 18V power supply connector USB connector for USB memory stick Version 2.0 4 Equipment Operation BioDrop TOUCH PC The BioDrop TOUCH spectrophotometer is available as a PC only variant, which has no touch screen user interface and must be controlled by a PC running BioDrop Resolution software. The BioDrop TOUCH PC must be connected via USB to a PC and connected to a power supply, and the instrument will power up automatically. Insert the USB and power cables in the sockets at the back of the instrument. Version 2.0 5 BioDrop TOUCH - Controls and Indicators LED – on when USB in use On/Off switch Note: The off switch is only active from the home screen, pressing it whilst any sub menus are displayed takes you back to the home screen, pressing again will switch the instrument off. BioDrop µLite The BioDrop µLite has an aluminium coated sample port for microvolume analysis. BioDrop µLite sample port Version 2.0 6 BioDrop Duo The BioDrop Duo harbours a sample port and a BioDrop CUVETTE holder for analysis. Note: Simultanoeus analysis using the microvolume sample port and the BioDrop CUVETTE cannot be carried out. INTENDED USERS The instrument is intended to be used by scientists and technicians who possess basic laboratory and technical skills and have the knowledge and understanding of the hazards involved, with the unit and the samples used, to operate it in a safe manner. Instrument Preparation Switch on the unit and allow it to finish its start up calibration. If applicable connect the unit to a PC using a USB cable and refer to the online help and user manual. Select the appropriate application or method. Where relevant, set up the application parameters for the sample. Select the correct type. It is important to use cuvettes with the correct parameters. Most samples are measured using a standard 10mm path length cuvette. Special cuvettes and accessories are available for larger or smaller path lengths and sample volumes. The BioDrop CUVETTE is an example of a specialized micro-volume cuvette which can be used with the spectrophotometer. It is important to use cuvettes of the correct type. Plastic used in many cuvettes absorb UV light and thus are not suitable for UV sample measurement. Cuvettes used for measurement should be free from dust, residue or scratches. Before preparing samples and sample reference blanks, familiarise yourself with hazards arising from handling the sample materials and where necessary observe local regulatory practice, personnel protection equipment and measures designed to ensure your safety. Prepare the sample blanks (reference) in the same solution used to dissolve the sample. Prepare the sample solutions. Version 2.0 7 When placing the cuvette in the equipment ensure the cuvette is orientated so that the light energy will pass through the cuvette. Post Run procedures Empty cuvette and rinse with deionised water Clean cuvettes periodically with commercially available cleaning solution or dilute detergent solution followed by several thorough rinses in deionised water. Note that some samples and solvents may be classified as hazardous or bio hazardous waste. The disposal of such substances must be carried out in accordance with local regulatory practice. Performance Validation Good laboratory practice requires that the unit is periodically checked for optical performance. Switch on validation tests. When the unit is powered up it performs wavelength accuracy and lamp energy tests. Periodically wavelength, stray light and absorbance accuracy should be tested to ensure the unit is performing to specification. Deterioration in performance may indicate that the instrument requires service. Performance validation can be performed using reference materials. User Maintenance There are no user serviceable parts in this instrument. To prevent cross-contamination and protect users from occupationally acquired infections, keep the unit clean and free from contaminates. o Cuvette holders and accessories should be removed and cleaned with commercially available cleaning solution or dilute detergent followed by a thorough rinse in deionised water. Allow to dry thoroughly before use o Casework and the sample compartment may be wiped down with commercially available disinfectant wipes o Periodically validate the optical performance and refer the instrument for regular servicing and calibration If the equipment is operated in a manner not specified, then the protection provided by the equipment may be impaired and the instrument warranty withdrawn. Troubleshooting Problem Possible Cause Negative absorbance readings Sample measurements will be negative absorbance reading if the absorbance value of the reference is higher than the sample. Negative readings can also result if reference and sample are interchanged or if the sample is very dilute and close to the absorbance of the reference. Contact your supplier for advice on the minimum concentrations that can be measured. Version 2.0 8 Unexpected results Absorbance higher than expected Absorbance lower than expected Poor reproducibility Instrument start up reported failure Version 2.0 Bubbles or contamination in the sample or reference can result in considerable errors. If using BioDrop cuvettes check using the bubble viewer provided. Incorrect cuvette orientation. Rotate by 90⁰ and repeat. Incorrect cuvette material for UV measurement wavelengths. Wrong pathlength selected in software. For Duo models, sample placed in cell holder and on micro volume sample platform at the same time. Incorrect sample reference. Incorrect cuvette orientation. Incorrect cuvette material for measurement wavelengths. Wrong pathlength selected in software. For Duo models, sample placed in cell holder and on micro-volume sample platform at the same time. Contamination in sample or on cuvette. For DNA applications check 320nm background, if higher than 0, select background correction in method set up. Possible incorrect optical alignment. Contact technical support. Incorrect sample reference. Check sample and reference for contamination. Check sample and reference samples are not the same. Incorrect cuvette material for measurement wavelengths. Wrong pathlength selected in software. For standard cuvettes, ensure the beam goes through the sample (fill cuvette with sample to 20mm from the base). For micro-volume sample platform check size and position of droplet. For DNA applications check that the measurements at 230nm and 320nm are near 0. Possible stray light issue. Contact technical support. Insufficient sample in cuvette. Cuvette in wrong orientation. Cuvette material unsuitable for wavelengths used. Concentration of sample too low or too high. For best results the measured sample absorbance using a 10mm path length cuvette should ideally be between 0.1 and 2.0 A. If absorbance is >2 A, measurement is no longer in the linear range. Particulates in sample. Absorbance measurements will not be accurate in turbid samples. Possible noise or measurement stability issue. Contact technical support. Check all sample paths are clear and clean – dried on DNA/Protein sample on the Micro-volume head on the Duo and µLite units may cause start up calibration errors. Check original 18V dc supply is connected and is fully engaged. Report persistent failures to technical support. 9 Absorbance readings stable but different than expected Check that the Absorbance displayed is being normalised to a path length of 10mm if a micro-volume device (like BioDrop CUVETTE) is used. Note that with a 0.5mm path length the ideal measurement range becomes equivalent when normalised to 2A to 50A and for a path length of 0.125mm it becomes 8A to 200A. For unresolved Absorbance issues contact technical support. Contacts and Technical Support If you have any problems using your instrument in the first instance please refer to the trouble shooting guide. If you require further assistance, please get in touch Web Telephone General enquiries Support http://www.biodrop.co.uk/ +44 (0) 203 301 2504 [email protected] [email protected] Service, Repair or Return Good laboratory practice requires that the unit be periodically serviced to ensure optimal performance and can be arranged through your local BioDrop distributor. Prior to inspection, servicing, repair or return the unit must be decontaminated. A returns policy operates on this equipment. Before returning the equipment to the distributor or manufacturer Complete a returns request form. Available from the BioDrop web site or your local distributor Return the unit together with a completed declaration of decontamination form, available from the BioDrop web site or your local distributor Please note that the instrument will not be accepted for servicing or return until a completed declaration of decontamination has been received Instruments that have not been cleaned sufficiently or decontaminated may be subject to additional charges and/or return delay Version 2.0 10 Disposal Decontamination In use this product may have been in contact with bio-hazardous materials. Before disposal the product should be thoroughly cleaned in disinfectant and rinsed with distilled water. All outside surfaces and sample areas must be wiped down with disinfectant wipes suitable for purpose and biohazard to which the instrument was exposed. WEEE These instruments are covered by the Waste Electrical and Electronic Equipment (WEEE) Directive and must not to be disposed of as unsorted municipal waste. All products marked with this symbol that are to be scrapped must be collected separately and in accordance with local regulatory practice. Please contact an authorised representative of the manufacturer for information concerning the decommissioning of your equipment and if required collection. Manufacturing Information Requirement Name and address of manufacturer Place and date of declaration of conformity Content Biochrom Ltd, 22 Cambridge Science Park, Milton Road, Cambridge, CB4 0FJ UK Cambridge UK July 2012 Identity of authorised person to sign declaration Sam Luke, Managing Director Biochrom Ltd Version 2.0 11 INTRODUCTION TO THE BIODROP SPECTROPHOTOMETERS The BioDrop TOUCH is a standalone, easy to use, split beam spectrophotometer with a high resolution colour touch screen. The BioDrop TOUCH spectrophotometer offers a comprehensive range of spectrophotometric and life science applications. The BioDrop µLite is a split beam spectrophotometer which has similar specifications to that of the TOUCH, but differs by harbouring a microvolume sample port for analysis. The in-built sample port has a path length of 0.5mm unlike that of the TOUCH (10mm). The BioDrop Duo spectrophotometer displays specifications attributed to both the TOUCH and µLite. It contains a sample port for rapid microvolume analysis and offers BioDrop CUVETTE analysis as in the TOUCH. A spectrophotometer is an optical device that is designed to transmit a beam of light through a sample. Transparent solutions absorb specific wavelengths of light based on their unique molecular composition. Absorbance is proportional to concentration of a sample. Absorbance peaks of a sample can also be used to identify its molecular composition. In kinetic studies, the tracking of absorbance over time can be useful to study chemical reactions and biological processes. The BioDrop spectrophotometers are designed to emit light from the far ultraviolet (190 nm) to the visible light (1100 nm). Many materials, and in particular solutions of materials will absorb light within this region. This makes BioDrop spectrophotometers useful in a wide range of applications including life sciences, clinical, pharmaceutical, cosmetics, food & drink, agricultural, industrial, environmental, toxicology, water treatment and teaching. There are numerous published methods and assays for these applications. The icons described throughout this manual use the names quoted in the Table of Icons on page 80, if you are unsure of any of their functions please refer to this section. For detailed descriptions of the functions of parameter boxes please refer to the Glossary of Boxes section. Note: Throughout this manual all screen shots are shown on a white background, there is also a black background available. USE WITH BIODROP RESOLUTION PC SOFTWARE When connected to a PC the BioDrop spectrophotometer can be controlled using the BioDrop Resolution PC software packages. The BioDrop TOUCH PC variant has no touch screen user interface, and must be controlled using Resolution software. Operation using BioDrop Resolution PC software is described in the Resolution user manual or Resolution help file. Version 2.0 12 FREQUENTLY USED ICONS ICON NAME Forward arrow Back arrow Tick Cross/exit FUNCTION Advances to the next screen in a sequence Returns to the previous screen in a sequence Confirms selection/entry. Saves and exits Exit without saving ICONS ON THE SAMPLE MEASUREMENT SCREEN Take reference Take measurement Options arrow Performs a reference measurement Performs a sample measurement Opens the options menu on the sample measurement screen ICONS ON THE OPTIONS MENU Method parameters Save data Allows the user to manually save sample data to a specified location. Save method Allows the user to save the current method parameters to the internal memory or a USB stick Print Prints the sample data from the specified printer Auto print Toggles auto print on and off – green surround = on Sample Manager Version 2.0 Takes the user from the sample measurement screen to the first method parameter screen Accesses Sample Manager 13 Trace Manager Accesses Trace Manager (wavescan and kinetics only). First time powered on The first time the BioDrop spectrophotometer is powered on the user will be prompted to set their regional setting preferences for language and local date/time. REGIONAL The BioDrop spectrophotometer will arrive with the language set to English. This can be changed by pressing the Language box; the options are English, French, German and Spanish. To save any alterations press the tick, to exit without saving press the cross. DATE & TIME The BioDrop spectrophotometer will arrive with the UK time and date set. This can be changed by pressing Date and Time. After the desired date and time have been entered, select the tick to save and exit or the cross to exit without saving Version 2.0 14 TYPES OF BOXES The BioDrop spectrophotometer uses different kinds of boxes for parameter selection and entry, these include. Alphanumeric Text Entry The alphanumeric text entry box allows the user to enter letters, numbers and symbols by pressing abc, 123 and λμ!, respectively. It is possible to toggle between upper and lower case letters and through a list of symbols by pressing abc and λμ! twice. Note: The layout of the screen is dependent on the text entry mode set under User Interface in Settings. Numeric Entry The numeric entry box allows the user to include numbers in the method parameters. Depending on the numeric box selected it may be possible to add both positive and negative numbers. Selection list/Combination Box Where there are more than two options, the user will be presented with a list. If there are more than 8 options the user can scroll through these using either the page up and page down arrows or the scroll bar. Note: If a box only contains two options i.e. On or Off, pressing the box on the screen will toggle between the options and not produce a combination box. Version 2.0 15 SETTINGS Settings are accessed via the Settings button on the main screen (see below) Note: If User Access has been selected the User Access Icon will only appear for users with Administrator privileges. DATE & TIME The BioDrop spectrophotometer will arrive with the UK time and date set. This can be changed by pressing Date and Time. After the desired date and time have been entered, select the tick to save and exit or the cross to exit without saving. Version 2.0 16 REGIONAL The BioDrop spectrophotometer will arrive with the language set to English. This can be changed by pressing the Language box; the options are English, French, German and Spanish. To save any alterations press the tick, to exit without saving press the cross. Data Output This is the default saving and printing settings that will be used in all application method parameters. These can be overwritten in an application User Interface Allows the user to set the desired brightness level of the screen, the alphanumeric text entry mode and the duration after which the screensaver will be displayed (if required). Theme sets the screen background to either Black or White. Service The Service section is for use only by a trained service engineer or upon recommendation of a member of BioDrop technical support. Version 2.0 17 INSTRUMENT SETTINGS The following options are included under instrument settings: Instrument Information Instrument information displays the serial number, userinterface (UI) version, build and release dates and instrument control (IC) version. Instrument Settings Instrument Settings allows the user to: 1. Collect a new, temporary baseline. This will be stored until the instrument is powered off. 2. Save the temporary baseline. This will become the permanent baseline and be stored until overwritten. 3. Restore the original baseline. If measurements show the temporary baseline to be poor quality the permanent baseline can be restored. 4. View instrument life in hours. 5. View service date (set by an engineer). Lamp Settings Lamp settings displays the current lamp status To exit at any time press the exit button located in the bottom right hand corner. Version 2.0 18 USER ACCESS The BioDrop spectrophotometer has an option to assign users different access rights. These are set via the user access icon. Note: The User access icon is only available to users who have administrator privileges. Adding a user To add a new user to the instrument, select ‘Add user’ on the touch screen. The BioDrop spectrophotometer can store up to 16 individual users. Each user is given a user name (using alphanumeric entry), a 4-digit password and assigned to one of three user groups depending on the access level they require. The table below outlines the features each user group can access. User Group Run Applications & Saved Methods Save Sample Data Delete Sample Data from the instrument’s memory Save Methods Access Settings Menu Access User Settings Limited Supervisor Admin Editing a user To edit a user’s details, highlight the desired user and select ‘Edit user’ on the touch screen. This allows the username, password and user group to be edited/updated as above. Deleting a user To delete a user from the instrument, highlight the desired user and press the ‘Add user’ icon. Any methods or data created by this user will not be deleted. Note: It is not possible to delete the default administrator account. Version 2.0 19 Editing User Access To disable user logins and user access, highlight the default administrator account and press ‘Edit User’ to display the screen left. Note: With Show Login set to No the instrument will not prompt for User Log on at start up, the ‘Switch User’ icon will not be displayed on the main screen and the instrument will always be in Administrator mode. PERFORMING A MEASUREMENT BIODROP SPECTROPHOTOMETERS The BioDrop spectrophotometers are a split-beam UV visible spectrophotometer that contains a single cuvette holder for both reference and sample measurements (BioDrop TOUCH and Duo respectively). Therefore, before performing sample measurements, it is necessary to perform a reference measurement to correct for solvent and/or cuvette effects. This is done as follows: 1. Insert a cuvette containing the solvent/buffer in the cuvette holder. 2. Press Take Reference. 3. When the reference is complete, remove the cuvette containing solvent/buffer from the cuvette holder, and insert a cuvette containing the sample solution. 4. Select Take Measurement. 5. Repeat steps 3 & 4 until all sample data has been collected. See the section Saving and Printing for post measurement options. Note: A single reference will suffice for subsequent analyses for samples with the same solvent. In regards to the µLite and Duo measurements are taken as followed: 1. Load sample volume of a minimum of 0.5µl of reference in the sample port. 2. Press Take Reference. 3. When the reference is complete, remove the sample by wiping with a lint free cloth from the sample port, and load sample of interest. 4. Select Take Measurement. 5. Repeat steps 3 & 4 until all sample data has been collected. See the section Saving and Printing for post measurement options. Version 2.0 20 APPLICATIONS Single Wavelength Absorbance, % transmission or concentration measurements at a single, specified wavelength. Wavescan Wavelength scan between two, user-defined wavelengths in the range 190 to 1100 nm. The BioDrop TOUCH allows data overlay, post-scan data manipulation and user configurable peak and valley functions. Kinetics Measurements of Absorbance versus time to determine rate or end points. The BioDrop spectrophotometers allow data overlay, postscan data manipulation and user defined sectors. Standard Curve Concentration measurement at a single wavelength determined by the generation of a calibration curve of known standards. Equation Editor Allows users to create their own unique methods including calculations and thresholds. Version 2.0 21 SINGLE WAVELENGTH The Single Wavelength application performs simple absorbance (A) and % transmission (%T) measurements on samples, measuring the amount of light that has passed through a sample relative to a reference (this can be air). MEASUREMENT PARAMETERS Set Mode to Absorbance, %T or Concentration. Wavelength, and Integration Time can be set as required. The Sample Seed entered under Sample will be the filename used for any data file saved automatically. You may advance to the next screen at any time by selecting the forward arrow or return to the previous screen by selecting the back arrow. Set the outputs required in your method. For more information see the section Saving and Printing. The µLite sample port has set pathlength setting of 0.5mm and can be selected from the drop down menu under Pathlength. Version 2.0 22 TAKING A MEASUREMENT To perform a measurement, insert a cuvette containing the reference solution in the cuvette holder (for µLite and Duo, load reference directly on the µLite sample port ) and press the reference button. Remove and replace with a cuvette containing the sample. For the µLite sample port, wipe away the reference with a lint free cloth and load the sample directly on the port. When the sample is loaded, press the Take Measurement button. A single reference suffices for subsequent analyses in the same series. SAVING & PRINTING For details of manual saving and printing see the Saving and Printing section. CONCENTRATION VIA FACTOR This mode within the Single Wavelength application makes simple concentration measurements on samples. Concentration is obtained by multiplying the measured absorbance at a specific wavelength by a factor. The factor may be known in advance or may be calculated by the instrument by measuring a standard of known concentration. Examples of concentration measurements include DNA or protein. MEASUREMENT PARAMETERS From the main screen of the BioDrop spectrophotometer select Applications followed by Single Wavelength to display the screen below. Set Mode to Concentration. Wavelength and Integration Time can be set as required. The Sample Seed entered under Sample will be the filename used for any data file saved automatically. You may advance to the next screen at any time by pressing the forward arrow and return to the previous screen by pressing the back arrow. Set Factor Method as required, enter Factor using numeric entry and Units using alphanumeric entry. Version 2.0 23 Set the outputs required in your method. For more information see the section Saving and Printing. TAKING A MEASUREMENT To perform a measurement, insert a cuvette containing the reference solution in the cuvette holder (for µLite and Duo, load reference directly on the µLite sample port ) and press the reference button. Remove and replace with a cuvette containing the sample. For the µLite sample port, wipe away the reference with a lint free cloth and load the sample directly on the port. When the sample is loaded, press the Take Measurement button. Note: For assays where there is no established concentration factor, calibration should be carried out using prepared standards (see Standard Curve for details of how to perform this). SAVING & PRINTING For details of manual saving and printing see the Saving and Printing section. Version 2.0 24 WAVESCAN A measurement of absorbance or % transmission of a sample over a specified wavelength range is one of the most useful physical characteristics of a compound, both as means of identification (qualitative analysis) and of estimation (quantitative analysis). The observed features arise due to the various electronic transitions that are possible within a molecule. The BioDrop spectrophotometers offer a range of post-scan data manipulation options including: 1st order derivative, enabling identification of multiple, unresolved peaks; 2nd order derivative, enabling identification of peak shoulders (inflections); 4th order derivative, which identifies both multiple peaks and inflections at the same time; Smoothing, utilises the Savitzky-Golay algorithm to smooth data and increase the signal to noise ratio; Enhanced, which enhances features, sharpening peaks and valleys. MEASUREMENT PARAMETERS Use Max Wavelength and Min Wavelength to set the required wavelength range. Set, Mode and Integration time as required. The Sample Seed entered under Sample will be the filename of any automatically saved file. No. of Samples is described below. Note: With Sample Overlays set to ≥2, all wavelength scans will be automatically saved to the instrument’s internal memory and will be displayed in Trace Manager. You may advance to the next screen at any time by pressing the forward arrow and return to the previous screen by pressing the back arrow. This measurement parameters screen allows the user to set the following parameters: Feature Detection: Determines the number of peaks or valleys that will be automatically detected. Options are Coarse, Sensitive or Custom. Feature Type: The feature types that will be detected by the software. Options are Peaks or Valleys. Feature Sort: Determines the how the features will be displayed in the data table. Wavelength shows the peaks in ascending wavelength whilst Magnitude displays then in descending size. Draw Peaks: When set to ON the width of the peak and the height of the detected peaks will be indicated using dashed lines Version 2.0 25 Custom Peak Height: Only displayed if Feature Detection is set to Custom. This is the minimum height the peak has to be above the higher of the two adjacent minima for the peak to be detected. Custom Peak Width: Only displayed if Feature Detection is set to Custom. This is the minimum width of the peak as determined by the difference in wavelength between the higher of the two adjacent minima and the opposing intersection of that higher minimum level and the peak profile. Set the outputs required in your method. For more information see the section Saving and Printing. TAKING A MEASUREMENT To perform a measurement, insert a cuvette containing the reference solution in the cuvette holder (for µLite and Duo, load reference directly on the µLite sample port ) and press the reference button. Remove and replace with a cuvette containing the sample. For the µLite sample port, wipe away the reference with a lint free cloth and load the sample directly on the port. When the sample is loaded, press the Take Measurement button. With Feature Detection set to Coarse, Sensitive or Custom the sample measurement screen will display a table below the scan. This table will display the Feature Type selected in the method parameters. To manually add a peak or valley to the table, position the cursor over the desired feature by either touching the feature or using the left and right cursors and press an empty cell in the table. Note: Details of how to perform overlays, data manipulation and selecting saved files can be found in the Trace Manager section. Version 2.0 26 KINETICS Kinetics measurements made using a UV/visible spectrophotometer measure the change in absorbance at a single, fixed wavelength over a specified period. This can be used to provide useful information when an appropriate factor, defined in a reagent kit protocol, is applied. Reagent test kits are routinely used for the enzymatic determination of compounds in food, beverage and clinical laboratories. UV/visible spectrophotometric kinetic assays are considered one of the most convenient measurements for enzymatic assays since they allow the rate of the reaction to be measured continuously. SERIAL KINETICS MEASUREMENTS Serial kinetics is the measurement of the absorbance of a single sample over a specified duration at a specified interval. As the BioDrop TOUCH is capable of taking up to 1 reading per second serial kinetics measurements can be used for rapid rate reactions. MEASUREMENT PARAMETERS Wavelength can be set as you require. The Sample Seed entered under Sample will be the filename of any automatically saved file. No. of Samples is described below. Note: When performing a serial kinetics measurement with more than sample the measurement proceeds as follows: Sample 1 will be measured for the full duration at the specified interval, after this is complete sample 2 will be measured for the full duration at the specified interval. The measurement will continue in this manner until all samples have been recorded. When measuring more than 1 sample, all data will be overlaid at the end of the measurement and automatically saved to the instrument’s internal memory. Set the Delay (time before first measurement), Duration (total measurement time, up to 180 minutes), Interval (duration between readings, from 1 second to duration) and Integration Time that you require. Note: The integration time is determined by the interval (i.e. the maximum integration time is half the interval time) Version 2.0 27 Mode has options for Delta A, Final A and Slope and is the value that will be multiplied by the Factor to give the Result on the sample measurement screen. Units are entered using alphanumeric text entry and will appear on any printed or exported data. Y min and Y max are what is displayed during the measurement, the y axis auto-scales upon completion. Set the outputs required in your method. For more information see the section Saving and Printing. TAKING A MEASUREMENT To perform a measurement, insert a cuvette (or load directly onto the µLite sample port) containing the reference solution in the cuvette holder and press the reference button. Remove and replace with a cuvette containing the sample (or load sample directly onto the µLite sample port) and press the take measurement button. A single reference suffices for subsequent analyses in the same series. . Note: Measurements will commence after the specified Delay period (if applicable). A measurement can be stopped at any time by pressing the Stop button at the bottom of the screen. All data collected to this point will be displayed on screen and can be saved. The data displayed in the table below the scan refers to the full measurement range. To obtain data for a specific Version 2.0 28 section it is necessary to add sections, this is done as follows: Set the cursor to the desired start position by either pressing on the scan or using the cursors, select t0 from the options menu, set the cursor to the desired end position and select t1 from the options menu. This can be repeated to add up to 4 discrete sections. Note: Sections must be added in numerical order i.e. t1 must be added after t0, t2 after t1 etc. With sections defined, the data displayed in the table below the scan is determined by the position of the cursor. Only when the cursor is positioned in the section of interest will this data be displayed. A line of best fit can be added to any section by positioning the cursor in the desired section and selecting the add line of best fit button from the options menu Note: Details of how to perform overlays, data manipulation and selecting saved files can be found in the Trace Manager section. SAVING AND PRINTING For details of manual saving and printing see the Saving and Printing section. Version 2.0 29 TRACE MANAGER – OVERLAYING & MANIPULATING WAVESCAN & KINETICS FILES Trace Manager is the application used by the BioDrop spectrophotometers to overlay and manipulate wavescan and kinetics files. Samples are loaded into Trace Manager as described below: USING SAMPLE MANAGER Wavescan and kinetics files can be loaded directly into Trace Manager by selecting the required files from Sample Manager on the main screen. This procedure is outlined below: Highlight the required files by pressing on the appropriate row and load these into Trace Manager by pressing the Sample Manager icon (bottom right corner). If the files you require are not displayed on the screen you can scroll through the pages using the up and down arrows. Pressing on the Sample ID and Date column headers will sort the files alphabetically and chronologically, respectively. Note: If a USB memory stick is inserted, it is possible to toggle between files stored on the internal and USB memories using the icon in the left hand corner. The icon in the top right corner of the screen will display the memory that is currently in use. All recalled files will be displayed on the Trace Manager screen (up to 8). The colour of the Slot number will be the colour of the trace when it is displayed on screen. To toggle which files are displayed on the measurement screen press in the appropriate Display box (up to 8 files can be displayed). To select which files data will be displayed on the measurement screen press in the appropriate selected box (only one file may be selected). Press the forward arrow to view the overlaid data FROM WITHIN AN APPLICATION To overlay saved files with a live trace displayed, Trace Manager can be accessed from within the application. This procedure is required for Limited users as they do not have the ability to access Sample Manager on the main screen. Trace Manager can be accessed from the Wavescan and Kinetics measurement screens using the Trace Manager icon on the options menu. Version 2.0 30 When accessed with no overlays displayed, Trace Manager will be empty. Files are added to this screen by selecting the Sample Manager icon in the left hand corner of the screen and loading saved files as described below. Highlight the required files by pressing on the appropriate row and load these into Trace Manager by pressing the Sample Manager icon. If the files you require are not displayed on the screen you can scroll through the pages using the up and down arrows. Pressing on the Sample ID and Date column headers will sort the files alphabetically and chronologically, respectively. Note: If a USB memory stick is inserted, it is possible to toggle between files stored on the internal and USB memories using the icon in the left hand corner. The icon in the top right corner will display the memory that is currently in use. All recalled files will be displayed on the Trace Manager screen (up to 8). The colour of the Slot number will be the colour of the trace when it is displayed on screen. To toggle which files are displayed on the measurement screen press in the appropriate Display box (up to 8 files can be displayed). To select which files data will be displayed on the measurement screen press in the appropriate selected box (only one file may be selected). Press the forward arrow to view the overlaid data. POST SCAN MANIPULATION Trace Manager allows the user to manipulate recalled wavescan and kinetics data using the procedure outlined below. With the required files loaded into Trace Manager press the appropriate Trace Output box to display the manipulation options. Version 2.0 31 Wavescan post scan manipulations are: Sample Data Displays the raw wavescan data (this is the default option). 1st – 4th Derivative Displays the derivative data to the desired order. Smoothed Uses the Savitzky-Golay algorithm to reduce noise and smooth the data. Enhanced Enhances features, sharpening peaks and valleys. Kinetics post scan manipulations are: Sample Data Displays the raw kinetics data (this is the default option). Low Applies a low level of smoothing to the data Medium Applies a medium level of smoothing to the data High Applies a high level of smoothing to the data After the manipulations and display options have been set as required press the forward arrow in the right corner to display the recalled data on the sample measurement screen. Note: For wavescan and serial kinetic measurements with overlays set to >1 and parallel kinetic measurements, data will be automatically saved into the instrument’s internal memory and displayed in Trace Manager. To ensure the optimum performance of the instrument it is recommended that unwanted files are deleted from the internal memory at regular intervals (see Sample Manager – deleting files from the internal memory). Version 2.0 32 STANDARD CURVE The construction of a multi-point calibration curve from standards of known concentration to quantify unknown samples is a fundamental use of a spectrophotometer. The BioDrop spectrophotometers have the advantage of being able to store calibration curves with a method. Each calibration curve can be created using up to 9 standards, with each standard measurement being made of up to 3 replicates. CREATING A STANDARD CURVE Set Wavelength and, Integration Time as required. The Sample Seed entered under Sample will be the file name of any file saved automatically. Calibration can be set to Standards (the user is required to prepare and measure standards) or Manual (the user inputs both the standard concentrations and standard absorbances). Set Standards, Replicates, Curve Fit and Units as required in your application. Set the concentration values for each of the standards using the numeric entry box. Version 2.0 33 Set the outputs required in your method. For more information see the section Saving and Printing. To create the standard curve when using replicates press the replicates button in the bottom right corner to take you to the screen shown below. With Replicates off standards can be measured directly as described below. Note: Pressing the save method icon before any standards have been measured will save the method parameters only. Recalling a method containing method parameters only requires the user to construct a standard curve before measuring samples. To create a standard curve, insert the cuvette containing the reference solution in the cuvette holder and press the take reference button. Remove and replace with a cuvette containing the first standard/replicate in the series and press the take measurement button. A single reference suffices for standard curve creation. Continue recording all standards/replicates until the standard curve has been completed. To repeat any standard measurements simply press the desired result, insert the correct standard and press take measurement. Note: After all replicates have been taken for a particular standard pressing the replicates icon takes the user to the next standard that was specified in the method. To ignore any outlying standard measurements, press the tick in the appropriate row to toggle it to a cross. Any ignored measurement will be automatically removed from the standard curve. These can be reinstated by pressing the cross. Version 2.0 34 TAKING A MEASUREMENT After the standard curve has been collected press the forward arrow to proceed to the sample measurement screen. To perform a measurement, insert the cuvette (or load directly onto the µLite sample port) containing the reference solution in the cuvette holder and press the take reference button. Remove and replace with a cuvette containing the sample and press the take measurement button. A single reference suffices for subsequent analyses in the same series. To view the standard curve whilst on the sample measurement screen, simply press the ‘View Curve’ icon that appears under the options menu. Note: Saving the method using the Save Method icon that appears on the options menu will save both the method parameters and the standard curve. Recalling a method containing method parameters and standard curve allows the user to measure samples directly. SAVING & PRINTING For details of manual saving and printing see the Saving and Printing section. Version 2.0 35 Equation Editor The Equation Editor application allows users to create their own unique methods that include calculations and thresholds. Examples of methods that can be created using Equation Editor include percentage strength calculations and olive oil and chlorophyll analyses. GETTING STARTED The use of Equation Editor is outlined below. MEASUREMENT PARAMETERS The first screen of Equation Editor allows the user to set the measurement parameters that will be used for all subsequent measurements. Integration Time and Mode are used as in all other applications. The use of Prompt between λ is described below. Prompt between λ off The instrument will measure wavelength 1, measure wavelength 2, measure wavelength 3 etc and then perform any calculations. Prompt between λ on The instrument will measure wavelength 1, prompt, measure wavelength 2, prompt, measure wavelength 3 etc and then perform any calculations. This is used for equations that require wavelength measurements of different samples e.g. chlorophyll analysis. You can advance to the next screen at any time by pressing the forward arrow and return to the previous screen by pressing the back arrow. Using the Sample Measurement table the user inputs all of the measurements that are required in the method i.e. the screen left shows a fixed wavelength measurement at 430.0 nm that is named 430. Data is inputted as described below. Before any data is inputted Name will read ‘Not set’ and will not appear in the Sample Data list on the Equation Builder. Name Pressing this allows the user to input an alphanumeric name for the measurement. The name inputted here will be used as the Sample Data in the Equation Builder (inputted data only appears in the Equation Builder if the user has defined a name). Wavelength (λ) Pressing this produces the number entry box that allows the user to input the wavelength for measurement. Version 2.0 36 Function Pressing this displays a combination box with the following options. Abs / %T at λ – measurement will be at the wavelength inputted by the user only. Peak closest to λ – the instrument automatically finds the peak closest to the inputted wavelength. Valley closest to λ – the instrument automatically finds the valley closest to the inputted wavelength. +/- Used with Peak closest to λ and Valley closest to λ only. This is the range over which the instrument will scan for a peak or valley from the inputted wavelength. Del Pressing this deletes the row. If the data is used in an equation this will also be deleted. Equation Editor has four options for sample naming conventions. These are shown below: Default The sample name consists of Sample and an incrementing number. Auto Increment The sample name is a combination of sample seed and an incrementing sample number. The user will be prompted to enter the sample seed for each new batch of samples. Prompt for ID The user is prompted to enter the sample name before running each sample. Fixed List The user will be prompted to enter the number of samples required. Sample names for each sample are then entered on the subsequent screens. The inputted sample names are saved for each method. The Standard Specification screen is used to declare a list of all of the standard solutions which will be referenced when creating an equation. E.g. the equation for percentage strength at 500 nm compares the absorbance of a sample to the absorbance of a control standard. This is where the control standard would be defined. Version 2.0 37 Standard names are entered by pressing on the desired row and entering the standard name using alphanumeric text entry. Standard measurements can be made for any measurements specified in the Samples table. The Constant Factor Specification screen is used to declare any constants used in the equation. Data is inputted as described below. Before any data is inputted Constant Name will read ‘Not set’ and will not appear in the Constants list on the Equation Builder. Constant Name Pressing this allows the user to input an alphanumeric name for the constant. Value Pressing this produces the number entry box that allows the user to input the value of the constant. Units Pressing this allows the user to enter units for the constant using alphanumeric text entry. If this column is left blank, no units will be displayed on exported or printed data. Del Pressing this deletes the row. If the constant is used in an equation this will also be deleted. The Variable Factor Specification screen is used to declare any variables used in the equation. Data is inputted as described below. Before any data is inputted, Variable Name will read ‘Not set’ and will not appear in the Variables list on the Equation Builder. Variable Name Pressing this allows the user to input an alphanumeric name for the variable factor. Default Selecting this produces the number entry box that allows the user to input the default variable factor. Default values can be edited during a measurement. Units Selecting this allows the user to enter units for the variable factor using alphanumeric text entry. If this column is left blank, no units will be displayed on exported or printed data. Version 2.0 38 Change Each Pressing this toggles between sample and batch. When set to sample the method will prompt for a variable to be entered before each sample measurement. When set to batch, the method will prompt for a variable to be entered at the start of each sample batch. The Equation Viewer screen provides an overview of any equations created, as well as allowing the user to create new or edit existing equations. Data is inputted as described below. Before any data is inputted Name will read ‘Not set’ and will not appear on the results screen. Name Pressing this allows the user to input a unique, alphanumeric name for the equation. The names entered here will be displayed in the ‘Equations’ combo box on the Equation Builder screen as well the results screens. Therefore any equation can be easily identified when using it in other equations. Equation Pressing this takes the user to the ‘Equation Builder’ (see below). Any equation constructed in the Equation Builder will be displayed in this box. Units Pressing this allows the user to enter units for the result of the equation using alphanumeric text entry. If this column is left blank no units will be displayed alongside the result. Del Pressing this deletes the row and removes the equation. The Equation Builder allows the user to create any equations required in the method. Data is inputted as described below. To allow data to be inserted or deleted the cursor can be moved left and right using the left and right arrows. Data can be deleted using the delete icon and thresholds added using the thresholds icon (see below). Variables Pressing this displays a list that contains any variables added to the ‘Variables’ table by the user. Selecting the desired variable enters it into the equation. Constants Pressing this displays a list that contains any constants added to the ‘Constants’ table by the user. Selecting the desired constant enters it into the equation. Version 2.0 39 Equations Pressing this displays a list that contains any equations that have been created in this method. Selecting the desired equation enters it into the equation. Sample Data Pressing this displays a list that contains all of the readings specified by the user in the Sample Measurement table. Selecting the desired sample data enters it into the equation. Symbols Pressing this displays a list containing mathematical symbols and the logic gates AND and OR. Selecting the desired symbol enters it into the equation. Numbers Pressing this produces the number entry box that allows the user to directly input numbers into the equation. Note: All of the data above appears in the lists as it was inputted in the appropriate table. After the equation has been inputted the user has two options. If the result is to be viewed as a number, press the back arrow to return to the Equation Viewer screen. If the result is to be viewed with a user specified pass/fail limit press Thresholds to set appropriate thresholds for the measurement. The first thresholds screen allows the user to input how many thresholds are required for a result. With Thresholds set to 3 the screen will display the table layout shown left. Setting Thresholds to 2 and 1 will reduce the number of values you can input to 2 and 1, respectively. Value Pressing this produces the number entry box that allows the user to directly input numbers for threshold values. Name Pressing this allows the user to enter the text that will be displayed for each result using alphanumeric entry. Version 2.0 40 Using the example above: A result of ≥100 will return the answer Position 1, a result of <100 and ≥50 will return the answer Position 2, a result of <50 and ≥10 will return the answer Position 3 and a result of <10 will return the answer Position 4. Note: When using AND or OR logic in an equation the result will be returned as a binary (1 = true and 0 = false). These can be incorporated into the thresholds by setting the Thresholds to 1, Value to 1 and setting the appropriate names (as the name above value corresponds to ≥1 this is the response that will be displayed for true results). After all of the thresholds have been set, pressing the forward arrow will return the user to the Equation Builder screen. The Equation Viewer screen can be accessed using the back arrow. Continue as described above until all equations have been created. Once complete pressing the forward arrow will take the user to the output options screen below. Set the outputs required in your method. For more information see the section Saving and Printing. Note: Automatically saving sample data with sample naming set to ‘Prompt for ID’ or ‘Fixed list’ will save the data using the first inputted sample name as the filename. Version 2.0 41 PERFORMING A MEASUREMENT – NO STANDARDS To perform a measurement, insert a cuvette (or load directly onto the µLite sample port) containing the reference solution in the cuvette holder and press the reference icon. Remove and replace with a cuvette containing the sample (or load sample directly onto the µLite sample port) and press the take measurement button. A single reference suffices for subsequent analyses in the same series. Note: Pressing on the equation name allows the user to view the equation and the individual measurement results. USING STANDARDS When performing a measurement using a method that includes standards, the first press of the take measurement icon will produce a message box that prompts the user to insert a specific standard. After all standards have been measured, subsequent presses of the take measurement icon will perform sample measurements. SAVING METHODS AND EXITING As methods developed using Equation Editor may have taken time to input, the software will prompt the user to save the method before exiting. Pressing the cross will return to the user to the results screen, where they can save the method, pressing the tick will exit without saving. Details of method saving can be found below in the Saving Methods section. SAVING AND PRINTING For details of manual saving and printing see the Saving and Printing section. Version 2.0 42 LIFE SCIENCE APPLICATIONS This contains two sub folders; Nucleic Acids and Protein. The contents of these sub folders are detailed below: NUCLEIC ACIDS DNA Utilises the absorbance measurements at 230, 260 & 280 nm with optional background correction to perform a concentration and purity check for DNA samples. RNA Utilises the absorbance measurements at 230, 260 & 280 nm with optional background correction to perform a concentration and purity check for RNA samples. Oligo Utilises the absorbance measurements at 230, 260 & 280 nm with optional background correction to perform a concentration and purity check for oligo samples. Cydye DNA Measures the labelling efficiency of fluorescently labelled DNA probes to ensure that there is sufficient amount of each probe to give satisfactory signals. The DNA yield is measured at 260 nm whilst the incorporation of the dyes is measured at the absorption maxima. This method is also useful for measuring the yields and brightness of fluorescently labelled in-situ hybridization probes. TM Calc The Tm Calculation application calculates the theoretical melting point from the base sequence of a primer. It is done using nearest neighbour thermodynamic data for each base in the nucleotide chain in relation to its neighbour PROTEIN BCA Quantitative determination of protein concentration utilising the absorbance measurement at 562 nm Bradford Quantitative determination of protein concentration utilising the absorbance measurement at 595 nm Lowry Quantitative determination of protein concentration utilising the absorbance measurement at 750 nm Version 2.0 43 Biuret Quantitative determination of protein concentration utilising the absorbance measurement at 546 nm Protein UV Direct UV determination of protein concentration at 280 nm using the Christian Warburg calculation Protein A280 Direct UV determination of protein concentration using BSA, IgG, Lysozyme, Molar Extinction. Mass Extinction or E1% calculations Version 2.0 44 NUCLEIC ACID APPLICATIONS DNA, RNA & Oligo Nucleic acids can be quantified at 260 nm because it is well established that solutions of DNA and RNA in 10 mm pathlength cuvettes with an optical density (absorbance) of 1.0 have concentrations of 50 µg/ml and 40 µg/ml, respectively. Oligonucleotides typically have a factor of 33 µg/ml, although this does vary with base composition and can be calculated if the base sequence is known. Concentration = A260 × Factor BioDrop spectrophotometers use the default factors 50, 40 and 33 for DNA, RNA and oligonucleotides, respectively. Compensation for dilution and pathlength can also be entered. The BioDrop TOUCH and the BioDrop Duo is designed for use with the BioDrop CUVETTES. The BioDrop CUVETTE is available in two pathlength configurations, the BioDrop 125 has a pathlength of 0.125 mm and the BioDrop 500 has a pathlength of 0.5 mm. The BioDrop µLite and Duo harbour a direct microvolume sample port with a pathlength of 0.5mm which can be selected from the dropdown menu of the Pathlength list. We recommended the use of the BioDrop 500 for the highest sensitivity and BioDrop 125 and µLite sample port analysis (0.5mm pathlength) for low volume samples. Pathlength factors are pre-programmed in the software for quick calculations. For example, if measuring dsDNA in a BioDrop 125, the calculation would be as follows: Concentration = A260 × 50 µg/ml x 80 If measuring dsDNA in the BioDrop 500, the calculation would be: Concentration = A260 x 50 µg/ml x 20 NUCLEIC ACID PURITY CHECKS Nucleic acids extracted from cells are accompanied by proteins and extensive purification is required to separate these protein impurities. The ratio of A260/A280 gives an indication of a sample’s purity, with pure DNA and RNA preparations typically having ratios of 1.8 and 2.0, respectively. Deviations from these values indicate the presence of impurities, but care must be taken when interpreting results. Concentration also affects both the A260 and A280 readings. If a solution is too dilute, the readings may be at the instrument’s detection limit and results may vary as there is less distinction of the A260 peak and A280 slope from the background absorbance. For accurate measurements A260 should always be greater than 0.1. Elevated A230 values can also indicate the presence of impurities (230 nm is near the absorbance maximum of peptide bonds and also indicates buffer contamination since EDTA and other buffer salts absorb at this wavelength). When measuring RNA samples, the A260/A230 ratio should be >2.0. Ratios lower than 2.0 generally indicate contamination with guanidinium thiocyanate, a reagent commonly used in RNA purification and which absorbs over the 230 - 260 nm range. A wavelength scan of the nucleic acid is particularly useful for RNA samples. Version 2.0 45 BACKGROUND CORRECTION To compensate for the effects of background absorbance caused by turbidity, high absorbance buffer solutions and the use of reduced aperture cuvettes the BioDrop spectrophotometers have the option of background correction at a 320 nm. When used, A320 is subtracted from A260 and A280 prior to use so that: Concentration = (A260 - A320) × Factor Abs ratio = (A260 - A320) / (A280 - A320) Abs ratio = (A260 - A320) / (A230 - A320) The use of background correction can remove variability due to handling effects of low volume disposable cuvettes. Spectral scan of nucleic acid Note: An absorbance maximum near 260 nm and absorbance minimum near 230 nm, a flat peak near 260 nm and steep slope at 280 nm and very little absorbance at 320 nm MEASUREMENT PARAMETERS Set Pathlength to match the cuvette being used and Dilution Factor if required. If using low volume cuvettes set Background correction to on. Set Units to encompass the expected concentration of your samples, the default Factor will update automatically depending on the units selected i.e. for units of µg/ml the default factor will be 50.00. If the Factor required differs from the default value this can be edited using numeric entry. The Sample Seed entered under Sample will be the filename of any saved file. Version 2.0 46 You may advance to the next screen at any time by pressing the forward arrow and return to the previous screen by pressing the back arrow. Set the outputs required in your method. For more information see the section Saving and Printing. TAKING A MEASUREMENT To perform a measurement, insert a cuvette (or load directly onto the µLite sample port) containing the reference solution in the cuvette holder and press the reference icon. Remove and replace with a cuvette containing the sample (or load sample directly onto the µLite sample port) and press the take measurement icon. A single reference suffices for subsequent analyses in the same series. If Background is set to On the A320 result will be included in the left hand column and automatically subtracted from the displayed A230, A260, A280, A260/A230, A260/A280 results. A scan of the most recently run sample can be viewed by pressing the View Scan icon in the options menu. Note: When saving sample data, scan files will not be saved. The Wavescan application should be used to save scans of nucleic acid samples. SAVING & PRINTING For details of manual saving and printing see the Saving and Printing section. Version 2.0 47 CY DYE DNA The measurement of the labelling efficiency of fluorescently labelled DNA probes before 2-colour micro-array hybridization ensures that there is sufficient amount of each probe to give satisfactory signals. The data also provides an opportunity to balance the relative intensities of each fluorescent dye by adjusting the concentration of each probe before hybridization. The DNA yield is measured at 260 nm whilst the incorporation of the dyes is measured at the absorption maxima. This method is also useful for measuring the yields and brightness of fluorescently labelled in-situ hybridization probes. MEASUREMENT PARAMETERS Number of Dyes, this can be set to 1 or 2. Dye 1 Name allows the user to select the dye used in the measurement, the BioDrop spectrophotometers have 19 dyes pre-programmed and the option for user entry using the Custom Dye option. λ Max, Extinction Coefficient and Correction Factor are only editable when using the Custom Dye option. You may advance to the next screen at any time by pressing the forward arrow and return to the previous screen by pressing the back arrow. With Number of Dyes set to 2, the next method parameter screen allows the user to specify the second dye used in the measurement. If the measurement requires the calculation of DNA Concentration and/or DNA Quantity the relevant nucleic acid can be inputted. A custom factor can be entered by selecting Custom in Nucleic Acids. This parameters screen allows the user to set the pathlength of the cuvette being used, whether background correction is required and at what wavelength, the dilution factor and volume of the sample in µl. All of these will be used in the calculations. The Sample Seed entered under Sample will the filename of any saved file. Version 2.0 48 Set the outputs required in your method. For more information see the section Saving and Printing. TAKING A MEASUREMENT To perform a measurement, insert a cuvette (or load directly onto the µLite sample port) containing the reference solution in the cuvette holder and press the reference button. Remove and replace with a cuvette containing the sample (or load sample directly onto the µLite sample port) and press the take measurement button. A single reference suffices for subsequent analyses in the same series. If Background Correction is set to On the Background Wavelength set in the method will be included in the left hand column and automatically subtracted from all results. To toggle between DNA & dye parameters press the toggle icon on the options menu. Cydye DNA measurements are wavelength scanning measurements, to view the scan for a particular measurement press the scan button in the options menu. SAVING & PRINTING For details of manual saving and printing see the Saving and Printing section. Version 2.0 49 TM CALCULATION The Tm Calculation application calculates the theoretical melting point from the base sequence of a primer. It is done using nearest neighbour thermodynamic data for each base in the nucleotide chain in relation to its neighbour (Breslauer et al, Proc.Natl. Acad. Sci. USA, 1986, 83, 3746). The data obtained are useful in both the characterisation of oligonucleotides and in calculating Tm for primers used in PCR experiments. The ACGT/U sequence entered in the method parameters is used to calculate the theoretical Tm, the theoretical absorbance (Absorbance units/mmol) and the conversion factor (mg/ml). This is possible as the stability of a bent and twisted sequence of bases such as an oligonucleotide is dependent on the actual base sequence. These calculated thermodynamic interactions between adjacent base pairs have been shown to correlate well with experimental observations. The Tm Calculation application uses matrices of known, published thermodynamic values and extinction coefficients to calculate Tm and the theoretical absorbance/factor of an entered base sequence. Tm is calculated using the equation:Tm = ΔH × 100 ΔS + (1.987 × loge(c/4 +53.0822) where - 273.15 + log [salt] ΔH and ΔS are the enthalpy and entropy values, respectively summed from respective 2 × 4 × 4 nearest neighbour matrices c is the Primer concentration of oligonucleotide (pmoles/ml) in the calculated Tm or the measured concentration in measured Tm. In the latter case, concentration is obtained from the equation: c = Abs(260 nm) × Calculated factor × pathlength multiplier × 10 000 MW Calculated factor and MW are defined below [salt] is the buffer molarity plus total molarity of salts in the hybridization solution (moles/l) Weights for ΔS are indexed by adjacent paired bases. A similar equation applies to weights for ΔH, again indexed by adjacent bases. Note: Bivalent salts may need normalising using a multiplying factor of 100 because of their greater binding power. THEORETICAL ABSORBANCE The Theoretical Absorbance is based on a calculation as follows: For each adjacent pair of bases (nearest neighbours) an extinction coefficient weight is accumulated using a 4 × 4 table (one for either DNA or RNA). This total weight is doubled and then for each Version 2.0 50 internal base a counterweight is subtracted using another 1 × 4 table. The end bases are excluded from the latter summation. Total Extinction Coefficient E = Σ (2 × aTable[base_type][base(n)][base(n+1)])Σ(tTable[base_type][base(n]]) CONVERSION FACTOR The Conversion Factor is given by = Molecular weight ABCDE Σ EABCDE where EABCDE = [2 × (EAB +EBC +ECD +EDE) –EB –EC –ED] • The molecular weight (MW) of a DNA oligonucleotide is calculated from: MW (g/mole) = [(dA × 312.2) + (dC × 288.2) + (dG × 328.2) + (dT × 303.2.)] + [(MWcounter-ion) × (length of oligo in bases)] (for RNA oligonucleotide, (dT × 303.2) is replaced by (dU × 298.2) The MW calculated using this equation must be adjusted for the contribution of the atoms at the 5’ and 3’ ends of the oligo. For phosphorylated oligos: For non-phosphorylated oligos: Add [17 + (2 × MW of the counter-ion)] Subtract [61 + (MW of the counter-ion)] The MW (g/mole) of the most common oligo counter ions are: Na (sodium) 23.0 K (potassium) 39.1 TEA (triethylammonium) 102.2 Other Defaults to 1.0 (variable 0.1–999.9) Calculated molecular weight: a weight is added for each base looked up from a table. The weight of the counter ion is added for every base from a small table for the known ions. If phosphorylated, then the system adds 17.0 plus two counter ions otherwise it subtracts 61.0 and one ion. Theoretical Absorbance: for each adjacent pair of bases (nearest neighbours) a weight is accumulated using a table. For each internal base a weight is subtracted using another table. Separate tables are used for DNA and RNA. Calculated factor: this is the calculated molecular weight divided by the theoretical absorbance. Version 2.0 51 MEASUREMENT PARAMETERS Set the required Base Type (DNA/RNA), whether the base is Phosphorylated, the Primer Concentration (pmoles/ml), Buffer Molarity and Counter Ion. Counter Ion has options for Na (sodium), K (potassium), TEA (triethylammonium) and Other, allowing the user to set the required molecular weight (MW) of the counter ion. Set the Pathlength and Integration Time you require. Base Sequence allows the user to enter the known base sequence triplets using the buttons A, C, G and T/U. To improve readability a comma is added after each triplet. The Sample Seed entered under Sample will the filename of any automatically saved file. Set the outputs required in your method. For more information see the section Saving and Printing. Version 2.0 52 TAKING A MEASUREMENT To perform a measurement, insert a cuvette (or load directly onto the µLite sample port) containing the reference solution in the cuvette holder and press the reference button. Remove and replace with a cuvette containing the sample (or load sample directly onto the µLite sample port) and press the take measurement button. A single reference suffices for subsequent analyses in the same series. SAVING & PRINTING For details of manual saving and printing see the Saving and Printing section. Version 2.0 53 PROTEIN APPLICATIONS The BioDrop spectrophotometers contain dedicated methods for both colorimetric protein assays and direct UV measurements. BCA, BRADFORD, LOWRY & BIURET PROTEIN ASSAYS The BCA, Bradford, Lowry and Biuret protein assays are well established spectrophotometric methods for determining the amount of protein in a sample. The exact choice of the assay depends upon the concentration of protein being measured and the detergents/reducing agents used in purification. Detailed protocols are supplied with all assay kits and should be followed closely to ensure accurate results are obtained. An outline of the protein assays offered by the BioDrop TOUCH is provided below: Bradford method: Biuret method: BCA method: Lowry method: Quantifies the binding of the dye Coomassie Brilliant Blue to an unknown protein and compares this binding to that of different, known concentrations of a standard protein at 595 nm. The standard protein is usually bovine serum albumin (BSA). Depends on reaction between Cu2+ ions and amino acid residues in an alkali solution. The resulting copper complex absorbs light at 546 nm. Depends on reaction between Cu2+ ions and amino acid residues. In addition, this method combines this reaction with the enhancement of Cu+ ion detection using bicinchoninic acid (BCA) as a ligand, giving an absorbance maximum at 562 nm. The BCA process is less sensitive to the presence of detergents used to break down cell walls. Depends on quantifying the colour obtained from the reaction of FolinCiocalteu phenol reagent with the Tyrosyl residues of an unknown protein and comparing with those derived from a standard curve of a standard protein at 750 nm (usually BSA). DETERMINATION OF PROTEIN CONCENTRATION USING THE BICINCHONINIC ACID (BCA) PROTEIN ASSAY The principle of the bicinchoninic acid (BCA) protein assay relies on the formation of a Cu2+-protein complex under alkaline conditions, followed by reduction of the Cu2+ to Cu+. The amount of reduction is proportional to the amount of protein present. BCA forms a purple-blue complex with Cu+ in alkaline environments, thus providing a basis to monitor the reduction of alkaline Cu2+ by proteins. The BCA assay can be used to quantify proteins in the concentration range 0.2 to 1.0 mg/ml. It is compatible with many detergents but not compatible with reducing agents such as dithiothreitol above 1 mM. GETTING STARTED It is always advisable to prepare the standard in the same buffer as the sample to minimise any interference effects. BCA assays are routinely performed at 37 °C. Colour development begins Version 2.0 54 immediately and can be accelerated by incubation at higher temperatures. Higher temperatures and/or longer incubation times can be used for increased sensitivity. MATERIALS REQUIRED Bicinchoninic Acid Kit for Protein Determination Suitable tubes with caps to hold and mix 2.1 ml samples and to heat at up to 60 °C Plastic disposable cuvettes Standard protein solution of known concentration (1 mg/ml) Incubator or block heater to heat sample tubes PREPARATION OF THE BCA WORKING REAGENT BCA reagents A and B are available commercially from a number of different sources. Instructions given here are for the kit supplied by Sigma Aldrich, other methods will be similar. Always refer to the manufacturer’s instructions. 1. Mix 50 parts of Reagent A (a solution containing bicinchoninic acid, sodium carbonate, sodium tartrate and sodium bicarbonate in 0.1N NaOH, pH 11.25) with 1 part of Reagent B (4% (w/v) CuSO4.5H2O), preparing sufficient reagent for all the standards and samples. 2ml of working reagent is required for each sample. 2. Mix until the solution is a uniform light green colour. The solution is stable for 1 day. STANDARD PREPARATION 1. Prepare a series of protein standards ranging in concentration from 0.2 to 1.0 mg/ml such that the final volume for the assay is 0.1 ml. The BioDrop spectrophotometers can measure up to 9 standards and up to 3 replicates. 2. Add 2.0 ml of the BCA working reagent to each standard, vortex gently and incubate using one of the following parameters: 60 °C for 15 minutes, 37 °C for 30 minutes or room temperature from 2 hours to overnight. 3. If required, allow the tubes to cool to room temperature. SAMPLE PREPARATION 1. Prepare the unknown samples as described above ensuring that the final volume is 0.1 ml. 2. Add 2.0 ml of the BCA working reagent to each sample, vortex gently and incubate using one of the following parameters: 60 °C for 15 minutes, 37 °C for 30 minutes or room temperature from 2 hours to overnight. 3. If required, allow the tubes to cool to room temperature. Version 2.0 55 CREATING A STANDARD CURVE For BCA measurements Wavelength is set to 562.0 nm. Integration Time and Sample ID can be set as you wish. You may advance to the next screen at any time by pressing the forward arrow and return to the previous screen by pressing the back arrow. Set Calibration to Standards, Curve Fit to Zero Regression and enter Units of mg/ml. The number of standards and replicates can be set as you wish (for optimum accuracy it is recommended that the number of standards is ≥4 and replicates is >1). Note: With Calibration set to Standards the user is required to prepare and measure standards with Calibration set to Manual the user inputs both the standard concentrations and absorbances. Enter the concentration of prepared standards using the numeric keypad. Set the outputs required in your method. For more information see the section Saving and Printing. Version 2.0 56 To create the standard curve when using replicates press the replicates button in the bottom right corner to take you to the screen shown below. With Replicates off standards can be measured directly as described below. Note: After all replicates have been taken for a standard pressing the replicates icon takes the user to the next standard that was specified in the method. To create a standard curve, insert the cuvette containing the reference solution in the cuvette holder and press the take reference icon. Remove and replace with a cuvette containing the first standard/replicate in the series and press the take measurement icon. A single reference suffices for standard curve creation. Continue recording all standards/replicates until the standard curve has been completed. After the standard curve has been collected press the forward arrow to proceed to the sample measurement screen. To ignore any outlying standard measurements press the tick next in the appropriate row to toggle it to a cross. Any ignored measurement will be automatically removed from the standard curve. These can be reinstated by pressing the cross. Note: Pressing the save method icon before any standards have been measured will save the method parameters only. Recalling a method containing method parameters only will require the user to construct a standard curve before measuring samples. Version 2.0 57 TAKING A MEASUREMENT To perform a measurement, insert the cuvette containing the reference solution in the cuvette holder and press the take reference icon. Remove and replace with a cuvette containing the sample and press the take measurement icon. A single reference suffices for subsequent analyses in the same series. To view the standard curve whilst on the sample measurement screen, simply press the ‘View Curve’ icon that appears under the options menu. Note: Saving the method using the Save Method icon that appears on the options menu will save both the method parameters and the standard curve. Recalling a method containing method parameters and standard curve allows the user to measure samples directly. SAVING & PRINTING For details of manual saving and printing see the Saving and Printing section. Version 2.0 58 DETERMINATION OF PROTEIN CONCENTRATION USING DIRECT UV METHODS The direct UV method of protein determination has a number of advantages over traditional colorimetric assays in that it does not rely on an external protein standard and the sample is not consumed in the assay. However the presence of nucleic acid in the protein solution can have a significant effect due to strong nucleotide absorbance at 280 nm. This can be compensated by measuring A260 and applying the equation of Warburg and Christian for the protein crystalline yeast enolase (Equation 1). Protein concentration (mg/ml) = (1.55 × Abs280) – (0.76 × Abs260) 1 Protein concentration = (Factor 1 × Abs280) - (Factor 2 × Abs260) 2 The BioDrop spectrophotometers use default A260 and A280 factors of 0.76 and 1.55, respectively. These factors can be edited so that the equation can be applied to other proteins (Equation 2). Compensation for background, dilution and pathlength can also be entered. To customise Equation 2 for a particular protein, the A260 and A280 values should be determined at known protein concentrations to generate simple simultaneous equations, which, when solved provides the two coefficients. In cases where Factor 2 is found to be negative, it should be set to zero since it means there is no contribution to the protein concentration due to absorbance at 260 nm. The A260/A280 ratio also gives an indication of protein purity; a ratio of 0.57 can be expected for pure protein samples. BACKGROUND CORRECTION To compensate for the effects of background absorbance caused by turbidity, high absorbance buffer solutions and the use of reduced aperture cuvettes the BioDrop spectrophotometers can use background correction at a 320 nm. When used A320 is subtracted from A260 and A280 prior to use so that: Protein concentration = [Factor 1 ×(Abs 280 - Abs 320)] - [Factor 2 ×(Abs 260 - Abs 320)] Ratio = (Abs 260 - Abs 320) / (Abs 280 - Abs 320) The use of background correction can remove variability due to handling effects of low volume disposable cuvettes. Version 2.0 59 PROTEIN UV MEASUREMENT PARAMETERS Set Pathlength and Dilution Factor to the required values. Check above to see if background correction is required. The default values for A260 Factor and A280 Factor are 0.76 and 1.55, respectively; these can be edited by pressing the appropriate box. Set Units to encompass the expected concentration of your samples. You may advance to the next screen at any time by pressing the forward arrow and return to the previous screen by pressing the back arrow. Integration Time can be set as you wish. The Sample Seed entered under Sample will the filename of any saved file. Set the outputs required in your method. For more information see the section Saving and Printing. TAKING A MEASUREMENT To perform a measurement, insert the cuvette containing the reference solution in the cuvette holder and press the take reference icon. Remove and replace with a cuvette containing the sample and press the take measurement Version 2.0 60 icon. A single reference suffices for subsequent analyses in the same series. If Background is set to On the A320 result will be included in the left hand column and automatically subtracted from the displayed A260, A280 and A260/A280 results. SAVING & PRINTING For details of manual saving and printing see the Saving and Printing section. Version 2.0 61 PROTEIN A280 MEASUREMENT PARAMETERS Select the Mode you require, the BioDrop spectrophotometers have options for Christian Warburg, BSA, IgG, Lysozyme, Molar Extinction, Mass Extinction and E1% (for Molar Extinction the user will also be required to enter the molar extinction coefficient, and molecular weight and atomic units for Mass Extinction). Set Pathlength and Dilution Factor to the required values. Check above to see if background correction is required. Set Units to encompass the expected concentration of your samples. Integration time can be set as you wish. The Sample Seed entered under Sample will the filename of any saved file. Set the outputs required in your method. For more information see the section Saving and Printing. TAKING A MEASUREMENT To perform a measurement, insert a cuvette (or load directly onto the µLite sample port) containing the reference solution in the cuvette holder and press the reference button. Remove and replace with a cuvette containing the sample (or load sample directly onto the µLite sample port) and press the take measurement button. A single reference suffices for subsequent analyses in the same series. Version 2.0 62 If Background is set to On the A320 result will be included in the left hand column and automatically subtracted from the displayed A260, A280 and A260/A280 results. SAVING & PRINTING For details of manual saving and printing see the Saving and Printing section. SAVING & PRINTING The BioDrop spectrophotometers allow users to save and print sample data. This can either be included automatically as a method parameter or performed manually from the sample measurement screen. SAVING SAMPLE DATA The BioDrop spectrophotometers allow users to save sample data in three different formats: INTERNAL The sample data is saved to the instrument’s internal memory format. See the Sample Manager section for details on saving and recalling data from the internal memory. Note: To ensure the optimum performance of the BioDrop TOUCH it is recommended that unwanted data be deleted from the instrument’s internal memory at regular intervals. USB Version 2.0 63 The sample data is saved to a USB memory stick in format that can be read by BioDrop spectrophotometers only. Files in this format cannot be opened by Microsoft Excel or similar programmes. Note: Sample data will be saved to the BioDrop Samples directory on the USB memory stick; if this directory is not present it will be created. Warning – when data is being written to the USB memory stick the LED will be lit. DO NOT remove the memory stick at this stage otherwise data may become corrupted. If you have completed your set of measurements exit the application which will close the file on the memory stick. USB CSV The data is saved to a USB memory stick in comma separated variable (CSV) format allowing it to be opened directly using Microsoft Excel or other similar programmes. Files in this format cannot be opened using the instrument. Note: To view the data displayed in the File Created, Date and Time cells in a recognised format this will need formatting as described below: File Created: Right click in the appropriate cell and select Format Cells from the list, select Custom dd/mm/yyyy h:mm from the list on the right hand side (see below) and select ok. Date / Time: Right click in the appropriate cell and select Format Cells from the list, under Category select Date or Time and the desired format from the list on the right hand side (see below) and select ok. Version 2.0 64 AUTOMATIC SAVING The option to save sample data automatically is set under method parameters. With Auto Save set to on, the save location can be set to Internal, USB or USB CSV (the USB options are only available if a USB memory stick is inserted). The filename given to an automatically saved file will be either the Sample Seed entered in the method parameters or, if the user chooses not to enter a Sample Seed, Default. The BioDrop TOUCH will only save one ‘Default’ file per application; subsequent saves of files without a sample seed will overwrite the previous default file. As sample data is saved when the user exits the application removing a USB memory stick before exiting will result in loss of data. Note: All files are appended with a unique time and date stamp it is therefore possible to create two or more files sharing the same name. Note: With Overlays ≥2 in Wavescan and Number of Samples ≥2 in Kinetics the overlaid data will always be saved automatically to the instrument’s internal memory. Warning – when data is being written to the USB memory stick the LED will be lit. DO NOT remove the memory stick at this stage otherwise data may become corrupted. If you have completed your set of measurements exit the application which will close the file on the memory stick. MANUAL SAVING If a method does not require sample data to be saved each time a measurement is taken it is possible to manually save sample data in one of the formats outlined above. This procedure is described below: Version 2.0 65 After collecting all required sample measurements select save sample data from the options menu on the sample measurement screen to display the dialogue box shown left. The save location and filename are set by pressing the Save to and Sample Name boxes, respectively. If no Sample Name is entered the file will be titled Default Note: Any sample data saved manually will override the auto save function. EXPORTING DATA The BioDrop spectrophotometers allow users to recall saved sample data from the internal memory or a USB memory stick and save this in another format. This is done as follows: Recall saved data using Sample Manager and press the save sample button on the options menu to display the save sample dialogue box. Set the desired save location and filename using the Save to and Sample Name boxes, respectively and press the tick to confirm the data export. SAMPLE MANAGER Sample Manager is the application used by the BioDrop spectrophotometers for saving and recalling data from both the instrument’s internal memory and the instrument’s USB format. Sample Manager can be accessed from either the main screen pressing Sample Manager (below left) or from within an application using the Sample Manager icon on the options menu (below right). To recall a saved file, highlight the desired file and press the Sample Manager icon in the right hand corner of the screen. Data will be displayed on the Sample Measurement screen (see Recalled Files below). With a USB memory stick inserted it is possible to toggle between the internal and USB memories using the icon in the left hand corner of the screen. The location of the displayed data will be indicated by the icon in the top right hand corner. Version 2.0 66 Sample Manager has been designed to make finding saved files as simple as possible. Therefore it is possible to arrange files alphabetically, by application or by date/time saved by pressing the column headers Sample ID, Application and Date, respectively. If there are too many saved data files to fit on a single screen this is signified at the top of the screen, e.g. Page 1 of 2. Scrolling through the screens is achieved using the up and down arrows at the bottom of the screen. Note: Sample Manager can only display the first 100 sample data files; if the internal memory or USB stick contains >100 files these can be viewed be deleting or moving (USB only) unwanted data. DELETING DATA FROM THE INTERNAL MEMORY To ensure that the internal memory of the instrument does not contain too many unwanted data files, Sample Manager allows you to delete files. This can be done in one of three ways: Deleting a single file: Highlight the file for deletion and press the delete button Deleting multiple files: Highlight multiple files and press the delete button Deleting all files: Press the ‘Delete all’ icon at the bottom of the screen. Note: It is only possible to delete data using Sample Manager accessed from the main screen. Sample Manager does not allow a user to delete sample data files from a USB memory stick; this must be done using a PC. Sample Manager allows the user to lock files saved to the internal memory to prevent the accidental deletion of files containing precious data. To lock files, highlight the required data and press the lock icon at the bottom of the screen. Locked files are signified by the lock icon in the right hand column. Once a file is locked selecting ‘Delete’ or ‘Delete All’ does not clear this data from the instruments’ internal memory. To unlock a file, highlight the appropriate locked data and press the lock icon at the bottom of the screen. Note: As sample data files saved to a USB memory stick must be deleted using a PC it is not possible to lock USB sample data using Sample Manager. To exit from Sample Manager press the ‘Exit’ icon. Version 2.0 67 ACCESSING SAMPLE MANAGER FROM THE MAIN SCREEN When accessed from the main screen Sample Manager will display all files held on the internal memory or USB memory stick and allows the user to lock and delete files saved to the internal memory. As Sample Manager accessed from the main screen allows users to delete files from the instrument’s internal memory this option is disabled for Limited users. To allow post scan manipulation of saved wavescan and kinetics data, files loaded from Sample Manager are loaded directly into Trace Manager (see Trace Manager section for details). Note: With large numbers of files held on the internal memory there may be a short delay before Sample Manager opens. ACCESSING SAMPLE MANAGER FROM WITHIN AN APPLICATION When accessed from within an application Sample Manager will only display files belonging to that specific application and only allows users to recall saved data and lock files. Version 2.0 68 RECALLED FILES When recalled, sample data files will display the first sample recorded in a measurement. To access all sample data within a recalled file press the Sample box to display a list of all samples contained within the file. Pressing on the desired file will populate the boxes on the sample measurement screen with the saved data. Choosing to measure another sample with an old sample’s data displayed simply updates the sample measurement screen and the appropriate boxes. Note: Wavescan and kinetics sample data is recalled using Trace Manager. For details see the Trace Manager section for details. Version 2.0 69 SAVING METHODS The BioDrop spectrophotometers allow users to store methods to the both the instruments internal memory and to USB memory sticks. The procedure for saving methods is described below: After selecting the desired application and setting the required method parameters select the Save Method icon from the options menu on the sample measurement screen. Set the desired file name and save location using the dialogue box shown below. Pressing the Folder box produces a list of available save locations. USB will only appear on the list if a USB memory stick is inserted. Pressing the Method Name box allows the user to set the desired method name using alpha numeric text entry. Press the tick to save and exit or the cross to exit without saving. METHODS SAVED TO THE INTERNAL MEMORY Methods saved to the instrument’s internal memory are stored in either the Methods or Favourites folders, both of which are accessed via the main screen. The BioDrop spectrophotometers are capable of storing up to 90 methods on the instrument’s internal memory. Version 2.0 70 METHODS FOLDER The Methods folder is made up of 9 folders each capable of storing up to 9 methods. The method folder icons have been designed to give the user an indication of the number of methods that are stored in that folder. RENAMING METHOD FOLDERS Using the Rename Folder icon on the options menu (the left hand icon) it is possible to rename any of the 9 method folders using alphanumeric text entry. LOCKING SAVED METHODS Using the lock folder icon on the options menu (the centre icon) it is possible to add pass code protection to any of the method folders. Locked folders cannot be renamed and are indicated by a padlock. Within a methods folder it is possible to add pass codes to individual methods and to lock them from deletion using the lock icon on the options menu (the centre icon). Locked methods can be unlocked by using the unlock icon on the options menu (the right hand icon), selecting the desired method and entering the correct pass code. Version 2.0 71 DELETING SAVED METHODS Within a methods folder it is possible to delete saved methods using the delete icon on the options menu (the left hand icon) and selecting the desired file. Note: Locked methods must be unlocked to allow deletion. BACKING UP METHOD FOLDERS TO USB With a USB stick inserted it is possible to use the USB icon on the options menu (the right hand icon) to: Backup Folder: Copies all methods from a specified folder to a USB memory stick Restore Folder: Copies a backed up method folder from the USB memory stick to the internal memory Backup All Folders: Copies all method folders from the internal memory to a USB memory stick Restore All Folders: Copies all backed up method folders from the USB memory stick to the internal memory FAVOURITES FOLDER The Favourites folder is capable of storing up to 9 user defined methods. Methods stored in the Favourites folder can be locked and deleted as described above. Version 2.0 72 SAVING METHODS TO USB To save files to a USB memory stick follow the procedure described above and select USB in the Folder box. The USB option will only appear in the list if a USB memory stick is inserted. Methods saved to a USB memory stick will appear in the BioDrop Methods folder in the root directory. Note: Although it is possible to save an unlimited number of method files to a USB memory stick only 9 can be displayed on the instrument at any one time. As these will only be read from the BioDrop Methods folder, additional files can be stored in other locations. PRINTING PRINTING SAMPLE DATA The BioDrop spectrophotometers allowsusers to print sample data in one of two ways: Note: Only available printers will be shown in the Print to… options box. INTERNAL PRINTER Data can be printed to the built in printer when fitted. Data is printed with method header, instrument serial number, time/date and all sample results. If numerical data is being shown on the display only this data will be printed, if graphics are displayed on the screen these will be printed as well as numerical data. The built in printer is available as an accessory and can easily be fitted to existing instruments – see instructions at the end of this manual. PRINT VIA COMPUTER (PVC) Print via Computer (PVC) is an application running under Microsoft Windows™ to enable the BioDrop spectrophotometers to transfer data into a PC environment. From there the data can be printed or saved in a variety of formats, including graphics and text formats or as an Excel™ file. PVC can store data either to a common directory or be configured to save to independent directories by both file format and instrument serial number. PVC is capable of supporting several instruments simultaneously, limited only by hardware and the speed of the host system and operates via USB cable. Installation and operating instructions for PVC can be found on the CD-ROM for the respective BioDrop spectrophotometer. Version 2.0 73 AUTOMATIC PRINTING The option to print sample data automatically is set under method parameters. With Auto Print set to on, the print location can be set to one of the available options. MANUAL PRINTING If a method does not require sample data to be printed each time a measurement is taken it is possible to manually print sample data. This procedure is described below: Set the desired print location in Print to… After collecting all required sample measurements select the Print icon from the options menu on the sample measurement screen. Version 2.0 74 Built in Printer – Installation Guide This section outlines the method of how to install a built in printer on a BioDrop TOUCH. A B Turn the instrument over and place on a soft surface and screws from positions A and B. Turn the instrument back over and lift the accessory cover vertically upwards to remove. Remove the tie-wrap from the printer cable Plug the accessory cable into the printer noting the alignment lug Version 2.0 75 Place the accessory cover on top of the printer and then lower the printer onto the locating bosses and push down firmly. Bosses Invert the instrument and replace the accessory cover s screws at A and B and add the printer mounting screws at positions C & D C A Version 2.0 D B 76 Set the built in printer by pressing Settings and Data Output icons. Built in Printer – Refilling the Printer Paper Lift off the paper cover Place paper roll into printer with paper feeding from bottom. Feed printer into slot and turn knob to feed paper. Version 2.0 77 Replace paper cover Version 2.0 78 TECHNICAL SPECIFICATIONS Parameter BioDrop TOUCH BioDrop TOUCH PC Display 5.7” colour display with capacitive touch panel None BioDrop µLite 5.7” colour display with capacitive touch panel Configuration Split Beam Lamp Pulsed Xenon lamp with 3 year warranty Wavelength Range 190nm-1100nm Wavelength Accuracy ±2nm Wavelength Reproducibility ±1nm Spectral Bandwidth 5nm Stray Light <0.5%T at 220nm and 340nm Using NaNO2 Photometric Range -0.3A to 2.5A, 0 to 199%T Photometric Accuracy ±0.005A or 1% of the reading, whichever is greater at 546nm Photometric Reproducibility ±0.003A (0 to 0.5A), ±0.007A(0.5 to 1.0A) Noise 0.005A peak to peak, 0.002A RMS Power Input 90-250V, 50/60 Hz, Max 50VA Dimensions 420 x 260 x 185 mm Weight Approx. 3kg Resolution Life Science Software DNA, RNA, Oligo, Dye Labelling, Tm calculation, direct UV and colorimetric protein methods Languages English, French, German, Spanish Version 2.0 DNA, RNA, Oligo, Dye Labelling, Tm calculation, direct UV and colorimetric protein methods, cell density measurement English BioDrop Duo DNA, RNA, Oligo, Dye Labelling, Tm calculation, direct UV and colorimetric protein methods English, French, German, Spanish English, French, German, Spanish 79 TABLE OF ICONS ICON TITLE Back arrow Returns the user to the previous screen. Forward arrow Advances the next screen in a sequence. Open options menu Page down Page up Displays the relevant options menu, the exact content of the menu will depend upon the location. Allows the user to navigate to the next page Allows the user to navigate to the previous page Cursor left Used in the wavescan and kinetics applications to move the cursor left. The position of the cursor and the corresponding x and y values are displayed above the scan. Cursor right Used in the wavescan and kinetics applications to move cursor right. The position of the cursor and the corresponding x and y values are displayed above the scan. Toggle data viewed / reset When used in the Cydye DNA application this toggles the data displayed between DNA and dye data. Under Instrument Settings this will resets a value. Delete all Deletes all saved data/methods. Delete all is a two stage process. Delete Version 2.0 FUNCTION Deletes the highlighted data/method. Delete is a two stage process 80 Thresholds Used in Equation Editor. This allows users to add thresholds (pass/fail) limits to their results. Ok / accept Used to confirm / accept any changes. Exit Exits from an application or screen. If exit is selected without saving, any changes will be lost. Lock Locks sample data file/method folder against accidental deletion. Unlock Version 2.0 Unlocks a locked method folder. Instrument Used in Sample Manager to access sample data files stored on the instrument's internal memory or to indicate that the data being displayed is from the internal memory. Add linear section Used in the kinetics applications to view a line of best fit on the scan. Section Used in kinetics applications to view data in a specific section. It is possible to add t0 through to t7. Method folder Methods saved internally can be stored in one of nine method folders (each capable of storing up to nine individual methods). Rename method folder Accessed via the options menu on the methods screen, this allows the method folder to be renamed. 81 Toggle view scan on or off Used in the nucleic acid applications DNA, RNA and Oligo this allows the user to view a survey scan of the last sample run (in the region 220 - 320 nm). Toggle auto print on or off Accessed via the options button on the sample screen. Pressing this button toggles auto print on and off. View method parameters Print data Save method parameters Accessed via the options button on the sample measurement screen. Pressing this button prints the sample data. Accessed via the options button on the sample measurement screen. This allows a method to be saved to a location specified by the user. Save sample data Accessed via the options button on the sample measurement screen. This allows sample data to be saved to a location specified by the user. Sample Manager Accessed via the options button on the sample measurement screen. Displays the sample data held in the either the internal memory or on a USB memory stick. Instrument Information Instrument Settings Lamp Settings Version 2.0 Accessed via the options button on the sample measurement screen. Pressing this button takes the user back to the method parameters. Accessed via instrument settings. This displays instrument information such as product name, serial number etc. Accessed via instrument settings. This allows the user to set the default bandwidth, save new baselines and view the date of the last service. Accessed via instrument settings. 82 Save instrument options Auto print - internal printer Auto print - USB Xenon lamp failed Displayed on the status bar. This indicates that the instrument will automatically print all sample data to the internal printer Displayed on the status bar. This indicates that the instrument will automatically print all sample data via PVC. Displayed on the status bar. This indicates that the xenon lamp has failed. Instrument busy Displayed on the status bar. This indicates that the instrument is performing a measurement. Printing to internal printer Displayed on the status bar. This indicates that the instrument is printing to the internal printer. Printing to USB Displayed on the status bar. This indicates that the instrument is printing via PVC. Toggle view standard curve When used in standard curve applications i.e. Lowry protein assay, this toggles the sample measurement screen to display or hide the standard curve. Replicates Version 2.0 Accessed via instrument settings. This saves the instrument options. Used in standard curve applications to collect data from a group of replicates. Take sample measurement Commences a sample measurement. A reference measurement must be taken prior to a sample measurement Take reference measurement Commences a reference measurement. 83 Backspace / delete Forward space Lower case Symbols Upper case Numeric Version 2.0 Used in text entry mode to move the cursor backwards (left) and delete any unwanted characters. Used in text entry mode to move the cursor forwards (right). Selects lower case letters when in text entry mode. Selects symbols when in text entry mode. Selects upper case letters when in text entry mode. Selects numeric entry when in text entry mode. Trace Manager Used in the wavescan and kinetics applications. This allows the user to overlay up to 8 samples data files and to choose what type of data is displayed i.e. raw data, smoothed data, 1st derivative. USB Used on the Sample Manager screen to access data stored on a USB memory stick. Used in the options menu in the methods folder to allow the user to backup methods to a USB memory stick. Add user Displayed under User Access, this allows anyone with Administrator privileges to add another user to the instrument. Delete user Displayed under User Access, this allows anyone with Administrator privileges to delete users from the instrument. Edit user Displayed under User Access, this allows anyone with Administrator privileges to edit currently users' parameters. Zoom in Used in the wavescan and kinetics applications. This allows the user to zoom into a specific region of a scan. 84 Zoom out Used in the wavescan and kinetics applications. This allows the user to zoom out and return to the original scan. GLOSSARY OF BOXES BOX FUNCTION Toggles between on and off. Used in all applications to set whether sample data is printed automatically or not Toggles between on and off. Used in all applications to set whether sample data is saved automatically or not Can be toggled on and off. Used in nucleic acid and protein measurements to subtract the absorbance value at 320 nm. This is done to allow for the effects of turbidity, high absorbance buffer solutions and the use of reduced aperture cuvettes. Set by numeric entry. Used in Cydye DNA measurements only and enables the user to specify the wavelength of background correction. Used in Tm calculation to set the sequence of bases. The bases A, C, G, T can be added in DNA mode and the bases A, C, G, U can be added in RNA mode. Bases are grouped in threes to improve readability. Used in Tm calculation to toggle between DNA and RNA base types. Used in User Interface in Settings to set the brightness of the screen. Version 2.0 85 Numeric entry, used in Tm calculation only. Buffer molarity = buffer molarity + total molarity of salt (moles / L). Used in all standard curve applications to set the method used to collect the standard curve. Options are for Standards or Manual. Set by numeric entry, used in the Cydye DNA application only. This is the correction factor applied to the absorbance of the dye at a specified wavelength. Used in Tm calculation only this allows the user to add the type of counter ion used. The options are sodium (Na), potassium (K), triethylammonium (TEA) or other. If other is selected the molecular weight of this counter ion must be added using Other MW. Used in all standard curve applications this is the curve fit that will be applied to the standards' absorbance values. Options are Zero Regression, Regression, Interpolation and Cubic Spline. Alphanumeric entry for custom dye name, used in Cydye DNA only. Numeric entry. This is the delay required before a kinetic measurement commences. Numeric entry. This is used in nucleic acid and protein applications to compensate for the absorbance of highly concentrated samples. Used in wavescan only, this switches display of peak cursors on and off. Peak cursors show vertical dashed lines displaying the measured peak height and horizontal dashed lines showing the peak width Version 2.0 86 Numeric entry. This is the duration over which a kinetic measurement is performed. Used in Cydye DNA application only. This is the first dye type used in the measurement. Used in Cydye DNA application only. This is the second dye type used in the measurement (where applicable). Numeric entry for Cydye DNA application only. This is the extinction coefficient of the specified dye. Note for dyes included in the BioDrop software these values are not editable and the box will be greyed out. Numeric entry to 3 decimal places. In concentration and nucleic acid measurements multiplying absorbance readings by this factor gives the concentration value. In kinetic measurements the result is calculated by multiplying this factor by absorbance, delta absorbance or the slope. Used in wavescan measurements only. This determines the sensitivity of the peak or valley detection i.e. sensitive will detect more peaks or valleys than course. Options are; Off, Coarse, Sensitive or Custom (when custom is selected the minimum peak height and width must be entered). Toggles between wavelength and absorbance, used in wavescan measurements only. This determines how features will be ordered in the peak/valley table below the scan. Toggles between peaks and valleys, used in wavescan measurements only. This determines what feature type will be detected. Used in User Access to set the group a user will belong to and what access they will be granted. Version 2.0 87 Used in all applications. This is the duration the instrument will take a reading at an individual wavelength. The longer the integration time, the greater the signal to noise ratio and the greater the accuracy. Numeric entry. This is the interval at which serial kinetics readings will be taken. Numeric entry. This is the upper limit of a wavescan measurement. Numeric entry. This is the lower limit of a wavescan measurement. Note that when using the BioDrop TOUCH the max wavelength must always be greater than the min wavelength by at least the step value. Used in the Single Wavelength, Kinetics and Protein A280 applications to set the required measurement mode. Used in Cydye DNA application only, this sets the nucleic acid used in the measurement. Toggles between 1 and 2. Used in Cydye DNA application only to set the number of dyes used in the measurement. Numeric entry. This option is only used if the counter ion type in the Tm calculation is set to Other. Used in User Access to set a password for new users Used in the nucleic acid applications, Protein A280 and Protein UV. This is the pathlength of the cuvette used in the measurement. Options are for 10mm, 5mm, 2mm, 1mm, BioDrop500, BioDrop125 and Lite 0.5 mm. Version 2.0 88 Toggles between yes and no. Used in Tm calculation to set if the sample to be measured is phosphorylated or not. Numeric entry to 3 decimal places. Used in Tm calculation to sets the primer concentration in pmole/mL. Used in all applications to set the desired print location. Only available printers are displayed. Toggles between On and Off, used in Equation Editor only. With Prompt on the measurement will proceed as follows: measure wavelength 1, prompt for sample, measure wavelength 2, prompt for sample etc. Used in all standard curve applications. This is the number of times a standard measurement is repeated before the mean of these values is plotted on the standard curve. Options are off (1 measurement), 2 or 3. Used in wavescan measurements, this determines how many samples will be overlaid on the graph. Options are off, 2 to 8. Used in kinetic measurements, this sets the number of samples that will be measured during the method. Options are 1, 2 or 3. Used in all applications to set the desired save location. Only available locations are displayed. Used in User Interface in Settings to set the time before the BioDrop screensaver will be displayed Used by the Default Administrator in User Access to set if user login will be displayed or not. Version 2.0 89 Used in all standard curve applications. This is the number of standards that will be used to create the standard curve; options are from 1 to 9. Numeric entry to 2 decimal places. Used in all standard curve applications this is the concentration of the standard. Used in User Interface in Settings to set the text entry mode used for alphanumeric text entry. Used in applications where a concentration is the end result. Units are entered via either alphanumeric entry or from a list of options. Used in User Access when creating a new user. Numeric entry to 3 decimal places, this is used in the Cydye DNA application and is the volume of the probe in µL. Numeric entry to 1 decimal place and is used in all fixed wavelength applications to determine the wavelength at which the measurement will be performed. Numeric entry to 1 decimal place. Used in the Cydye DNA application, this is the wavelength at which the absorbance of the dye will be measured. Note for dyes included in the BioDrop software these values are not editable and this box will be greyed out. Numeric entry to 3 decimal places. This is the maximum value of the Y axis shown during a kinetics measurement. Note the graph will automatically rescale at the end of the measurement to give the optimum Y max. Version 2.0 90 Numeric entry to 3 decimal places. This is the minimum value of the Y axis shown during a kinetics measurement. Note the graph will automatically rescale at the end of the measurement to give the optimum Y min. Version 2.0 91