1
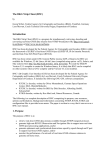
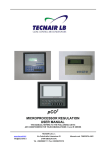
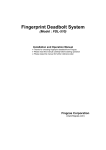
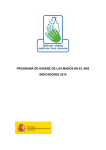
Space Flight Technology, German Space Operations Center (GSOC) Deutsches Zentrum für Luft- und Raumfahrt (DLR) e.V. Thermal-Vacuum Testing of the Phoenix GPS Receiver H. Lux, M. Markgraf Doc. No. : TN 04-07 Version : 1.0 Date : Oct. 05, 2004 Document Title: Thermal-Vacuum Testing of the Phoenix GPS Receiver Document No. TN 04-07 DLR/GSOC ii Issue 1.0 Oct. 05, 2004 No part of this document shall be reproduced in any form or disclosed to third parties without prior authorization. Document Title: Thermal-Vacuum Testing of the Phoenix GPS Receiver iii Document Change Record Issue Date 1.0 Oct. 04, 2004 Document No. TN 04-07 DLR/GSOC Pages Description of Change First release Issue 1.0 Oct. 05, 2004 No part of this document shall be reproduced in any form or disclosed to third parties without prior authorization. Document Title: Thermal-Vacuum Testing of the Phoenix GPS Receiver Document No. TN 04-07 DLR/GSOC iv Issue 1.0 Oct. 05, 2004 No part of this document shall be reproduced in any form or disclosed to third parties without prior authorization. Document Title: Thermal-Vacuum Testing of the Phoenix GPS Receiver v Table of Contents Document Change Record ...................................................................................................iii Table of Contents ...................................................................................................................v Scope.......................................................................................................................................1 1. Introduction.......................................................................................................................3 2. Test Setup and Performance ...........................................................................................4 2.1 Thermal tests..............................................................................................................5 2.2 Thermal-Vacuum tests ...............................................................................................7 3. Results and Analysis......................................................................................................10 3.1 Component temperatures.........................................................................................10 3.2 Current Drain............................................................................................................11 3.3 Oscillator Drift...........................................................................................................12 4. Tracking Performance and Navigation Accuracy........................................................15 4.1 Tracking performance ..............................................................................................15 4.2 Navigation Solution Accuracy...................................................................................16 4.3 Signal-to-Noise Ratio ...............................................................................................17 4.4 Raw Data Evaluation................................................................................................18 Summary and Conclusions .................................................................................................20 Notation and Symbols .........................................................................................................21 References ............................................................................................................................23 Document No. TN 04-07 DLR/GSOC Issue 1.0 Oct. 05, 2004 No part of this document shall be reproduced in any form or disclosed to third parties without prior authorization. Document Title: Thermal-Vacuum Testing of the Phoenix GPS Receiver Document No. TN 04-07 DLR/GSOC vi Issue 1.0 Oct. 05, 2004 No part of this document shall be reproduced in any form or disclosed to third parties without prior authorization. Document Title: Thermal-Vacuum Testing of the Phoenix GPS Receiver 1 Scope This note describes the thermal-vacuum testing of the Phoenix GPS receiver, which has been conducted as part of a space qualification program for COTS receiver hardware. It supplements the technical description of the receiver and further environmental tests (e.g. total ionization dose susceptibility) that are provided in independent reports. Document No. TN 04-07 DLR/GSOC Issue 1.0 Oct. 05, 2004 No part of this document shall be reproduced in any form or disclosed to third parties without prior authorization. Document Title: Thermal-Vacuum Testing of the Phoenix GPS Receiver Document No. TN 04-07 DLR/GSOC 2 Issue 1.0 Oct. 05, 2004 No part of this document shall be reproduced in any form or disclosed to third parties without prior authorization. Document Title: Thermal-Vacuum Testing of the Phoenix GPS Receiver 3 1. Introduction Equipment, which is used for space applications, needs to meet specific design, performance and analysis requirements. The purpose of thermal-vacuum testing is to quantify the thermal performance of the test device in an environment similar to its working environment. It should demonstrate the ability of the device to withstand certain thermal stress and work under realistic in orbit conditions with an additional adequate margin. The qualification margin should not create unrealistic conditions that lead to failure of equipment and is commonly set to ±10°C on the maximum and minimum temperatures for thermal tests. Possible problems which can occur under these conditions are outgassing of equipment, expansion or contraction as well as a change in convection and conductive heat transfer characteristics, which might lead to short circuits or overheating of materials. Fig. 1.1 Phoenix GPS receiver main board (Sigtec MG5001 board with standard connectors and backup battery) The present study was conducted to assess the performance of a COTS based GPS receiver under representative space conditions. The Phoenix receiver is a miniature GPS receiver that has been adapted by DLR/GSOC for high-dynamics and space applications. It offers single-frequency C/A code and carrier tracking on 12 channels and can be aided with a priori trajectory information to safely acquire GPS signals even at high altitudes and velocities [1]. The Phoenix receiver (Fig. 1.1) employs an almost identical tracking and navigation software as DLR’s flight proven GPS Orion space receiver but uses an industrial hardware platform (Sigtec MG5001[2], [3]) with minimal modifications. The receiver is built around the GP4020 baseband processor of Zarlink, which combines a 12 channel correlator for L1 C/A code and carrier tracking, a microcontroller core with 32 bit ARM7TDMI microprocessor and several peripheral functions (real-time clock, watchdog, 2 UARTS etc.) in a single package. Other key components include the GP2015 front-end chip, a 512 kByte flash EPROM, and 256 kByte of SRAM memory. A detailed description of the receiver is provided in the Phoenix User’s Guide [4]. The tested equipment is intended for use in LEO satellites flying at typical altitudes of 400 km to 1,000 km with an approximate orbital period of 1½ h. This results in a cyclic temperature change with the same period. The fastest temperature changes occur at the change from day to night side or the other way round. Therefore thermal cycling tests between two extreme temperatures are recommended to verify the correct functioning of equipment under thermal stress. Such tests have not been conducted for the Phoenix receiver before and are therefore a completion of other environmental tests already performed for this receiver type. The tests should not only show the mere functionality under TVAC conditions but also assess a possible temperature dependence of the noise level of the raw data and navigation solution. This aspect should be investigated as well as the temperature dependence of other receiver specific data. Document No. TN 04-07 DLR/GSOC Issue 1.0 Oct. 05, 2004 No part of this document shall be reproduced in any form or disclosed to third parties without prior authorization. Document Title: Thermal-Vacuum Testing of the Phoenix GPS Receiver 4 2. Test Setup and Performance The tests described in this report have been conducted at DLR/GSOC in Oberpfaffenhofen, Germany, in the time frame from July 9, 2004 to July 21, 2004. As a guideline for the test setup and execution the ECSS standards for testing of space systems [4], [5] was employed. The tests have been performed in close accordance with this standard, but with some restrictions due to limitations imposed by the available test equipment, described subsequently in more detail. All tests have been conducted with Phoenix receiver unit #19, running software version D08B (July 2004) for LEO satellite applications. Because of the small bandwidth of the carrier tracking loop applied in this specific software version the receiver exhibits an increased sensitivity to external interferences compared to e.g. the sounding rocket version. This simplifies the detection of potential changes in the noise levels on the navigation and raw data during the tests. The only modification of the original hardware concerns the back-up battery, which will not be flown in space and was thus removed prior to the start of the tests. To enable an accurate assessment of the tracking and navigation performance during each test run, all tests have been conducted in a zero base line configuration. In addition to the device under test, an identical reference receiver was operated outside the test chamber, supplied with GPS signals from the same antenna. This specific configuration allows to eliminate the systematic errors that are common to both receivers, such as atmospheric propagation delays as well as clock and ephemeris errors by using adequate postprocessing techniques. When forming double differences, the only remaining error on the raw data is the measurement noise produced inside the receivers which gives a good indication of the current receiver performance. Fig. 2.1 depicts the test setup employed for the thermal vacuum test. Antenna GPS Indoor Network Thermal/thermal-vacuum chamber Power Divider DC block Test receiver (Ampl., Splitter) Power Reference receiver Multimeter Interface board Power Computer Laptop Laptop Fig. 2.1 Structural diagram of the test setup for the Phoenix GPS receiver thermal-vacuum tests. The GPS signals were fed into the receivers through a power divider. For the test receiver a further intermediary device, a DC block, was inserted into the antenna line to decouple the active antenna power supply of both receivers. Two different antenna systems were used during the tests. Most of the time both receivers were connected to an antenna mounted on Document No. TN 04-07 DLR/GSOC Issue 1.0 Oct. 05, 2004 No part of this document shall be reproduced in any form or disclosed to third parties without ithout prior authorization. Document Title: Thermal-Vacuum Testing of the Phoenix GPS Receiver 5 top of the roof of the laboratory building, providing an unobscured view to almost the entire hemisphere. However, due to temporary irregularities encountered in the tracking behavior of both receivers, that could be clearly attributed to the excessive cable length of the roof antenna system, a part of the tests was performed with an alternative antenna. This antenna was placed in the yard behind the laboratory building in a distance of only a few meters from the building. Due to the poor GPS satellite visibility as well as the dramatically increased multipath interferences encountered for this second antenna configuration, it was decided to switch back to the roof antenna and accept the sporadic signal outages. The receiver’s interface unit, holding the DC-DC converter as well as the serial line drivers, was placed outside the test chamber and connected to the receiver board via a customized adapter cable. The navigation solutions and raw data of the reference receiver and the test receiver were monitored and recorded on a single Laptop. The current consumption of the device under test has been recorded on a second computer for post processing purposes. During the TVAC-tests a third computer was used to display and store the temperature readings. 2.1 Thermal tests An initial series of tests has been carried out in a simple thermal chamber and under normal ambient pressure conditions (Fig. 2.2). The basic setup for these tests was almost identical to that subsequently used for the thermal-vacuum tests, which is illustrated above in Fig. 2.1. Both setups differed only with regard to how temperatures were measured inside the chamber. During the thermal tests, the temperature was measured with the help of a digital thermometer, whose probe was inserted into the test chamber through a small access hole in the wall of the test chamber (Fig. 2.3). The temperature readings had to be noted down manually. The temperature of the receiver itself couldn’t be measured directly during these tests. However, due to its low mass as well as the small form factor the test board is expected to adapt its temperature to the ambient temperature inside the chamber in a reasonable short time. Thus, the temperature readings obtained by the digital thermometer were considered to be almost identical to the actual receiver board temperature. Temperature probe Fig. 2.2 Thermal test chamber with temperature control unit below. Document No. TN 04-07 DLR/GSOC Fig. 2.3 View into thermal chamber. The test receiver was placed onto a block of insulation material and connected to the outside world via antenna and interface cables. One the left-hand side of the chamber one may identify the probe of the digital thermometer. Issue 1.0 Oct. 05, 2004 No part of this document shall be reproduced in any form or disclosed to third parties without ithout prior authorization. Document Title: Thermal-Vacuum Testing of the Phoenix GPS Receiver 6 To assure a rapid establishment of a thermal equilibrium within the chamber during the tests, the air was permanently kept in motion by means of a fan mounted in the back wall of the chamber. As regards the chamber’s walls, however, the temperature may significantly differ form the air temperature, especially during the cooling and heating phases. To avoid a potential falsification of the test results by a direct contact of the test device to the chamber bottom, the receiver has been placed on a block of insulating material during these tests, as shown in Fig. 2.3. In the initial test, the temperature inside the chamber was increased in steps of 20°C from room temperature (+22°C) up to the maximum specified storage temperature of +80°C. At each step the temperature was held constant for about 20 minutes in order to ensure a thermal balance in the receiver and to record a set of reliable data. The receiver remained switched on up to the ECSS specified maximum operations temperature of +60°C. Thereafter the test device was switched off for safety reasons and not reactivated until the temperature dropped again below +60°C at the end of this cycle. After the maximum storage temperature was reached and held for 20 minutes, the chamber has been cooled down to the outside temperature in the laboratory, again in 20°C steps. In the second part of this test the same procedure has been repeated but this time for negative temperatures. The chamber was gradually cooled down from approx. 22°C to 0°C, -20°C and finally -30°C. The ECSS recommended minimum non-operational test temperature of -40°C couldn’t be reached with the present chamber. Tests under these extreme temperature conditions have therefore been postponed for the tests in the TVAC chamber. To avoid potential problems caused by condensation of water in the chamber and on the receiver during this test, the chamber has been flooded with nitrogen at the beginning of the cooling phase. 100 Receiver switched off Maximum non-operation temeparture 80 Maximum operation temeparture Temperature [°C] 60 40 Ambient temeparture 20 0 Minimum operation temeparture -20 Minimum non-operation temeparture -40 -60 6:00 7:00 8:00 9:00 10:00 11:00 12:00 13:00 14:00 UTC time Fig. 2.4 Temperature profile recorded during the first maximum/minimum temperature cycle. Upon reaching the receiver’s specified minimum operation temperature of -20°C, the test device was again deactivated to prevent potential damage. At the end of the low temperature test, after the temperature has been held on a constant minimum level for approx. 20 minutes, the thermal chamber has been switched off. Simultaneous to the start of the warming up process, the receiver was switched on again and the data logging was resumed. The Document No. TN 04-07 DLR/GSOC Issue 1.0 Oct. 05, 2004 No part of this document shall be reproduced in any form or disclosed to third parties without prior authorization. Document Title: Thermal-Vacuum Testing of the Phoenix GPS Receiver 7 chamber has been continuously warmed up to room temperature. To accelerate the process the chamber door has been opened at 0°C, which resulted in an immediate condensation of humidity from the air outside the chamber on the test device. Obviously, as a consequence of this condensation, the receiver stopped outputting data and the power consumption went down to an abnormally low value of about 60 mA at 5 VDC supply power. The receiver resumed normal operation a few minutes later, after it had dried again. Table 2.1 Summary of the various specified temperature limits. Source ECSS testing standard [6] (applicable for qualification testing of AOCS equipment) SigTec (Phoenix hardware manufacturer) max. temp. +70°C min. temp. -40°C op. +60°C -30°C non-op. op. +80°C +70°C -50°C -20°C non-op. Following this initial minimum/maximum test the thermal cycling test has been started. In accordance with the ECSS testing standard [6], the first cycle has once again been performed between the minimum and maximum specified non-operational temperature (-30°C to +70°C). Outside the manufacturer specified operation temperature range, the test receiver was again switched off to avoid a potential damaging of the hardware. The recommended dwell time at the temperature minima and maxima given in the ECSS standard [6] is at least 2h. For practical reasons, this time has been reduced to approximately half an hour. Furthermore, the number of subsequently performed cycles has been reduced from 8 cycles, as recommended in [6], to 4 cycles for reasons of feasibility. The maximum temperature reached during these remaining cycles was + 60°C, the minimum temperature -30°C. The temperature gradient was fully determined by the characteristics of the thermal chamber. It was found to have no constant value, but was at any time notably below the maximum temperature rate of change (20°C/min) specified in [6] for equipment intended for the use within a space vehicle. The observed peak temperature rate was approximately 5°C/min. Throughout the entire test, the GPS navigation and raw data as well as the current consumption and the temperature measurements have been monitored and recorded for post processing purposes. 2.2 Thermal-Vacuum tests As mentioned above, the setup used for the TVAC test differed from the setup employed for the thermal test solely in how the temperatures were measured. Other than for the thermal chamber, the vacuum chamber (Fig. 2.6) was equipped with a sophisticated multi-sensor temperature measurement system which allowed to accurately measure and record temperature data at eight different locations inside the chamber and/or directly on the test device. While four of the temperature probes have been employed to determine the reference temperature of the test chamber’s base plate, the remaining probes were used to monitor the temperature of the key components on the Phoenix receiver board (GP4020 baseband processor, SRAM and EPROM memory ICs and R/F front-end). Fig. 2.5 shows a picture of the test receiver mounted on the base plate of the TVAC chamber and the temperature probes attached to the critical electrical components. At the beginning of the TVAC-test, the pressure inside the chamber has been constantly decreased to less than 0.1 mbar within a time span of approximately 15min. During this phase the receiver was switched on and data have been recorded. For the subsequently performed temperature cycles the pressure was further reduced and held constant at a level of about 5*10-2 mbar. Document No. TN 04-07 DLR/GSOC Issue 1.0 Oct. 05, 2004 No part of this document shall be reproduced in any form or disclosed to third parties without prior authorization. Document Title: Thermal-Vacuum Testing of the Phoenix GPS Receiver 8 The recommended pressure value given in the European standard for space system testing [6] is 10-5 mBar, which could not be achieved in the employed configuration of the TVAC test chamber. This pressure difference, however, is considered of minor importance for the results of the test. Temperature probes Fig. 2.5 (above) Phoenix GPS receiver mounted on the base plate of the thermal-vacuum chamber. The temperature probes have been fixed on the critical components by means of Kapton tape. Fig. 2.6 (left) TVAC chamber with opened vacuum bell and measurement and recording equipment in the foreground . Even though the ECSS testing standard specifies that a single temperature cycle in the vacuum chamber is sufficient, if a complete thermal cycling test has been carried out before, it was decided to perform more than only one cycles. This decision was mainly taken with regards to the reduced number of cycles performed in the thermal chamber before. As for the thermal chamber, the temperature rate of change was exclusively determined by the capabilities of the cooling/heating unit of the TVAC chamber and couldn’t be influenced from outside. Due to the large size of the vacuum chamber the rate was found to be relatively low compared to the thermal chamber tests. The peak value was measured to be approx. 1°C/min. Fig. 2.7 shows the temperature profile (base plate) recorded during the thermal vacuum tests. Document No. TN 04-07 DLR/GSOC Issue 1.0 Oct. 05, 2004 No part of this document shall be reproduced in any form or disclosed to third parties without ithout prior authorization. Document Title: Thermal-Vacuum Testing of the Phoenix GPS Receiver 90 First Session 9 Second Session Third Session 80 70 60 Temperature [°C] 50 40 30 20 10 0 -10 -20 -30 -40 -50 0:00 4:00 8:00 12:00 16:00 20:00 Time [hours] Fig. 2.7 Temperature profile recorded during the tests in the vacuum chamber. In total, the test receiver has gone through four complete temperature cycles under vacuum conditions in three consecutive test sessions. Starting with three cycles between the maximum and minimum operation temperatures of +70°C and -30°C, respectively, the last cycle was carried out between +80°C and -40°C. Other than in all earlier tests, however, the hardware hasn’t been switched off outside the specified operation temperature range during this cycle. This latter test was primarily intended to identify a potential upper and lower maximum temperature at which the receiver stops working properly or breaks down. For completeness it should be mentioned that the receiver has been power cycled several times at both extreme temperature levels to verify its ability to reboot under these extreme environmental conditions. Document No. TN 04-07 DLR/GSOC Issue 1.0 Oct. 05, 2004 No part of this document shall be reproduced in any form or disclosed to third parties without prior authorization. Document Title: Thermal-Vacuum Testing of the Phoenix GPS Receiver 10 3. Results and Analysis The main result of the performed environmental tests with the Phoenix GPS receiver is that the proper and reliable functioning of the device could be successfully demonstrated for the temperature range recommended for space system qualification testing and under vacuum conditions. The test receiver hasn’t undergone any visible changes, nor has it shown any unexpected behavior or even break-down during the conducted tests. It can therefore be considered as qualified for space applications as far as the thermal-vacuum environment is concerned. 3.1 Component temperatures The following observations and results apply to the thermal-vacuum tests only, since measuring of individual receiver components temperatures was only possible during these tests. Fig. 3.1 shows the temperature reading for the receiver’s key components and the base plate of the test chamber for the third of the four performed temperature cycle. 100 90 80 70 Temperature [°C] 60 50 40 30 20 10 0 -10 -20 -30 -40 13:00 14:00 15:00 16:00 17:00 18:00 19:00 20:00 21:00 22:00 Time [UTC] Platte Front-End GP4020 Flash (AM29LV200BB) SRAM (IS61LV12816) Fig. 3.1 Current consumption of the test device and temperature profile for the temperature cycling test in the vacuum chamber. No substantial change could be identified in the recorded temperature values for the key components on the receiver board, during and after the evacuation of the test chamber. This suggests that the thermal balance achieved inside the test board within a few minutes after start of receiver operation does not depend on whether the receiver is operated at atmospheric pressure levels or in a vacuum environment. Obviously no overheating problems have to be considered for the utilization outside the Earth atmosphere and hence no special cooling (or heating) precautions must be taken into account. Document No. TN 04-07 DLR/GSOC Issue 1.0 Oct. 05, 2004 No part of this document shall be reproduced in any form or disclosed to third parties without prior authorization. Document Title: Thermal-Vacuum Testing of the Phoenix GPS Receiver 3.2 11 Current Drain During all tests the current consumption of the receiver has been monitored and recorded as a key indicator for the physical state of the test device. The results have shown that the current drain is clearly correlated with the temperature changes during the thermal cycling (cf. Fig.3.2). 200 100 Current 190 Current [mA] 85 Temperature 70 185 55 180 40 175 25 170 10 165 -5 160 -20 155 -35 150 9:00 11:00 13:00 15:00 17:00 Time [UTC] 19:00 Temperature [°C] 195 -50 23:00 21:00 Fig. 3.2 Current consumption of the test device and temperature profile for the temperature cycling test in the vacuum chamber. The relation between both parameters was found to be almost linear over the tested temperature range. It could be quantified as a change of approximately +1.4 mA per 10°C temperature raise. This results in a total variation of the receiver’s power consumption of approximately 8% over the temperature range from -30°C to +70°C (Fig 3.3) and might need to be considered during the design and dimensioning of the satellite’s power supply system. Current cons. (w.r.t nominal value) [%] 110.0% 107.5% 105.0% 102.5% 100.0% 97.5% 95.0% 92.5% 90.0% -40 -30 -20 -10 0 10 20 30 40 50 60 70 80 Temperature (°C) Fig. 3.3 Relation between current consumption and temperature measurements observed during the thermal cycling test. Document No. TN 04-07 DLR/GSOC Issue 1.0 Oct. 05, 2004 No part of this document shall be reproduced in any form or disclosed to third parties without prior authorization. Document Title: Thermal-Vacuum Testing of the Phoenix GPS Receiver 3.3 12 Oscillator Drift 80 1200 70 1000 60 800 50 600 Temperature 40 400 Test Receiver 30 200 Ref. Receiver 20 0 10 -200 0 6:30 6:45 7:00 7:15 7:30 7:45 Doppler offset [Hz] Temperature [°C] The receiver’s reference oscillator exhibited a notable frequency variations throughout all tests. The changes in the frequency offset were evidently related to the temperature changes, but no simple relation between both parameters could be established. -400 8:00 Time [UTC] Fig. 3.4 Oscillator offset for the test and reference receiver recorded during the initial thermal test for positive temperatures. During the initial thermal test an obvious increase of the frequency offset was recognized with rising temperature (cf. Fig. 3.4). A similar oscillator behavior was observed for the negative temperature range (Fig. 3.5). Surprisingly, the decreasing temperature did not result in a likewise decreasing frequency offset but again in an increasing frequency error, which indicated the nonlinear relation between temperature and oscillator behavior. The ripples on the measurements encountered through the periods of constant temperature can be attributed to the almost periodic switching of the test chamber’s thermal unit in order to maintain the preadjusted temperature. 20 Receivers switched off 800 0 600 400 -10 200 -20 0 -200 -30 Frequency Offset [Hz] 1000 10 Temperature [°C] 1200 -400 -40 10:00:00 AM 11:00:00 AM Temperature 12:00:00 PM Time [UTC] Test Receiver 1:00:00 PM -600 2:00:00 PM Ref. Receiver Fig. 3.5 Oscillator offset for the test and reference receiver recorded during the initial thermal test for negative temperatures. Document No. TN 04-07 DLR/GSOC Issue 1.0 Oct. 05, 2004 No part of this document shall be reproduced in any form or disclosed to third parties without prior authorization. Document Title: Thermal-Vacuum Testing of the Phoenix GPS Receiver 13 Further evidence for a direct correlation between temperature changes and frequency offset is provided by the analysis of the oscillator data collected during the subsequently conducted thermal cycling test. Fig. 3.6 illustrates the frequency pattern obtained during these test, which exhibits a clearly systematic characteristic and repeats itself with the same period as the temperature cycles. Particularly strong disturbances were encountered during the heating and cooling phases with relatively large temperature changes. 1400 140 Frequency Offset 120 1000 100 800 80 600 60 400 40 200 20 0 0 -200 -20 -400 -40 -600 -60 -800 11:30 Temperature (°C) Doppler Offset (Hz) 1200 Temperature -80 13:30 15:30 UTC time 17:30 19:30 Fig. 3.6 Frequency pattern observed during the thermal cycling test. The assumption of a direct relation between temperature gradients and frequency drift could be further verified by computing the derivatives of the frequency changes and plotting the results together with the temperature readings in a common diagram. The graph in Fig 3.7 shows the first order frequency derivatives for the second thermal-vacuum test. Due to the smaller temperature gradients obtained during these test, compared to the tests conducted in the thermal chamber, the frequency variations were not as pronounced as for the purely thermal tests. Nevertheless, one can clearly discern that sudden changes in the temperature gradient, encountered at the beginning and the end of the phases with stable temperatures, result in pronounced changes in the frequency drift. This behavior has been observed throughout all conducted tests an can be attributed to the reaction of the receiver’s TCXO to temperature variations. Document No. TN 04-07 DLR/GSOC Issue 1.0 Oct. 05, 2004 No part of this document shall be reproduced in any form or disclosed to third parties without prior authorization. 14 100 120 50 90 0 60 -50 30 -100 0 -150 -30 -200 Test Receiver Temperature [°C] Oscillator Drift [Hz/min] Document Title: Thermal-Vacuum Testing of the Phoenix GPS Receiver -60 Temperature -250 9:00 11:00 13:00 15:00 17:00 19:00 21:00 -90 23:00 Tim e [UTC] Fig.3.7 Derivatives of the frequency offset for the second TVAC test. Document No. TN 04-07 DLR/GSOC Issue 1.0 Oct. 05, 2004 No part of this document shall be reproduced in any form or disclosed to third parties without prior authorization. Document Title: Thermal-Vacuum Testing of the Phoenix GPS Receiver 15 4. Tracking Performance and Navigation Accuracy 4.1 Tracking performance 12 160 10 120 8 80 6 40 4 0 2 -40 0 11:45 Temperature [°C] Number of Tracked Satelites A degradation of the tracking performance could only be encountered during the tests in the thermal chamber. As seen in Fig. 4.1, the tracking capability was seriously affected through phases characterized by significant temperature variations. The observed effects ranged form a loss of track on individual channels up to a complete loss of signal across all channels and was encountered throughout all test cycles. During phases with constant temperature as well as phases with moderate and almost linear temperature de-/increase both receivers track almost the same number of satellites, which indicates a nominal tracking performance. -80 12:00 12:15 12:30 12:45 13:00 13:15 13:30 13:45 14:00 14:15 Time [UTC] Reference Receiver Test Receiver Temperature Fig. 4.1 Number of tracked satellites observed during the thermal cycling test. Other than for the thermal tests, no such effect could be identified during the test in the vacuum chamber. Fig. 4.2. shows the number of tracked satellites for the test and the reference device for the first part of the thermal-vacuum tests. Obviously due to the significantly smaller temperature gradients obtained during these tests, the tracking performance of the test receiver was not affected in the same way as for the thermal tests. Both receivers tracked an almost identical number of satellites throughout the entire test. Most likely, the tracking problems encountered during the thermal test can be attributed to a pseudo dynamic on the received satellite signals introduced by the frequency variations in the reference oscillator. Similar effects have already been observed in previously performed radiation tests, where a frequency drift was provoked by radiation. This pseudo-dynamic is experienced by the receiver in the same way as a physical motion (velocity, acceleration, jerk) of the host vehicle that carries the GPS system. In case of unusually high or extremely irregular frequency changes, caused by large temperature variations, this can obviously no longer be handled by the receiver’s tracking loops. As a consequence, the receiver loses Document No. TN 04-07 DLR/GSOC Issue 1.0 Oct. 05, 2004 No part of this document shall be reproduced in any form or disclosed to third parties without prior authorization. Document Title: Thermal-Vacuum Testing of the Phoenix GPS Receiver 16 80 10 9 60 7 40 6 20 5 4 0 3 Temperature (°C) Number of tracked SVs 8 Reference Receiver 2 Test Receiver Temperature 1 0 13:00 14:00 15:00 -20 16:00 17:00 18:00 19:00 20:00 21:00 -40 22:00 UTC tim es Fig. 4.2 History of the number of tracked satellites recorded during the first TVAC test. lock on individual or even on all channels. In general, the problem can simply be solved by relaxing the settings of the tracking loop filters which, however, results in a slightly increased noise level on the raw measurement. Since the temperature gradients simulated during the present qualification tests are notably higher than the values typically encountered onboard a spacecraft (except for devices directly mounted on the surface of a space vehicle) this phenomena is considered as of minor importance for a use of the receiver in future space missions. 4.2 Navigation Solution Accuracy As expected from the above analysis, the navigation solutions form the test receiver obtained during the purely thermal tests exhibited a large number of pronounced errors. These outliers in both the position and velocity fixes were well correlated with the tracking instabilities discussed in the previous section and can be ascribed to the same cause: the temperature induced oscillator frequency variations. Fig. 4.3 shows the velocity errors encountered for the test receiver during the thermal cycling test. Outliers occurred most frequently near the transition from heating up the chamber to maintaining the maximum operational temperature and during the entire cooling process after the end of the maximum temperature phase. In contrast to the thermal tests, no such anomalies have been detected during the entire thermalvacuum tests. Document No. TN 04-07 DLR/GSOC Issue 1.0 Oct. 05, 2004 No part of this document shall be reproduced in any form or disclosed to third parties without prior authorization. 17 100 120 80 100 60 80 40 60 20 40 0 20 -20 Velocity [m/s] 140 0 12:00 13:00 14:00 15:00 16:00 17:00 18:00 19:00 20:00 Temperature [°C] Document Title: Thermal-Vacuum Testing of the Phoenix GPS Receiver -40 21:00 Time [UTC] Velocity Temperature [°C] Fig. 4.3 Velocity errors for the test device obtained during the thermal cycling test. 4.3 Signal-to-Noise Ratio Throughout all performed tests in the thermal as well as the vacuum chamber the Carrier-toNoise-Ratio (C/N0) exhibited no anomalies or dependency on the ambient temperature or pressure conditions. An exemplary comparison of C/N0 readings from both receivers for satellite PRN# 26 obtained during the second part of the thermal-vacuum test is provided in Fig. 4.4. 55 Carrier-to-Noise Ratio [dB] 50 45 40 35 30 Test Receiver - SV#26 25 20 13:00 Ref. Receiver - SV#26 14:00 15:00 16:00 17:00 18:00 19:00 20:00 Time [UTC] Fig. 4.3 Carrier-to-noise measurements recorded for satellite PRN# 26 during the thermal-vacuum test. Document No. TN 04-07 DLR/GSOC Issue 1.0 Oct. 05, 2004 No part of this document shall be reproduced in any form or disclosed to third parties without prior authorization. Document Title: Thermal-Vacuum Testing of the Phoenix GPS Receiver 4.4 18 Raw Data Evaluation The quality of the collected raw measurements was assessed by building double differences between data from two satellites tracked by both receivers, the test and the reference device. A detailed description of how exactly the raw data were processed during this analyses can be found in [7]. Except for various cycle slips and signal outages encountered during the thermal tests, which may be readily explained by the above described oscillator behavior, the analysis revealed no further dependency of the noise level on the environment temperature and pressure conditions. Phoenix GPS Receiver Temperature Tests Double Difference PRN8 - PRN27 DD C1 Pseudorange [m] tst_040720_15_F62.rnx tst_040720_19_F62.rnx sig(C1)=0.32m 4 2 0 -2 -4 2004/07/20 DD L1 Carrier Phase [mm] 11h 12h 13h 14h 80 60 40 20 0 -20 -40 -60 -80 2004/07/20 11h DD D1 Doppler [m/s] 21-Jul-2004 11:16 UTC sig(L1)=0.55mm 12h 13h 14h 1.2 1.0 0.8 0.6 0.4 0.2 -0.0 -0.2 -0.4 -0.6 -0.8 -1.0 -1.2 2004/07/20 Elevation [deg] 11h 15h 15h sig(D1)=0.06m/s 12h 13h 14h 15h 90 80 70 60 50 40 30 20 10 2004/07/20 0 11h PRN 8 PRN 27 12h 13h 14h 15h Fig. 4.4 Results of the raw data analyses for the satellite pair PRN# 8 and PRN# 27 recorded during the second part of the TVAC tests. Document No. TN 04-07 DLR/GSOC Issue 1.0 Oct. 05, 2004 No part of this document shall be reproduced in any form or disclosed to third parties without prior authorization. Document Title: Thermal-Vacuum Testing of the Phoenix GPS Receiver 19 The marginally increased noise level at the beginning an the end of the displayed data arc can be attributed to the low elevation of both satellites at that times resulting in lower C/N0 values an thus slightly increased noise figures. This phenomenon is well know and can not be linked to the environmental conditions. Document No. TN 04-07 DLR/GSOC Issue 1.0 Oct. 05, 2004 No part of this document shall be reproduced in any form or disclosed to third parties without prior authorization. Document Title: Thermal-Vacuum Testing of the Phoenix GPS Receiver 20 Summary and Conclusions The Phoenix GPS receiver is a GPS receiver for space applications based on COTS hardware. A series of thermal tests and thermal-vacuum tests have been conducted in close accord with established ECSS test procedures to assess the receiver performance under representative space conditions. Except for a lithium battery that was removed prior to the tests, the receiver was fully equipped with off-the-shelf components (connectors, capacitors, inductors, polyfuses, ICs). Different tests were conducted both under atmospheric pressure and under simple vacuum conditions (10-2 mbar = 1 Pa). Overall, these tests have demonstrated a proper performance within the tested temperature range of -30° to +70°, which covers both the manufacturer’s specification and the ECSS recommended limits for AOCS space electronics. The chip temperatures were generally found to exceed the ambient temperature (measured at the base plate of the thermal-vacuum chamber) by 15-20°. In a non-powered mode, the receiver survived extreme temperatures of -40° and +80° with no subsequent malfunction. A linear variation of the receiver power consumption by approximately +8%/100K was observed which may need to be considered in the dimensioning of the power system and electronic fuses. In comparison with a reference receiver operated in a zero-baseline configuration, no temperature dependence of the raw measurements quality and the navigation solution could be identified during quasi-static temperature changes (|dT/dt|~1K/min ) in the thermal-vacuum chamber. On the other hand, an increased frequency of cycle slips and outages in various tracking channels occurred during accelerated heating and cooling (|dT/dt|>3K/min) in the thermal chamber. These tracking problems may best be attributed to thermal stress of the employed 10 MHz TCXO reference oscillator. Further tests will be required to see whether the problems can be circumvented by a wider setting of the PLL carrier tracking loop. Document No. TN 04-07 DLR/GSOC Issue 1.0 Oct. 05, 2004 No part of this document shall be reproduced in any form or disclosed to third parties without prior authorization. Document Title: Thermal-Vacuum Testing of the Phoenix GPS Receiver 21 Notation and Symbols AOCS C/A C/N0 COTS DC DLR DUT ECSS EPROM ESA FLL GPS GSOC HD I/F LEO LNA N/A PLL PRN RAM S SNR SV TCXO TVAC attitude and orbit control system Coarse Acquisition Carrier-to-Noise Commercial Off-The-Shelf Direct Current German Aerospace Center Device Under Test Erasable Programmable Read Only Memory European Space Agency Frequency-Locked Loop Global Positioning System German Space Operations Center High Dynamics Interface Low Earth Orbit (below 1000 km) Low Noise Amplifier Not Available, Not Applicable Phase-Locked Loop Pseudorandom Noise Random Access Memory Space Signal-to-Noise Ratio Space Vehicle Temperature Compensated Quartz Oscillator Thermal-Vacuum Document No. TN 04-07 DLR/GSOC Issue 1.0 Oct. 05, 2004 No part of this document shall be reproduced in any form or disclosed to third parties without prior authorization. Document Title: Thermal-Vacuum Testing of the Phoenix GPS Receiver Document No. TN 04-07 DLR/GSOC 22 Issue 1.0 Oct. 05, 2004 No part of this document shall be reproduced in any form or disclosed to third parties without prior authorization. Document Title: Thermal-Vacuum Testing of the Phoenix GPS Receiver 23 References [1] Montenbruck O., Markgraf M., Leung S.; Space Adaptation of the GPS Orion Firmware; DLR-GSOC TN 0108; Deutsches Zentrum für Luft- und Raumfahrt, Oberpfaffenhofen (2001). [2] MG5000 Series User Guide; MG5-200-GUIDS-User Guide; Sigtec Navigation Pty Ltd; Issue B-T08; 14 August 2003. [3] MG5031/33 Design Kit User’s Guide; MAN-5031-5033;Version 2.0; November 2002. [4] O. Montenbruck, M. Markgraf: User’s Manual for the Phoenix GPS Receiver; DLR-GSOC GTN-MAN-0120; Deutsches Zentrum für Luft- und Raumfahrt, Oberpfaffenhofen (2004) [5] Space Engineering – Testing; ECSS Secretariat, ESA-ESTEC; ECSS-E-10-03A; 15 February 2002 [6] Space Product Assurance – Thermal cycling test for the screening of Space materials and processes; ECSS Secretariat, ESA-ESTEC; ECSS-Q-70-04A, 4 October 1999 [7] O., Holt G.; Spaceborne GPS Receiver Performance Testing; DLR-GSOC TN 02-04; Deutsches Zentrum für Luft- und Raumfahrt, Oberpfaffenhofen (2002). Document No. TN 04-07 DLR/GSOC Issue 1.0 Oct. 05, 2004 No part of this document shall be reproduced in any form or disclosed to third parties without prior authorization.