1
ESC Spatial Analysis
A l i
Species Descriptions
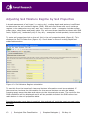
Each species name is hyperlinked so that a user can click on a species name to view
notes on the species and the related suitability charts.
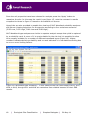
Figure 18: Species description and suitability tables for AT5 and CT
Figure 18 illustrates how we can also view the species performance in different climatic
categories. In this example we see that our site is in the upper end of the cool scale (the
cell applying to the site is outlined in a black box). In a warming climate we would
therefore expect this species to become better suited to this site. Scrolling down the
page reveals the remaining climate variables and the soil responses, shown in figure 19.
21
|
Ecological Site Classification
|
Stephen Bathgate |
20-May-11