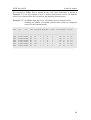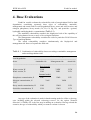
1
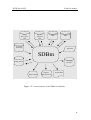
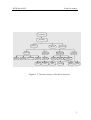
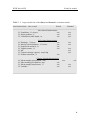
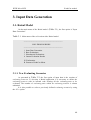
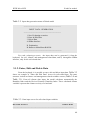
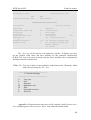
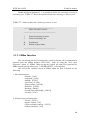
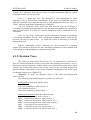
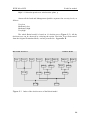
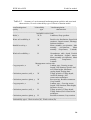
_____________________________________________
WWW MicroLEIS
Exploring the Agro-ecological Limits of Sustainability
Ero&Con
Agro-ecological Field Vulnerability
Evaluation System
User's Manual
&
Technical Description
developed by
D. de la Rosa, J. Crompvoets,
F. Mayol and J.A. Moreno
Consejo Superior de Investigaciones Científicas
Instituto de Recursos Naturales y Agrobiología
Sevilla
WWW MicroLEIS
Ero&Con module
Contents
1. The Approach Overview
2. Ero&Con Front-end
2.1. General Structure
2.2. Installation
2.3. System Requirements
3. Input Data Generation
3.1. Raizal Model
3.1.1. New Evaluating Scenarios
3.1.2. Enter, Edit and Delete Data
3.1.3. SDBm Interface
3.2. Pantanal Model
3.2.1. New Evaluating Scenarios
3.2.2. Enter, Edit and Delete Data
3.2.3. SDBm Interface
4. Base Evaluations
4.1. Raizal Model
4.1.1. Vulnerability Classes
4.1.2. Decision Trees
4.2. Pantanal Model
4.2.1. Vulnerability Classes
4.2.2. Decision Trees
5. Hypothetical Evaluations
5.1. Climate Change
5.2. Management Change
5.3. Climate/Management Change
6. Output Evaluation Results
6.1. Display Results
6.2. Delete Results
7. Bibliography
3
WWW MicroLEIS
Ero&Con module
1. The Approach Overview
Within the new MicroLEIS framework, the Ero&Con package is a
database/expert system evaluation approach for assessing limitations to the use of the
land, or vulnerability of the land to specified agricultural degradation risks. Soil
erosion, salinization and diffuse agrochemical contamination are separately considered
by several program models. These empirical knowledge-based models also combine
simple process sub-models such as to predict rainfall erosivity by the ThornthwaiteFournier formula. In this sense, Ero&Con can be considered as a set of hybrid
methods.
Special attention is given to the management/ technological aspects at farm
level. Therefore, agricultural management factors are detailed and combined with land
characteristics in order to define the field-units to be evaluated within each model.
Physical-attainable risks are calculated separately from management-related risks, and
the two are combined to produce the actual vulnerability classes (Figure 1.1).
Ero&Con models are automated applications of the developed rural resources
databases: SDBm (Soil), CDB (Climate) and MDB (Management) (Figure 1.2). The
created expert models are based on decision trees as hierachical multiway keys in which
the leaves are results such as land quality (LQ) ratings, and the interior nodes of the
tree are decision criteria such as land characteristic (LC) values. The models were
partly constructed in accordance with the criteria of the FAO-framework for Land
Evaluation.
The created models were initially formulated and calibrated by using expert
knowledge (experience) of specialists and land users, and collected literature
(knowledge). Then the models were recalibrated and validated by point-to-point
application using data (information) of 62 representative sites of the Andalucia region,
Spain, and of 42 sites of the European Union. A spatial application of the models was
made for the Province of Sevilla (1,400,000 ha), Spain.
The hypothetical predictions, considering climate and management changes,
can be useful as tools in designing adaptation strategies to climate changes and in
formulating sustainable landuse scenarios by changing agricultural management
practices.
These "what-if" scenarios are critical pieces of the puzzle in the
understanding of global change.
Figure 1.3 shows an overview with the general structure of the Ero&Con
system.
4
WWW MicroLEIS
Ero&Con module
Phase 2
Phase 1
Potentialities:
climate
site, soil
qualities
E
Attainable
land productivity
(strategic crops)
+
c
a, b E
Biophysical
factors
data base
c
Management/
productivity
indices
R
R
Sustainability
Management
factors
knowledge base
E
c
Limitations:
erosion
contamination
salinization
E
Attainable
land degradation
risks
+
Application scales:
E=European scenarios
R=Regional scenarios
Actual
field suitability
classes
R
Management/
degradation
indices
R
Actual
field vulnerability
classes
Major procedures used:
a=Qualitative classification
b=Simulation modeling
c=Expert systems
Figure 1.1. General scheme of the new MicroLEIS framework, incorporating
sustainability in land evaluation.
5
WWW MicroLEIS
Profile
Description
Data
Ero&Con module
Standard
Analytical
Data
Soluble Salts
Data
Soil Physical
Data
Language
Dictionary
Input Data
SDBm
Soil Layer
Generator
Coding System
Display Data
Graphics
Representation
Printed Data
Figure 1.2. General scheme of the SDBm soil database.
6
WWW MicroLEIS
Ero&Con module
Presentation
Main Menu
RAIZAL
Input
Field-Units
Delete Data
SDBm
Interface
Scenario
Selection
Attainable
Risks
Management
Risks
PANTANAL
Hypothetical
Evaluations
Original
Evaluations
Input Data
Input
Scenarios
ARENAL
Climatic
Change
Actual
Risks
Output
Evaluations
Management Clim. & Manag.
Change
Change
Evaluation
Display
Results
Delete
Results
Figure 1.3. The basic structure of Ero&Con front-end.
7
WWW MicroLEIS
Ero&Con module
Table 1.1 . Input variable list of the Raizal and Pantanal evaluation models.
______________________________________________________________________
Land characteristic, class or unit
Raizal
Pantanal
______________________________________________________________________
Site-related characteristics
LC Landforms, 21 classes
xxx
xxx
LC Slope gradient, %
xxx
xxx
LC Groundwater table depth, m
xxx
xxx
Soil-related characteristics
LC Drainage, 7 classes
xxx
LC Particle size distribution, 23 classes
xxx
LC Superficial stoniness, %
xxx
LC Organic matter, %
xxx
LC pH
LC Cation exchange capacity, meq/100g
LC Sodium saturation, %
xxx
Climate-related characteristics
LC Mean monthly precipitation, mm
LC Max monthly precipitation, mm
xxx
LC Mean monthly temperature, °C
xxx
LC Latitude, °
xxx
xxx
xxx
xxx
xxx
xxx
xxx
xxx
xxx
xxx
_____________________________________________________________________
8
WWW MicroLEIS
Ero&Con module
Table 1.1. (Cont.). Input variable list of the Raizal and Pantanal evaluation models
______________________________________________________________________
Management characteristic, class or unit
Raizal
Pantanal
______________________________________________________________________
Crop-related characteristics
MC Land use type, 11 classes
xxx
xxx
MC Crop rotation, 4 classes
xxx
xxx
MC Land use on slopes, 2 classes
xxx
MC Growing season length, days
xxx
MC Leaf duration, 2 classes
xxx
MC Leaf situation, 2 classes
xxx
MC Specific leaf area, m2/kg
xxx
MC Plant height, m
xxx
MC Maximum rooting depth, m
xxx
MC Structure of crop, 2 classes
xxx
Cultivation-related characteristics
MC Sowing date, 2 classes
xxx
MC Tillage practices, 5 classes
xxx
MC Tillage depth, 2 classes
xxx
MC Tillage method, 2 classes
xxx
MC Row spacing, m
xxx
MC Artificial drainage, 2 classes
xxx
MC Artificial groundwater level, 2 classes
MC Soil conservation techniques (water), 4 classes xxx
MC Soil conservation techniques (wind), 5 classes xxx
MC Residues treatment, 3 classes
xxx
Fertilizer-related characteristics
MC Use of P-fertilizer, 3 classes
MC Use of N-fertilizer, 3 classes
MC Use of animal manure, 2 classes
MC Use of industrial /urban waste, 2 classes
MC Time of fertilization, 2 classes
xxx
xxx
xxx
xxx
xxx
xxx
xxx
xxx
xxx
xxx
xxx
Pesticides-related characteristics
MC Use of pesticides, 2 classes
xxx
MC Persistence of pesticides, 3 classes
xxx
MC Toxicity (LD-50) of pesticides, 3 classes
xxx
MC Application methods, 2 classes
xxx
_____________________________________________________________________
9
WWW MicroLEIS
Ero&Con module
2. Ero&Con Front-end
2.1. General Structure
Following the scheme of the MicroLEIS system, a set of computer programmes
was developed to automate the application of Ero&Con models. However, new
facilities are included in this package.
The major characteristics of the Ero&Con front-end are:
- Interface with SDBm database (FAO-CSIC 1994, multilingual Soil Database)
- "Pop up" screens showing codes, types and classes
- Batch processing modes
- Hypothetical predictions option
- Link with GIS
These programmes are largely self explanatory. They use menus, as shown in
Table 2.1, to inform about alternatives, and prompt you to respond whenever needed.
From each menu, the "Explanation" option gives detailed information on the
corresponding step.
Many fields in Ero&Con input screens use codes. These codes are included in
the Ero&Con software in the form of indices, and can be accessed from the <F1> key
while entering/editing data.
Output results for an evaluating scenario in tabular, graphic or CSV format
presentation can be displayed or deleted by selecting the corresponding file.
Table 2.1. Main menu of the Ero&Con Agro-vulnerability Field Evaluation system.
_____________________________________________
MAIN MENU
_____________________________________________
1 RAIZAL model: Soil Erosion
2 ARENAL model: General Soil Contamination
3 PANTANAL model: Specific Soil Contamination
H Explanation
Q Quit
______________________________________________
10
WWW MicroLEIS
Ero&Con module
2.2. Installation
Ero&Con is simple to install and to run. Installation is by the following steps,
during which a few questions are asked:
- insert the diskette #1 in drive A: (or B: or ...)
- change to drive A: (or B: or ...)
- type "MLEROINS" to install the software on a hard disk
- follow the instructions on the screen
Ero&Con will be installed in directory \MLERO
Finally, to run Ero&Con from the directory \MLERO, type MLERO and press
<Enter>. A few examples of evaluating-scenarios are included.
2.3. System Requirements
To use Ero&Con you will require a personal computer (PC), MS-DOS version
3.0 or higher, with about 1 Mbytes of free space. It will work with 1 Mbytes of RAM
but is likely to be slow if handling large quantities of data.
11
WWW MicroLEIS
Ero&Con module
3. Input Data Generation
3.1. Raizal Model
On the main menu of the Raizal model (Table 3.1), the first option is "Input
Data Generation".
Table 3.1. Main menu of the soil erosion risks: Raizal model
___________________________________________
SOIL EROSION RISKS
___________________________________________
1
2
3
4
Input Data Generation
Base Evaluations
Hypothetical Evaluations
Output Evaluation Results
H Explanation
R Return to Ero&Con Menu
____________________________________________
3.1.1. New Evaluating Scenarios
As presented in Table 3.2, the first option of input data is the creation of
evaluating-scenarios. To develop a Raizal application it is necessary to define the
evaluating-scenario with its internal code locating all the evaluating-units to be
evaluated. The number of evaluating-units within an evaluating-scenario is almost
unlimited.
It is also possible to select a previously defined evaluating-scenario by using
the <F1> option.
12
WWW MicroLEIS
Ero&Con module
Table 3.2. Input data generation menu of Raizal model
_________________________________________
INPUT DATA GENERATION
_________________________________________
1
2
3
4
New Evaluating-scenarios
Enter & Edit Data
Delete Data
SDBm Interface
H Explanation
R Return to Main Menu RAIZAL
__________________________________________
For each evaluating-scenario, the input data can be generated i) from the
keyboard, for soil-, climate- and management-related data; and ii) through the SDBm
interface, only for the soil-related data.
3.1.2. Enter, Edit and Delete Data
From the keyboard, it is possible to enter, edit and delete input data. Table 3.3
shows an example of "Enter and Edit Data" screen for soil-related data. The same
structure is uded in climate- and management-related variables screens (Table 3.4 and
Table 3.5). From all climate data input, the model calculates automatically the
Humidity Index and the Derived Fournier/ Humidity Index. These calculated climate
variables represent the climate erosivity of a land unit.
Table 3.3. Data input screen for soil-related input variables
_______________________________________________________________________________
MicroLEIS: Ero&Con
RAIZAL Model
____________________________________________________________________________________________________
13
WWW MicroLEIS
Ero&Con module
ENTER AND EDIT DATA
________________________________________________________________________________________
Evaluating-scenario:
Evaluating-unit: F-AL01
Code
Benchmark Soil: AL01
AND
Representative area, km2: 2000.00
Name
Longitude
Latitude
Altitude, m
Greda-roja
W00218
N3717
1260
SOIL-RELATED CHARACTERISTICS
Landforms
MO
Slope Gradient, %
Particle Size Distribution
30
Groundwater Table Depth, m
20.0
Superficial Stoniness,%
SL
Organic Matter,%
1.3
Sodium Saturation,%
5.0
25
Drainage
W
________________________________________________________________________________________
Table 3.4. Data input screen for climate-related input variables
_______________________________________________________________________________
MicroLEIS: Ero&Con
RAIZAL Model
_______________________________________________________________________________
Evaluating-Unit:
F-AL01
Evaluating-Scenario:
AND
Code
Name
Climate Station: AAL01 Almanzora-Alto
Longitude
Latitude
Altitude
W00245
N3725
1200
CLIMATE-RELATED CHARACTERISTICS
JAN
FEB
MAR
APR
MAY
JUN
JUL
AUG
SEP
OCT
NOV
DEC
Pmax
58.0
62.0
170.0
180.0
122.0
85.0
59.0
82.0
72.0
131.0
158.0
191.0
Pmean
25.0
23.0
40.0
48.0
42.0
28.0
7.0
6.0
15.0
42.0
46.0
56.0
Tmean
4.6
5.6
7.7
10.2
15.0
18.0
23.3
23.0
________________________________________________________________________________________
Pmax:
Maximum Precipitation, mm
Pmean: Mean Precipitation, mm
Tmean: Mean Temperature, °C
Table 3.5. Data input screen for management-related input variables
_____________________________________________________________________
MicroLEIS: Ero&Con
RAIZAL Model
________________________________________________________________________________
14
WWW MicroLEIS
Ero&Con module
Evaluating-unit: F-AL01
Field Utilization Type:
Evaluating-Scenario: AND
Code
Name
FUT01
Wheat/Intensive
MANAGEMENT-RELATED CHARACTERISTICS
Crop Properties
Cultivation Practices
Land Use Type
1
Sowing Date
Growing Season Length, days
180
Tillage Practices
Leaf Duration
2
Tillage Depth
Leaf Situation
2
Tillage Method
2
Specific Leaf Area, m2/kg
1
Row spacing, m
0.40
Plant Height, m
0.50
1
1
1
Artificial Drainage
2
Maximum Rooting Depth, m
1.00
Soil Conservation Techniq.,Water
Structure of Crop
2
Soil Conservation Techniq.,Wind
1
2
Residues Treatment
3
Crop Rotation
4
_______________________________________________________________________________________
The <F1> key can be used for each qualitative variable. It displays on-screen
all the possible valid codes and their meaning for this particular characteristic
(Table 3.6). Any code can be selected using the cursor and that code is automatically
introduced into the variable field.
Table 3.6. "Pop up" window for the qualitative land characteristic "Drainage" which
opens when pressing the <F1> key
________________________________
LC Surface Drainage
________________________________
V
Very poor
P
Poor
I
Imperfect
M
Moderately well
W
Well
S
Somewhat excessive
E
Excessive
________________________________
Appendix A lists the names and classes of all variables (Land Characteristics,
LCs; and Management Characteristics, MCs) used within the Raizal model.
15
WWW MicroLEIS
Ero&Con module
Within the Raizal framework, it is possible to delete an evaluating-scenario or
evaluating-unit. Table 3.7 shows the option to delete an evaluating-scenario or unit.
Table 3.7. Menu to delete the evaluating scenario or unit.
____________________________
DELETE INPUT DATA
______________________________
1
2
Delete Evaluating Scenario
Delete Evaluating Unit
H
R
Explanation
Return to Input Menu
______________________________
3.1.3. SDBm Interface
The soil-related data used as diagnostic criteria in Raizal can be automatically
captured from the SDBm database (FAO-CSIC, 1994) by using the "Soil Layer
Generator" option of SDBm. When useing this option, the input files generated by
SDBm must be placed in directory C:\MLERO\INPUT to be imported.
The soil profile variables stored in SDBm which are used in Raizal are the
following:
1. Site characteristics:
- Latitude, [LAT]
- Longitude, [LON]
- Altitude, [ELEV]
- Land form, [LAFO]
- Slope gradient, [SLGR]
- Stoniness, [STON]
- Drainage, [DRAI]
- Ground water table depth, [GWAT]
- Location, [LOC]
2. Horizon (layer) characteristics:
- Texture, [TEX1]
- Organic carbon, [OC]
- Cation exchange capacity, [CECS]
- Sodium saturation, [NA]
16
WWW MicroLEIS
Ero&Con module
The structure of SDBm files as created by the "Soil Layer Generator" is shown
in Example 3.1. For this example a layer or control section of 0 to 50 cm from the
surface was considered for the soil horizon and analytical characteristics.
Example 3.1. An SDBm input file, for six soil profiles and one control section,
including the SDBm soil-related characteristics which are
diagnostic
criteria for the Raizal module.
_____________________________________________________________________
Reg PRNO
LAT
LON
ELEV LAFO SLGR STON DRAI GWAT LOC
TEX1 OC
CECS NA
________________________________________________________________________________________
1
SE0052 N374715 W054015 320
HI
6
C
W
0
Constantina
SIC
1.25 23.6 0.0
2
SE0058 N374300 W060600 490
VA
3
F
W
5
Almaden
SIC
1.21
3
SE0059 N374520 W060020 400
VA
4
F
M
5
Castilblanco SCL
0.84 21.1 0.0
4
SE0060 N374341 W055629 350
VA
3
V
M
5
Castilblanco LS
0.82 10.6 0.1
5
SE0061 N374044 W060218 200
MO
7
C
S
0
Castilblanco SL
2.52 20.0 2.0
6
SE0064 N375204 W060524 490
VA
4
F
W
5
Almaden
1.69 12.6 0.3
SL
8.5 0.0
_______________________________________________________________________________________
3.2. Pantanal Model
On the main menu of the Pantanal model (Table 3.8), the first option is "Input
Data Generation".
17
WWW MicroLEIS
Ero&Con module
Table 3.8. Main menu of the Pantanal model.
_________________________________________________
AGROCHEMICAL CONTAMINATION RISKS
_________________________________________________
1
2
3
4
Input Data Generation
Base Evaluations
Hypothetical Evaluations
Output Evaluation Results
H
Explanation
R
Return to Ero&Con Menu
_________________________________________________
3.2.1. New Evaluating Scenarios
As presented in Table 3.9., the first option of input data is the creation of new
evaluating scenarios. To develop a Pantanal application it is necessary to create an
evaluating-scenario with its code within located all the evaluating-units to be evaluated.
The number of evaluating-units within an evaluating-scenario is almost unlimited.
It is also possible to select a previously defined evaluating-scenario by using the
<F1> option.
Table 3.9. Input data generation menu of Pantanal model
_______________________________________
INPUT DATA GENERATION
_______________________________________
18
WWW MicroLEIS
Ero&Con module
1
2
3
4
New Evaluating Scenarios
Enter & Edit Data
Delete Data
SDBm Interface
H Explanation
R Return to main menu
_______________________________________
For each evaluating-unit, the input data can be generated i) from the keyboard; for soil-,
climate- and management-related data; and ii) through the SDBm interface, only for the
soil-related data.
3.2.2. Enter, Edit and Delete Data
From the keyboard, it is possible to enter, edit and delete input data. Table
3.10 shows an example of "Enter and Edit Data" screen for soil-related data. The same
structure is used in climate- and managment-related variables screens (Table 3.11 and
Table 3.12). Only those variables which are necessary to evaluate the chosen specific
compound vulnerability are highlighted on the screens. From all climate data input, the
model calculates automatically the Humidity Index, Annual Temperature and Annual
Rainfall. These calculated climate variables represent the climate influence on the
contamination vulnerability of a land unit.
Table 3.10. Data input screen for soil-related input variables
MicroLEIS: Ero&Con
PANTANAL Model
______________________________________________________________________
ENTER AND EDIT DATA
______________________________________________________________________
19
WWW MicroLEIS
Ero&Con module
Evaluating-scenario: AND
Evaluating-unit: F-AL01
Benchmark Soil:
Representative area, km2: 2000.00
Code Name
AL01 Greda-roja
Long
W 00218
Latit
N3717
Altit
1260
SOIL-RELATED CHARACTERISTICS
Landform
Slope Gradient, %
Groundwater Table Depth, m
MO
30
W
Drainage
Particle Size Distribution
Organic Matter, %
pH
C.E.C., meq/100 gr.
W
SCL
1.7
7.1
18.1
Table 3.11. Data input screen for climate-related input variables
MicroLEIS: Ero&Con
PATANAL Model
______________________________________________________________________
ENTER AND EDIT DATA
______________________________________________________________________
Evaluating -unit: F-AL01
Evaluating Scenario: AND
Code Name
Climate Station AAL01 Almanzora-Alto (Baca
Long
W00245
Latit
N3725
Altit
1200
CLIMATE-RELATED CHARACTERISTICS
Pmen
Tmen
JAN
25.0
4.6
FEB MAR APR MAY JUN
23.0
40.0
48.0
42.0
5.6
7.7
10.2
15.0
JUL AUG SEP OCT NOV DEC
28.0
7.0
6.0 15.0 42.0 46.0
18.0
23.3 23.0 18.4 13.6 7.7
56.0
4.8
______________________________________________________________________
Pmen = Mean Precipitation, mm
Tmen = Mean Temperature, °C
Table 3.12. Data input screen for management-related input variables
_____________________________________________________________________
MicroLEIS: Ero&Con
PANTANAL model
______________________________________________________________________
ENTER AND EDIT DATA
20
WWW MicroLEIS
Ero&Con module
______________________________________________________________________
Evaluating-unit: F-AL01
Field Utilization Type:
Land Use Type
Crop Rotation
Land Use on Slopes
P-Fertilizer
N-Fertilizer
Animal Manure
Industrial/Urban Waste
Time of Fertilization
Evaluating-scenario: AND
Code Name
FUT01 Wheat/ Intensive
MANAGEMENT-RELATED CHARACTERISTICS
11
Use of Pesticides
4
Persistence of Pesticides
1
Toxity (LD-50) of Pesticides
Application methods of Pesticides
2
1
2
2
1
Artificial Drainage
Artificial Groundwater Level
Residues Treatment
Soil Conservation Techniques
Tillage Practices
1
2
400
2
2
2
3
4
4
______________________________________________________________________
The <F1> key can be used for each qualitative variable. It displays on-screen all
the possible valid codes and their meaning for this particular characteristic (Table
3.13). Any code can be selected using the bar and that code is automatically introduced
into the variable field.
Table 3.13. "Pop up" window corresponding to the qualitative land characteristic
"Drainage" which opens when pressing the <F1> key.
___________________________
LC
DRAINAGE
___________________________
V
Very poor
P
Poor
I
Imperfect
M
Moderately well
W
Well
S
Somewhat excessive
E
Excessive
___________________________
Appendix A lists the names and classes of all variables (Land Characteristics, LCs;
and Management Characteristics, MCs) used within the Pantanal model.
Within the Pantanal framework, it is possible to delete an evaluating scenario or
evaluating unit. Table 3.14 shows the option to delete an evaluating scenario or unit.
21
WWW MicroLEIS
Ero&Con module
Table 3.14. Menu to delete the evaluating scenario or unit.
_________________________________
INPUT DATA DELETE
_________________________________
1
2
3
4
5
Evaluating Scenario
Evaluating Unit
Benchmark Soil
Climate Station
Field Utilization Type
R
Return to Input Menu
_________________________________
3.2.3. SDBm Interface
The soil-related data used as diagnostic criteria in Pantanal can be automatically
captured from the SDBm database (FAO-CSIC, 1994) by using the "Soil Layer
Generator" option of SDBm. When using this option the input files generated by SDBm
must be placed in directory C:\MLERO\INPUT to be imported.
The soil profile variables stored in SDBm which are used in Pantanal are the
following:
1. Site Characteristics:
- Latitude, [LAT]
- Longitude, [LON]
- Altitude [ELEV]
- Landform [LAFO]
- Slope Gradient [SLGR]
- Stoniness [STON]
- Drainage [DRAI]
- Depth of Groundwater Table [GWAT]
- Location [LOC]
2. Horizon (layer) and Analytical characteristics:
- Texture [TEX1]
- pH water [PHW]
- Organic carbon [OC]
- Cation Exchange Capacity [CECS]
- Sodium saturation [NA]
22
WWW MicroLEIS
Ero&Con module
The structure of SDBm files as created by the "Soil Layer Generator" is shown in
Example 3.2. For this example a layer or control section from 0 to 50 cm from the
surface was considered for the soil horizon and analytical characteristics.
Example 3.2. An SDBm input file for six soil profiles and one control section,
including the SDBm soil-related characteristics which are diagnostic
criteria for the Pantanal model.
_____________________________________________________________________________________________________
PRNO
LAT
LON
ELEV LAFO SLGR STON DRAI
GWAT
LOC TEX1 PHW
OC CECS
_____________________________________________________________________________________________________
SE052
N374715 W054015
320
HI
6
F
W
0
SIC
5.8
1.3
SE058
N374300 W060600
490
VA
3
F
W
5
SIC
5.5
1.2
23.6
8.5
SE059
N374520 W060020
400
VA
4
V
M
5
SCL 5.9
0.8
21.1
SE060
N374341 W055629
350
VA
3
F
M
5
LS
6.0
0.8
0.6
SE061
N374044 W060218
200
MO
7
C
S
0
SL
6.1
2.5
20.0
SE064
N375204 W060524
490
VA
4
V
W
5
SL
6.0
1.7
2.6
_____________________________________________________________________________________________________
23
WWW MicroLEIS
Ero&Con module
4. Base Evaluations
Ero&Con models evaluate the vulnerability risks of an agricultural field to land
degradation, considering separately three types of vulnerability: attainable,
management and actual; and for each degradation factor: water and wind erosion; and
nitrogen, phosphorus, heavy metals (Cu, Zn, Cd, Hg, Pb) and pesticides (general,
hydrophile and hydryphobe) contamination (Table 4.1).
The attainable vulnerability considers the biophysical risk of the capability of
the soil being harmed in one or more of its ecological functions.
The management vulnerability considers the risk of a particular Field Utilization
Type to land degradation.
The actual vulnerability considers simultaneously the biophysical and
management risk factors of a particular field unit.
Table 4.1. Combination of vulnerability classes according to attainable, management
and actual degradation risks
Land degradation
Vulnerability type
______________________________________________
factor
Attainable risk
Management risk
Actual risk
______________________________________________________________________
Raizal model
Water erosion, W
VAW
VMW
VCW
Wind erosion, D
VAD
VMD
VCD
VMP
VCP
Pantanal model
Phosphorus contamination, P
VAP
Nitrogen contamination, N
VCN
VAN
VMN
Heavy metals contamination, H
VAH
VMH
VCH
Pesticides contamination, X
VAX
VMX
VCX
Any type of the evaluation is made in batch-running mode for all the evaluatingunits included within the selected evaluating-scenario. So, the option "Scenario
Selection" of Table 4.2 is the first step in making an evaluation. Having selected the
scenario, the type of vulnerability which you want to evaluate is chosen.
24
WWW MicroLEIS
Ero&Con module
Table 4.2. Menu to compute original evaluations of RAIZALmodel.
_________________________________
ORIGINAL EVALUATIONS
_______________________________________
1
2
3
4
Scenario Selection
Attainable Vulnerability
Management Vulnerability
Actual Vulnerability
T Decision Trees Observation
R Return to Main Erosion Menu
______________________________________
4.1. Raizal Model
4.1.1. Vulnerability Classes
The soil erosion vulnerability classes (10) established by Raizal for the
Attainable and Actual Vulnerability risks (VAW, VAD and VCW, VCD) are defined as
follows:
Class V1 None. These field units are not vulnerable to water or wind erosion the risks to these processes could be considered as nil and the land unit will be
uneroded.
For these fields, management erosivity is not considered to be a controlling
factor and almost any farming system can be implemented.
Class V2 Very Low. These field units present a very low vulnerability to wind
or soil erosion. Soil erosion will occur rarely and only during extreme climate
conditions.
For these fields the influence of the management systems on the soil degradation
is low.
25
WWW MicroLEIS
Ero&Con module
Class V3 Low. These field units present a low vulnerability to water or wind
erosion. Soil erosion will occur rarely. The soil could have a few rills or places with
thin A horizons that give evidence of accelarated erosion, but not to such an extent as
to alter greatly the thickness and character of the A horizon.
The wind will remove only a very small amount of the soil.
For these fields the effect of management change on the vulnerability classes
could be important. There are no differences in use capabilities and management
requirements from the uneroded soils.
Class V4 Moderately Low. These field units present a moderately low
vulnerability to wind or wind erosion. Only a few properties of water erosion
(especially inter-rill erosion) will be visible in the field. The soil of the areas in this
class can be eroded to the extent that ordinary implements reach through the remaining
A horizon.
The wind will remove a small amount of the soil.
For these fields the effect of management change on the vulnerability classes
could be important. There are small differences in use capabilities and management
requirements from the uneroded soils.
Class V5 Slightly Low. These field units present a slightly low vulnerability to
water or wind erosion. The soil will erode to the extent that ordinary tillage implements
reach through the remaining A horizon, or well below the depth of the original plowed
layer in soils with thin A horizons. Generally, the plow layer will consist of a mixture of
the original A horizons and underlying horizons. Mapped land units will have patches in
which the plow layer consists wholly of the original A horizon and others in which it
consists wholly of underlying horizons. A few shallow gullies will be present in the
field. The wind will remove from the soil a sufficient amount of the A horizon that
ordinary tillage brings up.
For these fields the effect of management change on the vulnerability classes
could be considerable.
Class V6 Slightly High. The field units present a slightly high vulnerability to
water or wind erosion. The soil will erode to the extent that a big part of the original
surface soil, or A horizon, will be removed. Water erosion processes will be active
during each year. Numerous shallow gullies will be present in the field.
The wind will remove from the soil a large amount of the A horizon that
ordinary tillage brings up and will partly mix the B horizon or other underlying horizons
with surface soil in the plow layer. Rarely will this be condition uniform throughout a
mappable land unit.
For these fields the effect of management change on the vulnerability classes
could be considerable.
Class V7 Moderately High. These field units present a moderately high
vulnerability to water or wind erosion. The soil will erode to the extent that practically
all of the original surface soil, or A horizon, will be removed. The plow layer will
consist essentially of materials from the B or other underlying horizons. Patches in
which the plow layer is a mixture of the original A horizon and the B horizon or other
underlying horizons will be included within the mapped field units. Shallow gullies, or
a few deep ones, will be common on some soil types.
26
WWW MicroLEIS
Ero&Con module
The wind will remove all of the A horizon and a small amount of the B or other
underlying horizon. The plow layer will consist of original horizons below the A
horizon.
For these fields the more management-erosive farming systems have adverse
effects on the environment.
Class V8 High. These field units present a high vulnerability to water or wind
erosion. The soil will erode to the extent that all of the original surface soil, or A
horizon, will be removed. The plow layer will consist essentially of materials from the
B or other underlying horizons. Patches in which the plow layer is a mixture of the
original A horizon and the B horizon or other underlying horizons will be included
within the mapped field units. Shallow and moderately deep gullies will be present in
the field unit. Where land is afforested or drained there will be often a "slug" of erosion
before channels are stabilized by vegetation, but the rates of erosion will continue to be
greater than those prevailing before.
The wind will remove all of the A horizon and a part of the B or other
underlying horizon. The plow layer will consist mainly of the original horizons below
the A (or below the original plowed layer in the soils with thin A horizons), although
some patches will have much of the original A horizon remains in the field unit.
Sometimes an occasional blow-out area of the field unit will be included.
For these fields the more management-erosive farming systems have
adverse effects on the environment.
Class V9 Very High. These field units present a very high vulnerability to
water or wind erosion. The field will erode until it has partly an intricate pattern of
moderately deep gullies. Soil profiles will be destroyed except in small areas between
gullies. Such fields will not be useful for crops in this condition. Reclamation for crop
production or for improved pasture is difficult but will be practical if other
characterisics of the soil are favorable and erosion is controlled.
The wind will remove a big part of the soil profile. The plow layer consists of
the original horizons below the A-horizon. An occasional blow-out part of the field unit
will be included.
Class V10 Extreme. These field units present an extremely high vulnerability
to water or wind erosion. The field will erode until it has an intricate pattern of
moderately deep or deep gullies. Soil profiles will be destroyed except in small areas
between gullies. Such fields will not be useful for crops in this condition. Reclamation
for crop production or for improved pasture is very difficult but will be practical if the
other characteristics of the soil are favorable and erosion is controlled by soil
conservation techniques, for example by construction of terraces.
The assessment of the soil erosion management vulnerability (VMW and VMD)
is classified into four classes:
Class V1 Very Low. The human influence on these field units is very small
regarding the vulnerability to water or wind erosion. In general, this class represents
good soil conservation methods and the actual vulnerability of a field unit will be
dependent only on the attainable risk. This class represents the best field management
27
WWW MicroLEIS
Ero&Con module
methods for a particular field unit to become a possible sustainable land use system
(economical issues are not involved).
Class V2 Moderately Low. The influence of field management is small
regarding water or wind erosion vulnerability. In the sense of sustainable land use,
when the attainable risk is high then the risk of field management has to be Class 1 or
Class 2 (land use with higher vulnerability is excluded).
Class V3 Moderately High. Field units with this risk class are in danger of
becoming less suitable in the agricultural sense and their field methods are vulnerable to
water or wind erosion. The field use with this management risk is considered not to be
sustainable.
Class V4 Very High. Field units with this management class are in real danger
of becoming unsuitable, because their management methods greatly accelerate the
processes of water or wind erosion. To sustain the field it is necessary to avoid this
management class.
Besides vulnerability classes, subclasses are also presented as evaluation
outputs. The subclasses show the user the vulnerability limitations of the evaluated field
unit and help in understanding the evaluated classification.
4.1.2. Decision Trees
The classes of each Land Characteristic (LC) or Management Characteristic
(MC) are connected with the severity levels of the corresponding Land Quality (LQ) or
Management Quality (MQ) by complex decision trees, based on the approach of expert
systems. The connections between the severity levels of the Land and Management
Qualities and the vulnerability classes of the Attainable, Management and Actual types
are through decision trees (Table 4.3).
Appendix A shows the different classes of the Land and Management
Characteristics.
The following Land and Management Qualities are involved:
Land Qualities (with their subclass code)
LQ1 Relief, t
LQ2 Soil erodibility to water erosion, k
LQ3 Rainfall erosivity, r
LQ4 Soil erodibility to wind erosion, e
Management Qualities (with their subclass code)
MQ1 Crop properties to water erosion, o
MQ2 Cultivation practices to water erosion, z
MQ2.1 Cultivation practices to water erosion: soil, x
MQ2.2 Cultivation practices to water erosion: plant, y
MQ3 Crop properties to wind erosion, c
MQ4 Cultivation practices to wind erosion, u
MQ4.1 Cultivation practices to wind erosion: soil, s
28
WWW MicroLEIS
Ero&Con module
MQ4.2 Cultivation practices to wind erosion: plant, p
Almost all the Land and Management Qualities separate four severity levels, as
follows:
Very low
Moderately low
Moderately high
Very high
The whole Raizal model is based on 19 decision trees (Figure 4.1). All the
decision trees can be observed by selecting the option "Decision Trees Observation"
from the Original Evaluation Menu, and are presented in Appendix B.
_________________________________________________________________________________
MicroLEIS: Ero&Con
RAIZAL Model
___________________________________________________________
LQ1
LQ2
LQ3
LQ4
MQ2.1
MQ1
VAW
VAD
VCW
MQ2.2
MQ4.1
MQ3
MQ2
VMW
MQ4.2
MQ4
VMD
VCD
Figure 4.1. Index of the decision trees of the Raizal model
29
WWW MicroLEIS
Ero&Con module
Table 4.3 . Summary of environmental land/management qualities and associated
characteristics, for each vulnerability type of Raizal evaluation model.
_____________________________________________________________________
Land/management
Vulnerability
Land/management
quality
type
characteristic
______________________________________________________________________
Attainable erosion risks
Relief, t
W, D
Landform; Slope gradient.
Water soil erodibility, k
W
Rainfall erosivity, r
W
Wind soil erodibility, e
D
Particle size distribution; Superficial
stoniness; Organic matter; Drainage;
Sodium saturation.
Mean monthly precipitation; Max
monthly
precipitation;
Mean
monthly temperature; Latitude.
Groundwater table depth; Particle
size distribution; Organic matter;
Mean monthly precipitation; Mean
monthly
temperature;
Latitude.
.Management erosion risks
Crop properties, o
W
Landuse type; Growing season
length; Leaf duration; Specific leaf
area; Plant height; Maximum
rooting depth; Sowing date.
Cultivation practices (soil), x
W
Tillage practices; Tillage depth;
Artificial drainage; Soil
conservation techniques.
Cultivation practices (plant), y W
Row spacing; Residues treatment.
Crop rotation.
Crop properties, c
D
Landuse type; Growing season
length; Leaf situation; Plant height;
Structure of crop.
Cultivation practices (soil), s
D
Tillage practices; Tillage depth;
Tillage method; Soil conservation
techniques.
Cultivation practices (plant), p D
Residues treatment; Crop rotation.
______________________________________________________________________
Vulnerability types: Water erosion (W), Wind erosion (D)
30
WWW MicroLEIS
Ero&Con module
4.2. Pantanal Model
4.2.1. Vulnerability Classes
The agrochemical contamination vulnerability classes (4) established by
Pantanal for the attainable and management vulnerability are defined as follows:
Class V1 None. Almost invulnerable to agrochemical contamination by
agricultural activities, and the biophysical risks to soil, surface and groundwater diffuse
pollution are very low. The corresponding fields have a very big storage capacity for
agrochemical compounds and/or the amount of leaching and run-off of the contaminants
is very low. The management system of this class does not lower the quality of the soil,
surface and groundwater of the field unit.
Class V2 Low. A reasonably low vulnerability to agrochemical compounds
which diffusely contaminate the soil, surface and groundwater. The agropollutant
storage capacity of the corresponding fields is high, and/or the amount of leaching and
run-off are low. The management system of this class could harm the quality of the soil,
surface and groundwater of the field unit on a small scale.
Class V3
Moderate. A reasonably high vulnerability to agrochemical
compounds which diffusely contaminate the soil, surface and groundwater. The
agropollutant storage capacity of the corresponding fields is low and/or the amount of
leaching and run-off ranges from moderate to high. The management system of this
damages the quality of the soil, surface and groundwater of the field unit on a high
scale.
Class V4 High. Very vulnerable to agrochemical contamination by agricultural
activities, and the risks to soil, surface and groundwater diffuse pollution are very
severe. The fields have a very small storage for agrochemical compounds, and therefore
leaching could be very high. Also fields which are strongly vulnerable to run-off could
damage the quality of surface water. The field management system of this class harms
the soil, surface and groundwater quality of the field unit on an extremely high scale.
The assessment of the actual vulnerability is classified into five actual
vulnerability classes:
Class V1 None. Field units of this actual class are almost invulnerable to
agrochemical contamination because of their biophysical condition and management
system. The actual vulnerability to soil, surface and groundwater diffuse pollution are
very low. This management system is not considered to be a controlling factor and
almost any other farming system could be implemented.
Class V2 Low. Field units of this actual class are slightly vulnerable to
agrochemical contamination because the combination of the management system with
31
WWW MicroLEIS
Ero&Con module
the biophysical conditions of the classified field unit does almost no harm to the soil,
surface and groundwater quality.
Class V3 Moderate. Fields units of this actual class are moderately vulnerable
to agrochemical contamination; the combination of the management system and
biophysical characteristics of the field unit harms the quality of soil, surface and
groundwater. The effect on the intensity of the management system to actual
vulnerability class can change considerably.
Class V4 High. Field units of this actual class are highly vulnerable to
agrochemical contamination, because the simultaneous impact of the management
system and the biophysical characteristics damages the quality of the soil, surface and
groundwater of the field unit on a high scale. More-intensive farming systems have
adverse effects on the environment.
Class V5 Extreme. Field units of this actual class are extremely vulnerable to
agrochemical contamination, because the intensity of the agricultural activities on the
field unit and the high biophysical vulnerability of the field unit itself harm the soil,
surface and groundwater quality on an extremely high scale. The water management
and the quantity and toxicity of the pollutants have to be carefully applied to the field
unit.
Besides classes, subclasses are also presented as evaluation outputs. The
subclasses show the user the vulnerability limitations of the evaluated field unit and
help in understanding the evaluated classification.
4.2.2. Decision Trees
The classes of each Land Characteristic (LC) and Management Characterististics
(MC) are connected with the severity levels of the corresponding Land Quality (LQ)
and Management Quality (MQ) by complex decision trees. The connections between
the severity levels of the Land and Management Qualities and the vulnerability classes
of the Attainable and Management vulnerability types are through decision trees
(Table 4.4).
Appendix A shows the division of the Land and Management Characteristics.
The following Land and Management Qualities are involved:
Land Qualities (with their subclass)
LQ1 Surface Run-off, r
LQ1.1 Surface Run-off, Relief
LQ1.2 Surface Run-off, Soil erodibility
LQ1.3 Surface Run-off, Rainfall erosivity
LQ2 Leaching Degree, l
LQ3 Pesticides Sorption, o
LQ4 Biodegradation, g
LQ5 Denitrification, d
32
WWW MicroLEIS
LQ6
LQ7
Ero&Con module
Cation Adsorption Capacity, c
Phosphate Fixation, f
Management Qualities (with their subclass)
MQ1 Phosphorus/ Arsenic Management, i
MQ2 Nitrogen Management, j
MQ3 Heavy Metals Management, q
MQ4 Pesticides Management, t
MQ5 Soil Erosion Management, r
Almost all the Land and Management Qualities separate four severity levels, as
follows:
None
Low
Moderate
High
The Pantanal model is based on ?? decision trees (Figure 4.2). All the decision
trees can be observed by selecting the option "Decision Trees Observation" from the
Base Evaluation Menu, and are presented in Appendix B.
_________________________________________________________________________________
MicroLEIS: Ero&Con
PANTANAL Model
___________________________________________________________
VAX.1
VAP
VAN
VAH
VCP
VAX.2
VAX
VCN
VMP
VCH
VMN
VMH
VMX
VCX
Figure 4.2. Index of the decision trees of the Pantanal model
33
WWW MicroLEIS
Ero&Con module
Table 4.4. Summary of environmental land/management qualities and associated
characteristics for each vulnerability type of Pantanal evaluation model.
______________________________________________________________________
Land/management
Vulnerability
Land/management
quality
type
characteristic
______________________________________________________________________
Attainable contamination risks
Surface run-off, r
P, N, H, X
Landform;
Soil
erodibility;
Rainfall erosivity.
Leaching degree, l
P, N, H, X
Monthly precipitation; Monthly
temperature; Groundwater table
depth; Drainage; Particle size
distribution.
Phosphate fixation, f
P
pH;
Particle size distribution;
Organic matter.
Cation retention, c
N, H
pH;
Particle size distribution;
CEC; Organic matter.
Denitrification, d
N
Monthly
temperature;
Groundwater table depth; Organic
matter; pH.
Pesticide sorption, o
X
Organic matter; pH; Particle size
distribution; CEC.
Pesticide degradation, g
X
Monthly temperature; Monthly
precipitation; pH; Organic matter.
Management contamination risks
Phosphate incidence, i
P
Landuse type; Use of P-fertilizer;
Artificial drainage.
Nitrogen incidence, j
N
Landuse type; Use of N-fertilizer;
Crop rotation; Tillage practices;
Time of fertilization; Residues
treatment.
Heavy metals incidence, q H
Landuse type; Crop rotation; Use
of pesticides; Use of fertilizers;
Use of waste.
Pesticides incidence, t
X
Landuse type; Persistence in soil;
Toxicity
of
pesticides;
Application methods; Artificial
groundwater level.
______________________________________________________________________
Vulnerability types: Phosphorus (P), Nitrogen (N), Heavy metals (H), and
Pesticides (X).
34
WWW MicroLEIS
Ero&Con module
5. Hypothetical Evaluations
The user has the option to generate hypothetical predictions by changing the
climate- or/and management-related variables. So, it will be possible to predict for
example the impact of climate changes on the field vulnerability to water erosion, or to
predict the impact of the residues treatment of a field unit to pesticides contamination
Table 5.1 shows the different options to run the hypothetical
vulnerability.
prediction.
Table 5.1. Menu to select type of hypothetical evaluation.
______________________________________
HYPOTHETICAL EVALUATIONS
______________________________________
1 Climatic Change
2 Management Change
3 Climate and Management Change
4 Compute Evaluation
H Explanation
R Return to Main Erosion Menu
________________________________________
5.1. Climate Change
Selection of the Hypothetical Climate Change option displays the screen shown
in Table 5.2. At first, it is necessary to define the climate perturbation(s).
35
WWW MicroLEIS
Ero&Con module
Table 5.2. Data input screen to generate a hypothetical prediction by changing the
climate-related factors (∆P and ∆T)
__________________________________________________________________________________
MicroLEIS: Ero&Con
RAIZAL Model
___________________________________________________________
CLIMATIC CHANGE
___________________________________________________________
_____________________________________
∆ Pmax
Jan
Feb
Mar
Apr
May
Jun
Jul
Aug
Sep
Oct
Nov
Dec
0.0
0.0
0.0
0.0
0.0
0.0
0.0
0.0
0.0
0.0
0.0
0.0
∆ Pmean 0.0
0.0
0.0
0.0
0.0
0.0
0.0
0.0
0.0
0.0
0.0
0.0
∆ Tmean 0.0
0.0
0.0
0.0
0.0
0.0
0.0
0.0
0.0
0.0
0.0
0.0
________________________________________________________________________________________
∆ Pmax: Increment (+ or -) of Maximum Precipitation, %
∆ Pmean: Increment (+ or -) of Mean Precipitation, %
∆ Tmean: Increment (+ or -) of Mean Temperature, °C
______________________________________________________________________
Three climate perturbation results from GCMs assumptions for the
Mediterranean South can be selected using the <F1> key (Table 5.3). To apply these
increments (∆P and ∆T), the months December, January and February are included in
the winter, and July, August and September in the summer. No changes are considered
in the other months of the year. However, any arbitrary set of climate perturbations can
be used.
The option "Compute Evaluation" selects the evaluating-scenario. When
selected, the model automatically evaluates the hypothetical climate change scenario.
Finally, the model asks for names of files of tabular, graphical and CSV format
presentation to display the output evaluation results.
36
WWW MicroLEIS
Ero&Con module
Table 5.3. "Popup" screen showing three climate perturbations.
______________________________________________
MicroLEIS: Ero&Con
RAIZAL Model
_________________________________________________________________________________
Predicted climate perturbations
(after Kenny et al. 1993)
___________________________________________________________
∆T, °C
Year
∆P, %
__________________
_________________
Winter
Winter
Summer
Summer
___________________________________________________________
Mediterranean South
2010
0.5
0.25
-1.0
-8.0
2030
1.25
1.25
-2.0
-8.0
2050
1.5
2.0
-3.0
-12.0
____________________________________________________________
________________________________________________________________________________________________________
5.2. Management Change
A Management Change evaluation can be made by changing:
- All the Management Characteristics (FUT). Selecting a`particular Field
Utilization Type (FUT), by using the <F1> key, imposes it on all the
evaluation-units of an evaluating-scenario.
- One or more Management Characteristics (MC). Selecting the classes of
the MCs imposes them on all the evaluating-units of an
evaluating-scenario.
In both cases, the option "Compute Evaluation" selects the evaluating-scenario.
When selected, the model automatically evaluates the hypothetical management change
scenario.
Finally, the model asks for names of files of tabular, graphical and CSV format
presentation to display the output evaluation results for this hypothetical scenario.
37
WWW MicroLEIS
Ero&Con module
5.3. Climate and Management Change
Ero&Con models can also make hypothetical evaluations considering
climate and management changes simultaneously. This option combines two of the
previous changes: climate factors and management characteristics.
The option "Compute Evaluation" selects an evaluating-scenario. When
selected, the model automatically evaluates the hypothetical climate/management
change scenario.
Finally, the model asks for names of files of tabular, graphical and CSV format
presentation to display the output evaluation results for this hypothetical scenario.
For this double hypothetical evaluation and for the two previous single
hypothetical evaluations, the changes of input variables are not saved in the climate and
management input database of Ero&Con models.
6. Output Evaluation Results
38
WWW MicroLEIS
Ero&Con module
Three types of presentation - tabular, graphical and CSV format - are generated
by Ero&Con models. These outputs are stored in files whose names were asked for by
the program, and placed in the directory C:\MLERO\OUTPUT. The "Evaluation
Results" menu ( Table 6.1) gives access to all these output files of the models.
Table 6.1. Evaluation results menu of the RAIZAL model
______________________________
EVALUATION RESULTS
___________________________________
1 Display Results
2 Delete Results
H Explanation
R Return to Main Erosion Menu
___________________________
6.1. Display Results
The "Display Results" option is used to show the files of evaluation results, both
original and hypothetical, referring to all the evaluating-units of a particular
evaluating-scenario.
For the three types of vulnerability class - Attainable, Management and Actual the evaluation results are shown in the following formats:
1) The tabular presentation of the evaluating-scenario with the evaluating unit,
location, water and wind vulnerability classes (subclasses), and total index. For the
actual vulnerability the following construction is used:
Class (attainable subclass/management subclass) e.g. V9 (kr/oz)
A summary of the vulnerability classes and their representative area, in km2, for
this evaluated scenario is also included.
2) The graphical presentation shows the water and wind vulnerability class
distribution, in percentage of the area, for the evaluated scenario.
3) The CSV format presentation, as the best manner to link the Ero&Con models
with a GIS, is used on a similar way to the tabular presentation: including longitude,
latitude and altitude of each evaluating-unit.
39
WWW MicroLEIS
Ero&Con module
The results of hypothetical evaluations are presented in the same formats,
although a reference to the climate or/and management change is also included.
The following pages show these output evaluation results for a scenario formed
by a set of benchmark fields of Sevilla province. The original evaluation of results is
followed by the corresponding results for a hypothetical evaluation of Sevilla province.
Example 6.1. Tabular presentation of the attainable contamination risks classes of the
first 15 evaluating-units of evaluating-scenario Andalucia.
_______________________________________________________________________________
MicroLEIS:
PANTANAL model
_______________________________________________________________________________
40
WWW MicroLEIS
Ero&Con module
Base Scenario: Andalucia
Attainable contamination vulnerability classes
____________________________________________________________________________________
Evaluating
unit
Location
Land Vulnerability types
___________________________________________
Phosphorus Nitrogen
Heavy
Pesticides
metals
______________________________________________________________________
F-AL01
Greda-Roja Almanzaro-alto
V1
V2r
V3r
V4or
F-AL02
Pardo-calizo Almanzaro bajo
V1
V2c
V3c
V3g
F-AL03
Rendsina Andarax-Gabor
V1
V2c
V3c
V3g
F-AL04
Salino Campo-Dalías
V1
V3cd
V3cr
V3g
F-AL05
Volcánico Campo-Níjar
V2
V2c
V3c
V3g
F-AL06
Desértico Campo Tabernas
V3r
V2c
V3c
V3g
F-AL07
Pardo-calizo Los-Vélez
V1
V3c
V4cr
V3g
F-AL08
Aluvial Río-Nacimento
V2
V3cd
V3c
V3g
F-CA01
Tierra-negra Campiña
V3r
V4cdr
V4cr
V2r
F-CA02
Bujeo-blanco Campo-Gibraltar
V1
V3cd
V3cr
V1
F-CA03
Rojo Costa
V2
V3cd
V4cr
V4g
F-CA04
Tierra-parda Janda-Aljibe
V1
V4cr
V4cr
V4r
F-CA05
Albariza Rincón-Jerez
V3
V4l
V4cr
V2
F-CA06
Terra-rossa Sierra
V1
V4r
V4r
V3r
F-CO01
Albariza Campiña-alta
V4r
V4lr
V4cr
V4r
________________________________________________________________________________
Example 6.2. Graphical presentation of the attainable contamination risks classes of
the first 15 evaluating-units of evaluating-scenario Andalucia.
41
WWW MicroLEIS
Ero&Con module
_______________________________________________________________________________
MicroLEIS: Ero&Con
PANTANAL model
_______________________________________________________________________________
Example 6.3. CSV format of the first 15 evaluating-units of evaluating-scenario
Andalucia.
_______________________________________________________________________________
MicroLEIS: Ero&Con
PANTANAL model
_______________________________________________________________________________
42
WWW MicroLEIS
Ero&Con module
Base Scenario : Andalucia
Land Unit
Long.
Lat.
Alt.
P
N
H
X
F-AL01;
W00218;
N3717; 1260; 1;
2;
3;
4;
F-AL02;
W00152;
N3714; 210;
1;
2;
3;
3;
F-AL03;
W00234;
N3654; 900;
1;
2;
3;
3;
F-AL04;
W00237;
N3644; 3;
1;
3;
3;
3;
F-AL05;
W00211;
N3654; 90;
2;
2;
3;
3;
F-AL06;
W00225;
N3702; 300;
3;
2;
3;
3;
F-AL07;
W00218;
N3736; 1080; 1;
3;
4;
3;
F-AL08;
W00247;
N3709; 700;
2;
3;
3;
3;
F-CA01;
W00600;
N3648; 53;
3;
4;
4;
2;
F-CA02;
W00522;
N3612; 70;
1;
3;
3;
1;
F-CA03;
W00609;
N3630; 20;
2;
3;
4;
4;
F-CA04;
W00540;
N3630; 450;
1;
4;
4;
4;
F-CA05;
W00611;
N3644; 60;
3;
4;
4;
2;
F-CA06;
W00534;
N3648; 200;
1;
4;
4;
3;
F-CO01;
W00439;
N3731; 240;
4;
4;
4;
4;
_______________________________________________________________________________
7. Bibliography
CEC, 1992. CORINE soil erosion risks and important land resources. Commission of
43
WWW MicroLEIS
Ero&Con module
the European Communities, DGXII. EUR 13233 EN. Brussels.
CSIC, 1995. CDB: Climate database. Monthly data module. IRNAS Pub., Sevilla.
CSIC, 1995. MDBm: Multilingual management database. First approximation. IRNAS
Pub., Sevilla.
Crompvoets, J.W., Mayol, F. and de la Rosa, D. 1994. An expert evaluation system
for assessing agricultural soil erosion vulnerability. In: Soil responses to climate
change (M.D. Ronsevell and P.J. Loveland, eds.) NATO ASI Series, SpringerVerlag, Heidelberg.
De la Rosa, D., Crompvoets, J. and Mayol, F. 1995. Risk modelling: land vulnerability
expert system. In: ACCESS: Agroclimatic Change and European Soil
Suitability. Volume I: Technical Report (P. Loveland, ed.). (In press).
FAO 1976. A framework for land evaluation. Soils Bulletin No. 26, FAO Pub., Rome.
FAO 1984. Provisional methodology for assessment and mapping of desertification.
FAO-UNEP Pub., Rome.
FAO-ISRIC-CSIC 1995. SDBm: Multilingual soil database. World Soil Resources
Report No. 81. FAO Pub., Rome.
Kenny, G.J., Harrison, P.A. and Parry, M.L. (eds.). 1993. The effect of climate change
on agricultural and horticultural potential in Europe. Research Report No.2,
Environmental Change Unit, Oxford.
Loveland, P. (ed.) 1995. ACCESS: Agroclimatic change and European Soil Suitability.
Volume I: Technical Report. (In press).
Thornthwaite, C.W. 1948. An approach toward a rational classification of climate.
The Geogr. Rev. 38:55-94.
44