1
Step Charts
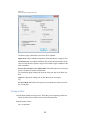
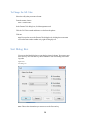
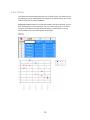
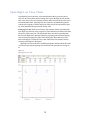
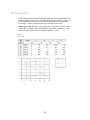
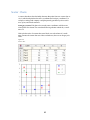
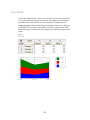
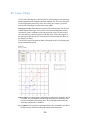
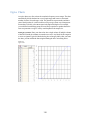
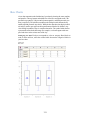
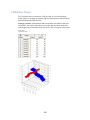
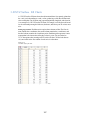
Step charts are the same as line charts, except that they use steps rather than
sloped lines to connect points in a series.
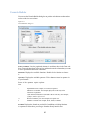
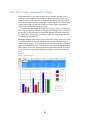
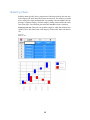
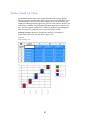
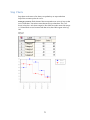
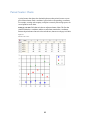
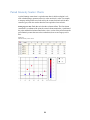
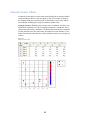
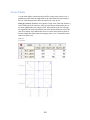
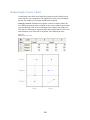
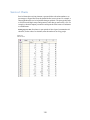
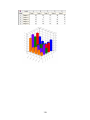
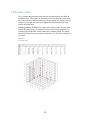
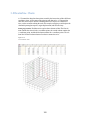
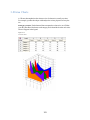
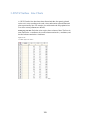
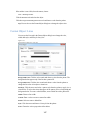
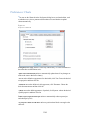
Setting up your data. Each column of data corresponds to one series of steps (a data
series) on the chart. You can have more than one series per data sheet. The y axis
shows values; the x axis shows categories. Row labels are used to name each category. Column labels are used to name each data series; these labels appear in the legend.
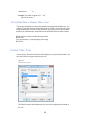
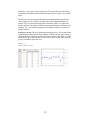
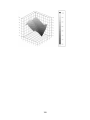
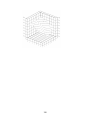
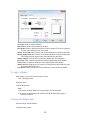
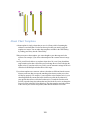
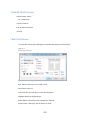
Figure 5-2
Step chart
71