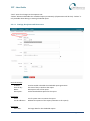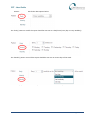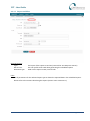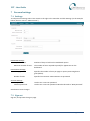
1
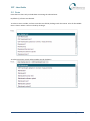
CPT User Guide CPT - User Guide Table of Contents 1 2 3 4 5 Sign in ............................................................................................................................................ 4 Man menu ..................................................................................................................................... 5 2.1 Menu items............................................................................................................................ 5 Dashboard ..................................................................................................................................... 6 Reports .......................................................................................................................................... 7 4.1 Navigating in Data grids......................................................................................................... 7 4.2 Navigating in charts ............................................................................................................... 9 4.2.1 XY – chart..................................................................................................................... 9 4.2.2 Normal distribution chart.......................................................................................... 10 4.2.3 Zoom ......................................................................................................................... 10 4.3 Exporting reports ................................................................................................................. 11 4.3.1 Export to PDF............................................................................................................. 11 4.3.2 Export to Excel........................................................................................................... 11 4.4 Filtering reports ................................................................................................................... 11 4.5 SPC report ............................................................................................................................ 12 4.6 Time Series report ............................................................................................................... 14 4.7 Test Result report ................................................................................................................ 16 4.8 Unit Overview report........................................................................................................... 17 4.9 Test Yield report .................................................................................................................. 19 4.10 Test Step Yield report .......................................................................................................... 21 4.11 Test Step Error Pareto report .............................................................................................. 23 4.12 Test Duration report ............................................................................................................ 24 4.13 Test Step Duration report .................................................................................................... 26 Report filters ............................................................................................................................... 27 5.1 Filter option relations .......................................................................................................... 27 5.2 Test period ........................................................................................................................... 27 5.3 Items .................................................................................................................................... 28 5.4 Test ...................................................................................................................................... 29 5.5 Tests..................................................................................................................................... 31 5.6 Test step .............................................................................................................................. 33 5.7 Test result ............................................................................................................................ 34 5.8 Test run ................................................................................................................................ 35 5.9 Test step cycle ..................................................................................................................... 36 5.10 Test stations ........................................................................................................................ 37 5.11 Test fixtures ......................................................................................................................... 39 5.12 Test version ......................................................................................................................... 41 5.13 Test category ....................................................................................................................... 42 5.14 Measurement range ............................................................................................................ 43 5.15 Sort by.................................................................................................................................. 45 5.16 Serial no. range .................................................................................................................... 46 5.17 Unit Revision........................................................................................................................ 46 5.18 Item ..................................................................................................................................... 48 5.19 Serial no. .............................................................................................................................. 49 Page 2 of 69 CPT - User Guide 6 7 8 9 5.20 Time scale ............................................................................................................................ 49 5.21 Time element....................................................................................................................... 50 5.22 Handling time cutoff ............................................................................................................ 50 System ......................................................................................................................................... 51 6.1 User management ............................................................................................................... 51 6.1.1 Users .......................................................................................................................... 51 6.1.2 Security Groups ......................................................................................................... 53 6.2 Data management ............................................................................................................... 56 6.2.1 Items.......................................................................................................................... 56 6.2.2 Item Groups............................................................................................................... 56 6.3 Importer............................................................................................................................... 57 6.3.1 Import Tasks .............................................................................................................. 57 6.3.2 Import Task Monitor ................................................................................................. 62 6.4 Scheduled Reports ............................................................................................................... 62 6.4.1 Adding and Editing scheduled reports ...................................................................... 62 Personal settings ......................................................................................................................... 66 7.1 Settings ................................................................................................................................ 66 7.2 Sign out ................................................................................................................................ 66 Statistical calculations ................................................................................................................. 67 8.1 Formulas .............................................................................................................................. 67 8.1.1 Mean value (𝑿) .......................................................................................................... 67 8.1.2 Standard deviation (σ)............................................................................................... 67 8.1.3 Capability (Cp) ........................................................................................................... 67 8.1.4 Capability Index (Cpk)................................................................................................ 67 8.2 Special value handling ......................................................................................................... 68 Revision History ........................................................................................................................... 69 Page 3 of 69 CPT - User Guide 1 Sign in To sign in, enter provided username and password and press the ‘Sign in’ button. When signed in the Dashboard page is presented. Page 4 of 69 CPT - User Guide 2 Man menu The CIM SPC main menu line is placed at the top of the page. The above menu is taken from the reports / SPC page. This is indicated by ‘gray’ area. This area shows the actual page. You can click in the gray area to shortcut back in the menu. To select a main menu item, simply click the text in in the green area. 2.1 Menu items CIM SPC – Opens info page about CIM SPC, including build version etc. Dashboard – Opens the Dashboard page Reports – Opens the main report page System – Opens the system main page Question mark – Opens the user manual Remark Depending of the assigned user rights some menu items will not be available. Page 5 of 69 CPT - User Guide 3 Dashboard To enter Dashboard, click the ‘Dashboard’ text in menu line. The Dashboard shows the performance of the test data by providing a top 15 of ‘Most Tested’ and ‘Worst Yield’ tests. Data is loaded when page is shown. By clicking the button, the view is refreshed with the latest data available. The number of days and minimum number of tests to take into consideration in this view can be adjusted in the personal settings (see section 7.1). Page 6 of 69 CPT - User Guide 4 Reports To enter Report main page, click the ‘Reports’ text in menu line. The page presents the available reports (depends on the current user rights). To select a report, move the mouse over the appropriate report square and select. 4.1 Navigating in Data grids When report results are presented in a grid (table) as shown below, the following navigation can be used. Page 7 of 69 CPT - User Guide Text can be searched in columns containing text. In the above screenshot the Test and Test step columns can be searched. To search, simply enter a text in the search field. The text can be any part of the texts contained in the searched columns. Example of search with “ana” If a table contains more rows than defined by a user setting, the paging control is enabled. To navigate through the pages, click arrow icons or page number directly. The sort order of the table can be set to order from high to low, or low to high. Further, the sort order can be controlled by selecting multiple columns headers (hold shift key while clicking the headers). When multi selecting, the sort order is determined by the order the columns is selected. Click a column header once to choose low to high sorting, and click twice to select high to low sorting. Page 8 of 69 CPT - User Guide 4.2 Navigating in charts In reports containing graphs, the following navigation can be used. 4.2.1 XY – chart Meaning of circle and triangle: Circles represent a single measurement, triangles represent a group of measurements. Tooltip: By moving the mouse curser over either a circle or a triangle, detailed information appears. Tooltip - circle If the mouse is clicked on a circle, the report Unit Overview is shown, with filter options filled out corresponding to the selected unit. Tooltip – triangle Page 9 of 69 CPT - User Guide 4.2.2 Normal distribution chart Each bars represent a percentage of measurements. Hold the mouse over a bar to see a tooltip with detailed information: 4.2.3 Zoom The zoom mode is controlled by the buttons “X axis”, “Y axis” and “Both axes”. “X axis” – Zoom in only on X axis “Y axis” – Zoom in only on Y axis “Both axes” – Zoom in by selection rectangle To reset zoom level back to the initial level, press reset button, or double click the graph. Page 10 of 69 CPT - User Guide 4.3 Exporting reports Most reports can be exported to Microsoft Excel and Adobe PDF. 4.3.1 Export to PDF This report type exports all the result data including graphs, filter settings etc. To export to PDF, select menu item “Export” and then Report to PDF. The report is generated on the server and presented as a download file. 4.3.2 Export to Excel This report type exports all the result data for the report. Filter selection is presented on the first page, and the data on second page. To export to Excel, select menu item “Export” and then Report to Excel. The report is generated on the server and presented as a download file. 4.4 Filtering reports All reports are made based on test data selected with filter. Each report has a set of default filter options and some additional advanced filter options: By clicking the Default button, all default filtering options are visible. Clicking the Advanced button makes further filter options available for the selected report. Whenever possible, the selected filtering options are transferred when switching between different types of reports. Clicking the Reset button causes all filtering options to be reset to their initial state and value. Page 11 of 69 CPT - User Guide 4.5 SPC report Statistical analysis result for test steps represented by mean value, standard deviation (σ), Cp and Cpk index values as well as specification limits. For further information on the calculated statistical values, please refer to section 8. Typical use: The SPC report contains the results of the statistical analysis performed on the data selected by the filter criteria. Please notice, that the correct use of the SPC report presumes the filtered data is normal distributed and lies within the normal distribution “Bell Curve” (see further explanation in section 4.6). The capability values Cp and Cpk are used to indicate the performance of the production processes involved in generating the selected data. Typically these values are used in Six Sigma process optimizations to give a direct indication of a process’ sigma level and the defects PPM (Defect Parts Per Million) See estimated conversion table below: Cpk value Sigma level Defects (PPM) 0.333 1 691000 0.667 2 308500 1.000 3 66800 1.333 4 6200 1.667 5 230 2.000 6 3.4 Please note, at the above show conversion between sigma level and Cpk value is an estimate. Further, the conversion assumes a 1.5 sigma shift. For further details please refer to Six Sigma literature. Notes on specification limits (Min USL and Max LSL): In some cases, the upper and lower specification limits (USL and LSL) vary within the data selected by the filter. In those cases, all statistical values are calculated from a worst case perspective, using the minimum upper specification limit and the maximum lower specification limit found in the filtered data. When presented in the SPC report, these values are denoted Min USL and Max LSL, respectively. All calculated Page 12 of 69 CPT - User Guide statistical values in the SPC report are calculated using the formulas described in section 8, using the Min USL and Max LSL as specification limits in the formulas. Notes on Cp and Cpk values: By definition, the Cpk value is the adjustment of Cp for the effect of non-centered distribution (a centered distribution has its mean value right in the middle of LSL and USL). Cpk is calculated both against USL (denoted Cpk USL) and against LSL (denoted Cpk LSL). The final Cpk value is the lower of these two values. This means, that if the distribution is centered or close to centered, Cpk equals Cp. On the other hand, if Cpk is relatively much less than the Cp value, this indicates a mean value far off the center of USL and LSL. In these cases, something significant might have changed within the production process, or perhaps USL or LSL simply needs adjustment to cope with changed circumstances. Cpk values above 2, corresponding to less than 3.4 defects per million is a clear indication that USL and LSL are set at a level allowing almost everything to pass through the test. To get the SPC report, fill out the appropriate filter options and click the Search button. To see measurements in a “Time Series report”, simply click the magnifying glass in the first column of each row. This opens the Time Series report with prefilled filter options according to the selected test step. Page 13 of 69 CPT - User Guide 4.6 Time Series report Time based XY-graph and the normal distribution graph of the measurements for a specific test step. Statistical analysis values are shown for the selected measurements. Typical use: Based on the a filter criteria including a specific test step, the Time Series report shows three pieces of information: Calculated Values: All calculated statistical values for the given filter criteria. These values correspond to the values visible on the SPC report. Also visible are additional values corresponding to the mean value minus/plus 3 times standard deviation. These values are denoted -3σ and +3σ and are normally called “control limits”. Series Chart: Time based XY chart showing all measurements for the given filter criteria. The chart also contains indications of the values USL, LSL as well as the above mentioned control limits, denoted -3σ and +3σ. Distribution Chart: Chart showing the distribution (population) of the measurements in the given filter criteria. Following the prerequisite that SPC can only be done on data, which has a normal distribution, the chart should show a clear “Bell Curve” of the distribution. The chart also contains indications of the values Min USL, Max LSL as well as the above mentioned control limits, denoted -3σ and +3σ. The Time Series report can be used to check the normal distribution of the selected data. According to the empirical rule for normal distribution, only 0.3% of the measurements should lie outside the control limits. This means, that in case the distribution shows more than 0.3% outside the control limits, the distribution might not have a proper normal distribution, or the process producing the measurements are out of statistical control. Production outside statistical control is a good reason to check the selected data further. Page 14 of 69 CPT - User Guide To get the Time Series report, fill out the appropriate filter options and click the Search button. Page 15 of 69 CPT - User Guide 4.7 Test Result report The report shows the most recent test data and test results imported by the system. Typical use: The Test Result report is typically used to get an overview of what has recently been tested in the production. It provides an overall overview of tests performed on units, the number of re-tests performed, test station names and test operators. By setting the appropriate filter options, the report can be used to see what has been tested on a given station. It also provides an efficient tool to check if re-testing is widely used for certain products or certain periods during the day. By entering a specific serial number for a unit in the filter options, test data for that specific unit can be found and displayed. To get the Test Result report, fill out the appropriate filter options and click the Search button. Page 16 of 69 CPT - User Guide 4.8 Unit Overview report Test step result and measurements for all performed test runs for a specific item serial number. Typical use: The Unit Overview report is typically used to get full test reports for specific units. In case a unit has been tested more than once, the performed tests can be selected and shown side-by-side. This way it is easy to get an overview and compare the results of each test step and any differences in test conditions and parameters. The report can also be used as an easy way to get full product test documentation in case the product undergoes repair or the like. To get the Unit Overview report, fill out the filter options and click the Search button. Page 17 of 69 CPT - User Guide To see and compare specific test step measurements, select appropriate tests in the “Test Overview” section. The view is automatically updated during test selection. Page 18 of 69 CPT - User Guide 4.9 Test Yield report Numeric details and bar-graph of the yield for a number of selected tests. Each bar in the graph shows the passed/failed relation of the performed tests. Typical use: The Test Yield report is typically used get an overview of the actual yield and percentage yield for tests performed on a given product or product group. Normally all attention should be focused on maximizing first-pass yield, as any subsequent tests will add cost to the product and hence lower production efficiency. So, comparing first-pass yield with last-pass yield gives a tangible indication of production inefficiency and added costs. Of course, when looking at yield, the production volume is also a key element to determine where to focus any production optimizing efforts in order to get the best payback. Another way to use this report is to compare the yield results of different time periods and thereby directly compare the production capability for time periods or different shifts, operators etc. Page 19 of 69 CPT - User Guide To get the Test Yield report, fill out the appropriate filter options and click the Search button. A tooltip with detailed information will appear when holding the mouse pointer on bars in the graph. Remark Selecting an item, leaving the filter option “Tests” at the default value (*) “All tests”, will not give the net production yield for the selected item. In order to get the net production yield, the last test performed before shipping must be selected as a filter option along with the Item itself. Page 20 of 69 CPT - User Guide 4.10 Test Step Yield report Numeric details and graphical presentation of the yield for each individual test step for a selected test. The combined bar-graph shows test steps and their yield. Typical use: The Test Step Yield report can be used to determine which of the performed tests are the most likely to fail, and which steps are most likely to always succeed. A common picture on this report indicates that half of the test steps performed hardly ever fails. There can be several reasons behind this, but it could be a sign, that the specification limits (USL and LSL) for these test steps are too conservative, and as a result almost never catches any errors. Another reason could be that the step is not necessary at all. Whatever the reason, a test step that does not directly improve quality by catching errors, could be considered a waste of testing time and an undesired increase in production time and costs. Put together it might be a potential for increased yield. Page 21 of 69 CPT - User Guide To get the Test Step Yield report, fill out the appropriate filter options and click the Search button. A tooltip with detailed information will appear when holding the mouse pointer on bars in the graph. Page 22 of 69 CPT - User Guide 4.11 Test Step Error Pareto report Sorted list of most frequent failed test steps for a selected item. Typical use: The Test Step Error Pareto report is very similar to the Test Step Yield report and essentially shows the same data. The only difference is that it focuses on errors (failed tests), where the Test Step Yield report focuses on succeeded tests. The two reports can be used for the same purposes. Please refer to section 4.10 for further description on the use of these reports. To get the Test Step Error Pareto report, fill out the appropriate filter options and click the Search button. Page 23 of 69 CPT - User Guide 4.12 Test Duration report Time based stacked bar-graph showing the relation between the total test and handling time for selected tests. The number of tests performed is shown in a separate XY-line. Typical use: The Test Duration report can be used to map the time used to test a product. It shows the relation between testing time and handling time between two tests. Handling time is defined as the time from the end of one test until the beginning of the next test. In essence, handling time is waste and hence loss of production efficiency, so all efforts should be made to minimize handling time (provided there is a significant production volume to pay for the investment). Poor handling time can originate from a number of different sources – naming a few: Test fixtures and connectors are too difficult and time consuming to handle Products undergo transport between tests Manual handling is too slow Whatever the reason is for the poor handling time, it should be properly investigated, perhaps as part of a LEAN project to optimize production logistics and maybe even reduce or simplify production steps. Like the Test Yield report, the Test Duration report can also be used to compare performance as a function of time periods, operators, test fixtures or shifts. Page 24 of 69 CPT - User Guide To get the Test Duration report, fill out the appropriate filter options and click the Search button. A tooltip with detailed information will appear when holding the mouse pointer on bars in the graph. Page 25 of 69 CPT - User Guide 4.13 Test Step Duration report Detailed duration information for all test steps in a test. Typical use: The Test Step Duration report can be used to get a deeper insight into time it takes for each test step to complete. The report provides simple statistics for the time spent for each test step, including average duration, standard deviation and worst duration. As test time is one of the limiting elements for production capacity, efforts should be made to investigate and optimize any test step taking up to majority of time. When looking at time spent on test steps, it is also very interesting, if any of the “unnecessary test steps” found via the Test Step Yield report is also taking up lots of time when testing. In that case, much time is spent on completing test steps that hardly ever fail – perhaps a serious candidate for optimization. To get the Test Step Duration report, fill out the appropriate filter options and click the Search button. Page 26 of 69 CPT - User Guide 5 Report filters This chapter provides detailed information on the different report filter elements: Hint: When showing a report based on selected filer criteria, you can copy the page link (URL) and store or send to a colleague by e-mail. When opening the copied link (URL) in an internet browser, the same report content will reappear based on the original filter options. 5.1 Filter option relations Some filter options are inter-related. This means that for these inter-related filter options, only existing combinations can be selected as search criteria for a given report. For example: If a filter option for “Test” is filled out, all other filter options related to “Test” are pre-filtered so that they only contain values that relates to the selected value for “Test”. The following filter options are inter-related: Items Test Test step Test station Test fixture 5.2 Test period Defines start and end time for data selection: To select a date using a calendar window, select date field with a single click. Double click a date field, if the date is entered manually using the keyboard. Date field is formatted as [yyyy-MM-dd] (year – month – day) Time field is formatted as [hh:mm:ss] (hour – minutes – seconds) Time span - “Range” or “Window” Defines how data is selected over a day. Range: Selects all data in the time range given in Test period filter Window: Selects only data between start time [hh:mm:ss] and end time [hh:mm:ss] each day between start date and end date. This feature can be used to filter work shifts etc. Example Page 27 of 69 CPT - User Guide Report time 2012-03-28 10:00:00 2012-04-29 10:30:00 2012-04-30 00:45:00 2012-05-01 20:00:00 2012-06-01 23:00:01 2012-06-02 19:00:00 Included in Range Included in Window X X X X X X X Available in the following report(s) Report SPC Time Series Test Result Repair Pareto Test Yield Test Step Yield Test Step Error Pareto Test Duration Test Step Duration Default filter X X X X X X X X X Advanced filter 5.3 Items Limits data so that it only includes data concerning the selected items. By default (*) all items are selected, however this is an inter-related field (see section 5.1), so a selection in one of the other related fields will influence the available contents of the Items field. To select an item to include, set focus onto the Items field by clicking it with the mouse. A list of all available items is shown. Select an item to include by clicking it. To select more items, simply select another item by clicking it. Page 28 of 69 CPT - User Guide To search for a specific item, simply type any part of the item number or description text. Remark If specific Test(s) are selected, the available items are limited to items related to the selected test(s). Available items can also be limited by assigned user rights. Available in the following report(s) Report SPC Time Series Test Result Repair Pareto Test Yield Test Step Yield Test Step Error Pareto Test Duration Test Step Duration Default filter X X X X X X X X X Advanced filter 5.4 Test Limits data so that it only includes data concerning the selected tests. By default (*) all items are selected, however this is an inter-related field (see section 5.1), so a selection in one of the other related fields will influence the available contents of the Test field. To select a test to include, set focus onto the Test field by clicking it with the mouse. A list of all available tests is shown. Select a test to include by clicking it. Page 29 of 69 CPT - User Guide To search for a specific test, simply type any part of the test name. Remark If specific Item(s) are selected, the available tests are limited to tests related to the selected item(s). Available tests can also be limited by assigned user rights. Available in the following report(s) Report SPC Time Series Repair Pareto Default filter X X X Advanced filter Page 30 of 69 CPT - User Guide 5.5 Tests Limits data so that it only includes data concerning the selected tests. By default (*) all tests are selected. To select a test to include, set focus onto the Test field by clicking it with the mouse. A list of all available tests is shown. Select a test to include by clicking it. To select more tests, simply select another test by clicking it. Page 31 of 69 CPT - User Guide To search for a specific test, simply type any part of the test name. Remark If specific Item(s) are selected, the available tests are limited to tests related to the selected item(s). Available tests can also be limited by assigned user rights. Available in the following report(s) Report Test Result Test Yield Test Step Yield Test Step Error Pareto Test Duration Test Step Duration Default filter X X X X X X Advanced filter Page 32 of 69 CPT - User Guide 5.6 Test step Limits data so that it only includes data concerning the selected test step. By default (*) all items are selected, however this is an inter-related field (see section 5.1), so a selection in one of the other related fields will influence the available contents of the Test Step field. To select a test step to include, set focus onto the Test step field by clicking it with the mouse. A list of all available test steps is shown. Select a test step to include by clicking it. To search for a specific test step, simply type any part of the test step name. Remark A least one item or test must be selected, before a specific test step name can be selected. Available in the following report(s) Report SPC Time Series Repair Pareto Default filter X X X Advanced filter Page 33 of 69 CPT - User Guide 5.7 Test result Limits data so that it only includes data with the selected test result parameter. To change the test result parameter, set focus onto the Test result field by clicking it with the mouse. A list of all available test results is shown. Select a test result to include by clicking it. Parameters All: Passed: Failed: Aborted: Error: Terminated: includes all test reports regardless of test result includes only “passed” test reports includes only “failed” test reports includes only “aborted” test reports includes only “error” test reports includes only “terminated” test reports Available in the following report(s) Report SPC Time Series Test Result Test Duration Test Step Duration Default filter X X X X X Advanced filter Page 34 of 69 CPT - User Guide 5.8 Test run Limits data so that it only includes data with the selected test run parameter. Test run is defined by the number of times an individual unit has been tested in the same test. Parameters All test runs First test run Last test run Test run equals Test run less than Test run greater than Include all test runs in selected data Only the first test run is selected Only the last test run is selected Only the test run number specified in the numeric field is selected Only test runs less than test run number specified in the numeric field is selected Only test runs greater than test run number specified in the numeric field is selected Available in the following report(s) Report SPC Time Series Test Result Test Yield Test Step Yield Test Step Error Pareto Test Duration Test Step Duration Default filter X X X X X X X X Advanced filter Page 35 of 69 CPT - User Guide 5.9 Test step cycle Limits data so that it only includes data with the selected test step cycle parameter. Test step cycle is defined by how many times an individual test step has reported a result in the same test report Parameters All test step cycles First test step cycle Last test step cycle Includes all test step cycles in selected data Only the first test step cycle is selected Only the last test step cycle is selected Available in the following report(s) Report SPC Time Series Test Step Yield Test Step Error Pareto Test Step Duration Default filter X X X X X Advanced filter Page 36 of 69 CPT - User Guide 5.10 Test stations Limits data so that it only includes data from the selected test station(s). By default (*) all items are selected, however this is an inter-related field (see section 5.1), so a selection in one of the other related fields will influence the available contents of the Test stations field. To select a test station to include, set focus onto the Test stations field by clicking it with the mouse. A list of all available test stations is shown. Select a test station to include by clicking it. To select more test stations, simply select another test station by clicking it. Page 37 of 69 CPT - User Guide To search for a specific test station, simply type any part of the test station name. Remark Test stations are not related to specific tests. Therefore all known test stations can be selected. Since test stations is not a mandatory field, there can be test results without any relation to test station. Available in the following report(s) Report SPC Time Series Test Result Test Yield Test Step Yield Test Step Error Pareto Test Duration Test Step Duration Default filter Advanced filter X X X X X X X X Page 38 of 69 CPT - User Guide 5.11 Test fixtures Limits data so that it only includes data from the selected test fixture(s). By default (*) all items are selected, however this is an inter-related field (see section 5.1), so a selection in one of the other related fields will influence the available contents of the Test fixtures field. To select a test fixture to include, set focus onto the Test fixtures field by clicking it with the mouse. A list of all available test fixtures is shown. Select a test fixture to include by clicking it. To select more test fixtures, simply select another test fixture by clicking it. Page 39 of 69 CPT - User Guide To search for a specific test fixture, simply type any part of the test fixture name. Remark Test fixtures are not related to specific test stations, tests etc. Therefore all known fixtures can be selected. Since test fixture not is a mandatory field, there can be test results without any relation to test fixture. Available in the following report(s) Report SPC Time Series Test Result Test Yield Test Step Yield Test Step Error Pareto Test Duration Test Step Duration Default filter Advanced filter X X X X X X X X Page 40 of 69 CPT - User Guide 5.12 Test version Filters on the version of the Test software used to test the units (Test sequence version). By default (*) all test versions are selected. To select a test version to include, set focus onto the Test version field by clicking it with the mouse. A list of all available test versions is shown. Select a test version to include by clicking it. To search for a specific test version, simply type any part of the test version name. Remark Test version is not related to specific tests. Therefore all known test versions can be selected. Since test version isn’t a mandatory field, there can be test results without any relation to test version. Page 41 of 69 CPT - User Guide Available in the following report(s) Report SPC Time Series Test Result Test Yield Test Step Yield Test Step Error Pareto Test Duration Test Step Duration Default filter Advanced filter X X X X X X X X 5.13 Test category Filter on one or more test categories. Test categories can for example be “Production” or “Commissioning”. If all real production data is marked with test category “Production”, the filter can be used to filter out all data that is not related to units being produced. Note: The filter depends on the availability of test category in the data being imported. Available in the following report(s) Report SPC Time Series Test Result Test Yield Test Step Yield Test Step Error Pareto Test Duration Test Step Duration Default filter Advanced filter X X X X X X X X Page 42 of 69 CPT - User Guide 5.14 Measurement range Measurement range is used to filter numeric measurements. The Min and Max value can be used together or individually. Example: Measurements without Min or Max set. Measurements with Min set to 95000 and no Max limit. Page 43 of 69 CPT - User Guide Measurements with Min set to 95000 and Max set to 105000 Available in the following report(s) Report Time Series Default filter Advanced filter X Page 44 of 69 CPT - User Guide 5.15 Sort by Used to present data in the Time Series graph, either by time stamp (date) or by serial number. The sorting of serial numbers is handled as texts. Example of text sort: SER1 SER2 SER20 SER3 Example of data presented by time: Same data presented by serial no.: Available in the following report(s) Report Time Series Default filter Advanced filter X Page 45 of 69 CPT - User Guide 5.16 Serial no. range Filters on specific serial numbers. There are two ways to search for serial numbers: Either by filling in only “From serial no.” or by filling in both “From serial no.” and “To serial no.” From serial no. (only): The “*” character can be used as a wild card to create a search like this: AT8IN10*HA09. The result of this search will be all the units ranging from AT8IN100000HA09 to AT8IN109999HA09 assuming that is the format of the given serial number. The “*” can be any character, not only numbers, and any number of characters. From serial no. and To serial no.: When using both “From serial no.” and “To serial no.”, the “*” character cannot be used. Instead, type in two serial numbers like this: From AT8IN100000HA09 to AT8IN109999HA09. The result of this search will be the same as above – all units ranging from AT8IN100000HA09 to AT8IN109999HA09. Also, the “From – To” search is based on characters, not numbers - so searching like this would also be valid: From AT8IN100000AA09 To AT8IN100000ZZ09. Available in the following report(s) Report SPC Time Series Test Result Repair Pareto Test Yield Test Step Yield Test Step Error Pareto Test Duration Test Step Duration Default filter Advanced filter X X X X X X X X X 5.17 Unit Revision Limits data so that it only includes data from the selected unit revision(s). By default (*) all unit revisions are selected. To select a unit revision to include, set focus onto the unit revisions field by clicking it with the mouse. A list of all available unit revisions is shown. Select a unit revision to include by clicking it. Page 46 of 69 CPT - User Guide To select more unit revisions, simply select another unit revision by clicking it. Page 47 of 69 CPT - User Guide To search for a specific unit revision, simply type any part of the unit revision name. Remark Unit revisions are not related to specific test stations, tests etc. Therefore all known unit revisions can be selected. Since unit revision not is a mandatory field, there can be test results without any relation to a unit revision. Available in the following report(s) Report SPC Time Series Test Result Repair Pareto Test Yield Test Step Yield Test Step Error Pareto Test Duration Test Step Duration Default filter Advanced filter X X X X X X X X X 5.18 Item Limits data so that it only includes data from the selected item. To select an item to include, set focus onto the Item field by clicking it with the mouse. A list of all available items is shown. Select an item to include by clicking it. To search for a specific item, simply type any part of the item number or name. Page 48 of 69 CPT - User Guide Available in the following report(s) Report Unit Overview Default filter X Advanced filter 5.19 Serial no. Used to find a specific unit. Serial number must be identical to the unit’s serial number. Available in the following report(s) Report Unit Overview Default filter X Advanced filter 5.20 Time scale Time scale is used to group presented data. Parameters Hour Day Week Month None Group data selection in hours Group data selection in days Group data selection in weeks (Monday is the first day of the week) Group data selection in months Group data as one selection Page 49 of 69 CPT - User Guide Available in the following report(s) Report Test Yield Test Duration Default filter X X Advanced filter 5.21 Time element Time element is used to filter by test and / or handling time. Parameters Both test and handling time Only test time Only handling time Shows test time and handling time in selection data result Shows only test time in selection data result Shows only handling time in selection data result Available in the following report(s) Report Test Duration Default filter Advanced filter X 5.22 Handling time cutoff Defines the upper limit of the handling time between two tests. If the time between two tests exceeds handling time cutoff, the handling time is set to the cutoff value. Time is entered as hh:mm:ss (hours : minutes : seconds) Available in the following report(s) Report Test Duration Default filter Advanced filter X Page 50 of 69 CPT - User Guide 6 System By selecting System from the menu, the follow page is shown. 6.1 User management Gives access to maintain users and security groups. 6.1.1 Users Gives a list of all users in the system. Existing users cannot be deleted. If access needs to be restricted/blocked for a certain user, edit the user and uncheck the “Enabled” check box. Page 51 of 69 CPT - User Guide 6.1.1.1 Add new user To add a new user, click the ‘New User” button on the Users page. Fill out the fields on the page and click Save. In order to get access to the system, the user must be enabled and be assigned one or more security groups. Page 52 of 69 CPT - User Guide 6.1.1.2 Edit user To edit an existing user click the edit icon in the user list. When finished editing user settings, click Save to store changes. 6.1.2 Security Groups Security groups control which pages and items a user is allowed to access. If a user is a member of more security groups, it is the sum of all allowed items and pages that defines the final access rights for the user. Page 53 of 69 CPT - User Guide 6.1.2.1 Add new security group To add new security groups click the “New Security Group” on “Security Group page”. Fill in the fields on the page and click Save. Page 54 of 69 CPT - User Guide 6.1.2.2 Edit security group To edit an existing security group, click the edit icon in the security group list. Save stores changes to the security group Delete removes the security group from all users and deletes the security group from the system. This action may affect the access rights of existing users. Page 55 of 69 CPT - User Guide 6.2 Data management Provides functions to control and manage items. 6.2.1 Items Define the relations between item numbers/identifiers and their item names. Item names are used as an alias for item numbers to make items easier to recognize and filter out. 6.2.1.1 Edit items To edit an existing item number / name relation, click the edit icon in the Item list. Save stores the changes to the item name. 6.2.2 Item Groups Defines the grouping of items. Item groups can be used to control item access rights for user groups. 6.2.2.1 Add item groups To add a new item group, click the “New Item Group” on the “Item Groups page”. Fill in the fields on the page and click Save. Page 56 of 69 CPT - User Guide 6.2.2.2 Edit item groups To edit an existing item group, click the edit icon in the Item Group list. Save stores the changes to the item group. 6.3 Importer 6.3.1 Import Tasks By default, the SPC system supports TestStand XML format. Additional import readers can be implemented to support the specific customer needs and business models. In general, test data imports originates either from files like TestStand XML, CSV files etc., or from some different kinds of databases, like MySQL, MS Access, MS-SQL etc. Additional import read can be implemented for both new file formats and data stored in databases. Page 57 of 69 CPT - User Guide 6.3.1.1 Edit an existing import task To edit an existing data importer task, click the edit icon in the importer task list. “Save” stores the changes to the importer task. “Delete” deletes and disables the importer task permanently (all parameters will be lost) 6.3.1.2 Creating a new file import task To setup the necessary parameters for importing test data from a file, the button “New File Import Task” should be clicked. Page 58 of 69 CPT - User Guide All necessary parameters should be filled out before saving and enabling the new file importer task. Additional help for each parameter is displayed when moving the mouse pointer over the question mark to the right of each parameter field. Page 59 of 69 CPT - User Guide 6.3.1.3 Creating a new database import task To setup the necessary parameters for importing test data from a database, the button “New Database Import Task” should be clicked. All necessary parameters should be filled out before saving and enabling the new database importer task. Additional help for each parameter is displayed when moving the mouse pointer over the question mark to the right of each parameter field. Page 60 of 69 CPT - User Guide 6.3.1.4 Creating a new MS Access import task To setup the necessary parameters for importing test data from a Microsoft Access database, the button “New MS Access Import Task” should be clicked. All necessary parameters should be filled out before saving and enabling the new MS Access importer task. Additional help for each parameter is displayed when moving the mouse pointer over the question mark to the right of each parameter field. Page 61 of 69 CPT - User Guide 6.3.2 Import Task Monitor This screen is used to investigate the status and error log of the enabled data importers. It contains relevant information and performance indicators to provide an overview to the health of the data import into the system. The information in the screen is automatically updated every 10 seconds. 6.4 Scheduled Reports Scheduled reports are used to send out predefined reports at a specified time and with a specified frequency. Reports are sent out by e-mail to predefined receivers. The layout of the scheduled reports is chosen among the existing reports (Test Yield report and Test Step Error Pareto report). 6.4.1 Adding and Editing scheduled reports To edit an existing scheduled report, click the edit icon scheduled report, click “New Scheduled Report” in the scheduled report list. To add a new Page 62 of 69 CPT - User Guide “Save” stores the changes to the importer task. “Delete” deletes and disables the scheduled report permanently (all parameters will be lost). “Delete” is only available when editing an existing scheduled report. 6.4.1.1 Settings, Recipients and Recurrence General Settings: Enabled: Time of day: Name: Description: Used to enable or disable the scheduled report generation The time of day to send out the report Descriptive name of the report Further detailed description for the report Recipients: Users: E-mail addresses List of system users to receive the report Additional recipients of the report (unknown to the system) Recipients: Start date: The begin date for the scheduled reports Page 63 of 69 CPT - User Guide Pattern: See further descriptions below The “Daily” pattern is used if the report should be sent out on a daily basis (every day or every weekday) The “Weekly” pattern is used if the report should be sent out on certain days of the week. The “Monthly” pattern is used if the report should be sent out on certain days of the month. Page 64 of 69 CPT - User Guide 6.4.1.2 Report and Filter General Settings: Type: Run as user: Document type: The layout of the report to send out (Test Yield or Test Step Error Pareto) The user profile to be used when generating the scheduled reports Send out the report as PDF, Excel or both Filter: Set all parameters for the selected report type to obtain the required data in the scheduled reports. Please refer to the sections describing the reports (section 4.9 or section 4.11) Page 65 of 69 CPT - User Guide 7 Personal settings 7.1 Settings To edit personal settings select ‘User name’ to the right in the menu bar and click Settings. (In the example below, the user name is “Administrator”) Dashboard Settings: Days back in time: Minimum number of tests: Presentation Settings: Table page size: Number format: Account Settings: New password: Comfirm password: Number of days to look back in Dashboard reports The number of tests required to qualify for appearance on the dashboard Specifies the number of rows per page in reports presenting data in grids (tables). Specifies how numeric measurements are presented Used to set a new user password Used to set a new user password. Must be identical to “New password” Save button stores changes. 7.2 Sign out Sign out, and present the sign in page. Page 66 of 69 CPT - User Guide 8 Statistical calculations In the SPC report, a number of statistical values are calculated and used for presentation. This section shows the formulas used to calculate these values. The formulas are shown for reference only. Please refer to special articles and literature regarding the practical use and limitations of the calculated values. In the formulas below, USL and LSL denotes the upper specification limit and the lower specification limit. 8.1 Formulas 8.1.1 ̅) Mean value (𝑿 𝑖=𝑛 𝑀𝑒𝑎𝑛 = 𝑋̅ = 1 ∑ 𝑋𝑖 𝑛 𝑖=1 8.1.2 Standard deviation (σ) 𝑖=𝑛 1 𝜎=√ ∑(𝑋𝑖 − 𝑋̅)2 𝑛−1 𝑖=1 8.1.3 𝐶𝑝 = 8.1.4 Capability (Cp) 𝑈𝑆𝐿 − 𝐿𝑆𝐿 6𝜎 Capability Index (Cpk) 𝐶𝑝𝑘 𝑈𝑆𝐿 = 𝑈𝑆𝐿 − 𝑋̅ 3𝜎 𝐶𝑝𝑘 𝐿𝑆𝐿 = 𝑋̅ − 𝐿𝑆𝐿 3𝜎 𝐶𝑝𝑘 = 𝑀𝑖𝑛[ (𝑈𝑆𝐿 − 𝑋̅), (𝑋̅ − 𝐿𝑆𝐿) ] = 𝑀𝑖𝑛[ (𝐶𝑝𝑘 𝑈𝑆𝐿), (𝐶𝑝𝑘 𝐿𝑆𝐿) ] 3𝜎 Page 67 of 69 CPT - User Guide 8.2 Special value handling In order to avoid misleading values for any of the capability values (Cp, Cpk, Cpk USL and Cpk LSL) in case of special circumstances in the test data, a special “error value” is used. In case any of the mentioned capability values are less than -999.999 or greater than 999.999, the resulting value will be set to -999.999 or 999.999 respectively. Page 68 of 69 CPT - User Guide 9 Revision History Revision 0.1 1.0 1.1 1.2 1.3 Date 2013-04-29 2013-05-01 2013-05-23 2013-12-17 2014-05-11 Initials LDI LDI, RD PCL RD PCL Description First version Review Dashboard minimum number of tests Updated screen shots and filter options availability (most pages) Removed obsolete Test completion filter and added Test categories filter. Page 69 of 69