1
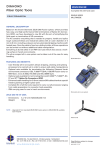
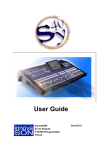
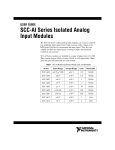
SENSOFT USER MANUAL
v 1.3.16 MF
January 2007
SENSOPTIC S.A. • 6616 LOSONE • SWITZERLAND • WWW.SENSOPTIC.CH • [email protected]
1.
Introduction
SENSOFT is a data acquisition and data visualisation software specially designed for PROFILE
SENSORS. The software, in combination with the data acquisition system hardware SENSYSTEM
provides a powerful tool for continuous monitoring and quality control of surface defects and
diameter irregularities during the manufacturing and processing of fine wires, filaments and fibers.
Even small defects running at high line speeds can be detected and characterised in real time with
high accuracy. SENSOFT, which is programmed in LABVIEW (National Instruments) allows
automatic and continuous data saving of multiple lines in a user-friendly way using a single
personal computer.
2.
Program Operation
This section describes how to operate the program and how to acquire, visualise and save the
data. To run the SENSOFT, double click on it's icon on the Windows desktop, on the Start/Sensoft
Windows menu, or directly on the folder where it is located ( ../My Documents/Sensoft/
Sensoft_1.3/Sensoft_1.3.exe by default).
Run
Stop the program / Close the window
Configuration tabs
Start/Stop the measurement
Sensor Icons
Contextual help window
Figure 2.1: SENSOFT main window
2
SENSOPTIC S.A. • 6616 LOSONE • SWITZERLAND • WWW.SENSOPTIC.CH • [email protected]
2.1. Main window
To stop the program, the top red right X button of the SENSOFT window is used. After stopping
the program, the main window remains opened, but the upper Arrow (see figure 2.1.1) on the left
turns white. When the SENSOFT is stopped, the time indicator is not updated any more. By
clicking on the Arrow button (Run) the SENSOFT is started again.
When the SENSOFT is opened, all the control values and configuration parameters (see section 3)
are set to their default value. If any control value or configuration parameter is modified, the
changes will be lost when exiting the SENSOFT.
“Save“ mode: automatic data saving
“Do not save“ mode: no data saving (see Section 2.3)
Time display
Line speed
Filament length to be measured.
Continuous visualisation of the length of
the measured filament from start [m]
Start/Stop measurement
Each sensor head has its own alarm icon.
When a defect is larger than any of the
threshold values, the green icon turns red
and the corresponding data is stored
automatically in a file. (see Section 2.3).
The icon can be clicked to open a
window with signals visualisation.
Figure 2.1.1: View of the SENSOFT main window display
Parameter/Value
Function/description
default setting
Nominal diameter:
Nominal diameter of the filament
40 µm
Lump Threshold:
If the LU signal exceeds this threshold value, the fault is recorded
4 µm
NeckDown
Threshold::
If the NE signal exceeds this threshold value, the fault is recorded
(the NeckDown is disabled)
4 µm
AC sigma
threshold:
If the AC signal standard deviation exceeds this threshold value, the
fault is recorded
1 µm
Speed
Speed of the filament. This value is used to calculate the filament
position
100 m/min
Length
Filament length to be measured. After measuring the defined length,
the measurement stops automatically. For a continuous measurement
the value is set to 0
0m
Pos.
Indicator of the number of meters of filament measured since the
beginning of the measurement
3
SENSOPTIC S.A. • 6616 LOSONE • SWITZERLAND • WWW.SENSOPTIC.CH • [email protected]
The following parameters must be entered in the “Main” tab of the main window: the nominal
filament diameter, the detection threshold levels of the lumps and of the neckdowns, the threshold
value of the standard deviation of the AC-signal, the line speed and the desired filament length to
be measured. These parameters are the same for all the sensors heads.
To start the measurement, click the “Start” green button. The text of the button will change to
“Stop”. To stop the measurement click the same button. When the SENSOFT is in measuring
mode (see figure 2.2.1), the configuration tabs are not shown any more and the controls values
(diameter, thresholds, speed and length) cannot be changed. To change any parameter the
measurement must first be stopped, then the changes applied and thereafter the measurement
restarted.
It is possible to open a contextual help window (see figure 2.1) to have explanations about the
main SENSOFT controls. The contextual help window can be opened in the Help menu or by
clicking simultaneously Ctrl-H keys. Once opened, by pointing with the mouse icon the desired
control, the corresponding explanation is displayed in the help window.
While the SENSYSTEM is measuring, the icon corresponding to each sensor head (the number of
icons depends on the defined hardware configuration) can have different colours corresponding to
its status:
No signal detected. Failure
No filament. (filament detection is inactive by default, see chapter 3.4)
Filament OK
Fault exceeding the defined threshold values
Filament OK. Sensor is dirty, CLEANING REQUIRED
Fault exceeding the defined threshold values. Sensor is dirty, CLEANING REQUIRED
Figure 2.1.2: Different colours of the sensor head icons.
In normal operating conditions the icons should be light-green. If the icons remain red too long
(more than several seconds), the defined threshold levels are too low for the filament being
measured. If the colour is dark-green or dark-red, the measuring head should be cleaned
following the sensor instructions manual.
A black icon means that no signal is detected, indicating failure: erroneous hardware
configuration, sensor not power supplied or broken sensor.
A white icon means that no filament is detected, either because it is out of the measuring range,
or because it is not moving at all.
By clicking an icon, the corresponding sensor head signals are graphically visualised (see next
section)
4
SENSOPTIC S.A. • 6616 LOSONE • SWITZERLAND • WWW.SENSOPTIC.CH • [email protected]
2.2.
Signals visualisation
By clicking a sensor head icon, two windows are opened and the corresponding sensor signals are
visualised: the “Chart window” and the “Histogram window”. Even if several sensors can be
operated simultaneously by the SENSOFT, only the signals of one single sensor head (with one or
two axes) can be visualised simultaneously.
•
“Chart window”. This window shows three charts. The first one with the DC signal.
Depending on the sensor, one ore two axes are shown, DC_X in blue and DC_Y in red.
The second chart corresponds to the AC signal. The AC_X signal is blue and the AC_Y
signal is red. The third chart contains the Lump (LU) signal displayed in blue and the
NeckDown signal (NE) displayed in pink. The horizontal scales of the charts (in meters)
can be changed using the “Length” control. The vertical scales of the charts can be
displayed in µm as well as in volts. The scale limits of the charts vertical axes can be
manually changed by clicking on them with the mouse and introducing the new values
with the keyboard.
By clicking on the “Print” button the charts and the indicators values are saved in a “.jpg”
file which is automatically opened on the computer's browser. Every time that the “Print”
button is clicked, a new browser window is opened. Therefore it is recommended to close
each time the browser window in order to avoid having too many browser windows
opened simultaneously (which consume PC memory and resources). The charts windows
can be closed by clicking on the red OK button.
Main window
Change charts X
scale length
Change charts Y
scales units
Save “.jpg” and
open in browser
Close graph
windows
Chart window
Histogram
window
Figure 2.2.1: Sensor DC, AC, Lump, Neckdown signals and AC Histogram graphics windows
5
SENSOPTIC S.A. • 6616 LOSONE • SWITZERLAND • WWW.SENSOPTIC.CH • [email protected]
•
“Histogram window”. This window shows the histograms of the AC signals. This window
appears on the screen only after the measurement of the defined “Histogram Length” (see
section 3.2) has been completed. The histograms will be updated continuously at this
“Histogram Length” period.
The “Printed” chart files are recorded in the “Data/YYYY_MM_DD/Print” folder (see figure 2.3.2),
where YYYY_MM_DD is the date of the measurement (Year, Month and Day).
When measuring a new type of filament, it is recommended to run first a test measurement
(without saving any file; see the following section) to find the best configuration parameters. The
configuration parameters of the hardware and the data acquisition are explained in the next
sections (3.1 to 3.3). After choosing the optimal parameters (thresholds levels, histogram limits
and AC high-pass filter period), the measurement can be restarted in the “Save Mode”.
Wire Ø: 210 µm
Horizontal scale length: 1 m
Wire speed: 1200 m/min
AC-Signal: Diameter variations of +/- 5 µm (X and
Y axes)
LU-Signal (blue): Mean level: 13 µm approx.
NE-Signal (pink): Mean level: 16 µm approx.
AC-Histogram: X axis (blue) and Y axis(red). Light
colour histograms correspond to the last 120m and
dark colour histograms correspond to the histogram
from the start of the measurement (average).
Standard deviation of AC signal: 2.6 µm (mean
value of the last 120 m and for the whole
measurement)
Figure 2.2.2: “Print” format of charts and histograms.
6
SENSOPTIC S.A. • 6616 LOSONE • SWITZERLAND • WWW.SENSOPTIC.CH • [email protected]
2.3.
Data Saving
“SAVE MODE“:
Measuring data is saved continuously in
a set of “.dat” files
“NO SAVE MODE“
Data measurements are not recorded,
but signals can be visualised
Figure 2.3.1: “SAVE MODE” and “NO SAVE MODE”
Figure 2.3.2: Saved data files in “SAVE MODE”
7
SENSOPTIC S.A. • 6616 LOSONE • SWITZERLAND • WWW.SENSOPTIC.CH • [email protected]
When measuring in “SAVE MODE”, the measurements are recorded on a set of text (ASCII) files
“.dat”. These files can be opened and edited with any text editor and charts can be created with
spreadsheet programs such as Excel or OpenOffice.
The files are recorded in the “Data” folder, and in a sub-folder named with the date of the
measurement start following the format YYYY_MM_DD (Year, Month and Date) as shown in figure
2.3.2. All the file names start with HH_MM_ (Hour and Minute of the measurement's beginning),
and finish with the extension “.dat”.
The “Data” folder is by default located in the SENSOFT folder, but a different location (i.e. A
network drive) can be defined in the Histo & Save configuration tab (see section 3.2).
There are four different types of files: the fault data, the mean data, the histogram data and the
report.
a) Fault data files: HH_MM_NXX_Sensor_Name.dat
One file is created for each active sensor head. XX corresponds to the number of the active sensor
head (starting at 01 and up to the number of the active heads). Sensor_Name corresponds to the
identification name given to the sensor head in the Configuration Window (see section 3.1.1).
In this file, all the Lump, Neckdown and AC sigma (standard deviation) faults exceeding the
defined threshold levels are recorded. For each fault, the time, the position (calculated with the
time and the given speed) as well as its size are saved in one line of the file. When a filament
break is detected, it is recorded in this file too.
Nominal Diameter [µm]:
Lump Threshold [µm]:
Neckdown Threshold [µm]:
AC sigma Threshold [µm]:
Start:
Time
15:49:14.48
15:49:19.20
15:49:37.41
15:49:50.27
15:50:09.28
15:50:21.32
15:51:34.58
15:52:20.76
...
17:09:42.06
Length:
Stop Measurement:
* End Data *
100
3
3
0.4
15:49:13
Pos[m]
3.7
11.6
41.9
63.4
95.0
115.1
237.2
314.1
Lump [µm]
4.1
5.1
3.5
6.5
3.5
3.1
3.4
4.1
NeckDown [µm]
0
0
0
0
0
0
0
0
AC sigma [µm]
0
0
0
0
0
0
0
0
3.3
0
0
8049.6
8073.3
17:09:56
Figure 2.3.3: Example of a typical fault data file.
8
SENSOPTIC S.A. • 6616 LOSONE • SWITZERLAND • WWW.SENSOPTIC.CH • [email protected]
b) Mean data file. HH_MM_MEAN.dat
The mean data file records the average values of the DC, Lump (LU) and NeckDown (NE) signals
for each active sensor head for the defined period in the “DC averaging length” configuration
parameter (see Section 3.1). The DC signal is recorded for one or two axes depending on the type
of configured sensor heads. The data is only recorded when measuring in the “Save Mode”.
Nominal Diameter [µm]:
Lump Threshold [µm]:
Neckdown Threshold [µm]:
AC sigma Threshold [µm]:
Start:
100
3
3
0.4
15:49:13
Time
15:49:18.24
15:49:24.24
15:49:30.24
15:49:36.24
15:49:42.24
...
17:09:54.24
Length:
Stop Measurement:
* End Data *
PSD 3 139 W (PSD_3_139_W)
Pos [m] DC X [µm] DC Y [µm]
LU [µm]
10
99.95
100.01
1.68
20
99.92
100.01
1.16
30
99.92
99.99
1.14
40
99.93
100.03
1.18
50
100.07
100.13
1.53
8070
8073.33
17:09:56
99.79
99.76
1.23
PSD 3 143 W (PSD_3_143_W)
NE [µm] DC X [µm] DC Y [µm]
LU [µm]
1.35
99.99
100.00
1.40
1.36
100.02
99.96
1.23
1.32
100.02
99.97
1.14
1.34
99.98
100.00
1.21
1.50
100.01
100.14
1.46
1.51
99.90
99.83
NE [µm]
1.38
1.35
1.40
1.37
1.52
1.18
1.55
Figure 2.3.4: Typical mean data File
c) Histogram data file: HH_MM_HISTO.dat
The histogram data file records the mean value, the standard deviation and the variation of the
AC signal for each axis and each active sensor head for the defined period in the “Histogram
length” configuration parameter (see Section 4.2). The data is only recorded when measuring in
the “Save Mode” and when the “Save Histogram Data” configuration switch is enabled.
Nominal Diameter [µm]:
Lump Threshold [µm]:
Neckdown Threshold [µm]:
AC sigma Threshold [µm]:
80
6
6
0.9
Start:
10:47:51
Time
10:47:56.22
10:48:02.22
10:48:08.22
10:48:14.22
10:48:20.22
Length:
Stop Measurement:
Pos [m]
100
200
300
400
500
583.33
10:48:25
# points
6000
6000
6000
6000
6000
PSD 2 045 (PSD_2_045_W)
Mean Std. dev. Variation
-0.03
0.76
0.57
0.12
0.79
0.62
0.02
0.81
0.66
-0.13
0.82
0.67
0.07
0.81
0.66
Mean Std. dev. Variation
-0.02
0.72
0.52
0.11
0.79
0.63
0.01
0.76
0.58
-0.07
0.75
0.56
-0.01
0.78
0.61
Figure 2.3.5: Typical histo data File
9
SENSOPTIC S.A. • 6616 LOSONE • SWITZERLAND • WWW.SENSOPTIC.CH • [email protected]
d) Report data file: HH_MM_Report.dat
When the measurement is stopped, the number of Lumps, Neckdowns and standard deviation
faults (AC sigma) as well as the “AC Standard Deviation” mean value (sigma mean) of the whole
measurement are reported in this file for each active sensor head.
Date:
23.05.2006
Diameter [µm]:
Speed [m/min]:
Length [m]:
360
100
7348.3
Lump threshold [µm]:
Neckdown threshold [m/min]:
AC sigma threshold [µm]:
AC histogram length [m]:
PSD_2_037_W
PSD_3_134_W
Length:
Stop Measurement:
* End Data *
09:09:26
4
4
0.5
20
# Lumps
1204
50
7348.33
# Ndowns
1
4
# AC sigma
63
10
sigma mean [µm]
0.45
0.35
09:09:26
Figure 2.3.6: Typical report data file with two PSD dual axes sensors
3.
Configuration tabs
When not operating in the measuring mode, apart from the “Main” tab already described in the
section 2 there are three other tabs: “Data Acq”, “Histo & Save” and “Filter Config”. These tabs
allows the modification of the hardware configuration and the adjustment of several parameters in
order to optimize the acquisition to fulfil the user requirements.
3.1.
Data acquisition tab: “Data Acq“
In the “Data Acq.” tab, the data acquisition parameters are specified. When clicking the
“CONFIG” button, a new window opens, which allows to configure the connected sensors (see
next section).
In most of the cases, the grey controls in the “Data Acq.” tab as well as in all the other tabs, do
not need to be changed. The default values will work correctly for 90% of the applications. The
white indicated controls need to be adapted to the diameter and type of filament, to its speed and
to the amount of data that wants to be recorded.
10
SENSOPTIC S.A. • 6616 LOSONE • SWITZERLAND • WWW.SENSOPTIC.CH • [email protected]
Figure 3.1.1: Tab “Data Acq.“ for the specifications of the data acquisition parameters.
Parameter/Value
Function/description
default setting
Scan rate:
Number of the scans per second acquired for each sensor signal. For
high line speeds, the Profile Sensor electronics supply a LU&NE signal
so that higher scan rates are not necessary
1000 scans/sec
Scans to read:
Number of scans to be read at each loop iteration
1000 at a time
Buffer size:
size of the internal acquisition buffer
2000 scans
DIO DAQmx
Device:
Digital input and output DAQ device
Dev1
DC averaging
length:
Period (in meters of measured filament) at which the DC, LU & NE
signals are averaged and saved on the mean data file
10 m
“Dirt” threshold:
Threshold value for the cleaning display alarm function. 80% means
that the total transmitted light (DC-signal) drops by 20% due to the
presence of dirt
80 %
DAQ devices:
Number of used DAQ devices
1
AC A/D:
Setting of the fast AC-Signal. The “analog” AC-Signal is available only
in certain sensors. In the standard version, the “digital” AC-Signal is
obtained by numerical filtering (see Section 3.3)
Digital
11
SENSOPTIC S.A. • 6616 LOSONE • SWITZERLAND • WWW.SENSOPTIC.CH • [email protected]
3.1.1.“Set Config Box“ window: hardware configuration
The “Set Config Box” window serves to configure the connections between the SENSYSTEM and
the sensors.
Sensor identification
Type of
Sensor
Active sensor control:
Light-green=active
Dark-green=not active
Sensor calibration file
Figure 3.1.1.1: Window “Set Config Box”. Data acquisition and sensors hardware configuration.
Parameter/Value
Function/description
default setting
Box No.
Number of the Data Acquisition box. If there are more than a single
Data Acquisition box defined (see previous section), the Config window
will open one time for each box. Box No. will show the number of the
box being configured
1
DAQ connection
box
Type and configuration of the used Data Acquisition box
Config_Sensystem_
K7_box.ini
DAQmx Device
Name
Name of the Data Acquisition device connected to the box. Installed
devices should be selectable.
The available Data Acquisition devices can be controlled and tested
with the National Instruments MAX (Measurement & Automation
Explorer) software installed with the SENSOFT
Dev1
Input terminal
configuration
Type of terminal Data Acquisition configuration
NRSE: Nonreferenced single
ended
Minimum value
Minimum Data Acquisition voltage value
-10 v
Maximum value
Maximum Data Acquisition voltage value
10 v
12
SENSOPTIC S.A. • 6616 LOSONE • SWITZERLAND • WWW.SENSOPTIC.CH • [email protected]
3.2.
Histogram and Save tab: “Histo & Save“
The standard deviation of the AC-signal is a characteristic measure of the surface quality of the
observed filament. It is visualized in the form of two histograms: one for the overall measured
filament length and one for a specified periodic length, for example, all the last 100 m. This is
useful to monitor on-line changes in the production quality.
Figure 3.2.1: “Histo & Save“ tab. Histogram of AC signal configuration.
Parameter/Value
Function/description
default setting
Histogram length:
Period (in meters of measured filament) at which the histogram is
calculated and saved in the histogram data file.
10 m
Hist. # of bins:
Number of bins of the histogram, between the defined minimum and
maximum values.
100 bins
Histogram max.
value
Maximum value of the histogram. It is important to set the maximum
and minimum values of the histogram correctly according to the type
of measured filament. If the max. and min. are set too small and the
AC signal exceeds these limits, the standard deviation calculations will
be erroneous. On the other hand if the limits are set too high, the
histogram shape will appear very narrow in the graph with a poor
resolution.
5 µm
Histogram min.
value
Minimum value of the histogram
-5 µm
Save Histogram
data
Allows to save or not to save the histogram calculated data for the
defined filament length (histogram length). Histogram data will only be
saved in the Save mode; see chapter 2.3.
Save
Data Save Path
By default the data files are saved in the “Data” folder inside the
SENSOFT program folder. A different folder can be interactively
selected by clicking on the Data Save Path Icon
New file every
By default (on “Save Mode”) one set of files is created, until the end of
the measurement. If a value different of 0 is set, every X (as defined)
minutes, a new set of files will be created. (See section 2.3 for more
details about saving and files)
0 min
13
SENSOPTIC S.A. • 6616 LOSONE • SWITZERLAND • WWW.SENSOPTIC.CH • [email protected]
3.3.
Tab “Filter Config.“: configuration of the digital filter function
The properties of the high-pass filter of the AC-signal are defined in the tab “Filter Config.”.
When the AC A/D switch of the Data Acq. tab is set to “Analog” (see section 3.1), the digital filter
configuration parameters are not used. In this case the sensor AC signal filter characteristics are
fixed and given by the sensor electronics (refer to the sensor technical manual).
Figure 3.3.1: “Filter config” tab. Configuration of the AC high-pass filter parameters.
Parameter/Value
Function/description
default setting
Filter Topology:
Type of filter
Butterworth
Lower Pc period:
Low cut period. Diameter variations over the defined period, will be
filtered and will thus not be reflected on the AC signal. This value
should be set according to the filament characteristics. If the value is
set too low there is the risk to miss slow diameter variations with
period over the defined one. If the value is set too high, the AC could
take a long time before returning to 0 if there is a step shaped signal
(can be caused by a very big fault or by the filament going out of the
measuring range)
50 m
PB Ripple:
Bandpass Ripple in dB
1 dB
Order:
Order of the AC filter
2
Attenuation:
Filter attenuation
60 dB
14
SENSOPTIC S.A. • 6616 LOSONE • SWITZERLAND • WWW.SENSOPTIC.CH • [email protected]
3.4.
Tab “Advanced“
For most of the applications, the parameters of this tab does not need to be changed. The
configuration controls of this tab allow the user to modify: the RTSI synchronisation (when more
than a single acquisition system are used), the LU and NE detection trigger parameters, and the
filament break detection parameters.
Figure 3.4.1: “Filter config” tab. Configuration of the AC high-pass filter parameters.
Parameter/Value
Function/description
default setting
RTSI Clock Synchro:
When more than one data acquisition device are used, by selecting
the RTSI clock Synchro=true, one single clock source can be set. The
hardware devices must be RTSI capable and have an RTSI cable
connected between them in order to allow time synchronisation. USB
devices cannot be synchronised via RTSI
False
LU, NE release
trigger level:
When a LU (or NE) is detected, the LU (or NE) signal must decrease of
at least this value in order to “rearm” the trigger and seek a new LU
(or NE)
0.5 µm
Noise level:
After than the LU (or NE) has been “rearmed”, the LU (or NE) signal
must increase of at least the “noise level” (from one point to the next
one) in order to register a new LU (or NE). When this value is set to a
value too low, and depending of the signal noise it could happen that
when there is a single lump, several are detected
0.01 v
15
SENSOPTIC S.A. • 6616 LOSONE • SWITZERLAND • WWW.SENSOPTIC.CH • [email protected]
Parameter/Value
Function/description
default setting
Break detection
mode:
Several different criteria can be used to detect the filament break.
1. Off: no active detection of the filament break
2. Neckdown. A single neckdown greater than 80% of the
filament diameter or that makes the neckdown signal go in
saturation are interpreted as a filament break
3. Lump. If the LU signal mean value and the LU signal
standard deviation values (calculated in the defined
averaging time) are under the defined thresholds, this will be
interpreted as a filament break
4. AC. An AC signal standard deviation value (calculated in the
defined averaging time) under the defined threshold is
interpreted as a filament break
Notes:
A filament break cannot be distinguished from a filament stop.
For most of the applications the default parameters should allow a
reliable filament break detection. For extremely thin filaments and
depending on the sensors sensitivity, the break detection based on the
Lump and AC signal levels could lead to false break detection
indications. In this case it would be better to use the NE signal if
available
Off
Break average time:
Averaging time of the Lump and AC break detection
1 sec
Break avg.
threshold:
Signal mean value threshold of the Lump and AC break detection
0.5 v
Std. dev. threshold:
Signal standard deviation threshold of the Lump break detection
0.014 v
16
SENSOPTIC S.A. • 6616 LOSONE • SWITZERLAND • WWW.SENSOPTIC.CH • [email protected]