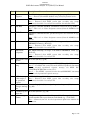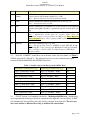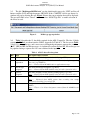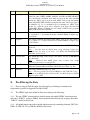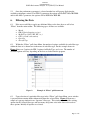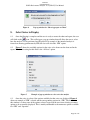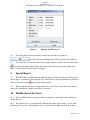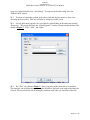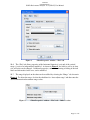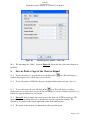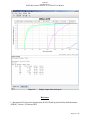
1
FIT-Asia/2−IP/08
28 – 29 March 2013
International Civil Aviation Organization
The 2nd Meeting of the Future Air Navigation Systems Interoperability
Team-Asia (FIT-Asia/2)
Bangkok, Thailand, 28 – 29 March 2013
Agenda Item 4: Data Link Guidance Material
FAA DEVELOPED GOLD PERFORMANCE ANALYSIS TOOL (GPAT) VERSION 3.0
(Presented by Airways New Zealand)
SUMMARY
This paper presents information on the latest update to the GOLD Performance Analysis
Tool (G-PAT) that can be used for the analysis of data collected in accordance with GOLD
guidelines for post-implementation monitoring. This tool has been developed by the
United States Federal Aviation Administration to aid ANSPs in post-implementation
monitoring.
This paper relates to –
Strategic Objectives:
A: Safety – Enhance global civil aviation safety
Global Plan Initiatives:
GPI-17 Data link applications
GPI-22 Communication infrastructure
1.
INTRODUCTION
1.1
The United States FAA has developed software to aid ATSP in the task of post
implementation monitoring. Version 3 of this software with its associated guidance material is now
available.
2.
DISCUSSION
2.1
The G-PAT tool has been developed by the FAA to help users perform graphical analysis
to assess the performance of the data link system in their airspace with respect to the RCP/RSP
specifications.
2.2
The tool is written in java script and can be run on MS Windows based personal
computers to analyse data that has been captured in .csv format as prescribed in GOLD Appendix D.
2.3
Version 3 of the G-PAT software is now available to ATSP on the ICAO GOLD secure
website. G-PAT Version 3 guidance material is appended to this paper at Attachment 1.
FIT-Asia/2−IP/08
ACTION BY THE MEETING
3.1
The meeting is invited to:
a)
note the information contained in this paper; and
b)
discuss any relevant matters as appropriate.
……………
Attachment 1:
GOLD Performance Analysis Tool (G-PAT) User Manual (Version 3.0) dated March 2013
2
FIT/Asia/2
IP/08 Attachment 1
User Manual
Version 3.0
March 2013
US Federal Aviation Administration Technical Center
Atlantic City, New Jersey
FIT/Asia/2
IP/08 Attachment 1
GOLD Performance Analysis Tool (G-PAT) User Manual
1.
Introduction
1.1.
The purpose of the GOLD Performance Analysis Tool (G-PAT) is to perform the
analysis prescribed in Appendix D of the Global Operational Data Link Document (GOLD) for
monitoring performance of the operational data link system in a given airspace.
1.2.
The G-PAT creates performance charts illustrating the cumulative distribution for both
the CPDLC and ADS-C performance measures in the format suggested in Appendix D of the
GOLD. The performance related to CPDLC messages is measured against the Required
Communication Performance (RCP) specifications and the latency for ADS-C reports is
measured against the Required Surveillance Performance (RSP) specifications described in the
GOLD.
1.3.
The G-PAT provides the ability to apply basic filtering to the input data such as removing
messages from specific ground stations, communication media, operators, etc. In addition GPAT allows the data to be plotted from various perspectives, such as performance shown by
flight information region (FIR), operator, aircraft type, etc.
1.4.
This manual provides the format required for the CPDLC and ADS-C input files and
details how to use the various features.
2.
Input Files
2.1.
The input files containing the CPDLC and ADS-C operational data should be in the
comma separated values (CSV) format specified in Appendix D of the GOLD. The files should
contain all of the fields prescribed in the GOLD as well as an additional field appended to the
end of each record specifying the media type. If the media type field is not included in the file,
G-PAT will automatically detect this and refer to a separate file to populate this field based on
the remote ground stations (RGS) listed for each record. This is explained further in section 2.4.
2.2.
Table 1 describes the 20 fields required for the input data files containing the CPDLC
data link transactions. The first 19 fields contained in Table 1 are from the GOLD, Appendix D,
Table D-1.
Ref Label
Table 1. CPDLC data collection points
Description and/or remarks
1
ANSP
The four letter ICAO designator of the facility (e.g. NZZO).
2
Aircraft
registration
(FANS 1/A)
The aircraft registration in ICAO Doc 4444 Format (no hyphens, packing
dots, etc.) (e.g. N104UA).
Note.— Extracted from ACARS header or application message.
2
Aircraft address
(ATNB1)
The 24 bit address in ICAO Doc4444 Format (alphanumerical character, in
six hexadecimals)
Note.— Extracted from CM application message.
3
Aircraft type
designator
The ICAO aircraft type designator (e.g. B744).
Note.— Extracted from ANSP database using aircraft registration as key.
Page 2 of 15
FIT/Asia/2
IP/08 Attachment 1
GOLD Performance Analysis Tool (G-PAT) User Manual
Ref Label
Description and/or remarks
4
Operator
designator
The ICAO designator for the aircraft operating agency (e.g. UAL).
Note.— Extracted from ANSP database using aircraft registration as key.
5
Date
In YYYYMMDD format (e.g. 20081114).
Note.— Extracted from ANSP system data recording time stamp,
synchronized to within 1 second of Universal Time Coordinated (UTC).
6
MAS RGS
Designator of the RGS that MAS downlink was received from (e.g. POR1).
Note.— This is a 3 or 4 letter designator extracted from the ACARS header
DT line.
7
OPS RGS
Designator of the RGS that the operational response was received from (e.g.
AKL1).
Note.— This is a 3 or 4 letter designator extracted from the ACARS header
DT line.
8
Uplink time
The timestamp on the uplink CPDLC message sent by the ANSP in
HH:MM:SS format (e.g. 03:43:25).
Note.— Extracted from ANSP system data recording time stamp,
synchronized to within 1 second of UTC.
9
MAS/LACK
receipt time
The ANSP timestamp on receipt of the MAS in HH:MM:SS format (e.g.
03:43:35).
Note.— Extracted from ANSP system data recording time stamp,
synchronized to within 1 second of UTC.
10
MAS/LACK round In seconds (#9-#8) (e.g. 10).
trip time
11
Aircraft FMS time
stamp
In the operational response messages in HH:MM:SS (e.g. 03:44:15).
Note 1.— For FANS 1/A, extracted from the ATCmessageHeader timestamp
in the decoded operational response message. See RTCA DO258AEUROCAE ED-100A section 4.6.3.3.
Note 2. — For ATN B1, extracted from the AircraftCPDLCPDU, timestamp
in the decoded operational response message.
12
ANSP timestamp
on the receipt of
the operational
response
In HH:MM:SS (e.g. 03:44:45).
Note.— Extracted from ANSP system data recording time stamp,
synchronized to within 1 second of UTC.
13
Operational
From sending uplink (#8) to receipt of operational response (#12) in seconds
message round trip (e.g. 80).
time
14
Downlink response In seconds (#12-#11) (e.g. 30).
transit time
15
Uplink message
elements
All uplink message element identifier preceded by U encapsulated between
quotation marks with a space between each element (e.g. “U118 U80”)
Note.— Extracted from the decoded operational uplink that initiated the
transaction.
Page 3 of 15
FIT/Asia/2
IP/08 Attachment 1
GOLD Performance Analysis Tool (G-PAT) User Manual
Ref Label
Description and/or remarks
16
Downlink message All downlink message elements encapsulated between quotation marks with
elements
a space between each element if required (e.g. “D0”)
Note.— Extracted from the decoded operational downlink.
17
ACTP
Actual communication technical performance in seconds (e.g. 35).
Note.— Truncated to whole seconds.
18
ACP
Actual communications performance in seconds measured as the difference
between time uplink sent (#8) to operational response received (#12) (e.g.
80).
19
PORT
Pilot Operational Response Time = ACP (#18) - ACTP(#17) (e.g. 45).
Note.— Implementers should allow for negative values where the
operational response is received before the MAS as per Error! Reference
source not found. above. When graphing PORT negative values should be
counted as 0.
20
COMTYP
Data link communication type, e.g. SAT
Note.— The nine possible entries for COMTYP are SAT, VHF, HF, SV, SH,
VS, VH, HS, HV. Value is based on the MAS RGS field (#6) and OPS RGS
(#7). See Table 2. Satellite (SAT), Very High Frequency (VHF), High
Frequency (HF)
2.3.
Field 20, “COMTYP” should have one of the nine values listed in column 3 of Table 2
(GOLD, Appendix D, Table D-2). This information is based on the communication types
associated with the MAS RGS and OPS RGS data fields.
Table 2. Possible values for media type in the CPDLC Data
MAS RGS Communication Type
OPS RGS Communication Type
COMTYP
SAT (e.g. MAS RGS = POR1)
SAT (e.g. OPS RGS = POR1)
SAT
VHF (e.g. MAS RGS = ADK)
VHF (e.g. OPS RGS = ADK)
VHF
HF (e.g. MAS RGS = H02)
HF (e.g. OPS RGS = H02)
HF
SAT (e.g. MAS RGS = POR1)
VHF (e.g. OPS RGS = ADK)
SV
SAT (e.g. MAS RGS = POR1)
HF (e.g. OPS RGS = H02)
SH
VHF (e.g. MAS RGS = ADK)
SAT (e.g. OPS RGS = POR1)
VS
VHF (e.g. MAS RGS = ADK)
HF (e.g. OPS RGS = H02)
VH
HF (e.g. MAS RGS = H02)
VHF (e.g. OPS RGS = ADK)
HV
HF (e.g. MAS RGS = H02)
SAT (e.g. OPS RGS = POR1)
HS
2.4.
G-PAT Version 3 is distributed with the file, “Mediatypes2012FAA.txt,” which can be
used to populate the media type field if not contained in the input file. As noted above, G-PAT
will automatically detect whether or not this field is contained in the input file. The user may
also create and use a different file as long as it follows the same format.
Page 4 of 15
FIT/Asia/2
IP/08 Attachment 1
GOLD Performance Analysis Tool (G-PAT) User Manual
2.5.
The file “Mediatypes2012FAA.txt” sets the default media type to be “VHF” and lists all
known satellite (SAT) and high frequency (HF) RGS. If the “COMTYP” field is not detected, a
window will pop up alerting the user. Figure 1 shows the pop-up window that will be displayed.
The user will either select “Cancel” to abort or select “Media Type File” to enable selection of
the file to be used.
Figure 1.
Media type pop-up window
2.6.
Table 3 describes the 13 data fields required for the ADS-C input file. The first 12 fields
contained in Table 3 are taken from the GOLD, Appendix D, Table D-3. The last row in Table
3, field 13, is the media type, and is necessary to distinguish performance amongst the satellite
(SAT), VHF and HF data link messages. As explained in sections 2.4 and 2.5, the media type can
be populated using a separate file if it is not contained in the input file.
Ref Label
Table 3. ADS-C data collection points
Description and/or remarks
1
ANSP
The four letter ICAO designator for the facility (e.g. NZZO).
2
Aircraft
Registration
The aircraft registration in ICAO Doc 4444 Format (no hyphens, packing
dots, etc.) (e.g. N104UA).
Note.— Extracted from ACARS header or application message.
3
Aircraft Type
Designator
The ICAO aircraft type designator (e.g. B744).
Note.— Extracted from ANSP database using aircraft registration as key.
4
Operator
Designator
The IATA designator for the aircraft operating agency (e.g. UAL).
Note.— Extracted from ANSP database using aircraft registration as key.
5
Date
In YYYYMMDD format (e.g. 20081114).
Note.—
Extracted from ANSP system data recording time stamp,
synchronized to within 1 second of UTC.
6
RGS
Designator of the RGS that ADS-C downlink was received from (e.g.
POR1).
Note.— This is a 3 or 4 letter designator extracted from the ACARS header
DT line.
Page 5 of 15
FIT/Asia/2
IP/08 Attachment 1
GOLD Performance Analysis Tool (G-PAT) User Manual
Ref Label
Description and/or remarks
7
Report Type
The type of ADS-C report extracted from the ADS-C basic group report tag
where tag value 7=PER, 9=EMG, 10=LDE, 18=VRE, 19=ARE, 20=WCE.
As some aircraft concatenate more than one report in the same downlink
extract the ADS-C report tag from each ADS-C basic group and identify
them in the REP_TYPE column by using the first letter of the report type as
an identifier (e.g. for a concatenated report containing two ADS-C basic
groups for a periodic report and a waypoint event report the field will
contain PW). Where a downlink does not contain a ADS-C basic group the
REP_TYPE field will be left blank.
8
Latitude
The current latitude decoded from the ADS-C basic group. The format is
“+” for North or “-“ for South followed by a decimal number of degrees (e.g.
-33.456732).
9
Longitude
The current longitude decoded from the ADS-C basic group. The format is
“+” for East or “-“ for West followed by a decimal number of degrees (e.g.
+173.276554).
10
Aircraft Time
The time the ADS-C message was sent from the aircraft in HH:MM:SS (e.g.
03:44:15).
Note.— Decoded from the ADS-C basic group timestamp extracted as
seconds since the most recent hour. See RTCA DO-258A/EUROCAE
ED-100A, section 4.5.1.4.
11
Received Time
The ANSP timestamp on the receipt of the ADS-C message in HH:MM:SS
(e.g. 03:44:45).
Note.—
Extracted from ANSP system data recording time stamp,
synchronized to within 1 second of UTC.
12
Transit Time
The transit time of the ADS-C downlink in seconds calculated as the
difference between #10 Aircraft Time and #11 Received Time (e.g. 30).
13
COMTYP
Data link communication type, e.g. SAT
Note.— The three possible entries for COMTYP are SAT, VHF, HF. Value
is based on the RGS field (#6). Satellite (SAT), Very High Frequency (VHF),
High Frequency (HF)
3.
Pre-Filtering the Data
3.1.
Prior to using G-PAT, the input data will require pre-filtering to conform to the
requirements specified in Appendix D of the GOLD.
3.2.
The CPDLC input data should be filtered according to the following:
The raw CPDLC transaction data should contain only uplink CPDLC transactions that
end with a “WILCO” response (DM 0). Any transactions that end with any response other than
“WILCO” should be filtered out.
3.2.1.
All uplink transactions with an uplink initiation message containing elements UM 79-84,
UM91-92, UM 116-123, or UM169 should be filtered out.
3.2.2.
Page 6 of 15
FIT/Asia/2
IP/08 Attachment 1
GOLD Performance Analysis Tool (G-PAT) User Manual
All uplink transaction occurring during an outage as reported by one of the data link
service providers (DSP) should be removed.
3.2.3.
G-PAT will automatically filter out any records containing uplink transactions with a
negative ACP, ACTP or PORT. The records removed from the analysis by G-PAT will be
written to a file with a filename that is the same as the input file with the addition of “_R” to the
end.
3.2.4.
3.3.
The ADS-C input data should be filtered according to the following:
All ADS-C downlink messages occurring during an outage as reported by one of the data
link service providers (DSP) should be removed.
3.3.1.
G-PAT will automatically remove duplicate ADS-C messages and messages with a
negative estimate for latency. In addition G-PAT will remove any records with a media type that
is not recognized, e.g. “S”. The records removed from the analysis by G-PAT will be written to a
file with filename that is the same as the input file with the addition of “_R” to the end.
3.3.2.
4.
Loading the Data
4.1.
Before using the tool, the user should confirm that the files, “GPAT.bat” and
“GPATv3.jar” are both contained in the working directory. The user will double click on the
batch file “GPATv3.bat” to start the tool.
4.2.
To load the CPDLC or ADS-C input data, the user can either select File > Open from the
icon in the top right corner of the
pull-down menu of the main toolbar or click on the
application below the main toolbar. The user then selects the directory and file containing the
data to be analyzed. The input data must be in a comma separated format following the data
field structure described in Table 1 for CPDLC data or Table 3 for ADS-C data.
4.3.
If the data does not contain the required “COMTYP” field, G-PAT will display a
message alerting the user and requesting further action, as explained in sections 2.4 and 2.5.
4.4.
Once the data has been loaded, G-PAT automatically generates a generic GOLD chart for
the aggregate data and labels the tab “Figure 1.”
5.
Selecting the Performance Parameter and Criteria
5.1.
Once the data is loaded the user will click on “Chart” in the main toolbar. If the input
data is ADS-C there is only one option available (ADS-C), and all other options will be grayed
out.
5.2.
If the input data is CPDLC, the user will select the performance parameter of interest:
ACP, ACTP or PORT. Similarly, ADS-C will be grayed out.
Page 7 of 15
FIT/Asia/2
IP/08 Attachment 1
GOLD Performance Analysis Tool (G-PAT) User Manual
5.3.
Once the performance parameter is selected another box will pop up displaying the
available performance criteria. For CPDLC parameters the options will be RCP 240 or RCP400
and for the ADS-C parameter, the options will be RSP180 or RSP 400.
6.
Filtering the Data
6.1.
If the user would like to apply any additional filters to the data, the user will select
“Filters” from the main toolbar. The following types of filters are available:
Month
FIR (flight information region)
Media Type (SAT, VHF, HF, etc.)
GES ( ground earth station)
Operator
Aircraft Type
6.2.
Within the “Filters” pull-down Menu, the number of options available for each filter type
within the data set is shown next to the name of each filter type. For the example shown in
Figure 2 there are 5 options for FIR, 3 options for Media Type, and so on. The number of
available options will vary depending on the data set loaded into the program.
Figure 2.
Example of “Filters” pull-down menu
6.3.
Upon selection of a particular filter type in the “Filters” pull-down Menu, a new window
is presented that contains further information about the selected filter. Figure 3 illustrates a
sample of a pop-up window for an “Operator” filter type. This window lists all of the existing
options for the selected filter type and how many data points exist in the data set for each of
those options. Initially all options are selected.
Page 8 of 15
FIT/Asia/2
IP/08 Attachment 1
GOLD Performance Analysis Tool (G-PAT) User Manual
6.4.
In Figure 3, there are 3,467 data points for AAL, 30 data points for AAR, and so on. In
this example it can be observed that another filter type was previously applied that reduced the
number of available data points. Thus, for AAL only 3,375 out of 3,467 will be used in the
proceeding analysis if AAL is selected in this filter (with no additional filtering applied). Note: It
is possible that some options will be grayed out (completely unavailable) due to previous
filtering.
6.5.
By default, the filter pop-up window displays the options sorted by name in alphabetical
order. By selecting the “Sort by Count” button (located on the bottom right side of the window),
the options can be sorted in descending order by the number of data points associated with each
option. The “Select All” and “Deselect All” buttons provide the named functionality which is
available to aid in the selection of few or many of the available options. To return to the default,
press the “Sort by Name” button.
Figure 3.
7.
Example of options for “Operator” filter type
Additional Options
7.1.
In version 3, the only additional option available is to plot the aggregate performance for
the filtered data set. To show the aggregate performance on the chart, the user will select
Options > Show Aggregate on Chart from the main toolbar. Figure 4 shows the window that
will be displayed. The user will click the box and a check mark will appear, as shown in Figure
4.
7.2.
This option will remain selected for all subsequent charts produced for the current or new
input files. Note: The user must un-check the box shown in Figure 4 or restart the program to
discontinue the plotting of the aggregate on the charts.
Page 9 of 15
FIT/Asia/2
IP/08 Attachment 1
GOLD Performance Analysis Tool (G-PAT) User Manual
Figure 4.
Pop-up window for “Show Aggregate on Chart”
8.
Select Series to Display
8.1.
Once the filtering is complete and the user is ready to create the chart and report, the user
icon. This will trigger a pop-up window that will allow the user to select
will click on the
how the analysis is to be performed and displayed. For example, if the intended analysis is
focused on showing performance by FIR, the user will select the “FIR” option.
8.2.
Figure 5 shows the available options for the series to be shown on the chart and in the
report. The default setting for this filter is the “All data” option.
Figure 5.
Example of pop-up window to select series for analysis
8.3.
Once the series is selected, the options available for that series are displayed. Figure 6
shows an example of “FIR” selected and the corresponding options for “FIR.” The default for
this window is to have none of the options selected to prevent the user from selecting too many
options to be reasonably displayed. This is mainly attributable to the numerous options available
for “GES” and “Operator”.
Page 10 of 15
FIT/Asia/2
IP/08 Attachment 1
GOLD Performance Analysis Tool (G-PAT) User Manual
Figure 6.
8.4.
Example with FIR selected
Once the options are chosen for the selected series and the user clicks on
the chart and corresponding report will be generated and displayed.
8.5.
To refresh and overwrite the chart in the existing window or tab the user can click on the
icon under the main toolbar. If the refresh icon is not selected prior to generating a new
chart, a new tab will be opened for the new chart.
9.
Special Report
9.1.
The GPAT has an additional feature that will prepare a chart and report for all operators,
aircraft types, or airframes not meeting the 95% criteria for the specified performance parameter.
The user can click on the
icon to utilize this function.
9.2.
When using this function it is important to first select “Chart” from the main toolbar to
choose the performance parameter and criteria of interest.
10. Modification of the Chart
10.1. Once a G-PAT chart has been generated, the properties of the chart can be changed to
modify the view.
10.2. The default view is a scale from 90 to 100 percent on the vertical range (y) axis, with
increments of 1 percent. To change the view to a scale from 0 to 100 percent on the vertical
Page 11 of 15
FIT/Asia/2
IP/08 Attachment 1
GOLD Performance Analysis Tool (G-PAT) User Manual
range axis, right-click and select “Auto Range.” To return to the default setting, press the
“Refresh Chart” button.
10.3. To zoom on a particular portion of the chart, click and drag the mouse to draw a box
enclosing the desired area. This area will then be enlarged to fit the screen.
10.4. Several other chart properties are accessible by right-clicking on the chart and selecting
“Properties.” This action will open the “Chart Properties” window, which contains the three tabs
shown in Figure 7: “Title”, “Plot”, and “Other.”
Figure 7.
“Chart Properties” window – “Title” tab
10.5. The “Title” tab, shown in Figure 7, allows properties of the chart title to be modified.
The chart title can be hidden by de-selecting the check box displayed to the right of the chart title
text box. The text of the title can be changed in addition to the font, size, and color of the title.
Page 12 of 15
FIT/Asia/2
IP/08 Attachment 1
GOLD Performance Analysis Tool (G-PAT) User Manual
Figure 8.
“Chart Properties” window – “Plot” tab
10.6. The “Plot” tab allows properties of the horizontal domain (x) axis and of the vertical
range (y) axis to be independently modified. As shown in Figure 8, the label as well as its font,
size, and color can be changed. Additional properties, such as the showing or hiding of the tick
labels and tick marks for the axes, can be modified.
10.7. The range displayed on the chart can be modified by selecting the “Range” tab, shown in
Figure 9. To adjust the range, deselect the checkbox for “Auto-adjust range” and then enter the
desired minimum and maximum range values.
Figure 9.
“Chart Properties” window – “Plot” tab – “Other” section
Page 13 of 15
FIT/Asia/2
IP/08 Attachment 1
GOLD Performance Analysis Tool (G-PAT) User Manual
Figure 10.
“Chart Properties” window – “Plot” tab
10.8. The remaining tab, “Other”, shown in Figure 10, allows the line colors in the chart to be
modified.
11.
Save or Print a Copy of the Chart or Report
11.1. To save the chart as a .jpeg file the user will click on the
window allowing the user to select where to save the file.
11.2.
icon. This will display a
To save the chart as a PNG file, the user can right-click the chart and select “Save as”.
11.3. To save the report, the user will click on the
icon. This will display a window
allowing the user to select where to save the file and whether to save in a comma-separated (.csv)
format or a space-delimited text (.txt) format.
11.4. Figure 11 shows a sample chart and report for the observed ACTP by media type. The
input file and corresponding directory is shown at the top of the application window. The
filename is also shown in the bottom right-hand corner of the chart window.
11.5.
The details of the analysis are summarized at the top of the report.
Page 14 of 15
FIT/Asia/2
IP/08 Attachment 1
GOLD Performance Analysis Tool (G-PAT) User Manual
Figure 11.
Sample output chart and report
References
1. International Civil Aviation Organization (ICAO) Global Operational Data Link Document
(GOLD), Version 1.5, February 2013.
Page 15 of 15
FIT-Asia/2
WP11 Attachment 1
FANS INTEROPERABILITY TEAM - ASIA (FIT-ASIA)
TERMS OF REFERENCE
FIT-Asia Objective and Scope
The FANS Interoperability Team - Asia (FIT-Asia) shall be responsible for overseeing system
configuration and the end-to-end monitoring process of datalink systems to ensure they are
implemented and continue to meet performance, safety, and interoperability requirements within the
Asian Region.
The FIT-Asia shall:
Implementation
a) support the implementation and operational benefits of AIDC, CPDLC and ADS;
Reporting and problem resolution processes
b) establish a problem reporting system;
c) review de-identified problem reports, identify trends and determine appropriate resolution;
d) develop interim operational procedures to mitigate the effects of problems until resolution;
e) monitor the progress of problem resolution;
f) prepare summaries of problems encountered and their operational implications;
System performance and monitoring processes
g) determine and validate system performance requirements;
h) establish a performance monitoring system;
i) assess system performance based on information from the CRA;
j) coordinate system testing and trials;
k) identify accountability for each element of the end-to-end system;
l) develop, document and implement a quality assurance plan that will provide a stable system;
m) identify end-to-end system configurations that provide acceptable data link performance;
n) ensure that such configurations are maintained by all stakeholders;
New procedures
o) coordinate testing in support of implementation of enhanced operational procedures
Reporting
p) report safety-related issues to the appropriate State or regulatory authorities for action;
q) provide reports to relevant ATM coordinating groups; and
r) report to RASMAG.
Relevant Central Reporting Agencies (CRA) and States will report, as required, to the FIT-Asia.
ICAO Secretariat will submit reports to appropriate sub-groups of APANPIRG.
Composition of FIT-Asia
The FIT-Asia will consist of representatives from States (ANS Providers) communication service
providers (CSP), CRAs, IATA, CANSO, IFALPA and IFATCA. Aircraft and ancillary equipment
manufacturers may also be requested to participate.
………………………….
Approved by APANPIRG/22, September 2011