1
1
Understanding probability distributions
60
50
Number of
Employees
40
30
20
10
6.00 9.00 12.00 15.00 18.00
Hourly Wage Ranges in Dollars
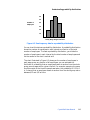
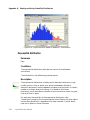
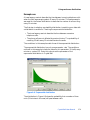
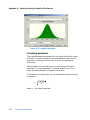
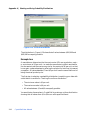
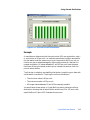
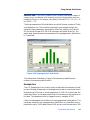
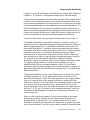
Figure A.2 Raw frequency data for a probability distribution
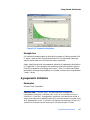
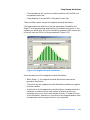
You can chart this data as a probability distribution. A probability distribution
shows the number of employees in each interval as a fraction of the total
number of employees. To create a probability distribution, you divide the
number of employees in each interval by the total number of employees and
list the results on the chart’s vertical axis.
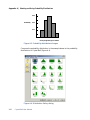
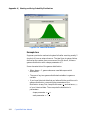
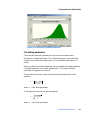
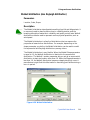
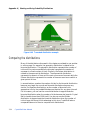
The chart illustrated in Figure A.3 shows you the number of employees in
each wage group as a fraction of all employees; you can estimate the
likelihood or probability that an employee drawn at random from the whole
group earns a wage within a given interval. For example, assuming the same
conditions exist at the time the sample was taken, the probability is 0.33 (a 1
in 3 chance) that an employee drawn at random from the whole group earns
between $12 and $15 an hour.
Crystal Ball User Manual
265