1
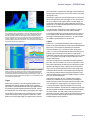
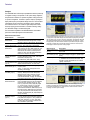
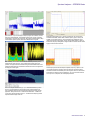
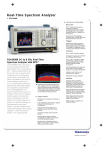
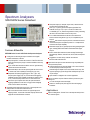
Spectrum Analyzers
SPECMON Series Datasheet
Features & Benefits
SPECMON Series 3.0 and 6.2 GHz Real-time Spectrum Analyzers
Leading real time technologies help to troubleshoot the toughest
transient interferences in the field
Unique Swept DPX ™ enables the customer to “Real-Time Scan” the
whole 3/6.2 GHz frequency range for transient interference discovery
(Opt. 200)
Up to 110 MHz ultra-wide real-time BW for “close-in” signal discovery,
capture and real-time demodulation
Unmatched ability to discover and capture signals with as short as 3.7
μs duration with 100% Probability of Intercept (POI) (Opt. 200)
Exceptional DPX Density Trigger/Trigger on This ™ (Opt. 200),
Frequency Mask Trigger (Opt. 52) and other advanced triggering
capabilities provide 100% probability of intercept for signals as short
as 3.7 μs in the frequency domain and 12 ns in the time domain
Save hours of post-capture review time with optional advanced
triggering capabilities such as Save-on-Trigger, which intelligently
saves events of interest automatically
Integrated solution design reduces total cost of ownership with lower
initial purchase cost and annual maintenance cost
Both manual and automatic drive test are supported by built-in
mapping software. Commercial off-the-shelf 3rd party GPS receiver
supported via USB or Bluetooth connection
Field pulse analysis (for example, airport radar) is easier than ever
with automated Pulse Analysis suite
Save up to 12 years of gap-free DPX Spectrogram/Real-Time
Waterfall Traces (Opt. 53) or up to 7 seconds of IQ data at full
110 MHz BW (Opt. 110) with extra-large real-time memory, eliminating
the need for an external data recorder in many cases
Full 110 MHz bandwidth real-time IQ data can be streamed to
external, data recording devices (Opt. 55) for comprehensive post
analysis
Instrumentation needs for frequency-domain, modulation-domain and
time-domain analysis are simplified by native 3-in-1 multiple-domain
correlation and analysis capability
Modulation analysis for 20+ general purpose analog and digital signal
types, including AM/FM demodulation and flexible OFDM signal
analysis
Built-in versatile field measurement items including Field Strength,
Signal Strength, EMI test, Channel Power, ACPR, OBW, and Spurious
Search
Ruggedness and data security achieved with standard
field-removable solid-state drive
Open data format improves asset utilization through compatibility with
industry-standard products
Captured IQ data can be saved into Matlab, CSV or other formats for
use with third-party software analysis tools
RSA MAP supports MapInfo format and scanned version maps, also
supports exporting to popular Google Earth and MapInfo map format
for post analysis
Open interface for integration into customer applications
Ease-of-use platform improves field-test efficiency and lowers system
training cost
10.4 inch ultra-bright touchscreen display
Windows 7 Ultimate (64-bit) with support to Microsoft language
localization
Applications
Spectrum Management – Reduce Time to Intercept and Identify Known
and Unknown Signals
Datasheet
Integrated Real-Time Solution to Your
Toughest Field Interference Challenges
DPX Spectrograms (Opt. 200) provide gap-free spectral monitoring for up to 12 years at
a time. 60,000 traces can be recorded and reviewed, with resolution per line adjustable
from 110 µs to 6400 s.
Advanced Triggers and Swept DPX re-invents the way swept spectrum analysis is done.
The DPX engine collects hundreds of thousands of spectrums per second over a 110 MHz
bandwidth. Users can sweep the DPX across the full input range of the SPECMON Series,
up to 6.2 GHz. In the time a traditional spectrum analyzer has captured one spectrum, the
SPECMON Series has captured orders of magnitude more spectrums. This new level of
performance reduces the chance of missing time-interleaved and transient signals during
broadband searches.
Advanced Triggers, Swept DPX, and Zero Span (Opt. 200) provides superior swept
spectrum analysis for transient signals. Here, a 150 MHz swath of spectrum is swept
across the ISM band. Multiple WLAN signals are seen, and narrow signals seen in the
blue peak-hold trace are Bluetooth access probes. Multiple interfering signals are seen
below the analyzers noise level in the multi-color DPX display.
2
www.tektronix.comrsa
Discover
The patented DPX® spectrum processing engine brings live analysis
of transient events to spectrum analyzers. Performing up to 292,000
frequency transforms per second, transients of a minimum event duration
of 3.7 μs in length are displayed in the frequency domain. This is orders
of magnitude faster than swept analysis techniques. Events can be
color coded by rate of occurrence onto a bitmapped display, providing
unparalleled insight into transient signal behavior. The DPX spectrum
processor can be swept over the entire frequency range of the instrument,
enabling broadband transient capture previously unavailable in any
spectrum analyzer. In applications that require only spectral information,
Opt. 200 provides gap-free spectral recording, replay, and analysis of up
to 60,000 spectral traces. Spectrum recording resolution is variable from
110 µs to 6400 s per line.
Spectrum Analyzers — SPECMON Series
domain event lasts for a specified time. Runt triggers capture troublesome
infrequent pulses that either turn on or turn off to an incorrect level, greatly
reducing time to fault.
DPX Density™ Trigger works on the measured frequency of occurrence or
density of the DPX display. The unique Trigger On This™ function allows
the user to simply point at the signal of interest on the DPX display, and
a trigger level is automatically set to trigger slightly below the measured
density level. You can capture low-level signals in the presence of high-level
signals at the click of a button.
Revolutionary DPX® spectrum display reveals transient signal behavior that helps you
discover instability, glitches, and interference. Here, three distinct signals can be seen.
Two high-level signals of different frequency-of-occurrence are seen in light and dark
blue, and a third signal beneath the center signal can also be discerned. The DPX
Density™ trigger allows the user to acquire signals for analysis only when this third signal
is present. Trigger On This™ has been activated, and a density measurement box is
automatically opened, measuring a signal density 7.275%. Any signal density greater than
the measured value will cause a trigger event.
Trigger and Capture: The DPX Density™ Trigger monitors for changes in the frequency
domain, and captures any violations into memory. The spectrogram display (left panel)
shows frequency and amplitude changing over time. By selecting the point in time in
the spectrogram where the spectrum violation triggered the DPX Density™ Trigger, the
frequency domain view (right panel) automatically updates to show the detailed spectrum
view at that precise moment in time.
Trigger
Tektronix has a long history of innovative triggering capability, and the
SPECMON Series spectrum analyzers lead the industry in triggered
signal analysis. The SPECMON Series provides unique triggers essential
for troubleshooting modern digitally implemented RF systems. Includes
time-qualified power, runt, density, frequency, and frequency mask triggers.
Time qualification can be applied to any internal trigger source, enabling
capture of ‘the short pulse’ or ‘the long pulse’ in a pulse train, or, when
applied to the Frequency Mask Trigger, only triggering when a frequency
The Frequency Mask Trigger (FMT) is easily configured to monitor all
changes in frequency occupancy within the acquisition bandwidth.
A Power Trigger working in the time domain can be armed to monitor for a
user-set power threshold. Resolution bandwidths may be used with the
power trigger for band limiting and noise reduction. Two external triggers
are available for synchronization to test system events.
Capture
Capture once – make multiple measurements without recapturing. All
signals in an acquisition bandwidth are recorded into the SPECMON Series
deep memory. Record lengths vary depending upon the selected
acquisition bandwidth – up to 7 seconds at 110 MHz, 343 seconds at
1 MHz, or 6.1 hours at 10 kHz bandwidth with Memory Extension (Opt. 53).
Real-time capture of small signals in the presence of large signals is
enabled with 73 dB SFDR in all acquisition bandwidths, even up to 110 MHz
(Opt. 110). Acquisitions of any length can stored in MATLAB™ Level 5
format for offline analysis.
Most spectrum analyzers in the market utilize narrowband tunable band
pass filters, often YIG tuned filters (YTF) to serve as a preselector. These
filters provide image rejection and improve spurious performance in swept
applications by limiting the number of signals present at the first mixing
stage. YTF's are narrow band devices by nature and are usually limited
to bandwidths less than 50 MHz. These analyzers bypass the input filter
when performing wideband analysis, leaving them susceptible to image
responses when operating in modes where wideband analysis is required
such as for real time signal analysis.
Unlike spectrum analyzers with YTF's, Tektronix Real Time Signal
Analyzers use a wideband image-free architecture guaranteeing that
signals at frequencies outside of the band to which the instrument is tuned
don't create spurious or image responses. This image-free response
is achieved with a series of input filters designed such that all image
responses are suppressed. The input filters are overlapped by greater than
the widest acquisition bandwidth, ensuring that full-bandwidth acquisitions
are always available. This series of filters serves the purpose of the
preselector used by other spectrum analyzers, but has the benefit of always
being on while still providing the image-free response in all instrument
bandwidth settings and at all frequencies.
www.tektronix.comrsa
3
Datasheet
Analyze
The SPECMON Series offers analysis capabilities that advance productivity
for engineers working on components or in RF system design, integration,
and performance verification, or operations engineers working in networks,
or spectrum management. In addition to spectrum analysis, spectrograms
display both frequency and amplitude changes over time. Time-correlated
measurements can be made across the frequency, phase, amplitude,
and modulation domains. This is ideal for signal analysis that includes
frequency hopping, pulse characteristics, modulation switching, settling
time, bandwidth changes, and intermittent signals.
The measurement capabilities of the SPECMON Series and available
options and software packages are summarized below:
Measurement Functions
Measurements
Description
Spectrum Analyzer
Measurements
Channel Power, Adjacent Channel Power, Multicarrier
Adjacent Channel Power/Leakage Ratio, Occupied
Bandwidth, xdB Down, dBm/Hz Marker, dBc/Hz Marker
Time Domain and
RF IQ vs. Time, Power vs. Time, Frequency vs. Time,
Statistical Measurements Phase vs. Time, CCDF, Peak-to-Average Ratio
Spur Search
Up to 20 frequency ranges, user-selected detectors
Measurement
(Peak, Average, QP), filters (RBW, CISPR, MIL), and
VBW in each range. Linear or Log frequency scale.
Measurements and violations in absolute power or
relative to a carrier. Up to 999 violations identified in
tabular form for export in .CSV format
Analog Modulation
% Amplitude Modulation (+, –, Total)
Analysis Measurement
Frequency Modulation (±Peak, +Peak, –Peak, RMS,
Functions
Peak-Peak/2, Frequency Error)
Phase Modulation (±Peak, RMS, +Peak, –Peak)
Carrier Power, Frequency Error, Modulation Frequency,
AM/FM/PM Modulation
and Audio Measurements Modulation Parameters (±Peak, Peak-Peak/2, RMS),
SINAD, Modulation Distortion, S/N, THD, TNHD
(Opt. 10)
Phase Noise and Jitter
10 Hz to 1 GHz Frequency Offset Range, Log
Measurements (Opt. 11) Frequency Scale
Traces – 2: ±Peak Trace, Average Trace, Trace
Smoothing, and Averaging
Settling Time (Frequency Measured Frequency, Settling Time from last settled
and Phase) (Opt. 12)
frequency, Settling Time from last settled phase,
Settling Time from Trigger. Automatic or manual
reference frequency selection. User-adjustable
measurement bandwidth, averaging, and smoothing.
Pass/Fail Mask Testing with 3 user-settable zones
Advanced Pulse
Average On Power, Peak Power, Average Transmitted
Measurements Suite
Power, Pulse Width, Rise Time, Fall Time, Repetition
Interval (Seconds), Repetition Interval (Hz), Duty
Factor (%), Duty Factor (Ratio), Ripple (dB), Ripple
(%), Overshoot (dB), Overshoot (%), Droop (dB),
Droop (%), Pulse-Pulse Frequency Difference,
Pulse-Pulse Phase Difference, RMS Frequency Error,
Max Frequency Error, RMS Phase Error, Max Phase
Error, Frequency Deviation, Delta Frequency, Phase
Deviation, Impulse Response (dB), Impulse Response
(Time), Time Stamp
General Purpose Digital Error Vector Magnitude (EVM) (RMS, Peak, EVM
vs. Time), Modulation Error Ratio (MER), Magnitude
Modulation Analysis
Error (RMS, Peak, Mag Error vs. Time), Phase Error
(Opt. 21)
(RMS, Peak, Phase Error vs. Time), Origin Offset,
Frequency Error, Gain Imbalance, Quadrature Error,
Rho, Constellation, Symbol Table
4
www.tektronix.comrsa
Advanced Signal Analysis package offers over 20 automated pulse parameter calculations
on every pulse. Easily validate designs with measurements of peak power, pulse width
rise time, ripple, droop, overshoot, and pulse-to-pulse phase. Gain insight into linear FM
chirp quality with measurements such as Impulse Response and Phase Error. A pulse
train (upper left) is seen with automatic calculation of pulse width and impulse response
(lower right). A detailed view of the Impulse Response is seen in the lower left, and a
DPX® display monitors the spectrum on the upper right.
Measurements
Description
Flexible OFDM Analysis
(Opt. 22)
DPX Density
Measurement (Opt. 200)
OFDM Analysis for WLAN 802.11a/j/g and WiMAX
802.16-2004
Measures % signal density at any location on the
DPX spectrum display and triggers on specified signal
density
RSAVu Analysis Software W-CDMA, HSUPA. HSDPA, GSM/EDGE, CDMA2000
1x, CDMA2000 1xEV-DO, RFID, Phase Noise, Jitter,
IEEE 802.11 a/b/g/n WLAN, IEEE 802.15.4 OQPSK
(Zigbee), Audio Analysis
Time-correlated views in multiple domains provide a new level of insight into design
problems not possible with conventional analyzers. Here, ACLR and modulation quality
are performed simultaneously in a single acquisition, combined with the continuous
monitoring of the DPX® spectrum display.
Spectrum Analyzers — SPECMON Series
Spurious Search – Up to 20 noncontiguous frequency regions can be defined, each with
their own resolution bandwidth, video bandwidth, detector (peak, average, quasi-peak),
and limit ranges. Test results can be exported in .CSV format to external programs, with up
to 999 violations reported. Spectrum results are available in linear or log scale.
Audio monitoring and modulation measurements simultaneously can make spectrum
management an easier, faster task. Here, the DPX spectrum display shows a live
spectrum of the signal of interest and simultaneously provides demodulated audio to the
internal instrument loudspeaker. FM deviation measurements are seen in the right side of
the display for the same signal.
Settling time measurements (Opt. 12) are easy and automated. The user can select
measurement bandwidth, tolerance bands, reference frequency (auto or manual), and
establish up to 3 tolerance bands vs. time for Pass/Fail testing. Settling time may be
referenced to external or internal trigger, and from the last settled frequency or phase. In
the illustration, frequency settling time for a hopped oscillator is measured from an external
trigger point from the device under test.
DPX Zero-span produces real-time analysis in amplitude, frequency, or phase vs. time.
Up to 50,000 waveforms per second are processed. DPX Zero-span ensures that all
time-domain anomalies are immediately found, reducing time-to-fault. Here, three distinct
pulse shapes are captured in zero-span amplitude vs. time. Two of the three waveforms
occur only once in 10,000 pulses, but all are displayed with DPX.
Phase noise and jitter measurements (Opt. 11) on the SPECMON Series may reduce
the cost of your measurements by reducing the need for a dedicated phase noise
tester. Outstanding phase noise across the operating range provides margin for many
applications. Here, phase noise on a 13 MHz carrier is measured at –119 dBc/Hz at
10 kHz offset. The instrument phase noise of < –134 dBc/Hz at this frequency provides
ample measurement margin for the task.
www.tektronix.comrsa
5
Datasheet
With RSA Map you can do the following:
Select a measurement and touch the displayed map where you want the
measurement to be placed
Use a GPS receiver (customer supplied) to automatically position
measurements at your current location (on maps with geophysical
reference information)
Collect and export measurement data (and position data when using
a GPS receiver) to common formats to help analyze measurements
(position, value, and direction) and prepare reports to resolve
interference problems
RSA Map uses MapInfo format map files (.mif) or Windows bitmap files
(.bmp) to indicate location. The .bmp format map files can be either
geo-referenced or non-geo-referenced. Saved test results give you
complete measurement data along with exporting compatibility to Google
Earth (.kmz) and Mapinfo (MIF/MID) formats.
Characteristics
Frequency Related
Locate interference with azimuth direction function. It lets you draw a line or an arrow on a
mapped measurement to indicate the direction your antenna was pointing when you take
a measurement. User label can also be displayed (this example shows real time DPX
measurement taken from Hospital, School and Park Lot)
Characteristic
Description
Frequency Range
1 Hz to 3.0 GHz (SPECMON3)
1 Hz to 6.2 GHz (SPECMON6)
Within 10–7 after 10 minute warm-up
Initial Center Frequency
Setting Accuracy
Center Frequency Setting
Resolution
Frequency Marker
Readout Accuracy
RE
MF
Span Accuracy
Reference Frequency
Initial accuracy at cal
Aging per day
Aging per 10 years
Temperature drift
Cumulative error
(temperature + aging)
Reference Output Level
External Reference Input
Frequency
External Reference Input
Frequency Requirements
Spurious
Input level range
0.1 Hz
±(RE × MF + 0.001 × Span + 2) Hz
Reference Frequency Error
Marker Frequency (Hz)
±0.3% of Span (Auto mode)
1 × 10⁻⁷ (after 10 minute warm-up)
1 × 10⁻⁹ (after 30 days of operation)
3 × 10⁻⁷ (after 10 years of operation)
2 × 10⁻⁸ (5 to 40 °C)
4 × 10⁻⁷ (within 10 years after calibration, typical)
>0 dBm (internal or external reference selected),
+4 dBm, typical
10 MHz ±30 Hz
Spurious level on input must be < –80 dBc within
100 kHz offset to avoid on-screen spurs
< –80 dBc within 100 kHz offset
–10 dBm to +6 dBm
Trigger Related
Both manual and automatic drive test measurements are supported. The Repeat
measurements function automatically takes measurements at a user-set time or distance
interval.
Integrated Solution for Mapping
SPECMON series Real-Time Spectrum Analyzers provide an integrated
solution for field interference and coverage problems. The built-in RSA
Map lets you use an on-screen map to record the location and value of
SPECMON measurements.
6
www.tektronix.comrsa
Characteristic
Description
Trigger Modes
Trigger Event Source
Free Run, Triggered, FastFrame
RF Input, Trigger 1 (Front Panel), Trigger 2 (Rear
Panel), Gated, Line
Power (Std), Frequency Mask (Opt. 52), Frequency
Edge, DPX Density, Runt, Time Qualified (Opt. 200)
Trigger position settable from 1 to 99% of total
acquisition length
Trig 1 AND Trig 2 / Gate may be defined as a trigger
event
Save acquisition and/or save picture on trigger
Trigger Types
Trigger Setting
Trigger Combinational
Logic
Trigger Actions
Spectrum Analyzers — SPECMON Series
Power Level Trigger
Acquisition Related
Characteristic
Description
Characteristic
Description
Level Range
Accuracy
(for trigger levels
>30 dB above noise
floor, 10% to 90% of
signal level)
Trigger Bandwidth Range
(at maximum
acquisition BW)
0 dB to –100 dB from reference level
Real-time Acquisition
Bandwidth
25 MHz (Std.)
40 MHz (Opt. 40)
110 MHz (Opt. 110)
100 MS/s, 14 bit (optional 300 MS/s, 14 bit,
Opt. 40/110)
1 GB (4 GB, Opt. 53)
64 Samples
±0.5 dB (level ≥ –50 dB from reference level)
±1.5 dB (from < –50 dB to –70 dB from reference level)
4 kHz to 10 MHz + wide open (standard)
4 kHz to 20 MHz + wide open (Opt. 40)
11 kHz to 40 MHz + wide open (Opt. 110)
Trigger Position Timing Uncertainty
25 MHz Acquisition
Uncertainty = ±15 ns
BW, 10 MHz BW (Std.)
Uncertainty = ±10 ns
40 MHz Acquisition
BW, 20 MHz BW
(Opt. 40)
Uncertainty = ±5 ns
110 MHz Acquisition
BW, 40 MHz BW
(Opt. 110)
Trigger Re-Arm Time, Minimum (Fast Frame ‘On’)
10 MHz Acquisition BW ≤25 μs
40 MHz Acquisition BW ≤10 μs
(Opt. 40)
≤5 μs
110 MHz Acquisition
BW (Opt. 110)
Minimum Event Duration (Filter = Off)
25 MHz Acquisition BW 40 ns
(Std.)
40 MHz Acquisition BW 25 ns
(Opt. 40)
110 MHz Acquisition
12 ns
BW (Opt. 110)
External Trigger 1
Level Range
–2.5 V to +2.5 V
Level Setting Resolution 0.01 V
Trigger Position Timing Uncertainty (50 Ω input impedance)
Uncertainty = ±20 ns
25 MHz Acquisition
BW, 25 MHz Span
(Std.)
Uncertainty = ±15 ns
40 MHz Acquisition
BW, 40 MHz Span
(Opt. 40)
Uncertainty = ±12 ns
110 MHz Acquisition
BW, 110 MHz Span
(Opt. 110)
Input Impedance
Selectable 50 Ω/5 kΩ impedance (nominal)
A/D Converter
Acquisition Memory Size
Minimum Acquisition
Length
Acquisition Length Setting 1 Sample
Resolution
Fast Frame Acquisition
>64,000 records can be stored in a single acquisition
Mode
(for pulse measurements and spectrogram analysis)
Memory Depth (Time) and Minimum Time Domain Resolution
Acquisition
BW
110 MHz
(Opt. 110)
40 MHz
(Opt. 40)
25 MHz
20 MHz
10 MHz
5 MHz
2 MHz*1
1 MHz
500 kHz
200 kHz
100 kHz
50 kHz
20 kHz
10 kHz
5 kHz
2 kHz
1 kHz
500 Hz
200 Hz
100 Hz
Sample Rate
(For I and Q)
Record
Length
Record
Length
(Opt. 53)
Time
Resolution
150 MS/s
1.79 s
7.15 s
6.6667 ns
75 MS/s
3.57 s
14.3 s
13.33 ns
50 MS/s
25 MS/s
12.5 MS/s
6.25 MS/s
3.125 MS/s
1.56 MS/s
781 kS/s
390 kS/s
195 kS/s
97.6 kS/s
48.8 kS/s
24.4 kS/s
12.2 kS/s
3.05 kS/s
1.52 kS/s
762 S/s
381 S/s
190 S/s
4.77 s
9.54 s
19.0 s
38.1 s
42.9 s
85.8 s
171.7 s
343.5 s
687.1 s
1374 s
2748 s
5497 s
10955 s
43980 s
87960 s
175921 s
351843 s
703686 s
19.0 s
38.1 s
76.3 s
152.7 s
171.7 s
343.5 s
687.1 s
1347 s
2748 s
55497 s
10955 s
21990 s
43980 s
175921 s
351843 s
703687 s
1407374 s
2814749 s
20 ns
40 ns
80 ns
160 ns
320 ns
640 ns
1.28 μs
2.56 μs
5.12 μs
10.24 μs
20.48 μs
40.96 μs
81.92 μs
328 μs
655 μs
1.31 ms
2.62 ms
5.24 ms
*1 In spans ≤2 MHz, higher resolution data is stored.
External Trigger 2
Threshold Voltage
Input Impedance
Trigger State Select
Fixed, TTL
10 kΩ (nominal)
High, Low
Trigger Output
Voltage (Output Current <1 mA)
High:
>2.0 V
Low:
<0.4 V
Advanced trigger specifications are found in sections on Opt. 52 (Frequency Mask
Trigger) and Opt. 200 (DPX, Time Qualified, Runt, and Frequency Edge triggers)
www.tektronix.comrsa
7
Datasheet
RF Spectrum and Analysis Performance
Analysis Related
Available Displays
Views
Frequency
Spectrum (Amplitude vs Linear or Log Frequency)
DPX® Spectrum Display (Live RF Color-graded
Spectrum)
Spectrogram (Amplitude vs. Frequency over Time)
Spurious (Amplitude vs Linear or Log Frequency)
Phase Noise (Phase Noise and Jitter Measurement)
(Opt. 11)
Amplitude vs. Time
Time and Statistics
Frequency vs. Time
Phase vs. Time
DPX Amplitude vs. Time (Opt. 200)
DPX Frequency vs. Time (Opt. 200)
DPX Phase vs. Time (Opt. 200)
Amplitude Modulation vs. Time
Frequency Modulation vs. Time
Phase Modulation vs. Time
RF IQ vs. Time
Time Overview
CCDF
Peak-to-Average Ratio
Settling Time, Frequency, Frequency Settling vs. Time, Phase Settling vs. Time
and Phase (Opt. 12)
Advanced Measurements Pulse Results Table
Suite
Pulse Trace (selectable by pulse number)
Pulse Statistics (Trend of Pulse Results, FFT of Trend,
and Histogram)
Digital Demod (Opt. 21)
Constellation Diagram
EVM vs. Time
Symbol Table (Binary or Hexadecimal)
Magnitude and Phase Error versus Time, and Signal
Quality
Demodulated IQ vs. Time
Eye Diagram
Trellis Diagram
Frequency Deviation vs. Time
Flexible OFDM Analysis Constellation, Scalar Measurement Summary
(Opt. 22)
EVM or Power vs. Carrier
Symbol Table (Binary or Hexadecimal)
Frequency Offset
Signal analysis can be performed either at center
Measurement
frequency or the assigned measurement frequency
up to the limits of the instrument's acquisition and
measurement bandwidths
Bandwidth Related
Characteristic
Description
Resolution Bandwidth
Resolution Bandwidth
Range
(Spectrum Analysis)
Resolution Bandwidth
Shape
Resolution Bandwidth
Accuracy
Alternative Resolution
Bandwidth Types
0.1 Hz to 5 MHz (10 MHz, Opt. 110) (1, 2, 3,
5 sequence, Auto-coupled), or user selected (arbitrary)
Approximately Gaussian, shape factor 4.1:1 (60:3 dB)
±10%, typical
±1% (Auto-coupled RBW mode)
Kaiser window (RBW), –6 dB Mil, CISPR,
Blackman-Harris 4B Window, Uniform (none) Window,
Flat-top (CW Ampl.) Window, Hanning Window
Video Bandwidth
Video Bandwidth Range
RBW/VBW Maximum
RBW/VBW Minimum
Resolution
Accuracy (Typical,
Detector: Average)
1 Hz to 5 MHz plus wide open
10,000:1
1:1 plus wide open
5% of entered value
±10%
Time Domain Bandwidth (Amplitude vs. Time Display)
Time Domain Bandwidth
Range
Time Domain BW Shape
Time Domain Bandwidth
Accuracy
At least 1/10 to 1/10,000 of acquisition bandwidth, 1 Hz
minimum
≤10 MHz, approximately Gaussian, shape factor 4.1:1
(60:3 dB), ±10% typical
20 MHz (60 MHz, Opt. 110), shape factor <2.5:1
(60:3 dB) typical
1 Hz to 20 MHz, and (>20 MHz to 60 MHz Opt. 110),
±10%
Minimum Settable Spectrum Analysis RBW vs. Span
Frequency Span
RBW
>10 MHz
>1.25 MHz to 10 MHz
≤1 MHz
≤100 kHz
100 Hz
10 Hz
1 Hz
0.1 Hz
Spectrum Display Traces, Detector, and Functions
Characteristic
Description
Traces
Three traces + 1 math waveform + 1 trace from
spectrogram for spectrum display
Peak, –Peak, Average (VRMS), ±Peak, Sample, CISPR
(Avg, Peak, Quasi-peak Average (of Logs))
Normal, Average, Max Hold, Min Hold, Average (of
Logs)
801, 2401, 4001, 8001, or 10401 points
1500 MHz/s (Std.)
2500 MHz/s (Opt. 40)
6000 MHz/s (Opt. 110)
Detector
Trace Functions
Spectrum Trace Length
Sweep Speed (Typical.
RBW = Auto, RF/IF
Optimization: minimize
sweep time)
8
www.tektronix.comrsa
Spectrum Analyzers — SPECMON Series
DPX® Digital Phosphor Spectrum Processing
Characteristic
Spectrum Processing
Rate (RBW = Auto, Trace
Length 801)
DPX Bitmap Resolution
DPX Bitmap Color
Dynamic Range
Marker Information
Minimum Signal Duration
for 100% Probability of
Detection (Max-hold On)
Span Range
(Continuous processing)
Span Range (Swept)
Dwell Time per Step
Trace Processing
Trace Length
Resolution BW Accuracy
DPX
(Standard)
Advanced DPX
(Opt. 200)
48,828/s
292,969/s
201 × 501
64k (48 dB)
201 × 801
8G (99 dB)
Amplitude, frequency,
and hit count on the
DPX display
31 μs (Std. or Opt. 40)
24 μs (Opt. 110)
Amplitude, frequency,
and signal density on
the DPX display
See Minimum Signal
Duration for 100%
Probability of Trigger
at 100% Amplitude table
100 Hz to 25 MHz
(40 MHz with Opt. 40)
(110 MHz with Opt. 110)
Up to instrument
frequency range
50 ms to 100 s
Color-graded bitmap,
+Peak, –Peak, Average
801, 2401, 4001, 10401
±1%
100 Hz to 25 MHz
(40 MHz with Opt. 40)
(110 MHz with Opt. 110)
Not Available
Not Available
Color-graded bitmap,
+Peak, –Peak, Average
501
7%
Note: For complete Advanced DPX specifications, see the Opt. 200 section of this data sheet.
Minimum RBW, Swept Spans (Opt. 200) – 10 kHz.
Stability
Residual FM – <2 Hzp-p in 1 second (95% confidence, typical).
Phase Noise Sidebands, dBc/Hz at Specified Center
Frequency (CF)
Offset
CF=
10 MHz
Typical
CF = 1 GHz
Spec
1 kHz
10 kHz
100 kHz
1 MHz
6 MHz
10 MHz
–128
–134
–134
–135
–140
NA
–103
–109
–112
–130
–134
–135
Typical
CF =
2 GHz
Typical
CF =
6 GHz
Typical
–107
–113
–116
–139
–144
–144
–107
–112
–115
–137
–142
–142
–104
–109
–114
–135
–141
–141
Integrated Phase (100 Hz to 100 MHz, typical)
Measurement
Frequency
Integrated Phase, Radians
100 MHz
1 GHz
2 GHz
5 GHz
2.51 × 10⁻³
3.14 × 10⁻³
3.77 × 10⁻³
6.28 × 10⁻³
Typical phase noise performance as measured by Opt. 11.
Amplitude
(Specifications excluding mismatch error)
Characteristic
Description
Measurement Range
Displayed average noise level to maximum measurable
input
0 dB to 55 dB, 5 dB step
Input Attenuator Range
Maximum Safe Input Level
+30 dBm
Average Continuous
(RF ATT ≥10 dB,
Preamp Off)
+20 dBm
Average Continuous
(RF ATT ≥10 dB,
Preamp On)
50 W
Pulsed RF (RF ATT
≥30 dB, PW <10 μs,
1% Duty Cycle)
Maximum Measurable Input Level
+30 dBm
Average Continuous
(RF ATT: Auto)
50 W
Pulsed RF (RF ATT:
Auto, PW <10 μs, 1%
Duty Cycle)
±5 V
Max DC Voltage
Log Display Range
0.01 dBm/div to 20 dB/div
Display Divisions
10 divisions
Display Units
dBm, dBmV, Watts, Volts, Amps, dBuW, dBuV, dBuA,
dBW, dBV, dBV/m, and dBA/m
Marker Readout
0.01 dB
Resolution, dB Units
Marker Readout
Reference-level dependent, as small as 0.001 μV
Resolution, Volts Units
Reference Level Setting 0.1 dB step, –170 dBm to +50 dBm (minimum ref. level
Range
–50 dBm at center frequency <80 MHz)
Level Linearity
±0.1 dB (0 to –70 dB from reference level)
www.tektronix.comrsa
9
Datasheet
Frequency Response
2nd Harmonic Distortion*4
Range
Frequency
2nd Harmonic Distortion, Typical
10 MHz to 1 GHz
>1 GHz to 3.1 GHz
< –80 dBc
< –83 dBc
Response
18 °C to 28 °C, Atten. = 10 dB, Preamp Off
10 MHz to 32 MHz (LF ±0.7 dB
Band)
±0.35 dB
10 MHz to 3 GHz
±0.5 dB
>3 GHz to 6.2 GHz
(SPECMON6)
*4 –40 dBm at RF input, Attenuator = 0, Preamp Off, typical.
Displayed Average Noise Level*5, Preamp Off
Frequency Range
5 °C to 40 °C, All Attenuator Settings (Typical, Preamp Off)
1 Hz to 32 MHz (LF
Band)
9 kHz to 3 GHz
>3 GHz to 6.2 GHz
(SPECMON6)
±0.8 dB
1 Hz to 100 Hz
>100 Hz to 4 kHz
>4 kHz to 10 kHz
>10 kHz to 32 MHz
±0.5 dB
±1.0 dB
9 kHz to 1 MHz
>1 MHz to 10 MHz
>10 MHz to 2 GHz
>2 GHz to 3 GHz
>3 GHz to 4 GHz
(SPECMON6)
>4 GHz to 6.2 GHz
(SPECMON6)
10 MHz to 32 MHz (LF ±0.8 dB
Band)
±0.8 dB
1 MHz to 3 GHz
±1.3 dB
>3 GHz to 6.2 GHz
(SPECMON6)
Amplitude Accuracy
Description
±0.31 dB
Absolute Amplitude
Accuracy at Calibration
Point (100 MHz, –20 dBm
signal, 10 dB ATT, 18 °C
to 28 °C)
Input Attenuator Switching ±0.3 dB
Uncertainty
Absolute Amplitude Accuracy at Center Frequency, 95% Confidence*2
±0.3 dB
10 MHz to 3 GHz
±0.5 dB
3 GHz to 6.2 GHz
(SPECMON6)
VSWR (Typical)
(Atten. = 10 dB, CF set within 200 MHz of VSWR frequency)
Frequency Range
Preamp OFF
Preamp ON
10 kHz to 10 MHz
<1.6:1
<1.12:1
<1.6:1
10 MHz to 2.0 GHz
<1.3:1
<1.6:1
>2.0 GHz to 3.0 GHz
<1.6:1
>3.0 GHz to 5.0 GHz <1.3:1
(SPECMON6)
<1.6:1
>5.0 GHz to 6.2 GHz <1.45:1
(SPECMON6)
*2 18 °C to 28 °C, Ref Level ≤ –15 dBm, Attenuator Auto-coupled, Signal Level –15 dBm to –50 dBm. 10 Hz ≤
RBW ≤ 1 MHz, after alignment performed.
–111 dBm/Hz
–139 dBm/Hz
–157 dBm/Hz
–156 dBm/Hz
–154 dBm/Hz
–149 dBm/Hz
–152 dBm/Hz
Description
Frequency Range
Noise Figure at 2 GHz
Gain at 2 GHz
1 MHz to 3.0 GHz or 6.2 GHz (SPECMON6)
7 dB
18 dB (nominal)
Displayed Average Noise Level*5, Preamp On
Frequency Range
1 MHz to 32 MHz
3rd Order Intercept,
dBm (Typical)
–75
+12.5
–72
–76
–84
–84
+11
+13
+17
+17
*3 Each Signal Level –25 dBm, Ref Level –20 dBm, Attenuator = 0 dB, 1 MHz tone separation.
Note: 3rd order intercept point is calculated from 3rd order intermodulation performance.
Typical
–158 dBm/Hz
–160 dBm/Hz
–158 dBm/Hz
–164 dBm/Hz
–163 dBm/Hz
–162 dBm/Hz
–160 dBm/Hz
–167 dBm/Hz
–165 dBm/Hz
–164 dBm/Hz
RF Band
1 MHz to 10 MHz
>10 MHz to 2 GHz
>2 GHz to 3 GHz
>3 GHz to 6.2 GHz
(SPECMON6)
*5 Measured using 1 kHz RBW, 100 kHz span, 100 averages, Minimum Noise mode, input terminated,
log-average trace detector and function.
Frequency Range
3rd Order
Intermodulation
Distortion, dBc
(Typical)
Specification
LF Band
500 kHz to 32 MHz,
LF Band
500 kHz to 80 MHz,
RF Band
80 MHz to 200 MHz
200 MHz to 3 GHz
3 GHz to 6.2 GHz
(SPECMON6)
www.tektronix.comrsa
–108 dBm/Hz
–136 dBm/Hz
–154 dBm/Hz
–153 dBm/Hz
–151 dBm/Hz
Characteristic
3rd Order Intermodulation Distortion: –84 dBc at 2.13 GHz
(Specified)*3
10
–129 dBm/Hz
–130 dBm/Hz
–144 dBm/Hz
–153 dBm/Hz
Preamplifier Performance
Residual Response*6
10 kHz to 32 MHz (LF
Band)
9 kHz to 80 MHz
>80 MHz to 300 MHz
>300 MHz to 3 GHz
>3 GHz to 6.2 GHz
–124 dBm/Hz
–141 dBm/Hz
–150 dBm/Hz
*5 Measured using 1 kHz RBW, 100 kHz span, 100 averages, Minimum Noise mode, input terminated,
log-average detector and trace function.
Noise and Distortion
Frequency Range
Typical
RF Band
Preamp On (Atten. = 10 dB)
Characteristic
Specification
LF Band
Specified
Typical
< –100 dBm
< –75 dBm
< –95 dBm
–95 dBm
–95 dBm
*6 Input terminated, RBW = 1 kHz, Attenuator = 0 dB, Reference Level –30 dBm.
Spectrum Analyzers — SPECMON Series
Image Response*7
Frequency Mask Trigger (Opt. 52)
Frequency
Spec
Characteristic
Description
100 Hz to 30 MHz
30 MHz to 3 GHz
>3 GHz to 6.2 GHz
(SPECMON6)
< –75 dBc
< –75 dBc
< –65 dBc
Mask Shape
Mask Point Horizontal
Resolution
Level Range
Level Accuracy*12
0 to –50 dB from
reference level
–50 dB to –70 dB from
reference level
Span Range
User Defined
<0.2% of span
*7 Ref = –30 dBm, Attenuator = 10 dB, RF Input Level = –30 dBm, RBW = 10 Hz.
Spurious Response with Signal, Offset ≥400 kHz*8
Frequency
Span ≤25 MHz,
Swept Spans >25 MHz
Typical
Specification
10 kHz to
32 MHz
(LF Band)
30 MHz to
3 GHz
>3 GHz to
6.2 GHz
(SPECMON6)
Opt. 40/110
25 MHz < Span ≤ 110 MHz
Typical
Specification
–71 dBc
–75 dBc
NA
NA
–73 dBc
–78 dBc
–73 dBc
–75 dBc
–73 dBc
–78 dBc
–73 dBc
–75 dBc
Trigger Position
Uncertainty
*8 RF Input Level = –15 dBm, Attenuator = 10 dB, Mode: Auto. Input signal at center frequency. Center
Frequency >90 MHz, Opt. 40/110.
Spurious Response with Signal (10 kHz ≤ offset < 400 kHz),
Typical
Frequency
Span ≤ 25 MHz, Swept
Spans >25 MHz
Opt. 40/110
25 MHz < Span ≤
110 MHz
–71 dBc
NA
–73 dBc
–73 dBc
–73 dBc
–73 dBc
10 kHz to 32 MHz
(LF Band)
30 MHz to 3 GHz
3 GHz to 6.2 GHz
(SPECMON6)
Spurious Response with Signal at 3.5125 GHz <80 dBc (RF input level, –30 dBm)
0 dB to –80 dB from reference level
±(Channel Response Flatness + 1.0 dB)
±(Channel Response Flatness + 2.5 dB)
100 Hz to 25 MHz
100 Hz to 40 MHz (Opt. 40)
100 Hz to 110 MHz (Opt. 110)
Span = 25 MHz:
±15 μs
±9 μs (Opt. 200, RBW = Auto)
Span = 40 MHz (Opt. 40):
±12.8 μs
±7 μs (Opt. 200, RBW = Auto)
Span = 110 MHz (Opt. 110):
±5.12 μs
±5 μs (Opt. 200, RBW = Auto)
*12 For masks >30 dB above noise floor, Center Frequency ≥50 MHz.
Minimum Signal Duration for 100% Probability of Trigger at
100% Amplitude*13
Acquisition
BW
25 MHz
40 MHz
85 MHz
110 MHz
Opt. 52 plus
Opt. 52 plus Opt. 52 plus
Opt. 200
Opt. 09
Opt. 200
plus Opt. 09
Opt. 52
35.9 μs
27.3 μs
23.9 μs
23.9 μs
25.6 μs
15.4 μs
10.3 μs
10.3 μs
Opt. 200: Advanced Triggers, Swept DPX, and DPX Zero Span
Adjacent Channel Leakage Ratio Dynamic Range*9
ACLR, Typical
Signal Type,
Measurement Mode
Adjacent
Alternate
3GPP Downlink, 1 DPCH
Uncorrected
Noise Corrected
–70 dB
–79 dB
–70 dB
–79 dB
Span
110 MHz
*9 Measured with test signal amplitude adjusted for optimum performance. (CF = 2.13 GHz)
IF Frequency Response and Phase Linearity*10
0.001 to 0.032
(LF Band)
0.01 to 6.2*11
0.03 to 6.2
Amplitude
Flatness
(Spec)
Amplitude
Flatness
(Typ, RMS)
Phase
Flatness
(Typ, RMS)
≤20 MHz
±0.50 dB
0.4 dB
1.0°
≤300 kHz
≤25 MHz
±0.10 dB
±0.30 dB
0.05 dB
0.20 dB
0.1°
0.5°
≤40 MHz
±0.30 dB
0.20 dB
0.5°
≤110 MHz
≤110 MHz
±0.50 dB
±0.50 dB
0.30 dB
0.40 dB
1.5°
1.5°
40 MHz
Opt. 40
0.03 to 6.2
Opt. 110
0.07 to 3.0
>3.0 to 6.2
4 μs
3.9 μs
3.7 μs
3.7 μs
*13 RBW= maximum for FMT with Opt. 200.
Local Oscillator Feed-through to Input Connector < –60 dBm
(typical, attenuator = 10 dB)
Frequency
Acquisition
Range (GHz) Bandwidth
17.7 μs
17.5 μs
17.3 μs
17.3 μs
25 MHz
RBW
(kHz)
FFT
Length
Spectrums
/sec
10000
1000
300
100
30
20
5000
1000
300
100
30
20
10
3800
1000
300
200
1024
1024
2048
4096
16384
32768
1024
1024
1024
2048
4096
8192
16384
1024
1024
1024
1024
292,969
292,969
146,484
73,242
18,311
9,155
292,969
292,969
292,969
292,969
73,242
36,621
18,311
292,969
292,969
292,969
292,969
Minimum Event Duration
100% POI
Opt. 200 plus
Opt. 200
Opt. 09
17.3
19.5
28.5
37.6
134.6
229.2
17.5
19.4
25
37.6
93.6
147.3
194.5
17.4
19.4
25.1
25.7
3.7
5.8
14.8
37.6
134.6
229.2
3.9
5.8
11.4
30.8
93.6
147.3
194.5
4
5.8
11.4
15.4
*10 Amplitude flatness and phase deviation over the acquisition BW, includes RF frequency response.
Attenuator Setting: 10 dB.
*11 High Dynamic Range mode selected.
Minimum RBW, Swept Spans (Opt. 200) – 10 kHz.
www.tektronix.comrsa
11
Datasheet
Minimum FFT Length vs. Trace Length
(Independent of Span and RBW), Opt. 200
DPX® Spectrogram Performance
Trace Length (Points)
Minimum FFT Length
801
2401
4001
10401
1024
4096
8192
16384
Resolution BW Range vs.
Acquisition
Bandwidth
110 MHz (Opt. 110)
55 MHz (Opt. 110)
40 MHz
(Opt. 40/110)
25 MHz
20 MHz
10 MHz
5 MHz
2 MHz
1 MHz
500 kHz
200 kHz
100 kHz
50 kHz
20 kHz
10 kHz
5 kHz
2 kHz
1 kHz
500 Hz
200 Hz
100 Hz
Acquisition Bandwidth (DPX®)
Standard
Opt. 200
RBW (Min)
RBW (Min)
RBW (Max)
640 kHz
320 kHz
320 kHz
20 kHz
10 kHz
10 kHz
10 MHz
5 MHz
5 MHz
214 kHz
107 kHz
53.3 kHz
26.7 kHz
13.4 kHz
6.66 kHz
3.33 kHz
1.67 kHz
833 Hz
417 Hz
209 Hz
105 Hz
52 Hz
13.1 Hz
6.51 Hz
3.26 Hz
1.63 Hz
0.819 Hz
10 kHz
5 kHz
2 kHz
1 kHz
500 Hz
200 Hz
100 Hz
50 Hz
20 Hz
10 Hz
5 Hz
2 Hz
0.1 Hz
0.1 Hz
0.1 Hz
0.1 Hz
0.1 Hz
0.1 Hz
3 MHz
2 MHz
1 MHz
500 kHz
200 kHz
100 kHz
50 kHz
20 kHz
10 kHz
5 kHz
2 kHz
1 kHz
500 Hz
200 Hz
100 Hz
50 Hz
20 Hz
10 Hz
Zero-span Amplitude, Frequency, Phase Performance
(Nominal)
Characteristic
Description
Measurement BW Range 100 Hz to maximum acquisition bandwidth of
instrument
Time Domain BW (TDBW) At least 1/10 to 1/10,000 of acquisition bandwidth, 1 Hz
Range
minimum
Time Domain BW (TDBW) ±1%
Accuracy
Sweep Time Range
100 ns (minimum)
1 s (maximum, Measurement BW >60 MHz)
2000 s (maximum, Measurement BW ≤60 MHz)
Time Accuracy
±(0.5% + Reference Frequency Accuracy)
Zero-span Trigger Timing ±(Zero-span Sweep Time/400) at trigger point
Uncertainty (Power
trigger)
DPX Frequency Display ±100 MHz maximum
Range
DPX Phase Display
±200 Degrees maximum
Range
DPX Waveforms/s
50,000 triggered waveforms/s for sweep time ≤20 μs
12
www.tektronix.comrsa
Characteristic
Description
Span Range
DPX Spectrogram Trace
Detection
DPX Spectrogram Trace
Length
DPX Spectrogram
Memory Depth
100 Hz to maximum acquisition bandwidth
+Peak, –Peak, Avg (VRMS)
801 to 4001
Trace Length = 801: 60,000 traces
Trace Length = 2401: 20,000 traces
Trace Length = 4001: 12,000 traces
Time Resolution per Line 110 µs to 6400 s, user settable
Maximum Recording Time 6.6 seconds (801 points/trace, 110 μs/line) to
vs. Line Resolution
4444 days (801 points/trace, 6400 s/line)
Opt. 200 – Advanced Triggers
Description
Characteristic
DPX Density™ Trigger
Density Range
Horizontal Range
0 to 100% density
0.25 Hz to 25 MHz (Std.)
0.25 Hz to 40 MHz (Opt. 40)
0.25 Hz to 110 MHz (Opt. 110)
Minimum Signal Duration See Minimum Signal Duration for 100% Probability of
Trigger at 100% Amplitude table
for 100% Probability of
Trigger (at maximum
acquisition bandwidth)
RBW = Auto, Trace
Length 801 Points
Frequency Edge Trigger
Range
Minimum Event Duration
Timing Uncertainty
±(½ × (ACQ BW or TDBW if TDBW is active))
12 ns (ACQ BW = 110 MHz, no TDBW, Opt. 110)
25 ns (ACQ BW = 40 MHz, no TDBW, Opt. 40)
40 ns (ACQ BW = 25 MHz, no TDBW, Standard)
Same as Power Trigger Position Timing Uncertainty
Runt Trigger
Runt Definitions
Accuracy
(for trigger levels
>30 dB above noise
floor, 10% to 90% of
signal level)
Positive, Negative
±0.5 dB (level ≥ –50 dB from reference level)
±1.5 dB (from < –50 dB to –70 dB from reference level)
Time-qualified Triggering
Trigger Types and Source Time qualification may be applied to: Level, Frequency
Mask (Opt. 02), DPX Density, Runt, Frequency Edge,
Ext. 1, Ext. 2
Time Qualification Range T1: 0 to 10 seconds
T2: 0 to 10 seconds
Time Qualification
Shorter than T1
Definitions
Longer than T1
Longer than T1 AND shorter than T2
Shorter than T1 OR longer than T2
Holdoff Trigger
Range
0 to 10 seconds
Spectrum Analyzers — SPECMON Series
Digital IQ Output (Opt. 55)
Characteristic
Description
Connector Type
Data Output
MDR (3M) 50 pin × 2
Data is corrected for amplitude and phase response
in real time
Data format
I data: 16 bit LVDS
Q data: 16 bit LVDS
Control Output
Clock: LVDS, Max 50 MHz (150 MHz, Opt. 55) DV
(Data Valid), MSW (Most Significant Word) indicators,
LVDS
Control Input
IQ data output enabled, connecting GND enables
output of IQ data
Clock Rising Edge to Data 8.4 ns (typical, standard), 1.58 ns (typical, Opt. 110)
Transition Time
(Hold time)
Data Transition to Clock 8.2 ns (typical, standard), 1.54 ns (typical, Opt. 110)
Rising Edge (Setup time)
AM/FM/PM and Direct Audio Measurement (Opt. 10)
Characteristics (typical) for input frequencies <2 GHz, RBW: Auto, Averaging: Off,
Filters: Off
Characteristic
Description
Analog Demodulation
Carrier Frequency Range (1/2 × Audio Analysis Bandwidth) to maximum input
(for modulation and audio frequency
measurements)
Maximum Audio
10 MHz
Frequency Span
Audio Filters
Low Pass (kHz)
High Pass (Hz)
Standard
De-emphasis (μs)
File
0.3, 3, 15, 30, 80, 300, and user-entered up to 0.9 ×
audio bandwidth
20, 50, 300, 400, and user-entered up to 0.9 × audio
bandwidth
CCITT, C-Message
25, 50, 75, 750, and user-entered
User-supplied .TXT or .CSV file of amplitude/frequency
pairs. Maximum 1000 pairs
FM Modulation Analysis (Modulation Index >0.1)
FM Measurements
Carrier Power Accuracy
(10 MHz to 2 GHz, –20 to
0 dBm input power)
Carrier Frequency
Accuracy (Deviation:
1 to 10 kHz)
FM Deviation Accuracy
(Rate: 1 kHz to 1 MHz)
FM Rate Accuracy
(Deviation: 1 to 100 kHz)
Carrier Power, Carrier Frequency Error, Audio
Frequency, Deviation (+Peak, –Peak, Peak-Peak/2,
RMS), SINAD, Modulation Distortion, S/N, Total
Harmonic Distortion, Total Non-harmonic Distortion,
Hum and Noise
±0.85 dB
±0.5 Hz + (transmitter frequency × reference frequency
error)
±(1% of (rate + deviation) + 50 Hz)
±0.2 Hz
Characteristic
Description
AM Depth Accuracy
(Rate: 1 to 100 kHz,
Depth: 10% to 90%)
AM Rate Accuracy
(Rate: 1 kHz to 1 MHz,
Depth: 50%)
±0.2% + 0.01 × measured value
±0.2 Hz
Residuals (AM)
THD
Distortion
SINAD
0.16%
0.13%
58 dB
PM Modulation Analysis
PM Measurements
Carrier Power Accuracy
(10 MHz to 2 GHz, –20 to
0 dBm input power)
Carrier Frequency
Accuracy (Deviation:
0.628 rad)
PM Deviation Accuracy
(Rate: 1 to 20 kHz,
Deviation: 0.628 to 6 rad)
PM Rate Accuracy (Rate:
1 to 10 kHz, Deviation:
0.628 rad)
Carrier Power, Carrier Frequency Error, Audio
Frequency, Deviation (+Peak, –Peak, Peak-Peak/2,
RMS), SINAD, Modulation Distortion, S/N, Total
Harmonic Distortion, Total Non-harmonic Distortion,
Hum and Noise
±0.85 dB
±0.2 Hz + (transmitter frequency × reference frequency
error)
±100% × (0.005 + (rate / 1 MHz))
±0.2 Hz
Residuals (PM) (Rate: 1 to 10 kHz, Deviation: 0.628 rad)
THD
Distortion
SINAD
0.1%
1%
40 dB
Direct Audio Input
Audio Measurements
Direct Input Frequency
Range (for audio
measurements only)
Maximum Audio
Frequency Span
Audio Frequency
Accuracy
Signal Power Accuracy
Signal Power, Audio Frequency (+Peak, –Peak,
Peak-Peak/2, RMS), SINAD, Modulation Distortion,
S/N, Total Harmonic Distortion, Total Non-harmonic
Distortion, Hum and Noise
1 Hz to 156 kHz
156 kHz
±0.2 Hz
±1.5 dB
Residuals (Rate: 1 to 10 kHz, Input Level: 0.316 V)
THD
Distortion
SINAD
0.1%
0.1%
60 dB
Phase Noise and Jitter Measurement (Opt. 11)
Residuals (FM) (Rate: 1 to 10 kHz, Deviation: 5 kHz)
Characteristic
THD
Distortion
SINAD
Carrier Frequency Range 1 MHz to maximum instrument frequency
Measurements
Carrier Power, Frequency Error, RMS Phase Noise,
Jitter (Time Interval Error), Residual FM
Residual Phase Noise
See Phase Noise specifications
Phase Noise and Jitter
Minimum Offset from Carrier: 10 Hz
Integration Bandwidth
Maximum Offset from Carrier: 1 GHz
Range
2
Number of Traces
Trace and Measurement Detection: Average or ±Peak
Functions
Smoothing Averaging
Optimization: Speed or Dynamic Range
0.10%
0.7%
43 dB
AM Modulation Analysis
AM Measurements
Carrier Power Accuracy
(10 MHz to 2 GHz, –20 to
0 dBm input power)
Carrier Power, Audio Frequency, Modulation Depth
(+Peak, –Peak, Peak-Peak/2, RMS), SINAD,
Modulation Distortion, S/N, Total Harmonic Distortion,
Total Non-harmonic Distortion, Hum and Noise
±0.85 dB
Description
www.tektronix.comrsa
13
Datasheet
Settling Time, Frequency, and Phase (Opt. 12)*14
Advanced Measurement Suite
Settled Frequency Uncertainty, 95% Confidence (Typical), at Stated
Measurement Frequencies, Bandwidths, and # of Averages
Measurement
Frequency Uncertainty at Stated Measurement
Frequency,
Bandwidth
Averages
110 MHz
10 MHz
1 MHz
100 kHz
Characteristic
1 GHz
Single
Measurement
100 Averages
1000 Averages
10 GHz
Single
Measurement
100 Averages
1000 Averages
20 GHz
Single
Measurement
100 Averages
1000 Averages
2 kHz
100 Hz
10 Hz
1 Hz
200 Hz
50 Hz
10 Hz
2 Hz
1 Hz
1 Hz
0.1 Hz
0.05 Hz
5 kHz
100 Hz
10 Hz
5 Hz
300 Hz
100 Hz
10 Hz
5 Hz
1 Hz
0.5 Hz
0.5 Hz
0.1 Hz
2 kHz
100 Hz
10 Hz
5 Hz
200 Hz
100 Hz
10 Hz
5 Hz
1 Hz
0.5 Hz
0.5 Hz
0.2 Hz
Settled Phase Uncertainty, 95% Confidence (Typical), at Stated
Measurement Frequencies, Bandwidths, and # of Averages
Measurement
Frequency,
Averages
1 GHz
Single
Measurement
100 Averages
1000 Averages
10 GHz
Single
Measurement
100 Averages
1000 Averages
20 GHz
Single
Measurement
100 Averages
1000 Averages
Phase Uncertainty at Stated
Measurement Bandwidth
110 MHz
10 MHz
1 MHz
1.00°
0.50°
0.50°
0.10°
0.05°
0.05°
0.01°
0.05°
0.01°
1.50°
1.00°
0.50°
0.20°
0.10°
0.10°
0.05°
0.05°
0.02°
1.00°
0.50°
0.50°
0.10°
0.05°
0.05°
0.02°
0.05°
0.02°
*14 Measured input signal level > –20 dBm, Attenuator: Auto.
Description
Measurements
Average On Power, Peak Power, Average Transmitted
Power, Pulse Width, Rise Time, Fall Time, Repetition
Interval (seconds), Repetition Interval (Hz), Duty Factor
(%), Duty Factor (Ratio), Ripple (dB), Ripple (%), Droop
(dB), Droop (%), Overshoot (dB), Overshoot (%),
Pulse-Pulse Frequency Difference, Pulse-Pulse Phase
Difference, RMS Frequency Error, Max Frequency
Error, RMS Phase Error, Max Phase Error, Frequency
Deviation, Phase Deviation, Impulse Response (dB),
Impulse Response (Time), Time Stamp
Minimum Pulse Width for 150 ns (standard, Opt. 40), 50 ns (Opt. 110)
Detection
1 to 10,000
Number of Pulses
System Rise Time
<40 ns (standard), <17 ns (Opt. 40), <12 ns (Opt. 110)
(Typical)
Pulse Measurement
Signal Conditions: Unless otherwise stated, Pulse
Accuracy
Width >450 ns (150 ns, Opt. 110), S/N Ratio ≥30 dB,
Duty Cycle 0.5 to 0.001, Temperature 18 °C to 28 °C
Impulse Response
Measurement Range: 15 to 40 dB across the width of
the chirp
Measurement Accuracy (typical): ±2 dB for a signal
40 dB in amplitude and delayed 1% to 40% of the pulse
chirp width*15
Impulse Response
Taylor Window
Weighting
*15 Chirp Width 100 MHz, Pulse Width 10 μs, minimum signal delay 1% of pulse width or 10/(chirp bandwidth),
whichever is greater, and minimum 2000 sample points during pulse on-time.
Pulse Measurement Performance
Pulse Amplitude and Timing
Measurement
Accuracy (Typical)
Average On Power*16
±0.3 dB + Absolute Amplitude Accuracy
±0.4 dB + Absolute Amplitude Accuracy
Average Transmitted
Power*16
Peak Power*16
Pulse Width
Duty Factor
±0.4 dB + Absolute Amplitude Accuracy
±3% of reading
±3% of reading
*16 Pulse Width >300 ns (100 ns, Opt. 110) SNR ≥30 dB.
Frequency and Phase Error Referenced to Nonchirped Signal
At stated frequencies and measurement bandwidths*17, typical.
CF
RMS Freq Err
Pulse to
Pulse Freq
Pulse to
Pulse Phase
2 GHz
10 GHz
20 GHz
2 GHz
10 GHz
20 GHz
±7 kHz
±16 kHz
±40 kHz
±26 kHz
±55 kHz
±200 kHz
±12 kHz
±40 kHz
±110 kHz
±80 kHz
±190 kHz
±560 kHz
±0.3°
±0.75°
±1.8°
±0.5°
±1.2°
±2.6°
Bandwidth
20 MHz
60 MHz
(Opt. 110)
*17 Pulse ON Power ≥ –20 dBm, signal peak at Reference Level, Attenuator = Auto, tmeas – treference ≤ 10 ms,
Frequency Estimation: Manual. Pulse-to-Pulse Measurement time position excludes the beginning and
ending of the pulse extending for a time = (10 / Measurement BW) as measured from 50% of the t(rise) or t(fall).
Absolute Frequency Error determined over center 50% of pulse.
14
www.tektronix.comrsa
Spectrum Analyzers — SPECMON Series
Frequency and Phase Error Referenced to a Linear Chirp
At stated frequencies and measurement
CF
bandwidths*18,
RMS Freq Err
Bandwidth
20 MHz
60 MHz
(Opt. 110)
2 GHz
10 GHz
20 GHz
2 GHz
10 GHz
20 GHz
±7 kHz
±16 kHz
±40 kHz
±26 kHz
±55 kHz
±200 kHz
typical.
Pulse to
Pulse Freq
Pulse to
Pulse Phase
±16 kHz
±40 kHz
±110 kHz
±130 kHz
±370 kHz
±630 kHz
±0.3°
±0.95°
±2.25°
±0.7°
±1.3°
±3.5°
*18 Pulse ON Power ≥ –20 dBm, signal peak at Reference Level, Attenuator = 0 dB, tmeas – treference ≤ 10 ms,
Frequency Estimation: Manual. Pulse-to-Pulse Measurement time position excludes the beginning and
ending of the pulse extending for a time = (10 / Measurement BW) as measured from 50% of the t(rise) or t(fall).
Absolute Frequency Error determined over center 50% of pulse.
Note: Signal type: Linear Chirp, Peak-to-Peak Chirp Deviation: ≤0.8 Measurement BW.
Digital Modulation Analysis (Opt. 21)
Characteristic
Description
Modulation Formats
π/2DBPSK, BPSK, SBPSK, QPSK, DQPSK,
π/4DQPSK, D8PSK, 8PSK, D16PSK, OQPSK,
SOQPSK, CPM, 16/32-APSK, 16/32/64/128/256QAM,
MSK, 2-FSK, 4-FSK, 8-FSK, 16-FSK, C4FM
Up to 80,000 Samples
Analysis Period
Filter Types
Measurement filters
Reference filters
Alpha/B×T Range
Measurements
Symbol Rate Range
Digital (Opt. 21)
Square-root raised cosine, raised cosine, Gaussian,
rectangular, IS-95, IS-95 EQ, C4FM-P25, half-sine,
None, User Defined
Raised cosine, Gaussian, rectangular, IS-95,
SBPSK-MIL, SOQPSK-MIL, SOQPSK-ARTM, None,
User Defined
0.001 to 1, 0.001 step
Constellation, Error Vector Magnitude (EVM) vs. Time,
Modulation Error Ratio (MER), Magnitude Error vs.
Time, Phase Error vs. Time, Signal Quality, Symbol
Table, rho
FSK only: Frequency Deviation, Symbol Timing Error
1 kS/s to 85 MS/s (Modulated signal must be contained
entirely within acquisition BW)
Symbol Rate
Residual EVM (Typical)
QPSK Residual EVM*19
100 kS/s
1 MS/s
10 MS/s
30 MS/s (Opt. 40/110)
60 MS/s (Opt. 110)
<0.35%
<0.35%
<0.5%
<1.5%
<2.0%
256 QAM Residual EVM*20
10 MS/s
30 MS/s (Opt. 40/110)
60 MS/s (Opt. 110)
<0.4%
<1.0%
<1.5%
Offset QPSK Residual EVM*19
100 kS/s
1 MS/s
10 MS/s
<0.4%
<0.4%
<1.3%
S-OQPSK (MIL, ARTM) Residual EVM*21
4 kS/s,
CF = 250 MHz
20 kS/s
100 kS/s
1 MS/s
<0.3%
<0.5%
<0.5%
<0.5%
S-BPSK (MIL) Residual EVM*22
4 kS/s,
CF = 250 MHz
20 kS/s
100 kS/s
1 MS/s
<0.2%
<0.5%
<0.5%
<0.5%
CPM (MIL) Residual EVM*22
4 kS/s,
CF = 250 MHz
20 kS/s
100 kS/s
1 MS/s
<0.3%
<0.5%
<0.5%
<0.5%
2/4/8/16 FSK Residual RMS FSK Error*23
10 kS/s, deviation 10 kHz <0.5%
*19 CF = 2 GHz, Measurement Filter = root raised cosine, Reference Filter = raised cosine,
Analysis Length = 200 symbols.
*20 CF = 2 GHz, Measurement Filter = root raised cosine, Reference Filter = raised cosine,
Analysis Length = 400 symbols.
*21 CF = 2 GHz unless otherwise noted. Reference Filters: MIL STD, ARTM, Measurement Filter: none.
*22 CF = 2 GHz unless otherwise noted. Reference Filter: MIL STD.
*23 CF = 2 GHz. Reference Filter: None, Measurement Filter: None.
www.tektronix.comrsa
15
Datasheet
Adaptive Equalizer
Analog Modulation Analysis Accuracy (Typical)
Characteristic
Description
Modulation
Description
Type
Linear, decision-directed, Feed-forward (FIR) equalizer
with coefficient adaptation and adjustable convergence
rate
BPSK, QPSK, OQPSK, π/2DBPSK, π/4DQPSK, 8PSK,
8DPSK, 16DPSK, 16/32-APSK, 16/32/64/128/256QAM
Raised Cosine, Rectangular, None
AM
±2% (0 dBm Input at Center, Carrier Frequency
1 GHz, 10 to 60% Modulation Depth)
FM
±1% of Span
(0 dBm Input at Center)
(Carrier Frequency 1 GHz, 400 Hz/1 kHz
Input/Modulated Frequency)
PM
±3°
(0 dBm Input at Center)
(Carrier Frequency 1 GHz, 1 kHz/5 kHz
Input/Modulated Frequency)
Modulation Types
Supported
Reference Filters for All
Modulation Types except
OQPSK
Reference Filters for
OQPSK
Filter Length
Taps/Symbol: Raised
Cosine, Half Sine, No
Filter
Taps/Symbol:
Rectangular Filter
Equalizer Controls
Raised Cosine, Half Sine
1 to 128 taps
1, 2, 4, 8
1
Off, Train, Hold, Reset
Flexible OFDM Characteristics (Opt. 22)
Characteristic
Description
Recallable Standards
Parameter settings
WiMAX 802.16-2004, WLAN 802.11 a/g/j
Guard Interval, Subcarrier Spacing, Channel
Bandwidth
Advanced parameter
Carrier Detect: 802.11, 802.16-2004 – Auto-detect;
settings
Manual Select BPSK; QPSK, 16QAM, 64QAM
Channel Estimation: Preamble, Preamble + Data
Pilot Tracking: Phase, Amplitude, Timing
Frequency Correction: On, Off
Summary Measurements Symbol Clock Error, Frequency Error, Average Power,
Peak-to-Average, CPE
EVM (RMS and Peak) for all carriers, plot carriers, data
carriers
OFDM Parameters: Number of Carriers, Guard Interval
(%), Subcarrier Spacing (Hz), FFT Length
Power (Average, Peak-to-Average)
Displays
EVM vs. Symbol, vs. Subcarrier
Subcarrier Power vs. Symbol, vs. Subcarrier
Mag Error vs. Symbol, vs. Subcarrier
Phase Error vs. Symbol, vs. Subcarrier
Channel Frequency Response
Residual EVM
–44 dB (WiMAX 802.16-2004, 5 MHz BW)
–44 dB (WLAN 802.11g, 20 MHz BW)
(Signal input power optimized for best EVM)
Inputs And Outputs
Characteristic
Description
Front Panel
Display
RF Input Connector
Trigger Out
Trigger In
USB Ports
Audio
Touch panel, 10.4 in. (264 mm)
N-type female, 50 Ω
BNC, High: >2.0 V, Low: <0.4 V, output current 1 mA
(LVTTL)
BNC, 50 Ω/5 kΩ impedance (nominal), ±5 V max
input, –2.5 V to +2.5 V trigger level
(2) USB 2.0
Speaker
Rear Panel
10 MHz REF OUT
External REF IN
Trig 2 / Gate IN
GPIB Interface
LAN Interface Ethernet
USB Ports
VGA Output
Audio Out
Noise Source Drive
Digital IQ Out
50 Ω, BNC, >0 dBm
50 Ω, 10 MHz, BNC
BNC, High: 1.6 to 5.0 V, Low: 0 to 0.5 V
IEEE 488.2
RJ45, 10/100/1000BASE-T
(2) USB 2.0
VGA compatible, 15 DSUB
3.5 mm headphone jack
BNC, +28 V, 140 mA (nominal)
2 connectors, LVDS (Opt. 55)
RF Field Strength and Mapping
Characteristic
Description
RF Field Strength
Signal Strength Indicator
Measurement Bandwidth
Tone Type
Located at right-side of display
Up to 110 MHz, dependent on span and RBW setting
Variable frequency
Mapping
Map Types Directly
Supported
Saved Measurement
Results
16
www.tektronix.comrsa
Pitney Bowes MapInfo (*.mif), Bitmap (*.bmp)
Measurement data files (exported results)
Map file used for the measurements
Google Earth KMZ file
Recallable results files (trace and setup files)
MapInfo-compatible MIF/MID files
Spectrum Analyzers — SPECMON Series
Ordering Information
General Characteristics
Characteristic
Temperature Range
Operating
Storage
Warm-up Time
Altitude
Operating
Nonoperating
Relative Humidity
Operating and
nonoperating
(80% RH max when
accessing DVD)
Vibration
Operating
Nonoperating
Shock
Operating
Nonoperating
Safety
Electromagnetic
Compatibility,
Complies with:
Power Requirements
Power Consumption
Data Storage
Calibration Interval
Warranty
GPIB
Description
SPECMON3
Real Time Signal Analyzer, 1 Hz to 3 GHz
+5 °C to +40 °C
–20 °C to +60 °C
20 min.
SPECMON6
Real Time Signal Analyzer, 1 Hz to 6.2 GHz
Up to 3000 m (approximately 10,000 ft.)
Up to 12,190 m (40,000 ft.)
All Include: Quick-start Manual (Printed), Application Guide (Printed), Printable
Online Help File (on CD), Programmer's manual (on CD), power cord, BNC-N
adapter, USB Keyboard, USB Mouse, Front Cover, One-year Warranty.
90% RH at 30 °C
(No condensation, max wet bulb, 29 °C)
Note: Please specify power plug and language options when ordering.
Options
0.22 GRMS: Profile = 0.00010 g2/Hz at 5-350 Hz,
–3 dB/octave slope from 350-500 Hz,
0.00007 g2/Hz at 500 Hz,
3 Axes at 10 min/axis
CD/DVD operation not specified under vibration
2.28 GRMS: Profile = 0.0175 g2/Hz at 5-100 Hz,
–3 dB/octave from 100-200 Hz,
0.00875 g2/Hz at 200-350 Hz,
–3 dB/octave from 350-500 Hz,
0.00613 g2/Hz at 500 Hz,
3 Axes at 10 min/axis
Product
SPECMON6
Opt. 52
Opt. 53
15 G, half-sine, 11 ms duration. (1 G max when
accessing DVD and Opt. 06 Removable HDD)
30 G, half-sine, 11 ms duration
UL 61010-1:2004
CSA C22.2 No.61010-1-04
EU Council EMC Directive 2004/108/EC
EN61326, CISPR 11, Class A
90 VAC to 264 VAC, 50 Hz to 60 Hz
90 VAC to 132 VAC, 400 Hz
450 W max
Internal HDD (Opt. 59), USB ports, DVD-R / CD-RW
(Opt. 57), Removable HDD (Opt. 56)
One year
One year
SCPI-compatible, IEEE488.2 compliant
Options
SPECMON3
Opt. 55
Opt. 09
Opt. 10
Opt. 11
Opt. 12
Opt. 21
Opt. 22
Opt. 40
Opt. 110
Opt. 200
RSA56KR
Description
Real Time Spectrum Analyzer,
1 Hz-3 GHz, internal preamplifier,
25 MHz real-time bandwidth, pulse
analysis suite, removable solid state
drive, 3-year warranty
Real Time Spectrum Analyzer,
1 Hz-6.2 GHz , internal preamplifier,
40 MHz real-time bandwidth, pulse
analysis suite, removable solid state
drive, 3-year warranty
Frequency Mask Trigger
Memory Extension, 4 GB Acquisition
Memory Total
Digital I and Q output
Enhanced Real Time
AM/FM/PM Modulation and Audio
Measurements
Phase Noise / Jitter Measurement
Settling Time (Frequency and Phase)
General Purpose Modulation Analysis
Flexible OFDM Analysis
40 MHz Acquisition Bandwidth
(SPECMON3 only)
110 MHz Acquisition Bandwidth
Advanced Triggers, Swept DPX,
and DPX Zero Span
Rackmount for RSA5K, RSA6K,
SPECMON Real-Time Analyzers
Physical Characteristics
Dimensions
mm
in.
Height
Width
Depth
282
473
531
11.1
18.6
20.9
Weight
kg
lb.
With All Options
24.6
54
Note: Physical characteristics, with feet.
Accessories
Accessory
Description
Supports TekConnect® probes P7225, P7240,
P7260, P7330, P7313, P7313SMA, P7340A,
P7350, P7350SMA, P7360A, P7380A, P7380SMA,
P7500 Series
RSAVu
Software based on the RSA3000 Series platform for
analysis supporting 3G wireless standards, WLAN
(IEEE802.11a/b/g/n), RFID, Audio Demodulation, and
more measurements
E and H Near-field Probes For EMI troubleshooting. 119-4146-xx
Additional Removable
Windows 7 and instrument SW preinstalled.
Hard Drive
065-0939-xx
016-2026-xx
Transit Case
Rackmount Retrofit
RSA56KR
071-3064-xx
Additional Quick Start
User Manual (Paper)
RTPA2A Spectrum
Analyzer Probe Adapter
compatibility
www.tektronix.comrsa
17
Datasheet
International Power Plugs
Option
Description
Opt.
Opt.
Opt.
Opt.
Opt.
Opt.
Opt.
Opt.
Opt.
Opt.
Opt.
North America power
Universal Euro power
United Kingdom power
Australia power
240 V, North America power
Switzerland power
Japan power
China power
India power
Brazil power
No power cord or AC adapter
A0
A1
A2
A3
A4
A5
A6
A10
A11
A12
A99
Service
Option
Description
Opt.
Opt.
Opt.
Opt.
Opt.
Opt.
Opt.
Single Calibration or Functional Verification
Calibration Service 3 Years
Calibration Service 5 Years
Calibration Data Report
Calibration Data Report 3 Years (with Opt. C3)
Calibration Data Report 5 Years (with Opt. C5)
Complete Care 3 Years (includes loaner, scheduled
calibration and more)
Complete Care 5 Years (includes loaner, scheduled
calibration and more)
Repair Service 3 Years
Repair Service 5 Years
CA1
C3
C5
D1
D3
D5
G3
Opt. G5
Opt. R3
Opt. R5
Upgrades
SPECMONUP – Upgrade Options for SPECMON3 /
SPECMON6
SPECMONUP
Opt. 52
Opt. 53
Opt. 55
Opt. 09
Opt. 10
Opt. 11
Opt. 12
Opt. 21
Opt. 22
Opt. 40
Opt. 110
Opt. 200
Option Description
Frequency Mask Trigger
Memory Extension, 4 GB Acquisition
Memory Total
Digital IQ Output
Enhanced Real Time
AM/FM/PM Modulation and Audio
Measurements
Phase Noise / Jitter Measurements
Settling Time (Frequency and Phase)
General Purpose Modulation Analysis
Flexible OFDM Analysis
SPECMON3 only: 40 MHz Acquisition
Bandwidth
110 MHz Acquisition Bandwidth
Advanced DPX / Swept DPX with
Density, Time Qualified, and Runt
Triggers and Zero-span DPX
Factory
HW or Calibration
SW Required?
SW
HW
No
No
HW
SW
SW
No
No
No
SW
SW
SW
SW
HW
No
No
No
No
Yes
HW
HW
Yes
No
Languages
Option
Description
Opt.
Opt.
Opt.
Opt.
English Manual
Japanese Manual
Simplified Chinese Manual
Russian Manual
L0
L5
L7
L10
Tektronix is registered to ISO 9001 and ISO 14001 by SRI Quality System Registrar.
Product(s) complies with IEEE Standard 488.1-1987, RS-232-C, and with Tektronix
Standard Codes and Formats.
18
www.tektronix.comrsa
Spectrum Analyzers — SPECMON Series
www.tektronix.comrsa
19
Datasheet
Contact Tektronix:
ASEAN / Australasia (65) 6356 3900
Austria 00800 2255 4835*
Balkans, Israel, South Africa and other ISE Countries +41 52 675 3777
Belgium 00800 2255 4835*
Brazil +55 (11) 3759 7627
Canada 1 800 833 9200
Central East Europe and the Baltics +41 52 675 3777
Central Europe & Greece +41 52 675 3777
Denmark +45 80 88 1401
Finland +41 52 675 3777
France 00800 2255 4835*
Germany 00800 2255 4835*
Hong Kong 400 820 5835
India 000 800 650 1835
Italy 00800 2255 4835*
Japan 81 (3) 6714 3010
Luxembourg +41 52 675 3777
Mexico, Central/South America & Caribbean 52 (55) 56 04 50 90
Middle East, Asia, and North Africa +41 52 675 3777
The Netherlands 00800 2255 4835*
Norway 800 16098
People’s Republic of China 400 820 5835
Poland +41 52 675 3777
Portugal 80 08 12370
Republic of Korea 001 800 8255 2835
Russia & CIS +7 (495) 6647564
South Africa +41 52 675 3777
Spain 00800 2255 4835*
Sweden 00800 2255 4835*
Switzerland 00800 2255 4835*
Taiwan 886 (2) 2722 9622
United Kingdom & Ireland 00800 2255 4835*
USA 1 800 833 9200
* European toll-free number. If not accessible, call: +41 52 675 3777
Updated 10 February 2011
For Further Information. Tektronix maintains a comprehensive, constantly expanding
collection of application notes, technical briefs and other resources to help engineers working
on the cutting edge of technology. Please visit www.tektronix.com
Copyright © Tektronix, Inc. All rights reserved. Tektronix products are covered by U.S. and foreign patents,
issued and pending. Information in this publication supersedes that in all previously published material.
Specification and price change privileges reserved. TEKTRONIX and TEK are registered trademarks of
Tektronix, Inc. All other trade names referenced are the service marks, trademarks, or registered trademarks
of their respective companies.
28 Jun 2013
www.tektronix.comrsa
37W-28248-1