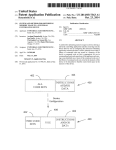
1
CASPER & PHRST Tools User Manual Community Assessment for Public Health Emergency Response A GIS Cluster-Sampling Technique for Random Survey Site Selection Introduction This manual describes the Community Assessment for Public Health Emergency Response (CASPER) methodology, a technique for estimating population characteristics based on surveys at randomly selected sites in a defined study area. The method is based on work by Malilay et al (1996),1 who applied it to estimate post-disaster needs in developing countries. The techniques outlined in this manual are adaptations and modifications of the work of Malilay et al. done by the North Carolina Division of Public Health’s Office of Public Health Preparedness and Response (PHP&R) and NC Public Health Regional Surveillance Team (PHRST) 5. They comprise a series of software programs (the Survey Site Selection Toolkit) that interface with the widely-used geographic information system ArcGIS2 and utilize the software/ArcGIS interface to select sample sites, divide the selected sites among survey teams, determine directions and generate maps for navigating to survey sites, conduct field collection of data, and process data post-collection. The application has been successfully applied by PHP&R and the NC Center for Public Health Preparedness (NCCPHP) in a number of natural disaster situations to estimate (1) the population remaining in affected areas, (2) the numbers of people with specific needs in these areas, and (3) the number of damaged or destroyed structures resulting from a disaster. The method can also be applied to surveys that involve a population’s knowledge and opinions. A recent survey by the NCCPHP, for example, measured the degree of knowledge of H1N1 flu vaccine in two NC counties and generated an estimate of numbers of people who intended to be inoculated. The procedures described in the first sections of this manual assume that the user has experience with ArcGIS and its functionality. For organizations that do not have access to the software, please contact the Spatial Health Assessment Research Program (SHARP) at NCCPHP for assistance via email [email protected] or visit our website; http://nccphp.sph.unc.edu/sharpgis In addition to the site selection methodology for CASPER projects, the Survey Site Selection Toolkit contains routines for (1) generating random points in a polygon, (2) generating sample sites by a grid, 3 and (3) generating random sample sites from a list of addresses or lat-long locations. CASPER Methodology – An Outline The CASPER methodology is based on accurate, up-to-date and well-organized demographic (census) data, and assumes that such is available for areas in which the method is applied. The methodological description presented in this manual uses US Census Block Groups, the data for which is readily available from a number of sources and has been used successfully by the PHP&R and the NCCPHP in its past 1 2 3 Malilay, J., W. D. Flanders, and D. Brogan. A modified cluster-sampling method for post-disaster rapid assessment of needs. Bulletin of the World Health Organization, 1996, v. 74 (4), pp. 399-405. ArcGIS is a product and trademark of the Environmental Systems Research Institute of Redlands, CA. This methodology is still under development and is not yet operational. 1 Learn more about SHARP and how you can request assistance at: http://nccphp.sph.unc.edu/sharpgis projects. But, other census subdivisions that contain population and housing data, such as Census Tracts or Census Blocks, may be used in CASPER projects.4 The CASPER methodology consists of a five-stage process: (1) development of survey questionnaire and forms, (2) sampling, (3) data collection, (4) data entry, and (5) data analysis. A standard operation guide for CASPER can be found at the Office of Public Health Preparedness and Response website; http://www.epi.state.nc.us/epi/phpr/casper.html. Development of Survey Questionnaire and Forms Development of a survey questionnaire is a critical part of a CASPER project, as it is the document through which the surveyor elicits responses that will generate valid statistical estimates. It is beyond the scope of this manual to instruct users on questionnaire development procedures, and it is not dealt with here. For the non-specialist who wishes to have a quick overview of the subject of questionnaire design, we recommend the following online article and trainings: Questionnaire Design and Surveys Sampling by Dr. Hossein Arsham, University of Baltimore: http://home.ubalt.edu/ntsbarsh/Business-stat/stat-data/Surveys.htm. North Carolina Center for Public Health Preparedness Training Web Site. Designing Questionnaires http://nccphp.sph.unc.edu/training/HEP_IIS3/certificate.php Focus on Field Epidemiology. Vol. 2, Issue 2. Developing a Questionnaire http://nccphp.sph.unc.edu/focus/vol2/issue2/index.htm. For additional information and assistance with developing surveys to be used on mobile devices using mapping software such as ArcPad contact SHARP. Sampling Generating survey sample sites in CASPER involves four steps: 1. A geographic area is defined in which a statistical study will be conducted. This area must comprise one or more US Census Block Groups or other census subdivisions. 2. The Survey Site Selection Toolkit is used to randomly select Census Block Groups in the defined geographic area. Population of the selected Block Groups is proportional to the population of the entire study area. 3. The Toolkit randomly selects sites within each of the selected Block Groups. For the ‘30X7’ technique described by Malilay et al, seven random sites are selected in each of 30 randomly selected Block Groups. The 210 resulting locations comprise the sample sites from which survey data will be collected. 4 For those wishing to use higher resolution Census Block data, we recommend the online article Finding Census 2000 Data by Census Block from the Oviatt Library at the California State University at Northridge available at http://library.csun.edu/mfinley/blockdata.html. 2 Learn more about SHARP and how you can request assistance at: http://nccphp.sph.unc.edu/sharpgis 4. Finally, the Toolkit is used to assign selected sample sites to specific survey teams and to generate maps and driving directions for navigating to the locations. Data Collection Data collection is usually conducted by teams of two persons each.5 The number of teams can be varied to accommodate the timing required to complete the survey. For surveys of 210 samples, the PHP&R and NCCPHP have used 10 teams (each assigned 21 sites), which have typically been able to complete surveys at all sites within 2-3 days. The default data collection method utilizes handheld computers or GPS units equipped with electronic survey forms, which are filled out in the field during one-on-one interviews. The survey forms can be built using the North Carolina Public Health Rapid Survey Builder, ESRI’s ArcPad Studio software, or any one of a number of other commercial survey form generators. Some organizations may prefer to collect data on paper survey forms. Data Entry Following collection in the field, data is uploaded for analysis to a PC with ArcGIS and Epi Info™ software. Data collected on paper survey forms is manually entered into a computer. Data Analysis Data analysis can be conducted using Epi Info™ 3.5.1 software6 (version released April 18, 2008), which is free and downloadable from the website of the Centers for Disease Control and Prevention (CDC).7 Data analysis consists of calculating frequencies from survey questions and projecting to population estimates. Population weighting is applied using the “Complex Samples” procedure in Epi Info™. Frequency proportions generated by Epi-Info™ are multiplied by the survey area population to obtain estimates of population characteristics. Equipment and Materials Needed for a CASPER Survey Conducting a CASPER survey as outlined in this manual requires the following software and equipment components: 1. License to the ESRI geographic information system ArcGIS, version 9.2 or 9.3. 2. License to ESRI’s ArcPad mapping software will be needed to provide maps of survey sites, navigation and data input on handheld GPS units or handheld pocket-PCs. 3. An electronic survey form builder, such as the North Carolina Public Health Rapid Survey Builder, which is available free of charge from PHP&R. Alternatively, ESRI’s ArcPad Application Builder can be used to build more complex survey forms that have additional functionality. 4. Epi Info™ 3.5.1 software or another appropriate program for data analysis. 5 6 7 Two persons per team is highly recommended for (1) safety while interviewing in unfamiliar areas, (2) assistance in navigating to survey sites and (3) interpreting and capturing survey responses. “Epi Info” is a trademark of the Centers for Disease Control and Prevention. http:www.cdc.gov/epiinfo/downloads.htm 3 Learn more about SHARP and how you can request assistance at: http://nccphp.sph.unc.edu/sharpgis 5. Handheld GPS units with Windows Mobile Operating System (version 5.0, 6.0 or 6.1). These units can be loaded with ArcPad and a street map layer and used to navigate to the survey sites and for field data input. Alternatively, a pocket-PC with Windows Mobile Operating System can be loaded with ArcPad for field data collection, and an independent GPS unit can be used for navigating to survey sites. 6. The following datasets, all of which are available on a data DVD provided by ESRI to licensees of ArcGIS:8 8 Blkgrp.sdc, A file of US Census Block Groups with very complete attribute data, including population and housing units. Streets.sdc, a detailed file of US streets, roads and highways for navigation to selected survey sites. States.shp, a file of US state boundaries. Counties.shp, a file of US county boundaries. A street address locator, such as US Address Finder Tele Atlas or Street_Addresses_US. The US Address Finder Tele Atlas locator is available on the StreetMap Premium Tele Atlas NA DVD, whereas the Street_Addresses_US locator is available on the ESRI Data & Maps DVD referenced above. For more information on ESRI data files see http://www.esri.com/products/index.html#data_panel. 4 Learn more about SHARP and how you can request assistance at: http://nccphp.sph.unc.edu/sharpgis Section I: Sampling Using the Survey Sites Selection Toolkit Minimum Software and Data Requirements To install the tool you must be running a Windows operating system such as Windows XP or Vista.9 In addition, you will need ESRI ArcGIS 9.x software.10 You must also have a street network and an associated address locator for reverse geocoding the survey points. We recommend using the streets and address locators from StreetMap North America/USA which is part of ESRI Data & Maps released with ArcGIS 8.x and above. Installing the Survey Site Selection Toolkit The toolkit includes installation files for the ArcGIS toolbar PHRST tools and documentation describing installation and use of the tools. All of these files are included in a zipped file called ‘PHRSTools0.9_SHARPgis.’ 1. Download and unzip this file to a convenient folder. 2. The PHRST tools installation files are within the installFiles folder and should contain the following eight files will be extracted: Error.log Install.bat PublicHealth516.dll PublicHealth516.exp PublicHealth516.lib Publichealth516.reg SurveySites.lyr Uninstall.bat 3. If you are running Windows XP simply double-click the Install.bat file in the ‘installFiles’ directory and move on to step 2. For Vista users you must have administrative rights to edit the registry. If you are not an admin on your machine contact your IT person. If you are, do the following; Start, Programs, Accessories, right-click on Command Prompt and choose Run as Administrator. Click continue in the User Access Control window to confirm. Change the path to the location you saved the install.bat file and run the batch file. 4. If successful, the batch fill will generate the following messages; 9 The toolkit has not been tested on Windows 7 or Mac OS running Boot Camp or duel boot. There are known conflicts with Windows XP 64-bit. The toolkit has been tested on ArcGIS 9.2 and 9.3. 10 5 Learn more about SHARP and how you can request assistance at: http://nccphp.sph.unc.edu/sharpgis “DllRegisterServer in PublicHealth516.dll succeeded” Click OK Registry Editor asking you if you trust the source of the .reg - Click Yes “…PublicHealth516.reg…successfully added to the registry” Click OK 5. Now you must load the toolbar in ArcMap. Open ArcMap. 6. Click on the Tools menu and choose Customize. 6 Learn more about SHARP and how you can request assistance at: http://nccphp.sph.unc.edu/sharpgis 7. Under the Toolbars section check the box next to PHRST Tool. 8. The toolbar should appear in ArcMap. Close the customize dialogue and the toolbar is ready for use. Preparing the Required Datasets The following datasets are required for the survey site selection process: Blkgrp.sdc Streets.sdc States.shp Counties.shp World_street_map.lyr (ESRI ArcGIS Online Map Service is optional and for visual reference only) 1. Copy the above files from the ESRI DVD onto your computer’s hard drive. 2. Open a new, blank map document in ArcMap. 3. Add the above five files to the map. Defining a Geographic Study Area 7 Learn more about SHARP and how you can request assistance at: http://nccphp.sph.unc.edu/sharpgis To begin a CASPER project the geographic study area must be defined in which surveys will be conducted. The methodology is based on US Census subdivisions; therefore a study area will be defined by a group of these subdivisions. As mentioned previously, the NCCPHP uses Census Block Groups as its subdivisions, but other census subdivision, such as Census Tracts or Census Block, may be used. The first step is to select the Census Block Groups that constitute the study area. The procedure for selection will differ according to the size and make-up of the area. For entire counties, groups of counties, and states: 1. Use the Select by Attributes function, the attribute tables of the counties shapefile, or the Select Features tool ( ) to select the county or counties included in the study area. Use the States shapefile if the study area is an entire state or group of states. 2. Use the Select by Location function to select all Block Groups that fall within the selected county, counties or state(s). An easy way to do this is from the Selection menu choose Select by Location. You want to select features from Block Group that have their centroid in the features in this layer: County. Check the box next to Block Group, select have their centroid in, choose the County layer and check the box next to Use selected feaures. Click OK For a partial county or partial counties: 1. Use the Select Features tool ( partial counties. ) to select the individual Block Groups within a partial county or 2. Alternatively, if the ID number of the Block Groups is known, the Select by Attributes function may be used or selection may be made from within the Block Group attribute table. 8 Learn more about SHARP and how you can request assistance at: http://nccphp.sph.unc.edu/sharpgis Adding a Street Address Locator The last step before running the site selection process is to add a street address locator to ArcMap. The address locator is a very large file and should be copied locally onto your computer’s hard drive so that it will run faster. 1. Open the Find tool ( ) from the Edit tab on the ArcMap Main Menu bar. 2. Select the Addresses tab in the Find tool dialog box. 3. Use the browse button to navigate to the location of the Street Map Locator files. . 4. Select the Street_Addresses_US.loc file or the US Address Finder Tele Atlas locator and close the Find dialog box. The locator will now be registered and ready to use. Generate Random Survey Sites: The method applied by the NCCPHP in CASPER projects utilizes the two-stage cluster sampling process of Malilay et al. (1996). In the first stage the program randomly selects Census Block Groups from the defined study area, the number selected having been specified by the user. In the second step, a userspecified number of sample sites are randomly selected within each of the randomly selected census divisions. The NCCPHP selects 30 Census Block Groups for its projects and seven sample sites within each Block Group. 1. On the PHRST toolbar choose the Survey Sampling button, open the drop-down menu and choose Generate Random Survey Sites. 9 Learn more about SHARP and how you can request assistance at: http://nccphp.sph.unc.edu/sharpgis This will open the Generate Survey Points dialog box. 2. Specify the Number of Areas and the Number of Surveys to be selected in each area. 3. Using the drop-down menu, select the Boundary Layer to Overlay. This will be the Census Block Group file. 4. Open the Unique ID drop-down menu. This will now list the attribute fields in the Block Group file. Choose the FIPS code, which is the field that uniquely identifies each Block Group. 5. The Accumulation Field is the field that sums the features being surveyed. If the study is selecting individuals to be surveyed, the Accumulation Field is population. Note that the Block Group file contains several different population fields. Choose the field that contains the most recent population data. If the study is to ascertain some aspect of housing in the study area, the Accumulation Field will be numbers of housing units . 6. Click Run after all fields are selected. The time to complete the selection process will vary according to the size of the sample being chosen and the age of your computer. Progress of the selection process can be followed in the lower left-hand corner of the ArcMap status bar. Upon completion of the process, the selected sites will be posted on the map display, and a temporary feature class file of the sites – Survey Sites.lyr - will appear in the map’s table of contents. This file will have two default symbols – Unassigned and Assigned, referring to whether or not the sites have been assigned to survey teams. 10 Learn more about SHARP and how you can request assistance at: http://nccphp.sph.unc.edu/sharpgis 7. Preserve the Survey Sites file for later work by converting it to a shapefile and store it in a convenient folder. Creating the Teams The Group Survey Sites tool on the PHRST Toolbar is used to group the survey sites generated from the previous step and assign them to survey teams. 1. Click the Group Survey Sites button to open the Group Survey Sites dialog box. This is a counter of how many total teams have been assigned This is the name of the next team to be assigned Reset Button: This tool will reset the selected records to unassigned. If no points are selected it resets the entire featureclass to unassigned. This field keeps track of how many features have been assigned and not assigned to teams. Total number of features selected Assign button: Assigns the selected records to a team Team List: List of teams that have already by created. This dockable window is designed to keep track of which survey sites have been assigned to which teams. To begin the process of assignment, the sites to be assigned to a team must be selected by the operator using the Select Features tool, the Select by Location function, or with the Group Survey Sites tool. 11 Learn more about SHARP and how you can request assistance at: http://nccphp.sph.unc.edu/sharpgis With the Group Survey Sites window open the group survey sites button will be active as shown below . With the black cursor arrow, draw a polygon around the sites you want to group. A blue dotted line will appear as you draw you shape as shown above. Double-click to complete the polygon and select the sites. They will become highlighted to illustrate their selection. Clicking the Assign button will assign those selected sites to the Team indicated in the Group Survey Sites window. Alternatively, you can also select the block groups first as outlined below; 1. Using the Select Features tool, select the Block Groups that will be assigned to Team 1. 2. Use the Select by Location to select all of the survey sites that are located in the Block groups to be assigned to Team 1. 3. When all survey sites have been selected for Team 1, click the Assign button on the Group Survey sites dialog box The program now assigns the selected sites to Team 1 and will reset to assign sites to the next team. The total number of sites will be displayed in the Assigned box after each assignment is completed. The total number of unassigned sites will be shown in the Not Assigned box. After each assignment process, the next group of sites must be selected for assignment to the next team. This process continues until all sites have been assigned to a team. Clicking on the Reset button will void all assignments among all teams. 12 Learn more about SHARP and how you can request assistance at: http://nccphp.sph.unc.edu/sharpgis By choosing the Properties tab on in the Group Survey Sites dialog box, the user can access a list of all survey site layers in the map’s table of contents. If more than one survey site layer is generated and added to a map’s table of contents, the user may click the R button in the Target Layer box to refresh the listing. Highlighting a layer in the listing will cause the team site assignments to respond to that layer only. As sites are assigned, their symbology is changed on the map and the team names appear in the Table of Contents. The symbology of each team’s sites may be changed using the Layer Properties dialog. To save this layer as a permanent file you must export the Survey Sites layer to shapefile or as a feature class in a geodatabase. Defining the Staging Area After survey sites have been selected and assigned to teams, the Toolkit can be used to create street routes for the teams to navigate to the sites. The first step in the process is to determine a staging area from which the teams will depart and to which they will return. 13 Learn more about SHARP and how you can request assistance at: http://nccphp.sph.unc.edu/sharpgis 1. Open the Find dialog box in ArcMap. 2. Enter the address of the staging area. 3. Click the Find button. 4. A list of candidate addresses will appear in the list at the bottom of the dialog box. Right click on the candidate address that fits the location you wish to use as the staging area. 5. Choose Add Point in the context menu to add a graphic symbol to the map at the address location. 2. Click Find 1. Enter address 3. Right-Click on the point and then choose Add Point 6. Select the graphic using the Select Elements tool. Make sure the address graphic is the only selected graphic in the map display. 7. On the PHRST toolbar click on the Set Staging Area button. The graphic address location symbol will change to a cross, which is the default staging area symbol. Creating Routes You are now ready to run the Route Survey Sites tool, which will create routes for each team’s assigned sites and put them into individual feature class files. The shapefile created can be imported into the handheld GPS unit or pocket PC and used in conjunction with ArcPad to navigate from one site to the next. 1. Click on the Route Survey Sites button on the PHRST toolbar to open the Make Routes for Teams dialog box. 2. Choose an output folder where the route feature classes will be stored. 14 Learn more about SHARP and how you can request assistance at: http://nccphp.sph.unc.edu/sharpgis 3. To create a text with driving directions to the sites, check the Generate Directions box. 4. To create a folder for each team’s route data, check the box marked Create a folder for each team. Do NOT select this option for now. 5. To add the route shapefiles to the map, check the Add Layers to Map box. 6. To route all teams from and back to the staging area, check the Start and stop the route at the staging area box. 7. To open the Find tool, click on the Locate button. 8. When all options have been chosen, click OK to begin the route creation process. On completion of the process, the routes and stops shapefiles for each team will be posted to the table of contents, and the text directions file will be saved in the folder in which the routes and stops are stored. 15 Learn more about SHARP and how you can request assistance at: http://nccphp.sph.unc.edu/sharpgis Section II Data Collection & Data Entry Setting up the Handheld Computer This section will provide instructions on the steps taken to prepare the handhelds for use in the field. This includes setting up a logical folder structure, the creation of a navigation map, the transfer of data from the mainframe computer onto the handheld’s removable storage card, the preparation of an ArcPad map document on the handheld, and finally the generation of a route to and from interview locations for each field team. The steps outlined below will follow a typical scenario of a rapid needs assessment with 10 survey teams. We will use an example of an assessment of community knowledge and preparedness regarding the H1N1 flu in Orange and Alamance Counties in North Carolina. STEP 1 – Setting up the Folder Structure The final output of Section I is a set of files for each team including a point shapefile of survey locations, a polyline route shapefile and written directions. Setting up the folder structure to organize this data is largely a matter of personal preference. However, there are some best management practices that we recommend you follow. 1. You should create one main project folder holding all data that will be uploaded to the handheld device. In the example below the main project folder is H1N1_OrangeAlamance_082009. 2. Within this main folder you should create four subfolders; backup, form, gps and routeSurveyPoints. 3. If you automatically backup data already the backup folder may not be necessary but it is advisable to make backup copies of both the downloaded gps data and the digital survey instrument (form). 16 Learn more about SHARP and how you can request assistance at: http://nccphp.sph.unc.edu/sharpgis 4. Within the gps folder you should create a download and an upload folder. The download folder will store survey data that has been collected in the field. A separate folder should be created for each team and a folder for each day that survey data is collected. Alternatively the downloaded shapefile can be renamed after each day to the date of collection. Files that will be uploaded or transferred to the mobile devices should be kept in the upload folder. This includes the digital survey instrument, the navigation map described below, and the geocoding and routing file (.grf) for each survey team. 5. The routeSurveyPoints folder will contain the route and point locations for all of the surveys for each team. These are the files that were created in the Creating Routes step of Section 1 using the Route Survey Sites tool. STEP 2 – Create Navigation Map In order to create a navigation map you will need to have access to the ESRI StreetMap Premium Tele Atlas data and the ArcPad 8.0 installation DVD. 1. Copy Streetmap Premium Tele Atlas data from the DVD to your computer. 2. Locate and run the Streetmap Data Extractor (DDA.exe) on the ArcPad 8.0 DVD. The Data Extractor and the Read Me file can also be downloaded from ESRI Support; http://support.esri.com/index.cfm?fa=downloads.samplesUtilities.viewSample&PID=26&MetaID=1397 3. From the data extractor window click the open folder and navigate to and choose the _navi_na.navmap. 4. Use the navigation buttons to zoom into your area of interest. 5. If you are limiting your survey by county then highlight ‘counties’ under the option to ‘Select features from:’ 6. Using the select features tool select the counties you want to survey as well the immediately adjacent counties by either clicking and dragging or holding down the shift key 17 Learn more about SHARP and how you can request assistance at: http://nccphp.sph.unc.edu/sharpgis to select multiple counties. For example in the image below we plan on surveying in Durham and Orange Counties but we are selecting all counties that share a border with Durham and Orange. Alamance Orange 7. Next click the Extract Data tool and ‘select extraction boundaries:’ ‘By selected feature(s).’ Choose the upload folder as your output directory and create a new folder (‘Streets_OrangeAlaman’ for example) and then click Extract. 8. A new window will appear and show you your progress as features are extracted from each of the datasets (Cities, Highways, Streets, etc.) Upon completion all tasks should have a green check mark by them and NAVMAP file will be created with the name ‘_navi_na.navmap’ in the output directory. To check for completeness open the new navmap in the data extraction window just like in step 3. 18 Learn more about SHARP and how you can request assistance at: http://nccphp.sph.unc.edu/sharpgis 9. To use this navigation map in ArcPad you will have to copy the entire contents of folder you created (Street_OrangeAlaman in example above) onto your mobile device. STEP 3 – Create Team Geocoding and Routing File (.grf) In this section you will create a .grf file for each team. This file routes teams from a common staging area to each of the survey locations using a gps-equipped handheld device. The first 5 steps may have already been completed if you are continuing on from Section 1. 1. Open ArcMap. 2. Add the stops and route shapefiles for each team (Stops_Team_1.shp, Route_Team_1.shp, etc.) created in the Route Survey Sites (Section 1, Creating Routes) 3. Choose an address locator. Select the find tool and then select the Addresses tab. Choose the Street_Addresses_US.loc file from ESRI Data & Maps or StreetMap USA and then keep the Find dialog open. 4. Add a staging area. See Section I, Defining the Staging Area, if this has not already been done. 5. Add the Street.sdc layer from Streetmap North America to ArcMap. 6. Activate the StreetMap toolbar by right-clicking in the toolbar area of ArcMap and selecting StreetMap. The following icon should appear; . 19 Learn more about SHARP and how you can request assistance at: http://nccphp.sph.unc.edu/sharpgis 7. Your map document should appear similar to the image below; StreetMap toolbar Team Stops .shps Add data Choose an Address Locator using the following tool StreetMap Streets layers Staging Area 8. Ensure that the Staging Area is selected by using the select elements tool . If selected the black plus sign should have light blue dotted box surrounding it as shown below. 9. Click on the StreetMap toolbar icon . 10. In the StreetMap Find Route window choose Get Points and then in the Get Selected Point Graphic(s). You should see 1. Graphical Pick: with latitude and longitude as the first element in your route. 20 Learn more about SHARP and how you can request assistance at: http://nccphp.sph.unc.edu/sharpgis 11. Next choose Get Points again and this time choose to Get Point Feature(s)… and select the first team. 1. 2. Add staging area using the ‘Get Selected point Graphic’ ‘Get Point Feature’ to select points for team 1 2b. Choose a Team 21 Learn more about SHARP and how you can request assistance at: http://nccphp.sph.unc.edu/sharpgis 12. Select Add Stops. You should have a list of stops such as the following; 2c. After you select Get Points you will have a list of survey sites. 4. Save the list of points 3. Check the box 13. Check the box to Return To the Staging Area. 14. Select Save and save the list of points as Stops_Team01.grf to your \gps\upload folder. 15. Holding down shift, highlight the all the points added from Team 1. Right-click on the highlighted points and select Remove. 16. Repeat steps 11-15 until you have created a .grf file for each team. 22 Learn more about SHARP and how you can request assistance at: http://nccphp.sph.unc.edu/sharpgis STEP 4 – Transfer/Upload Data to Handhelds Using Mircosoft ActiveSync for Windows XP or Windows Mobile Device Center for Windows Vista establish a connection with your mobile device. Disregard any partnership or Set Up messages that Windows prompts you with. Once connected you will want to create project folder on the external storage of the device. Copy and paste the following files to your new project folder; 1. The navigation map created in Step 1. Copy the entire folder (Street_OrangeAlaman from example above). 2. Each team’s .grf file from Step 3 (Team01.grf, Team02.grf, etc.) 3. The digital survey instrument (H1N1_form.shp and all associated files) created using ArcPad Studio, Rapid Survey Builder or a similar program. Consult SHARP for further assistance. STEP 5 – Prepare ArcPad Map Document (.apm) In this step you will add data layers onto your handheld device for use by survey teams in the field. 1. Open ArcPad from the Program window 23 Learn more about SHARP and how you can request assistance at: http://nccphp.sph.unc.edu/sharpgis 2. Tap the Add Layer button and navigate to your project folder. 3. Check the boxes next to your survey’s shapefile and the navigation map. 24 Learn more about SHARP and how you can request assistance at: http://nccphp.sph.unc.edu/sharpgis 4. Next, tap the Table of Contents icon . 5. Make your survey shapefile editable by checking the box under the pencil icon survey shapefile. Tap “OK”. next to your 6. At this point it would be a good idea to save the document. Tap the upper left folder to activate the main toolbar and then tap save map icon . 7. Give the map a name and then change the location to Storage Card from Main Memory. Now choose your folder and tap Save. 25 Learn more about SHARP and how you can request assistance at: http://nccphp.sph.unc.edu/sharpgis STEP 6 – Route Generation In this step you will load the .grf file and create an optimized route. NOTE: This step will need to done on the day of the survey and as the results of this step are not stored when the handheld is powered down. 1. Tap the StreetMap icon to activate the StreetMap toolbar. 2. Then tap the StreetMap Preference button. Preferences StreetMap Toolbar 3. Now tap the Locations File tab at the bottom of the dialog and set the location of the GRF file. 4. Select the Stops_Team01.grf file located on the storage card and tap “OK.” Now you should see the team stops displayed on the map. 26 Learn more about SHARP and how you can request assistance at: http://nccphp.sph.unc.edu/sharpgis 5. In this step, you will be using the GPS receiver to route the survey teams to their assigned data collection points. First you must create the route between stops. To do this, tap the StreetMap icon again to activate the StreetMap toolbar. 6. Now tap the drop-down area below the red car icon and tap the green car , Create Optimized Route. 7. As the route is generated you will first see the Finding route… dialog. 27 Learn more about SHARP and how you can request assistance at: http://nccphp.sph.unc.edu/sharpgis 8. Next you will see the Updating driving directions … 9. When complete you will see a set of driving directions beginning from the staging area and you will also see a green route highlighting the roads to travel on. 10. The driving directions can be minimized or shown by tapping the Driving Directions 11. To X-out the point labels use the Find Location tool the address of the point after X’ing it out. 28 icon. . This tool can also be used to bring up Learn more about SHARP and how you can request assistance at: http://nccphp.sph.unc.edu/sharpgis You must complete STEP 4 – Transfer/Upload Data to handhelds, Step 5 - Prepare ArcPad map document and STEP 6 – Route generation for each handheld device for each team. Step 6 must be completed the day of the planned survey as the route is not stored on the mobile device when powered down. Steps 1-5 should be completed ahead of time. When these steps have been completed, each team will have their own set of stops containing an optimized route along with written driving directions. STEP 7 – Survey Collection The following steps will be completed by the survey teams as they navigate to their stops. 1. First the teams must activate their GPS by tapping the GPS Active icon on the Main toolbar. 2. After activating the GPS a red circle with a line will appear as well as a red status bar at the bottom saying No Fix. The GPS will take several minutes to acquire satellites. 29 Learn more about SHARP and how you can request assistance at: http://nccphp.sph.unc.edu/sharpgis 3. As satellites are acquired the red circle and line will become a red circle with yellow crosshairs. As you move a triangle at the end of the circle will indicate the direction you are moving in. 4. Once a survey team arrives at a stop it will approach the nearest household to that point. If there are no households within sight, the team will proceed to the next stop on its route. 5. Upon approaching a household, the team will use the Capture Point using GPS open the survey. This button is on the Edit toolbar Edit Toolbar Capture Point Using GPS 30 Learn more about SHARP and how you can request assistance at: http://nccphp.sph.unc.edu/sharpgis button to 6. After tapping Capture Point using GPS , your survey form will open. By including a script file certain fields can be automatically captured as shown below in gray (date, time, cluster, etc.). 7. Make sure to complete every question in the survey and tap OK. Tapping X will close the survey and not save the results. Again with some scripting you can prevent the form from being inadvertently closed by prompting the user with the following page; 31 Learn more about SHARP and how you can request assistance at: http://nccphp.sph.unc.edu/sharpgis Section III Data Download and Post-Processing Once the interview teams have completed all of the required surveys, the data can then be downloaded to your desktop or laptop and post-processed in ArcGIS. This section will provide instructions on how to download the data after all surveys have been completed and then merged together into one file. To ensure that no data is lost, it is recommended that you follow these steps at the end of each day of survey work. 1. Establish a connection between your handheld device and computer. 2. Locate and copy all of the associated files of your survey shapefile. Paste these files into your project folder under \gps\download\Team_1\day1 or the appropriate day folder. 3. Repeat these two steps for all of your handheld devices. 4. After the final day of surveying you need to rename each team shapefile to include the team name. To rename the shapefiles from the final day of survey collection open ArcCatalog. 5. Right-click and rename or click twice on the shapefile to change the name of each shapefile. 6. Open ArcMap and add all of your team final shapefiles. 32 Learn more about SHARP and how you can request assistance at: http://nccphp.sph.unc.edu/sharpgis 7. Open ArcToolBox Tools, General. and then locate and open the Merge tool within Data Management 8. Highlight all of the team shapefiles from the table of contents, as shown above, and click and drag these files onto the Merge tool window. Your team shapefiles will show up here after you drag and drop them from the ArcMap table of contents Drag and drop the files anywhere in this box 9. Change the name and the output directory under the Output Dataset section. Name the file H1N1_FinalSurveys.shp and place it in the gps folder. 33 Learn more about SHARP and how you can request assistance at: http://nccphp.sph.unc.edu/sharpgis 10. Your are now ready to ‘clean’ the data by removing empty records and ensuring that all fields recorded values. 11. With your newly merged final survey shapefile in ArcMap start an editing session. If the Edit toolbar is not already in ArcMap you will need to right-click on any tool bar and select Editor. 12. On the Edit toolbar choose Start Editing and then choose the source that contains your final survey shapefile. DO NOT EDIT the raw survey data from each team as these will serve as a backup if you need to undo any editing changes. 13. Right click on your final survey shapefile and choose Open Attribute Table. 14. Eliminate any fields which contain no data or a partially completed survey. You can do this by selecting the record in the attribute table and hitting delete on the keyboard or by right-clicking on the record and choosing Delete Selected. Blank record to delete 15. You should also look through the columns to make sure there are no missing data. 16. During the process routinely click Save Edits on the Editor toolbar. When you have finished Save Edits and then Stop Editing. 34 Learn more about SHARP and how you can request assistance at: http://nccphp.sph.unc.edu/sharpgis