1
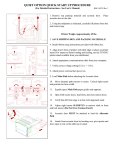
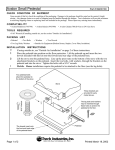
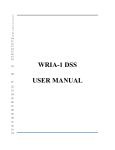
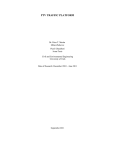
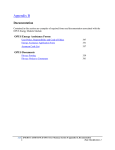
Washington State Biomass Calculator User Manual Version 1.0 – August 8, 2012 1 Table of Contents About............................................................................................................................................................. 4 Usage............................................................................................................................................................. 4 Introduction .............................................................................................................................................. 4 Understanding the Calculator ................................................................................................................... 6 Harvest Model Tab ................................................................................................................................ 7 Geography Tab .................................................................................................................................... 10 Facilities Tab........................................................................................................................................ 11 Costs & Prices Tab ............................................................................................................................... 12 Options Tab ......................................................................................................................................... 14 Results Tab .......................................................................................................................................... 15 Altering Options .................................................................................................................................. 16 Case Studies ................................................................................................................................................ 17 Use Case 1: Facility Fuelshed .................................................................................................................. 17 Harvest Model Tab .............................................................................................................................. 17 Geography Tab .................................................................................................................................... 18 Facilities Tab........................................................................................................................................ 19 Costs & Prices Tab ............................................................................................................................... 20 Options Tab ......................................................................................................................................... 21 Results Tab .......................................................................................................................................... 22 Use Case 2: Available Biomass in a Watershed ...................................................................................... 23 Harvest Model Tab .............................................................................................................................. 23 Geography Ta b ................................................................................................................................... 24 Facilities Tab........................................................................................................................................ 25 Costs & Prices Tab ............................................................................................................................... 26 Options Tab ......................................................................................................................................... 27 Results Tab .......................................................................................................................................... 28 Use Case 3: Examining Effects of adding a new Facility.......................................................................... 29 Harvest Model Tab .............................................................................................................................. 29 Geography Ta b ................................................................................................................................... 29 Facilities Tab........................................................................................................................................ 30 Costs & Prices Tab ............................................................................................................................... 32 2 Options Tab ......................................................................................................................................... 33 Results Tab .......................................................................................................................................... 34 Contact Us ................................................................................................................................................... 37 3 About The Washington State Biomass Calculator was developed as part of the Washington Department of Natural Resources' (DNR) Forest Biomass Supply Assessment project and is available at: http://wabiomass.cfr.washington.edu. This user manual is designed to give you a general understanding of the features of the Calculator and is not a substitute for reading the full report. The final report available on the DNR project website at: http://www.dnr.wa.gov/Publications/em_finalreport_wash_forest_biomass_supply_assess.pdf. Usage Introduction The Washington State Biomass Calculator is designed to allow you to access the same data and analytical tools that supported the Washington State Biomass Supply Assessment. In order to use the Calculator properly an understanding of the terminology and how the underlying data and analysis were constructed is necessary. Figure 1 shows the allocation of material from a forest harvest operation into merchantable stem volume and biomass starting from left to right. Biomass on a parcel began as the volume of slash that was produced as a byproduct of a forest operation. Biomass was everything generated as part of the timber harvest process including tops, live/dead branches, and foliage, and included breakage and defect associated with stem volume. This biomass was classified as post-timber harvest biomass. Posttimber harvest biomass was then allocated to either potential market or non-market uses. The biomass that was brought to the landing and roadside was calculated and recorded in the biomass database as harvested biomass. The volume that was left scattered in the woods as a product of having been broken off or tops and limbs cut when commercial logs were yarded to the landing was noted as residual harvested biomass. Biomass that reached the landing and roadside was filtered by operability constraints for each ownership and forest type, and became either potential market biomass or residual potential market biomass. The potential market biomass represented the amount that could be potentially loaded onto a truck. The residual potential market biomass was the portion that did not get loaded due to operability constraints (equipment cannot be brought in) or other factors such as landowner preferences (the landowner does not want to sell their biomass). The potential market biomass was the volume that was subject to market valuation and was furthered filtered by economic parameters. Market biomass was the portion of the potential market biomass that actually was loaded on a truck. Some market residual was produced when costs considerations were included. This residual was noted as residual market biomass. The accounting was complete when the volume of biomass reaching the market was recorded. 4 Figure 1. The progression of biomass from forest slash (upper rectangle) to market (lower rectangle). The numbers in boxes represent statewide volume calculated for 2010. The Biomass Calculator reports three biomass numbers: scattered biomass, roadside biomass, and market biomass. Scattered biomass is residual harvested biomass: the volume that was left scattered in the woods as a product of having been broken off or tops and limbs cut when commercial logs were yarded to the landing. Scattered biomass does not include pre-existing biomass that was on-site before timber harvest activity. Roadside biomass is residual potential market biomass + residual market biomass: the portion that did not get loaded due to operability constraints (equipment cannot be brought in), other factors such as landowner preferences (the landowner does not want to sell their biomass), it’s too dirty, or it’s a left since it wouldn’t be enough to fill a truck. The Biomass Calculator also reports residual value. Residual Value is the value of the market biomass at the given price, after all costs of getting the biomass to a facility have been taken into account. This could be considered the landowner profit for selling biomass to market. It is often economically viable to send biomass to multiple facilities, so biomass is always routed to the facility that maximizes residual value. Scattered biomass and roadside biomass are only reported for parcels where biomass harvest occurs and residual value is positive. Biomass numbers are not reported for any parcel where residual value is negative. 5 Three harvest configurations were developed to assess how the volume of market biomass produced might change under alternative future views of economic activity. A conservative outlook included lowering harvest levels to 2.1 billion board feet (BBF) in 2015. This outlook took the view that the economic conditions observed in 2010 further deteriorated to 2015, reaching a stable level in 2015. A midrange harvest outlook raised 2015 harvest levels to 3 BBF annual in an expected response to an economic recovery, then fluctuated around a narrow band as economic conditions might fluctuate. The aggressive harvest outlook created harvest levels that were much more responsive in the short term, reaching 3.7 BBF in 2015, and then falling back slightly, fluctuating around 3.5 BBF (Figure 2). Future levels of harvest are likely to be within the range embodied by these upper and lower outlooks. Figure 2. Three harvest configurations used in the assessment Understanding the Calculator User-defined inputs are entered on a series of tabs. Tabs are ordered sequentially from left to right. You may move forward or backward to change inputs by clicking on the Next and Back buttons. Each time you move from one tab to the next infeasible options are eliminated. Results are calculated when you click on the Run button on the Results tab. 6 Harvest Model Tab There are nine harvest options as well as five, five-year planning periods available in the calculator. This tab lets you select from a drop down list which harvest model and which planning period to use in your calculations. The graph shows harvest volume by owner class across time under the different harvest scenarios. Each harvest model targeted a specific harvested board foot volume for each owner classes by county in each time period. The type of landowner and their associated forest management style and retention levels were taken into account for all harvest models. Implementing the harvest consisted of the following steps: 1) assigning the harvest targets, 2) identifying segments of the landscape that are eligible for timber harvest, 3) summarizing the potential harvest volume up to the parcel level, 4) sorting the eligible parcels (and their component segments) by volume per acre and 5) harvesting parcels starting with the most volume per acre and working down the list until each harvest target is met or the entire eligible land base had been evaluated. Silvicultural treatments were conducted in order of volume removed: final harvests first, then thinning. Standard Harvests The Conservative, Average, and Aggressive Harvest models are based on projecting forward historical harvest data from DNR harvest reports (http://www.dnr.wa.gov/BusinessPermits/Topics/EconomicReports/Pages/obe_washington_timber_har vest_reports.aspx). 7 The Conservative model produced harvest levels slightly above 2 billion board feet (BBF) annually from 2015 through 2030. This model constrained merchantable timber production to levels observed in today’s low markets, due mainly to the most current economic recession. The Average model raised harvest levels to 3 BBF by 2015 and maintained them there for the next three five-year periods. It reflected a conservative recovery from current economic conditions by 2015 by increasing harvest levels in response to greater demand from a recovering economy. The Aggressive model raised timber harvest levels to nearly 4 BBF by 2015, and maintained them at around 3.5 BBF for the next 3 five-year periods. This model was constructed to mimic an optimistic economic recovery. The greatest difference in timber harvest levels occurs in 2015, when the outlook for timber harvest levels doubled from their conservative outlook counterpart. Merchantable Harvest Volume (BBF) 4.5 4.0 3.5 3.0 2.5 Aggressive 2.0 MidRange 1.5 Conservative 1.0 0.5 0.0 2010 2015 2020 2025 2030 Forest Health Harvests We examined three scenarios where forest health and fuels treatments were prescribed on USFS lands in eastern Washington. A Baseline scenario harvested approximately 70 MM board feet across the Okanogan-Wenatchee, Colville and Umatilla (WA) National Forests in eastern Washington annually and reflects current commercial harvest activity. An Increased Acres run doubled the harvest levels to about 140 MM board feet per year, whereas the Aggressive run tripled the commercial harvest activity to around 210 MM board feet per year. The assessment also accounts for baseline and increased noncommercial fuels treatments separately from commercial harvest activities. The noncommercial fuels treatments were identified as stand-alone acres; acres that did not remove any commercial timber volume. Acre targets were used to define the stand-alone, noncommercial fuel treatment acres beginning with a Baseline run figure of 6,400 acres. The Increased and Aggressive runs treated 12,600 and 19,100 acres, respectively. 8 We used two prescriptions separately to examine the impact of forest health treatments on biomass supply with commercial harvest activity: a light thinning regime that removed only material up to a 12 inch diameter limit, and a heavy thinning treatment that reduced stand basal area to 45 square feet per acre. Both prescriptions were run separately within stands that comprised the commercial timber volume portion of the scenario. An individual project designed by the Forest Service would use some combination of treatment prescriptions that generally fall between these two in terms of their intensity. Completing separate scenarios with both sets of prescriptions serves to provide a reasonable range of the potentially available biomass material. Noncommercial fuel treatment stands were managed using only the light thinning regime prescription, removing no commercial material. Under the baseline scenario, the commercial harvest of about 70 MM bf was met using 10,600 acres under the light thinning regime and 6,600 acres under the heavy thinning regime. The Increased run required 21,000 and 12,700 acres to meet the 140 MM bf harvest level using the light and heavy thin prescriptions respectively. The Aggressive run harvested 50,000 and 37,800 acres to meet the 210 MM bf annual harvest level, respectively. All treatments used a 50% operability percentage for federal ownership. Finally, a proximity measure was used to target the highest density and volume stands around developed areas first as indicated by land-use information in the land parcel database. The proximity measure mimics fuel treatment activities that occur along the urban to wildland gradient, targeting those acres that potentially have the highest benefits first. The six forest health models use the Average Harvest model above for all owner classes except Forest Service lands on the east side of the state. More information about harvests can be found in section 2.2 in the report. 9 Geography Tab Biomass calculations can be run for different geographic areas. This tab lets you select the geographic area for your analysis. Selection of a geographic area is a two part process. You first select the Type of area in which you are interested then select a Specific location. You must pick a Specific location. You may pick more than one Specific location by: holding down the “control” key on Windows keyboards or the “Command” key on Apple keyboards then picking your locations with the mouse holding down the “shift” key and selecting the locations with your mouse clicking on a location and then dragging the mouse to another location If you select State, County, Stumpage Value Area, Timbershed, or WRIA as your Type of Area, the biomass within that unit will be calculated. Competition takes place between facilities selected on the Facilities tab, with the biomass going to the facility that maximizes residual value. If you select a Facility as your Type of Area, the biomass available to that facility will be calculated. This could be considered the “fuelshed” for the facility. Competition with other facilities is determined by the facilities selected on the Facilities tab. Competition with other facilities will reduce the amount of biomass available at the facility or facilities you select here on the Geography tab. 10 Facilities Tab Potential biomass supply is determined by analyzing the competition between facilities. Supply to a facility assumes land owners would sell their biomass to the facility that maximizes their Residual Value. If more than one facility has equal Residual Value to the landowner then a single facility from among the equal options is randomly chosen. At least one facility must be selected for any analysis. If a single facility is selected then no competition between facilities is considered. If more than one facility is selected, they will compete with one another for the available biomass. If you selected a facility as your Specific Location on the Geography tab then, it will be pre-selected for you on this list. Facilities that are unavailable because selected Harvest Model and Geography options make them infeasible are greyed-out and cannot be selected. Quick pick groups allow you to switch on groups of facilities rather than selecting each facility individually. Existing facilities are (as of late 2010) active in processing biomass. Proposed facilities do not exist, but have had some amount of siting work done by someone interested in developing biomass processing at those sites, or it has been a biomass or wood processing facility in the past. Hypothetical facilities do not exist but are possible locations where facilities could be developed. 11 Costs & Prices Tab This tab lets you select the Harvest cost model and the Price facilities pay for biomass. There are three costs associated with harvesting all biomass: Mobilization Costs: moving biomass collecting and loading equipment to the site Load/Unload Costs: grinding biomass into the truck and unloading it at the facility Haul Costs: driving the chip van from the site to the facility Since biomass is not brought to the roadside as a result of a commercial timber harvest a fourth cost exists for forest health harvest models: Forest Health Costs: falling and moving trees to the roadside Three cost models are available in the Calculator: Cost Model Low Medium High Mobilization Cost ($/hour) 96 120 144 Load/Unload Cost ($/ton) 21 26 31 12 Haul Cost ($/hour) 76 95 114 Timber Harvest Cost ($/ton) 30 45 60 Prices for biomass can range from $27 to $100 per ton. Each Cost Model has a different minimum price. Biomass cannot be economically delivered to any facility when the price is below the minimum value for a cost model. Biomass is only removed from the site if the price multiplied by the tons of Market Biomass is greater than the cost of getting that Market Biomass to a facility. The model takes into account the minimum tons a chip van would need to carry in order to break even on a trip to a facility, and will only take trips with loads above this threshold. The model will take as many trips as are needed to get all of the economically available biomass off site. At a given cost and price it may be possible that 200 tons on a site would be economically viable but 180 tons would not since the fixed costs of moving equipment to a site are the same regardless of the amount of biomass available. A common question about the Calculator is “why can’t I enter my own cost and price assumptions?” The answer is that allowing users to enter their own cost assumptions would take hours to run. The 1.9 billion records in the database that are the back-end of the calculator have been optimized. Allowing adhoc costs and prices would not be able to talk advantage of that optimization and would bring the database and calculator to a grinding halt for all users. More information about harvest and transportation costs can be found in sections 2.2.10 – 2.2.13 in the report. 13 Options Tab This tab lets you set the final calculator options. Truck haul times were calculated for all models in 10 minute increments out to four hours. By default the calculator uses the maximum four hour haul time. If you would like to restrict the amount of time trucks are allowed to travel, you may enable the Biomass trucking restrictions and choose a shorter haul time from the drop down list. Note that the maximum haul time may only be 10 minutes depending on the selections on previous tabs or that the maximum haul time options could be 20 minutes and 2 hours as there are only biomass suppliers in those two zones around a facility. Your results table can be reported back in various combinations; for example the amount of biomass for a facility coming from each county. The Reporting fields check boxes allow you to choose how your results are summarized. If you check the Facility box, the results indicate biomass from your selected geographic area on the Geography tab that goes to each facility. The other check boxes indicate biomass from your selected geographic area on the Geography tab within each County, Watershed, etc. The different geographic areas have both ID numbers and names for each feature (County, Watershed, etc.). Depending on your needs, the results can be returned with either the ID numbers or names by selecting your preference with the Field Options radio buttons. Reporting results with ID numbers is useful if you plan to download results into a database for further analysis. 14 Results Tab This tab initially displays your selected run parameters. You can hide the run parameters by clicking on Hide run parameters. When you click the Run button, your results are displayed. Depending on the options selected it may take up to two minutes for Calculator to analyze your selected options and display the results. 15 Your run parameters and your results may be downloaded by clicking on the Download parameters and Download results buttons respectively. Tables with full lists of names and ID numbers for all of the geographic areas can be viewed and downloaded by clicking on the Download lookup tables button. The results table, depending on the options you’ve selected, may include any of the following columns: State, County, Facility, Owner Class, SVA, Timbershed, or WRIA. The calculator is designed to filter options as you navigate through the tabs to remove options at each step that will not produce market biomass. It is however still possible, though unlikely, that some combinations of parameters will produce no market biomass on the Results tab. In this scenario, you will receive the error: “No biomass is available using the current geographic, harvest and economic assumptions.” Altering Options After a run has completed, you can go back to any tab and alter inputs for comparison. You can go back to a specific tab by clicking on that tab directly. If you alter any of the inputs you results will be cleared and all tabs to the right will be disabled until you click through using the Next button. Note that changing earlier tabs will affect what options are available on later tabs so direct comparisons may not be possible if an option selected on a previous run is no longer available. 16 Case Studies These case study scenarios walk you through three example use cases of the Washington State Biomass Calculator. Further information about the various options available in each step in the calculator is available in the full manual, or by clicking on the and icons in the calculator. Use Case 1: Facility Fuelshed In this use case we determine the amount of biomass available at a particular facility using the Average Harvest Model in the 2015 Planning Period, paying $50 per bone dry ton. Harvest Model Tab The first step, in all use cases, is to select the Harvest Model and Planning Period in which you are interested. Information about the specific harvests is available by clicking on the icon next to the selected harvest model. The chart displays harvest volumes for each type of land owner for your selected harvest. The light grey cross hatching on the chart shows your selected five year planning period. For this use case we have selected the Average Harvest and the 2015 Planning Period. 17 Geography Tab On this tab, geographic assumptions are entered into the calculator. These assumptions can be either the area from which the biomass is being taken, or the facility to which the biomass is being delivered. You may choose multiple Specific Locations. In this use case we’re interested in the amount of biomass that can get to a specific facility, so select “Facility” in the Type of Area menu, and then select the facility in which you are interested, in this example we’ll use, Wenatchee: Hypothetical (40). 18 Facilities Tab On this tab you can select other facilities that will compete with Wenatchee for biomass. Wenatchee is greyed-out and checked, because you selected it on the Geography tab. If you check any other facilities on this list, biomass will be sent to the facility that provides the highest return to the landowner. This will have the effect of reducing the biomass available in Wenatchee. If you do not check any other facilities, all marketable biomass will be sent to Wenatchee. Quick pick groups at the top of the tab allow you to quickly turn on groups of facilities rather than checking them on or off one by one. If a facility is greyed-out and not checked (there are none in this use case, but it will occur in other cases), no biomass can reach that facility under the assumptions you have entered so far on the Harvest Model and Geography tabs. We are only interested in the biomass available to Wenatchee without competition, so we have not selected any other facilities for this use case. 19 Costs & Prices Tab On this tab you choose which cost model to use and the price paid per bone dry ton delivered to the gate of the facilities. The cost models and prices available in the drop down menus are dependent on values entered on previous tabs. Only options in which some amount of biomass is brought to market are displayed. Your Biomass Harvest Cost selection will change the Biomass Price Paid values available in the list at the right. The various costs for each cost model are displayed below your choice. In this use case, we selected the medium Cost model and a $50 dollar per ton Price. 20 Options Tab On this tab we set the remaining options for the calculator. The Biomass Trucking Restrictions menu allows you to set an upper limit on the distance trucks can travel between a harvest site and a facility. The maximum time calculated was four hours. When this option is disabled, the calculator does not restrict haul times. When enabled, this drop down menu displays available haul times based on the assumptions you entered in previous tabs. The upper limit may be less than four hours. In this particular use case, the maximum haul time is three hours. We will enable this option, and set the limit to the maximum of three hours. The Reporting Fields menu, allows you to choose which reporting fields are returned by the calculator. Available biomass will be summed up to each possible combination of the categories you check here. Facility is checked and greyed-out because you selected the Wenatchee Facility on the Geography Tab. We have chosen to check on County and Owner Class as well. This will tell us the amount of biomass arriving in Wenatchee and what counties and owner classes it came from. The Field Options menu allows us to choose whether we want the results table to use ID numbers or Names for the various fields in the results table. We are choosing Names. 21 Results Tab This tab displays the parameters you’ve selected. These can be minimized by clicking anywhere on the green parameters box. Your parameters can be downloaded to a text file using the “Download parameters” button, which will appear when your results table is created. When you click the Run button, a results table is calculated and returned to you. This may take several minutes. The results table displays bone dry tons of scattered biomass, roadside biomass, and market biomass as well as the total residual value of the market biomass, summed up to each combination of County and Owner Class within the Wenatchee facility’s fuelshed. Because these results are for the Wenatchee facility (selected on the geography tab), the Facility column contains only Wenatchee. Because you selected County and Owner Class as Reporting Fields on the Options tab, all of the County and Owner Class options within range of the Wenatchee facility are reported in the County and Owner Class columns. As an example, Federal lands in Chelan County produced 20,002 bone dry tons of market biomass to the Wenatchee Facility. There were also 31,762 tons of biomass left scattered across the harvest sites and 38,259 tons left in roadside piles for Federal lands in Chelan County. The table with your results can be downloaded to a csv file using the “Download results” button. Lookup tables with names and ID Numbers for each of the Counties, Stumpage Value Areas, Timbersheds, WRIAs, Facilities, and Owner Classes can be viewed and downloaded using the “Download lookup tables” button. 22 Use Case 2: Available Biomass in a Watershed In this use case, we determine the amount of biomass available in a watershed in Eastern Washington using a Forest Health Harvest Model. We will only use existing biomass facilities, a low cost model, and a biomass price of 60 dollars per bone dry ton. Harvest Model Tab The first step, in all use cases, is to select the Harvest Model and Planning Period in which you are interested. Information about the specific harvests is available by clicking on the icon next to the selected harvest model. The chart displays harvest volumes for each type of land owner for your selected harvest. The light grey cross hatching on the chart shows your selected five year planning period. For this use case we have selected the USFS Forest Health – Aggressive Harvest with Heavier Thinning on Eastside Forest Service Lands harvest and the 2025 Planning Period. 23 Geography Tab On this tab, geographic assumptions are entered into the calculator. These assumptions can be either the area from which the biomass is being taken, or the facility to which the biomass is being delivered. You may choose multiple Specific Locations. In this use case we’re interested in the amount of biomass existing in a specific watershed, so select “Watershed (WRIA)” in the Type of Area menu, and then select the watershed in which you are interested, in this example we’ll use, Middle Lake Roosevelt (58). 24 Facilities Tab On this tab you select facilities to which biomass can be sent. No facilities on this list are initially checked. You must select at least one facility. If more than one facility is selected, they will compete with one another, with biomass being sent to the facility that provides the highest return to the landowner. Depending on competition, some of the facilities you select may not receive any biomass. It is not possible for biomass to reach facilities that are greyed-out and not checked under the assumptions you have entered so far on the Harvest Model and Geography tabs. Quick pick groups at the top of the tab allow you to quickly turn on groups of facilities rather than checking them on or off one by one. We are only interested in sending available biomass to existing facilities, so the quick pick value “Existing” was selected, which automatically checked the available, existing facilities. 25 Costs & Prices Tab On this tab you choose which cost model to use and the price paid per bone dry ton delivered to the gate of the facilities. The cost models and prices available in the drop down menus are dependent on values entered on previous tabs. Only options in which some amount of biomass is brought to market are displayed. Your Biomass Harvest Cost selection will change the Biomass Price Paid values available in the list at the right. The various costs for each cost model are displayed below your choice. In this use case, we selected the low cost model and a $60 dollar per ton price. 26 Options Tab On this tab we set the remaining options for the calculator. The Biomass Trucking Restrictions menu allows you to set an upper limit on the distance trucks can travel between a harvest site and a facility. The maximum time calculated was four hours. When this option is disabled, the calculator does not restrict haul times. When enabled, this drop down menu displays available haul times based on the assumptions you entered in previous tabs. The upper limit may be less than four hours. In this particular use case, the maximum haul time is four hours. We will enable this option, and leave the limit at the maximum of four hours. The Reporting Fields menu, allows you to choose which reporting fields are returned by the calculator. Available biomass will be summed up to each possible combination of the categories you check here. Watershed (WRIA) is checked and greyed-out because you selected Watershed as your Type of Area on the Geography Tab. We have chosen to check County and Facility as well. This will tell us the amount of biomass from the selected WRIA arriving at each facility selected on the Facility Tab and what counties it came from. The Field Options menu allows us to choose whether we want the results table to use ID numbers or Names for the various fields in the results table. We are choosing Names. 27 Results Tab This tab displays the parameters you’ve selected. These can be minimized by clicking anywhere on the green parameters box. Your parameters can be downloaded to a text file using the “Download parameters” button, which will appear when your results table is created. When you click the Run button, a results table is calculated and returned to you. This may take several minutes. The results table displays bone dry tons of scattered biomass, roadside biomass, and market biomass as well as the total residual value of the market biomass, summed up to each combination of County and Facility for the Middle Lake Roosevelt watershed. Because these results are for the Middle Lake Roosevelt watershed (selected on the geography tab), the WRIA column contains only Middle Lake Roosevelt. Because you selected County and Facility as Reporting Fields on the Options tab, all of the County and Facility options for the Middle Lake Roosevelt watershed are reported in the County and Facility columns. As an example, the portion of the Middle Lake Roosevelt watershed in Stevens County provided 29,840 bone dry tons of market biomass to the Colville Facility. There were also 36,325 tons of biomass left scattered across the harvest sites and 40,850 tons left in roadside piles for the portion of the Middle Lake Roosevelt watershed in Stevens County that provided biomass to Colville. The table with your results can be downloaded to a csv file using the “Download results” button. Lookup tables with names and ID Numbers for each of the Counties, Stumpage Value Areas, Timbersheds, WRIAs, Facilities, and Owner Classes can be viewed and downloaded using the “Download lookup tables” button. 28 Use Case 3: Examining Effects of adding a new Facility In this use case we examine the effects on biomass availability at several existing facilities when a hypothetical facility is added. We’ll do this by using several counties in southwest Washington, the Conservative Harvest Model, and the 2020 Planning Period. We will need to run the calculator through two scenarios and compare the results. The options on all tabs except the Facilities Tab will be the same for both scenarios. Harvest Model Tab The Harvest Model and Planning Periods are the same for both scenarios. The first step, in all use cases, is to select the Harvest Model and Planning Period in which you are interested. Information about the specific harvests is available by clicking on the icon next to the selected harvest model. The chart displays harvest volumes for each type of land owner for your selected harvest. The light grey cross hatching on the chart shows your selected five year planning period. For this use case we have selected the Conservative Harvest and the 2025 Planning Period. Geography Tab The Type of Area and Specific Locations are the same for both scenarios. 29 In this example, we are selecting multiple counties, which is done in one of several ways: holding down the “control” key on Windows keyboards or the “Command” key on Apple keyboards then picking your specific locations with the mouse holding down the “shift” key and selecting the specific locations with your mouse clicking on a specific location and then dragging the mouse to another specific location We will select seven counties: Cowlitz (8), Grays Harbor (14), Lewis (21), Mason (23), Pacific (25), Thurston (34), and Wahkiakum (35). Facilities Tab In order to examine the effect of a new facility coming online, two scenarios must be run, and their results compared. The Facilities Tab is the only tab that is changed between the two scenarios. On this tab you select facilities to which biomass can be sent. No facilities on this list are initially checked. You must select at least one facility. If more than one facility is selected, they will compete with one another, with biomass being sent to the facility that provides the highest return to the landowner. Depending on competition, some of the facilities you select may not receive any biomass. It is not possible for biomass to reach facilities that are greyed-out and not checked under the assumptions you have entered so far on the Harvest Model and Geography tabs. Quick pick groups at the top of the tab allow you to quickly turn on groups of facilities rather than checking them on or off one by one. 30 Scenario 1: existing facilities only For the first scenario, select three existing facilities in the southwest corner of the State, Cosmopolis: Existing, Hoquiam: Existing, and Longview: Existing. 31 Scenario 2: existing facilities with hypothetical facility added When the calculator is re-run for the second scenario, make sure that the three existing facilities from the first scenario: Cosmopolis, Hoquiam, and Longview are still checked. This time also check Morton: Hypothetical. Costs & Prices Tab The Harvest Cost and Price are the same for both scenarios. 32 On this tab you choose which cost model to use and the price paid per bone dry ton delivered to the gate of the facilities. The cost models and prices available in the drop down menus are dependent on values entered on previous tabs. Only options in which some amount of biomass is brought to market are displayed. Your Biomass Harvest Cost selection will change the Biomass Price Paid values available in the list at the right. The various costs for each cost model are displayed below your choice. In this use case, we selected the low cost model and a $45 dollar per ton price. Options Tab The options are the same for both scenarios. 33 On this tab we set the remaining options for the calculator. The Biomass Trucking Restrictions menu allows you to set an upper limit on the distance trucks can travel between a harvest site and a facility. The maximum time calculated was four hours. When this option is disabled, the calculator does not restrict haul times. When enabled, this drop down menu displays available haul times based on the assumptions you entered in previous tabs. The upper limit may be less than four hours. In this particular use case, the maximum haul time is three hours and 40 minutes. We will enable this option, and leave the limit at the maximum of three hours and 40 minutes. The Reporting Fields menu, allows you to choose which reporting fields are returned by the calculator. Available biomass will be summed up to each possible combination of the categories you check here. County is checked and greyed-out because you selected County as your Type of Area on the Geography Tab. We have chosen to check Facility as well. This will tell us the amount of biomass arriving at each facility selected on the Facility Tab and what counties it came from. The Field Options menu allows us to choose whether we want the results table to use ID numbers or Names for the various fields in the results table. We are choosing Names. Results Tab There are two result sets for this use case, one for each scenario. To compare the scenarios, save the results from the first scenario, and then re-run the calculator for the second scenario. 34 This tab displays the parameters you’ve selected. These can be minimized by clicking anywhere on the green parameters box. Your parameters can be downloaded to a text file using the “Download parameters” button, which will appear when your results table is created. When you click the Run button for each scenario, a results table is calculated and returned to you. This may take several minutes. Scenario 1: existing facilities only 35 Scenario 2: existing facilities with hypothetical facility added The result tables display bone dry tons of scattered biomass, roadside biomass, and market biomass as well as the total residual value of the market biomass, summed up to each selected Facility from each selected County. Because these results are for multiple selected Counties (selected on the geography tab), the County column contains multiple counties. Because you selected Facility as Reporting Fields on the Options tab, all of your selected Facility options are reported in the Facility column. Lookup tables with names and ID Numbers for each of the Counties, Stumpage Value Areas, Timbersheds, WRIAs, Facilities, and Owner Classes can be viewed and downloaded using the “Download lookup tables” button. 36 By comparing the result tables from the two different runs, one without the Morton facility, and one with the Morton facility, impacts on supply can be estimated. As an example, Grays Harbor County provided 289,885 bone dry tons of market biomass to the Cosmopolis Facility when the Morton Facility is not included, and 289,227 when Morton is included. The table below displays the differences for all County/Facility combinations. County Facility MarketBiomassTons without Morton MarketBiomassTons with Morton Change Grays Harbor (14) Cosmopolis:Existing (15) 289,885 289,227 (658) Lewis (21) Cosmopolis:Existing (15) 57,449 53,622 (3,827) Mason (23) Cosmopolis:Existing (15) 99,228 90,766 (8,462) Pacific (25) Cosmopolis:Existing (15) 334,331 333,288 (1,043) Thurston (34) Cosmopolis:Existing (15) 33,856 24,484 (9,372) Wahkiakum (35) Cosmopolis:Existing (15) 2,352 2,586 234 Grays Harbor (14) Hoquiam:Existing (13) 319,133 319,791 658 Lewis (21) Hoquiam:Existing (13) 16,972 24,740 7,768 Mason (23) Hoquiam:Existing (13) 82,415 83,994 1,579 Pacific (25) Hoquiam:Existing (13) 19,859 24,374 4,514 Thurston (34) Hoquiam:Existing (13) 25,688 20,669 (5,018) Cowlitz (8) Longview:Existing (2) 313,295 302,048 (11,246) Lewis (21) Longview:Existing (2) 520,608 293,391 (227,217) Pacific (25) Longview:Existing (2) 38,528 35,056 (3,472) Thurston (34) Longview:Existing (2) 68,211 25,583 (42,628) Wahkiakum (35) Longview:Existing (2) 102,442 102,208 (234) Cowlitz (8) Morton:Hypothetical (34) 11,246 11,246 Lewis (21) Morton:Hypothetical (34) 231,466 231,466 Mason (23) Morton:Hypothetical (34) 6,882 6,882 Thurston (34) Morton:Hypothetical (34) 58,757 58,757 2,334,182 9,931 Total 2,324,252 Contact Us For questions about the Forest Biomass Supply Assessment project contact: Rachael Jamison (360) 9021104 ([email protected]) For technical questions about the Washington State Biomass Calculator or its supporting database contact: Luke Rogers ([email protected]) For questions about the research contact John Perez-Garcia ([email protected]) 37