1
1
2
3
4
5
6
7
8
WRIA-1 DSS
9
10
11
12
13
14
15
16
17
18
19
20
21
22
23
24
25
26
27
TECHNICAL
DOCUMENTATION
MANUAL
28
29
30
31
32
33
34
35
36
37
38
39
40
41
42
43
44
45
46
47
48
49
50
51
52
53
54
55
56
57
58
59
60
61
62
63
64
65
66
67
68
69
70
Table of Contents
Installation Technology Overview...................................................................................................1
Detailed Explanation of Installations and Merge Modules..............................................................5
Technical Documentation: The 1D Habitat Viewer .....................................................................21
Technical Documentation: The 2D Habitat Viewer .....................................................................37
Technical Documentation: Best Management Practices Tool ......................................................50
Technical Documentation: the Nooksack DBMS/LaunchPad......................................................56
Technical Documentation: The Habitat Time Series Model ........................................................67
Technical Documentation: Lake Whatcom Water Quality Model ..............................................85
Technical Documentation: Land Cover Changer Tool.................................................................90
Technical Documentation: Land Cover Summarizer Tool..........................................................93
Technical Documentation: The Macroinvertebrate Data Viewer.................................................96
Technical Documentation: The Photo Viewer............................................................................131
Technical Documentation: The Periodicity Viewer/Editor ........................................................140
Technical Documentation: Water Quantity Model.....................................................................154
Technical Documentation: The Temperature and DO Flags Model...........................................167
Technical Documentation: The Time Series Analyst .................................................................178
Technical Documentation: Watershed Characterization Report Generator................................189
Technical Documentation: The Well Log Data Viewer .............................................................236
Technical Documentation: Course Resolution Water Quality Model ........................................245
i
71
72
73
74
Installation Technical Documentation for the WRIA-1 DSS
created by Christopher Michaelis on October 19, 2004
75
Installation Technology Overview
76
77
78
79
80
81
82
83
84
85
86
87
The software we use for installations is explained briefly below.
88
InstallShield Express 5.1
89
90
91
92
93
94
95
96
97
98
99
100
101
102
103
104
105
106
107
108
109
110
Software these days cannot simply be copied to a destination computer and run. Modern
software components are complex and intricate, often having a long list of dependencies which
must be properly installed and registered with windows. In an effort to keep track of software
and dependencies, we have organized the components of the WRIA-1 DSS using pre-built
installation modules (merge modules) and InstallShield installations. There are many software
packages available to help in organizing software to be installed; we have settled on InstallShield
Express 5.1 as an excellent balance of cost and features. We utilize Microsoft Visual Studio to
build merge modules, which is the only significant lack of functionality in InstallShield Express.
InstallShield Express is a product intended specifically for developing installations. These
installations can run on any version of Windows (InstallShield Express 5.1 does not support
Linux or PalmOS or Windows CE).
The installations produced by InstallShield express are capable of installing files to a system,
installing merge modules (see below for a definition of merge modules), creating shortcuts to
files, adding windows registry entries, and performing custom actions (DLL calls or executable
files). InstallShield Express provides some flexibility in configuring the user interface which will
be presented during an installation. The “Express” edition of InstallShield is a bit limited, but the
price tag difference between this and the “Full” edition makes using it very worthwhile. The
features that we’re missing by not using the “Full” edition are basically not having complete and
utter control over the installation process (i.e., changing the order in which dialogs appear,
creating completely new dialogs, or performing special functions during the middle of the
installation). InstallShield Express is also not capable of producing merge modules; we use
Microsoft’s Visual Studio to accomplish this.
InstallShield Express does still allow “Custom Actions” at the end of the installation; a custom
action is a call to an external executable file or DLL. This file can be on the installation media or
installed with the product.
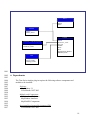
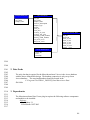
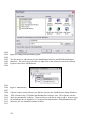
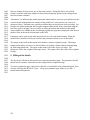
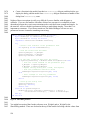
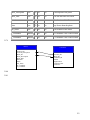
Using InstallShield Express is a fairly straightforward process. On opening the project (the .ise
file), you’ll see a panel on the left-hand side with options such as “Redistributables”, “Files”,
1
111
112
113
114
115
116
117
118
119
120
121
122
123
124
125
126
127
128
129
130
131
132
133
134
135
136
137
138
139
140
141
142
143
144
145
146
147
148
149
150
151
152
153
154
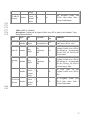
“Custom Actions”, etc. Clicking on each of these in turn will display that option in the main
window. They are each fairly self-explanatory, with the following cautions:
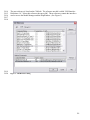
First, “redistributables” refers to merge modules. This is important to point out so that you
realize that this is where the merge modules are selected. The merge modules that appear here
are the modules which are present in the directory C:\Program
Files\InstallShield\Express\Objects. Therefore, after putting together a merge module, in order
for InstallShield to see and use it, you must place the file (*.msm) in that directory.
Secondly, when you build the installation (using the menu option or the toolbar icon), the
installation will build only the last media type which you had selected. If you have configured
more than one media type, they will NOT all be built – you must click on each one in turn, then
click the build icon.
Thirdly, when you’re trying to locate your built installation, it will usually be buried under many
levels of subdirectories. Suppose you’re working with installation X.ise; there will be a
subdirectory entitled X next to X.ise. Under this directory, there will be an Express subdirectory.
Under this directory, there will be a subdirectory for each of the media types that you have built.
Suppose you built a “CDROM” installation; there will be a subdirectory entitled CDROM. In
this subdirectory, there will be about three directories; the one you care about is entitled “Disk
Images”. In this directory, there will be a DISK1, DISK2, and so forth.
Fourthly, if you build an installation which spans multiple disks or CDs, you must label those
CDs to match the subdirectory that the files were in. For example, when burning the files from
DISK1 onto a CD, you must set that CD’s volume label to DISK1. This applies to DISK2,
DISK3, and so forth. If you do not set the volume label of the CD properly, then the installation
will not recognize the CD as being the proper disk. The installation will ask for disk “2”. Even if
the CD you insert has the proper files on it, if the label is not DISK2 the installation will not
accept the CD.
Fifthly, there are a few file restrictions that you need to be aware of. You should never place the
following files in the C:\Program Files\MapWindow\Plugins subdirectory (or any subdirectory
underneath Plugins) :
a. stdole.dll
b. MapWinInterfaces.dll
c. Microsoft.VisualBasic.Compatibility.dll
d. MapWinGIS.ocx
These items may appear in the same directory as MapWindow.exe. Files such as
AxInterop.MapWinGIS.dll and Interop.MapWinGIS.dll can be in the plugins
subdirectory, but not MapWinGIS.ocx itself.
With these tips, you should be able to use InstallShield express fairly easily. If you have
questions on using InstallShield, the software comes with a ‘Quick Start’ guide which can be
quite useful. There is also in-depth documentation available in the help menu.
155
2
156
Merge Modules
157
158
159
160
161
162
163
164
165
166
167
168
169
170
171
172
173
174
175
176
177
178
179
180
181
182
183
184
185
186
187
188
189
190
191
192
193
194
195
196
197
198
199
200
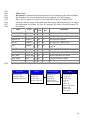
Often, it is desirable to build a reusable installation package for a given component. Take, for
instance, MapWindow 3.1. This software package is used as the basis for a wide variety of
applications and purposes. It doesn’t make sense to put together a MapWindow installation every
time it is needed. To solve this problem, we use Merge Modules.
A merge module is an installation module which is usually self-contained and doesn’t need
anything else to have the complete piece. For instance, the MapWindow merge module contains
the MapWindow software and all of the dependencies that MapWindow needs.
Merge modules are also often used to group together a component and all of that component’s
dependencies. An example of this is the AddFlow flowcharting component. This component is a
single file, but it has a few dependencies. So, this single file and all of its dependencies are
packaged together into AddFlow.msm, which is a self-contained package providing the AddFlow
charting component and everything it needs. Any application which needs this component, then,
can include the merge module in its installation, without needing to worry if all of the
dependencies and such have also been included. This is a great way to modularize components
and simplify a large installation.
One more example of merge modules is the Time Series Analyst merge module. This software
requires MapWindow, since it’s a MapWindow plugin. However, the merge module does NOT
include MapWindow. It does, however, include all of the other dependencies – Gigasoft
Proessentials, Windows components, et cetera. This provides a bit more flexibility – if you want
to put together an installation to give the Time Series Analyst to somebody who you already
know has MapWindow, you could put together an InstallShield installation containing the Time
Series merge module and a database with a few shapefiles, excluding MapWindow on purpose.
If you wanted to give the installation to users without MapWindow, you could simply include the
MapWindow merge module as well.
Using merge modules slows down development slightly in the beginning, as you must decide
what needs to be put into separate merge modules and you must create “wrapper” installations to
hold these merge modules. However, this small time investment in the beginning speeds up
future installations considerably and pays for itself several times over.
Often, you may build a merge module for inclusion in large installations, but you also wish to be
able to install only the component in the merge module without installing other things as well.
The Time Series Analyst is another ideal example of this – sometimes, you may want to install
only the Time Series Analyst. Since a merge module cannot be installed directly, you must create
an InstallShield installation which installs nothing but this merge module. This is referred to as a
“Wrapper” installation for that merge module, since its sole purpose is to wrap that merge
module, making it installable.
Occasionally in this document when describing merge modules, you’ll see a reference to a
“wrapper” installation location. This is showing where a wrapper installation for merge module
has already been created.
3
201
202
203
204
205
206
207
208
209
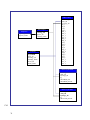
Additionally, a merge module may contain other merge modules. A good example of this is the
Model Manager merge module, which also contains the AddFlow merge module. Suppose that
you had another merge module, X.msm, which also contained the AddFlow merge module; if
you build an InstallShield installation that includes both X.msm and the Model Manager merge
module, InstallShield will automatically detect that AddFlow is included twice and will only use
the files once. This is particularly important with very common components that are duplicated
many times in an installation. This phase of building the installation is called “merging”, hence
the term “merge module”.
210
Visual Studio 2002 (or 2003)
211
212
213
214
215
216
217
218
219
220
221
222
223
224
225
226
227
228
229
230
231
232
233
234
235
236
237
238
239
240
241
242
243
The majority of the software for the WRIA-1 DSS has been created using various versions of
Microsoft’s Visual Studio; the scope of this section is not focused on software, but rather using
Visual Studio for the purpose of building Merge Modules.
Visual Studio can be used to build complete application packages, but I find Visual Studio
severely limited in terms of customizing the installation and making it professional looking. I use
Visual Studio only for merge modules, and this is because InstallShield Express will not build
merge modules. (InstallShield Developer edition will allow you to build merge modules;
however, it is considerably more expensive than InstallShield Express, and Visual Studio, a tool
we already have, can do Merge Modules perfectly well.)
All of the merge modules have been created with Visual Studio 2002, and can therefore be
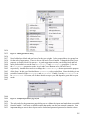
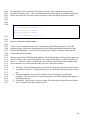
opened with Visual Studio 2002 or 2003. To create a new merge module from scratch, choose
New Project from the File menu. Select “Setup or Deployment” project, then choose Merge
Module. You’ll get an empty list; from here, you may add an executable (dependencies will
automatically be determined and added). You may also add any other file type. Do this by either
dragging a file in, or right-clicking and choosing Add File.
The path which files are configured to install to in the merge module will carry over to the
installation that uses the merge module; the installer using the merge module cannot specify a
different path to install the files, unless you place files in the “retargetable” folder. Therefore,
place the files carefully, paying attention to directory structure.
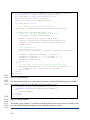
You may change where the merge module output goes by right-clicking on the project in the
right-hand pane. Choose Properties, and you’ll see a window with a text box labeled “Project
output”. Change this to the place you’d like the merge module to go.
Build the merge module by choosing Build from the menu. When the file has been built,
remember to place the resulting .msm in the proper location. For InstallShield Express, this is
“c:\Program Files\InstallShield\Express\Objects”. If you’re using Visual Studio or any other
installation utility, you’ll likely need to place the merge module in “c:\Program Files\Common
Files\Merge Modules”. After rebuilding an existing merge module, simply overwrite the old one.
4
244
245
246
247
248
249
250
251
252
Detailed Explanation of Installations and Merge Modules
Here, all of the installations and merge modules that are used within the WRIA-1 DSS
installation package will be listed and explained. For those components which were built at USU,
the contents of the merge module and the purpose of each file will be listed. Components which
were not built at USU (i.e., Micosoft component merge modules) will list only what that
component is. Be aware that some of the files in these merge modules may change slightly over
time, but the overall contents and purpose will remain the same.
253
WRIA-1 Final Deliverable Standard Edition Installshield Installation
254
255
256
257
258
259
260
261
262
263
264
265
266
267
268
269
270
271
272
273
274
275
276
277
278
279
280
281
282
283
284
285
286
287
(installation\WRIA-1 Final Deliverable Standard\WRIA-1 Final Deliverable.ise)
This is the main “container” for all components, data, and merge modules which need to be
installed with the Nooksack DSS. This InstallShield installation packages everything together
and generates the set of install CDs to be distributed to end users.
This is the Standard edition of the installation, which means that it includes the following
components and objects:
Merge Modules (explanation of these component will follow in this document)
AddFlow Flowchart Components (AddFlow.msm)
DBMS Standard Edition (DBMSStandard.msm)
Gigasoft Proessentials Charting Components (Gigasoft.msm)
MapWindow 3.1 (MapWindow3.1.msm)
Model Manager (Model Manager.msm)
Model Manager Elements (ModelManagerElements.msm)
Macroinvertibrate Data Viewer (MIVViewer.msm)
Physical Habitat Simulation 1D Viewer (PHabSim1DViewer.msm)
Physical Habitat Simulation 2D Viewer (PS2DViewer.msm)
Photo Viewer (mwPhotoViewer.msm)
Time Series Data Analyst (mwTimeSeries.msm)
Watershed Characterization Report (mwWatershedChar.msm)
Well Log Data Viewer (mwWellviewer.msm)
Crystal Reports 8.5 Runtime Components (CrystalReports85.msm)
Crystal Reports .NET Data Access (Crystal_Database_Access2003.msm)
Crystal Reports .NET English (Crystal_Database_Access2003_enu.msm)
Crystal Reports .NET Managed Code (Crystal_Managed2003.msm)
Seagate Crystal Reports Keycode Manager (Crystal_regwiz2003.msm)
Data Access Objects 3.60 (DAO360.msm)
Distributed Component Object Model 95 (DCOM95.msm)
Microsoft Foundations Classes 6.0 Libraries (MFC42.msm)
Microsoft C Runtime Library 6.0 (MSVCRT.msm)
Microsoft C++ Runtime Library 6.0 (MSVCP60.msm)
Microsoft Chart Control 6.0 (MSCHRT20.MSM)
5
288
289
290
291
292
293
294
295
296
297
298
299
300
301
302
303
304
305
306
307
308
309
310
311
312
313
314
315
316
317
318
319
320
321
322
323
324
325
326
327
328
329
330
331
332
333
Microsoft Chart VB Control (VB_Control_mschart_RTL_X86_---.msm)
Microsoft Common Dialog Control 6.0 (COMDLG32.msm)
Microsoft Component Category Manager Library (COMCAT.msm)
Microsoft Data Access Components (MDAC) 2.5 (MDAC25.msm)
MDAC 2.6 (MDAC26.msm)
MDAC 2.7 (MDAC27enu.msm)
Microsoft FlexGrid Control 6.0 (MSFLXGRD.msm)
Microsoft OLE 2.40 for 95/NT4.0 (OLEAUT32.msm)
Microsoft Typelib Information Library (tlbinf32.msm)
Microsoft Windows Common Controls 6.0 (MSCOMCTL.msm)
Microsoft Windows Common Controls-2 6.0 (MSCOMCT2.msm)
OLE Database Access 2.1 (OLEDB21.msm)
SQL Distributed Management Object (SQL-DMO.msm)
Shortcuts
Programs Menu \ MapWindow
MapWindow -> [MAPWINDOW]MapWindow.exe
User’s Guide -> [HELP]MapWindow31.chm
Sample Project -> [United States]UnitedStates.mwprj
Programs Menu \ WRIA-1 DSS
Launch the DSS -> [LAUNCHPAD]DBMS.exe
User Documenation -> [USER_DOCUMENTATION]
Desktop
WRIA-1 DSS LaunchPad -> [LAUNCHPAD]DBMS.exe
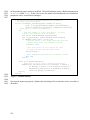
Windows Registry
HKEY_LOCAL_MACHINE \ Software \ Microsoft \ Windows \ CurrentVersion
\ Run \ “Start SQL Server” (String Value)
= “scm –action 1 –service MSSQLServer –silent 1”
\RunOnce \ “AttachAllDatabases” (String Value)
= “C:\Program Files\Microsoft SQL Server\MSSQL\Data\AttachAll.bat
Dialogs Included in Installation
Install Welcome
Setup Progress
Setup Complete Success
Custom Actions
ScheduleReboot (After Setup Complete Success Dialog)
Source Location: Built-In Library Function
MSDEInstaller (After Setup Complete Success Dialog)
Source Location: Installed With Product
File Name: [TempFolder]MSDE\setup.exe
Command Line: (on next line)
INSTANCENAME=MSSQLSERVER BLANKSAPWD=1 SECURITYMODE=SQL
6
334
335
336
337
338
339
340
341
342
343
344
345
346
347
348
349
350
351
352
353
354
355
356
357
358
359
360
361
362
363
364
365
366
367
368
369
370
371
372
Files Installed (Always Install feature)
[ProgramFilesFolder]
\LaunchPad
Nothing installed here, but the path must exist for shortcuts.
The files installed here are put here by the DBMS merge module.
\MapWindow\Help
Again, nothing installed – path is here for shortcuts. The
Merge module installs the needed files.
\MapWindow\Sample Data\UnitedStates
Again, this is for the shortcuts. The MapWindow merge module
Places the sample data here.
\Microsoft SQL Server\MSSQL\Data
These are the databases and the database attachers.
\Microsoft SQL Server\MSSQL\Data\Resources\1033\SQLDMO.rll
This is the English language resource file for SQL Server.
\WRIA-1_DSS\*.*
This is the DSS Data and User Documentation.
[TempFolder]
\MSDE\*.* This is the MSDE installation program
Special Actions
If this installation is going to be used on a computer with multiple users, you’ll need to perform
the following steps:
1. Build the installation normally.
2. Download and install ORCA, a tool for editing installation databases.
http://msdn.microsoft.com/library/default.asp?url=/library/enus/msi/setup/orca_exe.asp
3. Open ORCA. Open the .msi file associated with the installation that you just built.
This will be on the first disk of your installation. This will probably be called
“WRIA-1 Final Deliverable Standard Edition.msi”.
4. Click on the Components table; you’ll see a long list of data.
5. Find the component called “Global_Controls_MSCOMCT2OCX…”. This
component is associated with GUID “3207D1B8-80E5-11D2-B95D006097C4DE24”.
6. Find the “keypath” field for this component. Click into that field, and clear out its
contents. (Clear out only the KEYPATH portion; don’t delete the entire row!)
7. Close and save the .msi file.
8. The installation package may now be safely distributed to end users.
373
374
375
7
376
WRIA-1 Final Deliverable Administrative Edition Installshield Installation
377
378
379
380
381
382
383
384
385
386
387
388
389
390
391
392
393
394
395
396
397
398
399
400
401
402
403
404
405
406
407
408
409
410
411
412
413
414
415
416
417
418
419
420
(installation\WRIA-1 Final Deliverable Administrative\WRIA-1 Final Deliverable.ise)
This is the main “container” for all components, data, and merge modules which need to be
installed with the Nooksack DSS. This InstallShield installation packages everything together
and generates the set of install CDs to be distributed to end users.
This is the Administrative edition of the installation, which means that it includes the following
components and objects:
Merge Modules (explanation of these component will follow in this document)
AddFlow Flowchart Components (AddFlow.msm)
DBMS Administrative Edition (DBMSAdmin.msm)
Gigasoft Proessentials Charting Components (Gigasoft.msm)
MapWindow 3.1 (MapWindow3.1.msm)
Model Manager (Model Manager.msm)
Model Manager Elements (ModelManagerElements.msm)
Macroinvertibrate Data Viewer (MIVViewer.msm)
Physical Habitat Simulation 1D Viewer (PHabSim1DViewer.msm)
Physical Habitat Simulation 2D Viewer (PS2DViewer.msm)
Photo Viewer (mwPhotoViewer.msm)
Time Series Data Analyst (mwTimeSeries.msm)
Watershed Characterization Report (mwWatershedChar.msm)
Well Log Data Viewer (mwWellviewer.msm)
Crystal Reports 8.5 Runtime Components (CrystalReports85.msm)
Crystal Reports .NET Data Access (Crystal_Database_Access2003.msm)
Crystal Reports .NET English (Crystal_Database_Access2003_enu.msm)
Crystal Reports .NET Managed Code (Crystal_Managed2003.msm)
Seagate Crystal Reports Keycode Manager (Crystal_regwiz2003.msm)
Data Access Objects 3.60 (DAO360.msm)
Distributed Component Object Model 95 (DCOM95.msm)
Microsoft Foundations Classes 6.0 Libraries (MFC42.msm)
Microsoft C Runtime Library 6.0 (MSVCRT.msm)
Microsoft C++ Runtime Library 6.0 (MSVCP60.msm)
Microsoft Chart Control 6.0 (MSCHRT20.MSM)
Microsoft Chart VB Control (VB_Control_mschart_RTL_X86_---.msm)
Microsoft Common Dialog Control 6.0 (COMDLG32.msm)
Microsoft Component Category Manager Library (COMCAT.msm)
Microsoft Data Access Components (MDAC) 2.5 (MDAC25.msm)
MDAC 2.6 (MDAC26.msm)
MDAC 2.7 (MDAC27enu.msm)
Microsoft FlexGrid Control 6.0 (MSFLXGRD.msm)
Microsoft OLE 2.40 for 95/NT4.0 (OLEAUT32.msm)
Microsoft Typelib Information Library (tlbinf32.msm)
Microsoft Windows Common Controls 6.0 (MSCOMCTL.msm)
8
421
422
423
424
425
426
427
428
429
430
431
432
433
434
435
436
437
438
439
440
441
442
443
444
445
446
447
448
449
450
451
452
453
454
455
456
457
458
459
460
461
462
463
464
465
466
Microsoft Windows Common Controls-2 6.0 (MSCOMCT2.msm)
OLE Database Access 2.1 (OLEDB21.msm)
SQL Distributed Management Object (SQL-DMO.msm)
Shortcuts
Programs Menu \ MapWindow
MapWindow -> [MAPWINDOW]MapWindow.exe
User’s Guide -> [HELP]MapWindow31.chm
Sample Project -> [United States]UnitedStates.mwprj
Programs Menu \ WRIA-1 DSS
Launch the DSS -> [LAUNCHPAD]DBMS.exe
User Documenation -> [USER_DOCUMENTATION]
Technical Documentation -> [INSTALLDIR]Technical Documentation
Source Code -> [WindowsVolume]Dev
Desktop
WRIA-1 DSS LaunchPad -> [LAUNCHPAD]DBMS.exe
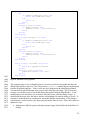
Windows Registry
HKEY_LOCAL_MACHINE \ Software \ Microsoft \ Windows \ CurrentVersion
\ Run \ “Start SQL Server” (String Value)
= “scm –action 1 –service MSSQLServer –silent 1”
\RunOnce \ “AttachAllDatabases” (String Value)
= “C:\Program Files\Microsoft SQL Server\MSSQL\Data\AttachAll.bat
Dialogs Included in Installation
Install Welcome
Setup Type
Setup Progress
Setup Complete Success
Custom Actions
ScheduleReboot (After Setup Complete Success Dialog)
Source Location: Built-In Library Function
MSDEInstaller (After Setup Complete Success Dialog)
Source Location: Installed With Product
File Name: [TempFolder]MSDE\setup.exe
Command Line: (on next line)
INSTANCENAME=MSSQLSERVER BLANKSAPWD=1 SECURITYMODE=SQL
Files Installed (Always Install feature)
[ProgramFilesFolder]
\LaunchPad
Nothing installed here, but the path must exist for shortcuts.
The files installed here are put here by the DBMS merge module.
\MapWindow\Help
9
467
468
469
470
471
472
473
474
475
476
477
478
479
480
481
482
483
484
485
486
487
488
489
490
491
492
493
494
495
496
497
498
499
500
501
502
503
504
505
506
Again, nothing installed – path is here for shortcuts. The
Merge module installs the needed files.
\MapWindow\Sample Data\UnitedStates
Again, this is for the shortcuts. The MapWindow merge module
Places the sample data here.
\Microsoft SQL Server\MSSQL\Data
These are the databases and the database attachers.
\Microsoft SQL Server\MSSQL\Data\Resources\1033\SQLDMO.rll
This is the English language resource file for SQL Server.
\WRIA-1_DSS\*.*
This is the DSS Data and User Documentation.
[TempFolder]
\MSDE\*.* This is the MSDE installation program.
Files Installed (SourceAndTechDocs feature)
[WRIA-1_DSS]
\Technical Documentation\*.*
This is the technical documentation for all reviewable products, including
this document. (May not be present in Alpha releases)
[WindowsVolume]
\Dev\*.*
This is the source code for all reviewable products. (May not be present in
Alpha releases)
Special Actions
If this installation is going to be used on a computer with multiple users, you’ll need to
perform the following steps:
1. Build the installation normally.
2. Download and install ORCA, a tool for editing installation databases.
3. Open ORCA. Open the .msi file associated with the installation that you just built.
This will be on the first disk of your installation. This will probably be called
“WRIA-1 Final Deliverable Administrative Edition.msi”.
4. Click on the Components table; you’ll see a long list of data.
5. Find the component called “Global_Controls_MSCOMCT2OCX…”. This
component is associated with GUID “3207D1B8-80E5-11D2-B95D006097C4DE24”.
6. Find the “keypath” field for this component. Click into that field, and clear out its
contents. (Clear out only the KEYPATH portion; don’t delete the entire row!)
7. Close and save the .msi file.
8. The installation package may now be safely distributed to end users.
507
508
509
10
510
AddFlow Flowchart Components (AddFlow.msm)
511
512
513
514
515
516
517
518
519
520
521
(installation\AddFlow\Merge Module\AddFlow\AddFlow.sln)
This is a merge module built with Visual Studio to provide the AddFlow™ components which
are used by the Model Manager. All of the files in this merge module are installed to the
Windows System directory (usually c:\windows\system32).
Files Included
ADDFLOW3.LIC The file storing the USU AddFlow component license.
AddFlow3.ocx The actual ActiveX AddFlow component.
Mfc42.msm Microsoft Foundations Classes 4.2, an AddFlow dependency.
Msvcrt.msm Microsoft Visual C Runtime Library, an AddFlow dependency.
Oleaut32.msm OLE Automation libraries, an AddFlow dependency.
522
523
DBMS Standard Edition (DBMSStandard.msm)
524
525
526
527
528
529
530
531
532
533
534
535
536
537
538
539
540
541
542
543
544
545
546
547
548
549
550
551
(installation\DBMS\Merge Module\DBMSStandard\DBMSStandard.sln)
(InstallShield Wrapper at installation\DBMS\DBMSStandard.ise)
This is a merge module built with Visual Studio to provide the standard edition of the
DBMS/LaunchPad. This is the Standard edition, meaning it does not allow remote data editing or
LaunchPad reconfiguration. All of the files in this merge module are installed to C:\Program
Files\LaunchPad.
Files Included
Adodb.dll Used for database access (Active Data Object)
axinterop.mscomctl2.dll .NET wrapper for ActiveX component mscomctl2
axinterop.msflexgridlib.dll .NET wrapper for ActiveX component MSFlexGrid
crystal_database_Access_2003.msm Crystal Reports Database Libraries
CrystalDecisions.CrystalReports.Engine.dll Crystal Reports Core Engine
CrystalDecisions.ReportSource.dll Crystal Reports Data Source Locator
CrystalDecisions.Shared.dll Shared Libraries for Crystal Reports
CrystalDecisions.Windows.Forms.dll Form designer for Crystal Reports
CrystalKeyCodeLib.dll Registration Library for Crystal Reports
Dotnetfxredist_x86_enu.msm Suppressed (not installed - .NET Framework)
Dtspkg.dll Used for database management (DTS = Distributed Transactions)
Interop.DTS.dll .NET wrapper for Dtspkg.dll
Interop.MSComCtl2.dll .NET Wrapper for MSComCtl2.dll
Interop.MSFlexGridLib.dll .NET Wrapper for MSFlexGrid
Interop.SQLDMO.dll .NET Wrapper for SQLDMO component
LifestagePlotter.dll .NET Component for editing Fish Lifestage data
Mscomct2.msm Microsoft Common Controls library; used for animation controls
Msflxgrd.msm Microsoft FlexGrid control; used for data editing interface
SQLDMO.dll SQL Distribted Management Object – used to manage SQL Server
11
552
553
554
555
556
557
Stdole.dll Standard OLE interface library
DBMS.conf DBMS Configuration File (prebuilt for Nooksack)
DBMS.exe DBMS Executable itself – Standard Edition
DBMS.pdb DBMS Program Debug Library – helpful for debugging purposes
ICSharpCode.SharpZipLib.dll Compression library – used to speed up network
MDAC27ENU.msm Data Access components for ODBC data access
558
DBMS Administrative Edition (DBMSAdmin.msm)
559
560
561
562
563
564
565
566
567
568
569
570
571
572
573
574
575
576
577
578
579
580
581
582
583
584
585
586
587
588
589
590
591
592
(installation\DBMS\Merge Module\DBMSAdmin\DBMSAdmin.sln)
(InstallShield Wrapper at installation\DBMS\DBMSAdmin.ise)
This is a merge module built with Visual Studio to provide the administrative edition of the
DBMS/LaunchPad. This is the Administrative edition, meaning it allows remote data editing and
LaunchPad reconfiguration. All of the files in this merge module are installed to C:\Program
Files\LaunchPad.
Files Included
Adodb.dll Used for database access (Active Data Object)
axinterop.mscomctl2.dll .NET wrapper for ActiveX component mscomctl2
axinterop.msflexgridlib.dll .NET wrapper for ActiveX component MSFlexGrid
crystal_database_Access_2003.msm Crystal Reports Database Libraries
CrystalDecisions.CrystalReports.Engine.dll Crystal Reports Core Engine
CrystalDecisions.ReportSource.dll Crystal Reports Data Source Locator
CrystalDecisions.Shared.dll Shared Libraries for Crystal Reports
CrystalDecisions.Windows.Forms.dll Form designer for Crystal Reports
CrystalKeyCodeLib.dll Registration Library for Crystal Reports
Dotnetfxredist_x86_enu.msm Suppressed (not installed - .NET Framework)
Dtspkg.dll Used for database management (DTS = Distributed Transactions)
Interop.DTS.dll .NET wrapper for Dtspkg.dll
Interop.MSComCtl2.dll .NET Wrapper for MSComCtl2.dll
Interop.MSFlexGridLib.dll .NET Wrapper for MSFlexGrid
Interop.SQLDMO.dll .NET Wrapper for SQLDMO component
LifestagePlotter.dll .NET Component for editing Fish Lifestage data
Mscomct2.msm Microsoft Common Controls library; used for animation controls
Msflxgrd.msm Microsoft FlexGrid control; used for data editing interface
SQLDMO.dll SQL Distribted Management Object – used to manage SQL Server
Stdole.dll Standard OLE interface library
DBMS.conf DBMS Configuration File (prebuilt for Nooksack)
DBMS.exe DBMS Executable itself – Administrative Edition
DBMS.pdb DBMS Program Debug Library – helpful for debugging purposes
ICSharpCode.SharpZipLib.dll Compression library – used to speed up network
MDAC27ENU.msm Data Access components for ODBC data access
593
12
594
Gigasoft Proessentials Charting Components (Gigasoft.msm)
595
596
597
598
599
600
601
602
603
604
605
606
607
608
609
610
611
612
613
614
615
616
617
618
(Installation\GigaSoft\Merge Module\Gigasoft\Gigasoft.sln)
This is a merge module used to provide all of the Gigasoft ProEssentials graphing components,
both versions 3 and 4, and all of their dependencies. This was built in response to consistently
missing dependencies for these controls. All of these files are placed in the Windows System32
directory; some are registered, some are not.
Files Included
Pe3do16a.ocx Contains a ProEssentials ActiveX control.
Pe3do32a.ocx Contains a ProEssentials ActiveX control.
Pego16a.ocx Contains a ProEssentials ActiveX control.
Pego32a.ocx Contains a ProEssentials ActiveX control.
Pego32b.ocx Contains a ProEssentials ActiveX control.
Pegrp16a.dll Contains requisite libraries used by the ActiveX controls.
Pegrp32a.dll Contains requisite libraries used by the ActiveX controls.
Pegrp32b.dll Contains requisite libraries used by the ActiveX controls.
Pepco16a.ocx Contains a ProEssentials ActiveX control.
Pepco32a.ocx Contains a ProEssentials ActiveX control.
Pepso16a.ocx Contains a ProEssentials ActiveX control.
Pepso32a.ocx Contains a ProEssentials ActiveX control.
Pesgo16a.ocx Contains a ProEssentials ActiveX control.
Pesgo32a.ocx Contains a ProEssentials ActiveX control.
Pesgo32b.ocx Contains a ProEssentials ActiveX control.
619
MapWindow 3.1 (MapWindow3.1.msm)
620
621
622
623
624
625
626
627
628
629
630
631
632
633
634
635
636
(Installation\MapWindow31\Merge
Module\MapWindow3.1\MapWindow3.1\MapWindow3.1.sln)
This is a merge module intended to wrap MapWindow 3.1 and all of its immediate dependencies
together. All of the files are placed in C:\Program Files\MapWindow.
There are a bunch of files ending in .bgd, .shp, .shx, and .dbf that are not listed here. These are
data items used by the sample project (USA).
Files Included
Interop.MapWinGIS.dll .NET wrapper for MapWinGIS ActiveX control.
AxInterop.MapWinGIS.dll .NET wrapper for MapWinGIS ActiveX control.
Comdlg32.msm Common Dialog controls (Save As, Open…)
Default.mwcfg The default MapWindow configuration file.
DevComponents.DotNetBar.dll Component used for MapWindow menus.
GridWizard.dll MapWindow Grid Wizard plugin for processing grids.
MapWindow.exe MapWindow main executable program.
13
637
638
639
640
641
642
643
644
645
646
647
648
MapWindow31.chm Help file for MapWindow.
MapWinGIS.ocx MapWindow core mapping ActiveX component.
MapWinInterfaces.dll MapWindow plugin interface definitions.
Microsoft.VisualBasic.Compatibility.dll .NET library for handling VB6 plugins
Mscomctl.msm Microsoft Common Controls library
MSIMG32.dll Microsoft Image library
mwIdentifier.dll MapWindow Feature Identifier plugin for examining maps
ShapefileEditor.dll MapWindow Shapefile Editor plugin
TableEditor.mw.dll MapWindow Shapefile Table Editor plugin.
Tlbinf32.msm Microsoft Type Library Information object
UnitedStates.mwprj Example Project for USA (Also includes many data items)
649
Model Manager (Model Manager.msm)
650
651
652
653
654
655
656
657
658
659
660
661
662
663
664
665
666
667
668
669
670
671
(Installation\Model Manager\Merge Module\Model Manager\Model Manager.sln)
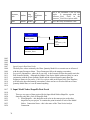
672
Model Manager Elements (ModelManagerElements.msm)
673
674
675
676
677
(Installation\Model Manager Elements\Merge
Module\ModelManagerElements\ModelManagerElements.sln)
This merge module includes the Model Manager MapWindow plugin, and it also includes the
AddFlow components, which it uses. The files are placed in C:\Program
Files\MapWindow\Plugins\ModelManager.
Files Included
AxInterop.Addflow3Lib.dll .NET wrapper for Addflow ActiveX control.
DevComponents.DotNetBar.dll Used for the dockable menu bars and model list
Dotnetfxredist_x86_enu.msm Suppressed (not installed)
Interop.AddFlow3Lib.DLL .NET library wrapper for AddFlow
Interop.DSSIntfcLib.dll .Net Library wrapper for the DSS Model Interface
Stdole.dll Suppressed (not installed)
System.dll Suppressed (not installed)
System.drawing.dll Suppressed (not installed)
System.xml.dll Suppressed (not installed)
AddFlow.msm The AddFlow component used to create the scenario layout
ModelManager.dll The Model Manager MapWindow plugin
ModelManager.pdb Program Debug Database for the Model Manager
mwDSS.xmlcf Configuration file for the Nooksack DSS
ScenarioBuilder.xml Configuration file for the Scenario Builder layout
This merge module contains all of the model elements (filters, data editors, and models) that the
Model Manager can use. They’re all lumped together in this merge module because it doesn’t
14
678
679
680
681
682
683
684
685
686
687
688
689
690
691
692
693
694
695
make sense to separate them all into separate installations. The files are placed in C:\Program
Files\MapWindow\Plugins\ModelManager\Elements.
696
Macroinvertibrate Data Viewer (MIVViewer.msm)
697
698
699
700
701
702
703
704
705
706
707
(Installation\MacroInvert\Merge Module\mwMIVViewer\mwMIVViewer.sln)
708
Predicted Habitat Simulation 1D Viewer (PHabSim1DViewer.msm)
709
710
711
712
713
714
715
716
717
718
719
(Installation\mwPhabSim1DViewer\MergeModule\mwPhabSim1DViewer\mwPhabSim1DView
er.sln)
Files Included
Interop.DSSIntfcLib.dll .NET wrapper for the DSS Model Interface library.
Interop.MapWinGIS.dll .NET wrapper for the MapWindow Mapping component.
DiversionChanger.dll The diversion changer model element
DiversionChanger.pdb Program debug database for the above
Interop.MapWinGIS.dll .NET wrapper for the MapWindow Mapping component.
LandCoverSummary.dll The Land Cover summarizer model element
LandCoverTypes.xml Land Cover type definitions for the Land Cover Summary
mwBestManagementPractice.dll Best Management Practices model element
mwChangeLandCover.dll Land Cover Changer model element
mwClimateChanger.dll Climate Changer model element
mwPopulationChanger.dll Population Changer model element
mwRainDataFilter.dll Rain Data Filter data element
ReservoirStorage.dll Reservoir Storage editor model element
ReservoirStorage.pdb Program debug database for the above
This is the merge module for the Macrointertibrate Data Viewer MapWindow plugin. This
consists primarily of the DLL for this plugin and a few dependencies. The files are placed in
C:\Program Files\MapWindow\Plugins\mwMIVViewer.
Files Included
AxInterop.MSChart20Lib.dll .NET wrapper for Microsoft Chart ActiveX control
Interop.MSChart20Lib.dll .NET wrapper for Microsoft Chart ActiveX control
Mschrt20.msm Merge module containing MS Chart control and dependencies
mwMacroInvertDataViewer.dll MacroInvertibrate Data Viewer plugin
This merge module contains the PHabSim 1D data viewer, as well as its help file and a few
dependencies of this component. Files are installed to C:\Program Files\MapWindow\Plugins\
mwPhabSim1DViewer.
Files Included
AxInterop.PE3DO32BLib.dll .NET wrapper for ProEssentials controls
Interop.PE3DO32BLib.dll .NET wrapper for ProEssentials controls
BLOBManage.dll Custom DLL used to manage the data for this plugin
15
720
721
722
723
724
725
726
727
728
729
730
Interop.BLOBMANAGELib.dll .NET wrapper for custom BLOB dll
Interop.PE3DO32BLib.dll .NET wrapper for ProEssentials controls
Interop.PESGO32BLib.dll .NET wrapper for ProEssentials controls
mwPhabSim1DViewer.dll The PHabSim 1D MapWindow Plugin DLL
Pe3do32b.ocx Gigasoft ProEssentials conrol
Pego32b.ocx Gigasoft ProEssentials conrol
Pegrp32b.dll Gigasoft ProEssentials conrol
Pepco32b.ocx Gigasoft ProEssentials conrol
Pepso32b.ocx Gigasoft ProEssentials conrol
Pesgo32b.ocx Gigasoft ProEssentials conrol
PHab1DUserManual.doc User’s Documentation for the PHabSim 1D Viewer
731
Predicted Habitat Simulation 2D Viewer (PS2DViewer.msm)
732
733
734
735
736
737
738
739
740
741
742
743
744
745
746
747
748
749
750
(Installation\mwPS2DViewer\Merge Module\mwPS2DViewer\mwPS2DViewer.sln)
This merge module contains the PHabSim 2D viewer plugin as well as mapping components, a
media player, and graphing components. Files are installed to C:\Program
Files\MapWindow\Plugins\mwPS2DViewer.
Files Included
AxInterop.MapWinGIS.dll .NET Wrapper for MapWindow Map component
AxInterop.MediaPlayer.dll .NET Wrapper for Windows Media Player component
AxInterop.PESGO32BLib.dll .NET wrapper for Proessentials graph control
Interop.MediaPlayer.dll .NET wrapper for Windows Media Player component
Interop.PESGO32BLib.dll .NET wrapper for Proessentials Graph Control
mwPhabSim2DViewer.dll PHabSim 2D Viewer MapWindow plugin component
Pe3do32b.ocx Gigasoft ProEssentials graphing component
Pego32b.ocx Gigasoft ProEssentials graphing component
Pegrp32b.dll Gigasoft ProEssentials graphing component
Pepco32b.ocx Gigasoft ProEssentials graphing component
Pepso32b.ocx Gigasoft ProEssentials graphing component
Pesgo32b.ocx Gigasoft ProEssentials graphing component
751
Photo Viewer (mwPhotoViewer.msm)
752
753
754
755
756
757
758
759
760
761
762
(Installation\Photo Viewer\Merge Module\mwPhotoViewer\mwPhotoViewer.sln)
(InstallShield Wrapper at Installation\Photo Viewer\Standalone Plugin and Data
Install\NooksackPhotoViewer.ise)
This merge module contains the Photo Viewer two DLL files; a very simple merge module. The
files are installed to C:\Program Files\MapWindow\Plugins\mwPhotoViewer.
Files Included
AxInterop.MapWinGIS.dll .NET wrapper for MapWindow map component
Interop.MapWinGIS.dll .NET wrapper for MapWindow map component
mwPhotoViewer.dll PhotoViewer MapWindow Plugin DLL
16
763
Time Series Data Analyst (mwTimeSeries.msm)
764
765
766
767
768
769
770
771
772
773
774
775
776
777
778
779
780
781
782
783
784
785
786
787
(Installation\TimeSeries\MergeModule\mwTimeSeries\mwTimeSeries.sln)
(InstallShield Wrapper with Sample Data at Installation\TimeSeries\TimeSeriesDataAnalyst.ise)
This merge module contains the Time Series Analyst tool, formerly the Water Quality Analyst
and Streamflow Analyst. The merge module contains the MapWindow plugin and a bunch of
graphing components. The files are installed in C:\Program
Files\MapWindow\Plugins\mwTimeSeries.
Files Included
AxInterop.MSFlexGridLib.dll .NET wrapper for MS FlexGrid control
AxInterop.PEGOALib.dll .NET wrapper for Proessentials Controls
AxInterop.PESGOALib.dll .NET wrapper for Proessentials Controls
Interop.MSFlexGridLib.DLL .NET wrapper for MS FlexGrid control
Interop.PEGOALib.dll .NET wrapper for Proessentials controls
Interop.PESGOALib.dll .NET wrapper for Proessentials controls
Msflxgrd.msm Merge module containing Microsoft FlexGrid control.
MDAC26.msm Microsoft Data Access Components – for database access.
mwTimeSeries.dll The Time Series Analyst MapWindow plugin.
Pe3do32a.ocx Gigasoft ProEssentials graphing component.
Pego32a.ocx Gigasoft ProEssentials graphing component.
Pegrp32a.dll Gigasoft ProEssentials graphing component.
Pepco32a.ocx Gigasoft ProEssentials graphing component.
Pepso32a.ocx Gigasoft ProEssentials graphing component.
Pesgo32a.ocx Gigasoft ProEssentials graphing component.
788
Watershed Characterization Report (mwWatershedChar.msm)
789
790
791
792
793
794
795
796
797
798
799
800
801
802
803
804
805
(Installation\Watershed Characterization\Merge
Module\mwWatershedChar\mwWatershedChar.ise)
(InstallShield Wrapper at Installation\Watershed Characterization\Merge
Module\WatershedChar.ise)
This merge module contains the Watershed Characterization MapWindow plugin as well as a
large number of prerequisites. Most of the prerequisites are installed either to the windows
system directory, or to the .NET assembly location (usually C:\Windows\Microsoft.NET\...). The
plugin itself is installed to C:\Program Files\MapWindow\Plugins\mwWatershedChar.
Files Included
ADODB.dll Active Data Objects database driver DLL
AxInterop.MapWinGIS.dll .NET Wrapper for MapWinGIS component
AxInterop.MSChart20Lib.dll .NET wrapper for Chart Control
AxInterop.MSComCtl2.dll .NET wrapper for Common Controls
AxInterop.MSFlexGridLib.dll .NET wrapper for MS Flexgrid Control
AxInterop.PE3DOALib.dll .NET wrapper for Gigasoft Proessentials
17
806
807
808
809
810
811
812
813
814
815
816
817
818
819
820
821
822
823
824
825
826
827
828
829
AxInterop.PEGOALib.dll .NET wrapper for Gigasoft Proessentials
AxInterop.PEPCOALib.dll .NET wrapper for Gigasoft Proessentials
AxInterop.PESGOALib.dll .NET wrapper for Gigasoft Proessentials
Interop.MapWinGIS.dll .NET wrapper for MapWinGIS component
Interop.MSChart20Lib.dll .NET wrapper for Chart Control
Interop.MSComCtl2.dll . NET wrapper for Common Controls
Interop.MSFlexGridLib.dll .NET wrapper for MS Flexgrid Control
Interop.PE3DOALib.dll .NET wrapper for Gigasoft Proessentials
Interop.PEGOALib.dll .NET wrapper for Gigasoft Proessentials
Interop.PEPCOALib.dll .NET wrapper for Gigasoft Proessentials
Interop.PESGOALib.dll .NET wrapper for Gigasoft Proessentials
LifestagePlotter.dll Fish Periodicity Lifestage plot control
LifestagePlotter.pdb Debug database for above control
mwWatershedChar.chm Help document for Watershed Characterization
mwWatershedChar.dll Watershed CharacterizationReport Generator Plugin
mwWatershedChar.pdb Debug database for above DLL
ReportViewer.exe Watershed Characterization Report Viewer stub
ReportViewer.pdb Debug database for above EXE
rptViewerPass.dat Data file for communication between report plugin and EXE
Mschrt20.msm Microsoft Chart component merge module
Mscomct2.msm Microsoft Common Controls 2 merge module
Msdatasrc.dll Microsoft DataSource control
Msflxgrd.msm Microsoft Flexgrid Control merge module
Sqldmo.dll Microsoft SQL Server Distributed Management Object
830
Well Log Data Viewer (mwWellviewer.msm)
831
832
833
834
835
836
837
838
839
840
841
842
(Installation\Well Viewer\Merge Module\mwWellviewer\mwWellViewer.sln)
(InstallShield Wrapper at Installation\Well Viewer\Merge Module\WellViewer.ise)
843
Crystal Reports 8.5 Runtime Components (CrystalReports85.msm)
844
845
846
This merge module is produced and distributed by Business Objects, Inc. This provides the core
redistributable components needed by software using Crystal Reports.
This is a merge module to install the Well Log Data Viewer and dependencies other than
MapWindow. Files are installed to C:\Program Files\MapWindow\Plugins\mwWellViewer.
Files Included
AxInterop.PESGOALib.dll .NET Wrapper for Gigasoft ProEssentials control
AxInterop.PESGOALib.dll .NET Wrapper for Gigasoft ProEssentials control
Interop.PEGOALib.dll .NET Wrapper for Gigasoft ProEssentials control
Interop.PESGOALib.dll .NET Wrapper for Gigasoft ProEssentials control
mwWellViewer.dll Well Log Viewer Plugin for MapWindow
18
847
Crystal Reports .NET Data Access (Crystal_Database_Access2003.msm)
848
849
This merge module is produced and distributed by Business Objects, Inc. This provides the
redistributables to allow Crystal Reports to connect to and use a Microsoft Access database.
850
Crystal Reports .NET English (Crystal_Database_Access2003_enu.msm)
851
852
This merge module is produced and distributed by Business Objects, Inc. This provides the core
redistributable components which are specific to the US English language.
853
Crystal Reports .NET Managed Code (Crystal_Managed2003.msm)
854
855
856
This merge module is produced and distributed by Business Objects, Inc. This provides the core
redistributable components needed by software using the Crystal extensions to Microsoft’s .NET
languages.
857
Seagate Crystal Reports Keycode Manager (Crystal_regwiz2003.msm)
858
859
860
This merge module is produced and distributed by Business Objects, Inc. This provides the
registration key indicating which developer produced the software, and authorizing the client
computer to use the Crystal Reports components.
861
Data Access Objects 3.60 (DAO360.msm)
862
863
This merge module is produced by Microsoft Corp. It provides the Data Access Objects SDK
(Software Development Kit) used to access databases from code.
864
Distributed Component Object Model 95 (DCOM95.msm)
865
866
This merge module is produced by Microsoft Corp. This is a core requirement for most Windows
applications.
867
Microsoft Foundations Classes 6.0 Libraries (MFC42.msm)
868
869
This merge module is produced by Microsoft Corp. This provides libraries and dependencies
needed by software developed with Microsoft Visual C++.
870
Microsoft C Runtime Library 6.0 (MSVCRT.msm)
871
872
This merge module is produced by Microsoft Corp. This provides libraries and dependencies
needed by software developed with Microsoft Visual C.
873
Microsoft C++ Runtime Library 6.0 (MSVCP60.msm)
874
875
This merge module is produced by Microsoft Corp. This provides libraries and dependencies
needed by software developed with Microsoft Visual C++ 6.0.
19
876
Microsoft Chart Control 6.0 (MSCHRT20.MSM)
877
878
879
This merge module is produced by Microsoft Corp. This provides the Microsoft Chart control, a
simple bar-chart style control.
880
Microsoft Chart VB Control (VB_Control_mschart_RTL_X86_---.msm)
881
882
This merge module is produced by Microsoft Corp. This provides the Microsoft Chart control, a
simple bar-chart style control, packaged specifically for use with Visual Basic.
883
Microsoft Common Dialog Control 6.0 (COMDLG32.msm)
884
885
This merge module is produced by Microsoft Corp. This provides the DLL used to create
“common dialogs” such as Print, Save As, Open and such.
886
887
Microsoft Component Category Manager Library (COMCAT.msm)
888
889
This merge module is produced by Microsoft Corp. This is a core requirement for most Windows
applications that use ActiveX.
890
Microsoft Data Access Components (MDAC) 2.5 (MDAC25.msm)
891
892
893
This merge module is produced by Microsoft Corp. It provides the Data Access components,
specifically the ODBC (Open Database Compatibility) interface and a bunch of drivers for
interacting with various database formats. This is version 2.5 of the components.
894
MDAC 2.6 (MDAC26.msm)
895
896
897
This merge module is produced by Microsoft Corp. It provides the Data Access components,
specifically the ODBC (Open Database Compatibility) interface and a bunch of drivers for
interacting with various database formats. This is version 2.6 of the components.
898
MDAC 2.7 (MDAC27enu.msm)
899
900
901
This merge module is produced by Microsoft Corp. It provides the Data Access components,
specifically the ODBC (Open Database Compatibility) interface and a bunch of drivers for
interacting with various database formats. This is version 2.7 (US English) of the components.
902
Microsoft FlexGrid Control 6.0 (MSFLXGRD.msm)
903
904
This merge module is produced by Microsoft Corp. It provides the FlexGrid control, a grid
control used to create a spreadsheet-style grid layout.
20
905
Microsoft OLE 2.40 for 95/NT4.0 (OLEAUT32.msm)
906
907
This merge module is produced by Microsoft Corp. This is a core requirement for most Windows
applications that use ActiveX.
908
Microsoft Typelib Information Library (tlbinf32.msm)
909
910
911
This merge module is produced by Microsoft Corp. This is a core requirement for most Windows
applications that use ActiveX.
912
Microsoft Windows Common Controls 6.0 (MSCOMCTL.msm)
913
914
This merge module is produced by Microsoft Corp. It provides the FlexGrid control, a grid
control used to create a spreadsheet-style grid layout.
915
916
Microsoft Windows Common Controls-2 6.0 (MSCOMCT2.msm)
917
918
This merge module is produced by Microsoft Corp. It provides a large collection of controls
which are commonly used, including animation controls and picture-related controls.
919
OLE Database Access 2.1 (OLEDB21.msm)
920
921
This merge module is produced by Microsoft Corp. It provides the OLE database access SDK for
accessing and communicating with databases.
922
SQL Distributed Management Object (SQL-DMO.msm)
923
924
This merge module is produced by Microsoft Corp. It provides a convenient library to interact
with Microsoft SQL Servers, performing common administration, backup, and query tasks.
925
926
927
928
929
930
931
932
933
934
21
935
Technical Documentation: 1D Habitat Viewer
936
937
Last Revision: 01/4/08
Table of Contents
938
939
940
941
942
943
944
945
946
947
948
949
950
951
952
953
954
955
956
957
958
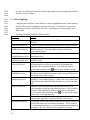
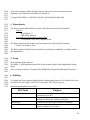
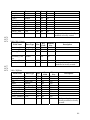
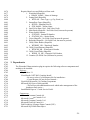
1. Table Design
¾ Table Descriptions and Notes
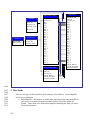
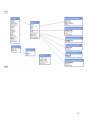
¾ Schema, Keys, Indexes and Structure
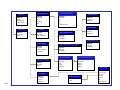
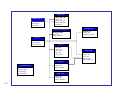
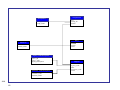
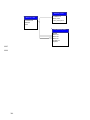
¾ Table Relationship Diagrams
2. Data Needs
¾ Type/Location of Data
¾ Tags on Layers
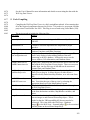
3. Dependencies
¾ Software
¾ Modules and Components
¾ Integrated Development Environment (IDE)
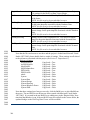
4. Setup
¾ Setup
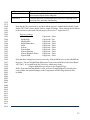
5. Code Compiling
¾ Project Files
¾ Reference Settings
959
960
961
962
963
964
965
966
22
967
968
969
970
971
972
973
974
975
976
977
978
979
980
981
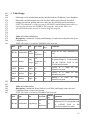
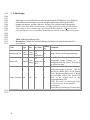
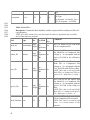
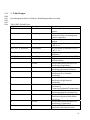
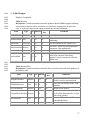
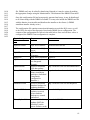
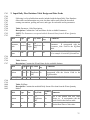
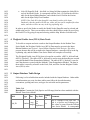
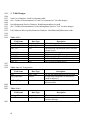
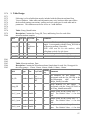
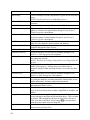
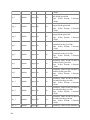
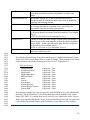
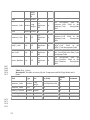
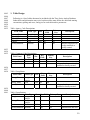
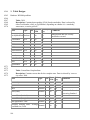
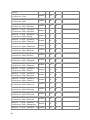
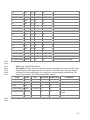
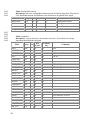
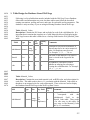
1. Table Design
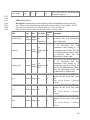
Following is a list of tables that must be included with the 1D Habitat Viewer Database.
Other tables and information may exist, but these tables must follow the described
naming conventions, spelling and cases, and types for each table and its parameters.
NOTE: This database is created (except for the tblPDFs and tblPhotographs tables) by
exporting the data from the PHABWin-2002 program. Most of this data is in a
specialized format that can only be written using this program.
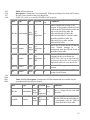
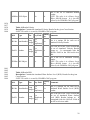
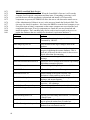
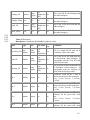
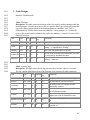
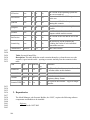
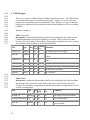
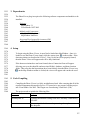
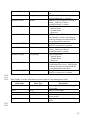
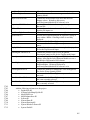
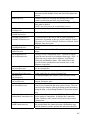
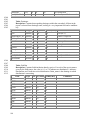
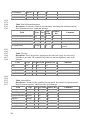
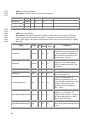
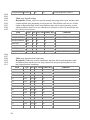
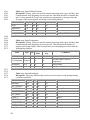
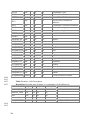
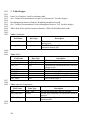
Table: tblCalibrationSetPoints
Description: Contains the Velocity and Manning’s N values for each point in the given
Calibration Set.
NOTE: This table is created bye PHABWin-2002 program.
Field
982
983
984
985
986
987
Type
Size
Key Field
Primary
Comments
Key
DBCode AutoNumber
Yes
Long
(No
Yes
Integer
Duplicates)
Unique ID for each Calibration Set
point.
CalSetID Number
Yes
Long
(Duplicates No
Integer
OK)
The ID for the Calibration Set that
this point belongs to. It corresponds
with the DBCode Field in the
tblCalibrationSets table.
Point 2
Number
Single No
No
Velocity at .2 depth
calibration set point.
for
this
Point 8
Number
Single No
No
Velocity at .8 depth
calibration set point.
for
this
ManN
Number
Single No
No
Manning’s N value
calibration set point.
for
this
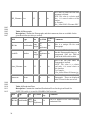
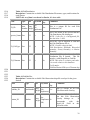
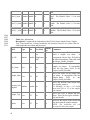
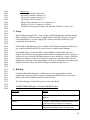
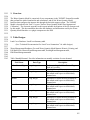
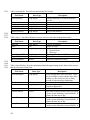
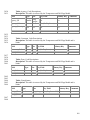
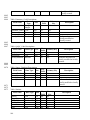
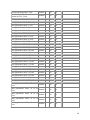
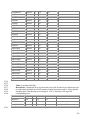
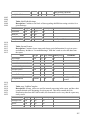
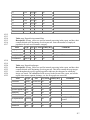
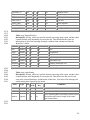
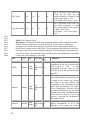
Table: tblCalibrationSets
Description: Contains the Water Surface Level (WSL) and StageQ values for each
Calibration Set at a given Cross Section.
NOTE: This table is created by PHABWin-2002 program.
Primary
Field
Type
Size
Key Field
Comments
Key
Yes
DBCode AutoNumber Long Integer (No
Yes
Duplicates)
This is a unique ID for each
Calibration Set. It corresponds with
the CalSetID Field in the
tblCalibrationSetPoints table.
23
XSecID Number
This is the ID for the Cross Section
that this Calibration Set belongs to.
It corresponds with the DBCode
Field in the tblCrossSections table.
This is an ID for this Calibration
Set that is unique for the given
Cross Section.
NOTE: This value can be
duplicated for each unique Cross
Section, but it cannot be duplicated
within the same Cross Section.
No
This is the Water Surface Level
(WSL) value for this Calibration
Set.
No
This is the StageQ that the WSL
value
represents
for
this
Calibration Set.
ID
Number
Yes
Long Integer (Duplicates No
OK)
WSL
Number
Single
StageQ
988
989
990
991
992
993
994
Yes
Long Integer (Duplicates No
OK)
Number
No
Singe
No
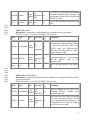
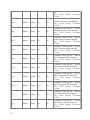
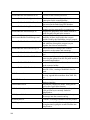
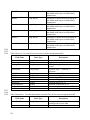
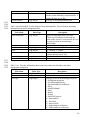
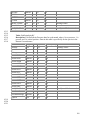
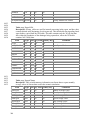
Table: tblCrossSectionPoints
Description: Contains the Point Location (X, Y, and Z values) and the Channel Index for
each point in the given Cross Section.
NOTE: This table is created by PHABWin-2002 program.
Primary
Field
Type
Size
Key Field
Comments
Key
DBCode
Long
AutoNumber
Integer
Yes
(No
Yes
Duplicates)
This is a unique ID for each Cross
Section point.
This is the ID for the Cross Section
that this point belongs to.
It
corresponds with the DBCode Field
in the tblCrossSections table.
XSecID
Number
Long
Integer
Yes
(Duplicates No
OK)
X
Number
Single
No
No
This is the X-value of the location
of this cross sectional point.
Y
Number
Single
No
No
This is the Y-value of the location
of this cross sectional point.
Z
Number
Single
No
No
This is the Z-value of the location
of this cross sectional point.
Channel
Index
Number
Single
No
No
This is the Channel Index for this
cross sectional point.
24
995
996
997
998
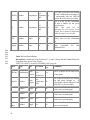
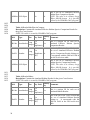
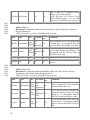
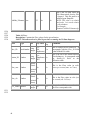
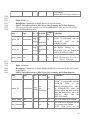
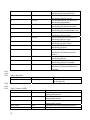
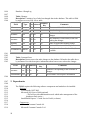
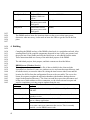
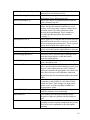
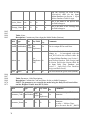
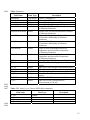
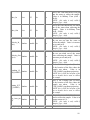
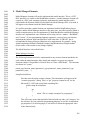
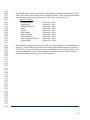
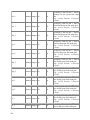
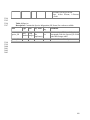
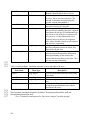
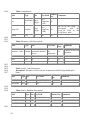
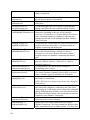
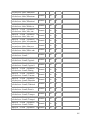
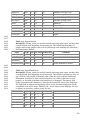
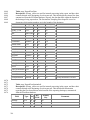
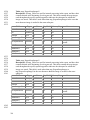
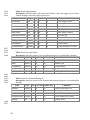
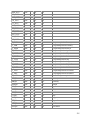
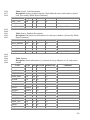
Table: tblCrossSections
Description: Contains the Cross Section ID, Thalweg, and Stage Zero Flow (SZF) values
for each Cross Section in the given Result Set.
NOTE: This table is created by PHABWin-2002 program.
Primary
Field
Type
Size
Key Field
Comments
Key
DBCode AutoNumber
Yes
Long
(No
Yes
Integer
Duplicates)
This is a unique ID for each Cross
Section. It corresponds with the XSecID
Field in the tblCalibrationSets table, the
tblCrossSectionPoints table, the
tblResultsHabefQ1Q2 table, the
tblResultsHabefSpeciesCompare table,
the tblResultsHabtae table, the
tblResultsVelocity table, and the
tblResultsWSL table.
ResultID Number
Yes
Long
(Duplicates No
Integer
OK)
This is the ID for the Result Set that this
Cross Section belongs to.
It
corresponds with the DBCode Field in
the tblResultSets table.
Yes
Single (Duplicates No
OK)
This is an ID for this Cross Section that
is unique for the given Result Set.
NOTE: This value can be duplicated for
each unique Result Set, but it cannot be
duplicated within the same Result Set.
Thalweg Number
Single No
No
This is the Thalweg value for this Cross
Section.
SZF
Single No
No
This is the Stage Zero Flow (SZF) value
for this Cross Section.
ID
999
1000
1001
1002
Number
Number
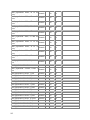
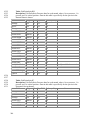
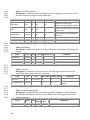
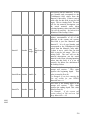
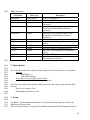
Table: tblPDFs Description: Contains the PDF Documents that are available for the
given Result Set (not always created).
Primary
Field
Type
Size Key Field
Comments
Key
DBCode
ResultID
AutoNumber
Yes
Long
(No
Yes
Integer
Duplicates)
This is a unique ID for each PDF
Document.
Number
Yes
Long
(Duplicates No
Integer
OK)
This is the ID for the Result Set
that this PDF Document belongs to.
It corresponds with the DBCode
Field in the tblResultSets table.
25
PDF_Filename Text
1003
1004
1005
1006
1007
No
No
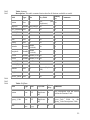
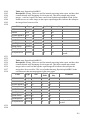
Table: tblPhotographs
Description: Contains the Photographs, and their comments, that are available for the
given Result Set (not always created).
Primary
Comments
Field
Type
Size Key Field
Key
DBCode
ResultID
AutoNumber
Yes
Long
(No
Yes
Integer
Duplicates)
This is a unique ID for each
Photograph.
Number
Yes
Long
(Duplicates No
Integer
OK)
This is the ID for the Result Set
that this Photograph belongs to. It
corresponds with the DBCode
Field in the tblResultSets table.
255
No
This is the File path where the
Photograph is located.
NOTE: This value is a relative
path value. It is stored relative to
this database.
For Example:
\Site_Name\Photos\Filename.jpg
No
These are the comments about this
Photograph. These are displayed
in the Viewer for the user to see.
Photo_Filename Text
Comments
1008
1009
1010
1011
1012
255
This is the File path where the PDF
Document is located.
NOTE: This value is a relative path
value. It is stored relative to this
database.
For Example:
\Site_Name\PDFs\Filename.PDF
Memo
No
No
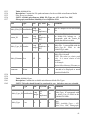
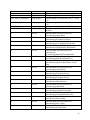
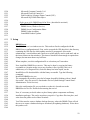
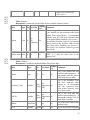
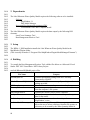
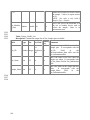
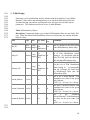
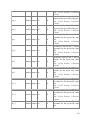
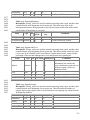
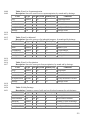
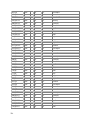
Table: tblProductionFlows
Description: Contains the simulated Production Flows for the given Result Set.
NOTE: This table is created by PHABWin-2002 program.
Primary
Field
Type
Size Key Field
Comments
Key
DBCode AutoNumber
26
Yes
Long
(No
Yes
Integer
Duplicates)
This is a unique ID for each simulated
Production Flow.
1013
1014
1015
1016
1017
ResultID Number
Yes
Long
(Duplicates No
Integer
OK)
This is the ID for the Result Set that this
simulated Production Flow belongs to. It
corresponds with the DBCode Field in the
tblResultSets table.
Flow
Single No
This is the simulated Production Flow
value.
Number
No
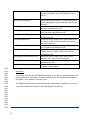
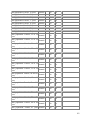
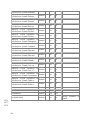
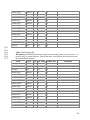
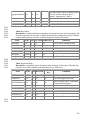
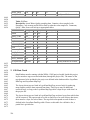
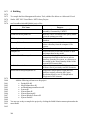
Table: tblResultSet
Description: Contains the available Result Sets exported for the given Station.
NOTE: This table is created by PHABWin-2002 program.
Primary
Comments
Field
Type
Size Key Field
Key
Yes
Long
DBCode AutoNumber
(No
Yes
Integer
Duplicates)
1018
1019
1020
1021
1022
1023
1024
This is a unique ID for each Result Set.
It corresponds with the ResultID Field
in the tblCrossSections table, the
tblPDFs table, the tblPhotographs
table, the tblProductionFlows table,
and the tblSpecies table.
StationID Number
Yes
Long
(Duplicates No
Integer
OK)
This is the ID for the Station that this
Result Set belongs to. It corresponds
with the DBCode Field in the
tblStations table.
Name
50
This is the name given to this Result
Set.
Text
No
No
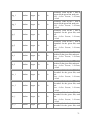
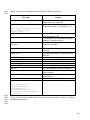
Table: tblResultsHabefQ1Q2
Description: Contains the simulated Effective Habitat Flow Comparison Results for the
given Cross Section.
NOTE: This table is created by PHABWin-2002 program.
Primary
Comments
Field
Type
Size Key Field
Key
Yes
Long
DBCode AutoNumber
(No
Yes
Integer
Duplicates)
XSecID
Number
Yes
Long
(Duplicates No
Integer
OK)
This is a unique ID for each set of
simulated Effective Habitat Flow
Comparison Results.
This is the ID for the Cross Section that
this set of simulated Effective Habitat
Flow Comparison Results belongs to. It
corresponds with the DBCode Field in
the tblCrossSections table.
27
HABBloc OLE Object
1025
1026
1027
1028
1029
1030
No
No
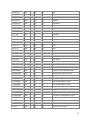
Table: tblResultsHabefSpeciesCompare
Description: Contains the simulated Effective Habitat Species Comparison Results for
the given Cross Section.
NOTE: This table is created by PHABWin-2002 program.
Primary
Field
Type
Size Key Field
Comments
Key
Yes
Long
DBCode AutoNumber
(No
Yes
Integer
Duplicates)
XSecID
Number
HABBloc OLE Object
1031
1032
1033
1034
1035
This is the set of simulated Effective
Habitat Flow Comparison Results.
NOTE: This value is in a Binary Large
OBject (BLOB) format. It is specially
written by the PHABWin-2002 program.
Yes
Long
(Duplicates No
Integer
OK)
No
No
This is a unique ID for each set of
simulated Effective Habitat Species
Comparison Results.
This is the ID for the Cross Section that
this set of simulated Effective Habitat
Species Comparison Results belongs to.
It corresponds with the DBCode Field in
the tblCrossSections table.
This is the set of simulated Effective
Habitat Species Comparison Results.
NOTE: This value is in a Binary Large
OBject (BLOB) format. It is specially
written by the PHABWin-2002 program.
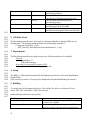
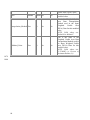
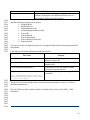
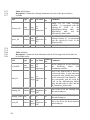
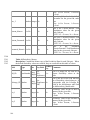
Table: tblResultsHabtae
Description: Contains the simulated Habitat Results for the given Cross Section.
NOTE: This table is created by PHABWin-2002 program.
Primary
Field
Type
Size Key Field
Comments
Key
DBCode AutoNumber
Yes
Long
(No
Yes
Integer
Duplicates)
This is a unique ID for each set of
simulated Habitat Results.
XSecID
Yes
Long
(Duplicates No
Integer
OK)
This is the ID for the Cross Section that
this set of simulated Habitat Results
belongs to. It corresponds with the
DBCode Field in the tblCrossSections
table.
28
Number
HABBloc OLE Object
1036
1037
1038
1039
1040
No
Table: tblResultsVelocity
Description: Contains the simulated Velocity Results for the given Cross Section.
NOTE: This table is created by PHABWin-2002 program.
Primary
Field
Type
Size Key Field
Comments
Key
DBCode AutoNumber
XSecID Number
VELBloc OLE Object
1041
1042
1043
1044
1045
1046
No
This is the set of simulated Habitat
Results.
NOTE: This value is in a Binary Large
OBject (BLOB) format. It is specially
written by the PHABWin-2002 program.
Yes
Long
(No
Yes
Integer
Duplicates)
This is a unique ID for each set of
simulated Velocity Results.
Yes
Long
(Duplicates No
Integer
OK)
This is the ID for the Cross Section that
this set of simulated Velocity Results
belongs to. It corresponds with the
DBCode Field in the tblCrossSections
table.
No
No
This is the set of simulated Velocity
Results.
NOTE: This value is in a Binary Large
OBject (BLOB) format. It is specially
written by the PHABWin-2002 program.
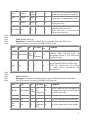
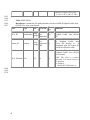
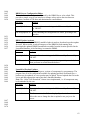
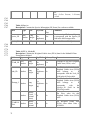
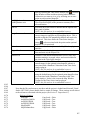
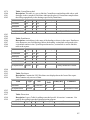
Table: tblResultsWSL
Description: Contains the simulated Water Surface Level (WSL) Results for the given
Cross Section.
NOTE: This table is created by PHABWin-2002 program.
Primary
Comments
Field
Type
Size Key Field
Key
DBCode AutoNumber
XSecID
Number
Yes
Long
(No
Yes
Integer
Duplicates)
This is a unique ID for each set of
simulated Water Surface Level (WSL)
Results.
Yes
Long
(Duplicates No
Integer
OK)
This is the ID for the Cross Section that
this set of simulated Water Surface
Level (WSL) Results belongs to. It
corresponds with the DBCode Field in
the tblCrossSections table.
29
WSLBloc OLE Object
1047
1048
1049
1050
1051
1052
No
No
Table: tblSpecies
Description: Contains the Information for each Species and Lifestage pair available in
the given Result Set.
NOTE: This table is created by PHABWin-2002 program.
Primary
Field
Type
Size Key Field
Comments
Key
Yes
Long
DBCode AutoNumber
(No
Yes
Integer
Duplicates)
1053
1054
1055
1056
1057
1058
This is the set of simulated Water
Surface Level (WSL) Results.
NOTE: This value is in a Binary Large
Object (BLOB) format. It is specially
written by the PHABWin-2002 program.
This is a unique ID for each Species and
Lifestage pair. It corresponds with the
SpeciesID Field in the tblSpeciesSI table.
ResultID Number
Yes
Long
(Duplicates No
Integer
OK)
This is the ID for the Result Set that this
Species and Lifestage pair belongs to. It
corresponds with the DBCode Field in
the tblResultSets table.
Species
Text
255
No
No
This is the name of the Species.
Lifestage Text
255
No
No
This is the name of the Lifestage of the
Species.
Table: tblSpeciesSI
Description: Contains the simulated Suitability Index (SI) values (Depth, Velocity,
Temperature, and Channel Index) for the given Fish.
NOTE: This table is created by PHABWin-2002 program.
Primary
Field
Type
Size Key Field
Comments
Key
Yes
Long
Yes
(No
Integer
Duplicates)
This is a unique ID for each simulated
Suitability Index (SI) value.
SpeciesID Number
Yes
Long
(Duplicates No
Integer
OK)
This is the ID for the Fish that this
simulated Suitability Index (SI) value
belongs to. It corresponds with the
DBCode Field in the tblSpecies table.
SI Type
Long
No
Integer
This is the Suitability Index (SI) Type
for this value. It corresponds with the
DBCode Field in the tblSpeciesSIType
table.
DBCode
30
AutoNumber
Number
No
Point
Number
Long
No
Integer
No
This is the Cross Section Point number
for this value (keeps the data ordered).
Value
Number
Single No
No
This is the Depth, Velocity,
Temperature, or Channel Index value.
SI
Number
Single No
No
This is the Suitability Index (SI) value
for the given value.
No
This is the Description of the
Suitability Index (SI) value.
NOTE: This value is only used for the
Channel Index plot type.
Description Text
1059
1060
1061
1062
1063
1064
1065
1066
1067
1068
255
No
Table: tblSpeciesSIType
Description: Contains the available Species Suitability Index (SI) Plot Types.
NOTE: This table is created by PHABWin-2002 program.
Primary
Comments
Field
Type
Size Key Field
Key
Yes
Long
DBCode AutoNumber
(No
Yes
Integer
Duplicates)
This is a unique ID for each Species
Suitability Index (SI) Plot Type. It
corresponds with the SI Type Field in the
tblSpeciesSI table.
Name
This is the Name of the Type of the
Species Suitability Index (SI) Plot Type.
NOTE: The available Plot Types should
be: Depth, Velocity, Temperature, and
Channel Index.
Text
50
No
No
Table: tblStations
Description: Contains the information (ID, Name, and Description) for each Station.
NOTE: This table is created by PHABWin-2002 program.
Primary
Field
Type
Size Key Field
Comments
Key
DBCode
Yes
Long
AutoNumber
(No
Yes
Integer
Duplicates)
This is a unique ID for each Station. It
corresponds with the StationID Field in
the tblResultSet table.
Name
Text
255
No
No
This is the Name of the Station.
Description Text
255
No
No
This is the Description of the Station.
Short
Name
255
Yes
(Duplicates No
OK)
Text
This is the Short Name for the Station.
31
tblStations
DBCode
Name
Description
Short Name
tblCrossSections
DBCode
ResultID
ID
Thalweg
SZF
tblCrossSectionPoints
tblResultsHabtae
DBCode
XSecID
X
Y
Z
Channel Index
DBCode
XSecID
HABBloc
tblResultsWSL
tblResultSet
DBCode
StationID
Name
tblPDFs
DBCode
ResultID
PDF_Filename
DBCode
XSecID
WSLBloc
tblResultsHabefQ1Q2
DBCode
XSecID
HABBloc
tblResultsVelocity
tblPhotographs
DBCode
ResultID
Photo_Filename
Comments
tblResultsHabefSpeciesCompare
DBCode
XSecID
HABBloc
tblCalibrationSets
tblProductionFlows
DBCode
ResultID
Flow
DBCode
XSecID
ID
WSL
StageQ
tblCalibrationSetPoints
DBCode
CalSetID
Point 2
Point 8
ManN
tblSpecies
DBCode
ResultID
Species
Lifestage
1069
32
tblSpeciesSIType
DBCode
Name
DBCode
XSecID
VELBloc
tblSpeciesSI
DBCode
SpecidesID
SI Type
Point
Value
SI
Description
1070
1071
1072
1073
1074
1075
1076
1077
1078
1079
1080
1081
1082
1083
1084
1085
1086
1087
1088
1089
1090
1091
1092
1093
1094
1095
1096
1097
1098
1099
1100
1101
1102
2. Data Needs
1103
3. Dependencies
1104
1105
1106
1107
1108
1109
1110
1111
1112
There are three types of data needed for the1D Habitat Viewer: a point shapefile, a
database type, and a database.
• Point Shapefile – this needs to be in the same projection as the other shapefiles in
your project. It contains the point locations of where each of the Stations are
located. This file will have a tag that will be associated with it by the plug-in:
“rapidlocations”. There needs to be a field containing the Station Name in this
shapefile.
• Database Type – this is the type of database that you are connecting to. IE:
Access, SQL Server.
• Database – this is the database of 1D Habitat Data that has been exported from the
PHABWin-2002 Program, and had the PDF and Photograph tables added. This
database needs to be organized as described in Section 1. Table Design.
The layer corresponding with the point shapefile stated above is marked with the tag
“rapidlocations ”. If the user removes the layer associated with this tag without first
closing the 1D Habitat Viewer plug-in, then the Shapefile settings will be reset, and if the
Project is then saved, then the Shapefile settings in the project file will also be overwritten.
As stated above, the shapefile requires one field to be found in the data table. Following
is the description of the required Field in the shapefile (an example field name, the field
type, a description of the data that gets entered into this field, and how the field data is
associated with the data in the database.
Required data layer field:
a. Station Name – String – The Name for the Station at this location. It
corresponds with the DBCode field in the tblStations table found in the
database. Each value that is found in this field (in the shapefile) also
needs to be found in the database.
The 1D Habitat Viewer plug-in requires the following software components and modules
to be installed:
Software:
Gigasoft’s ProEssentials Graphing Tools Version 4
MapWindow 3.1
Visual Studio .NET 2003
33
1113
1114
1115
1116
1117
1118
1119
1120
1121
1122
1123
1124
1125
Modules and Components:
BLOBManage 1.0 Type Library
Gigasoft ProEssentials 3D Sci-Graph v4
Gigasoft ProEssentials Sci-Graph v4
MapWindow Interfaces
MapWinGIS Map Control
Integrated Development Environment (IDE)
Visual Studio .NET 2003
4. Setup
To begin using the 1D Habitat Viewer, it must first be loaded into MapWindow. Once it
1126
1127
1128
1129
1130
1131
1132
1133
1134
is loaded, click on the 1D Habitat icon, , located on the Map Window toolbar If the
shapefile (if associated) and database associations (as described in Section 2: Data
Needs) have been configured properly and the database is accessible, then the 1D Habitat
Viewer will appear allowing the user to select and view the 1D Habitat Simulation data
for available stations.
1135
1136
1137
1138
1139
1140
, from the Map Window toolbar and the viewer
associated, select the 1D Habitat icon,
will appear allowing the user to view the data.
1141
1142
1143
1144
1145
1146
1147
If the data associations have not been properly set, then a Connection Form will appear
allowing you to set the shapefile (if desired), the database type, and the database. Then,
after the shapefile (if desired), the database type, and the database have been properly
See the User’s Manual for more information and details on associating the data with the
1D Habitat Viewer.
5. Code Compiling
Compiling the 1D Habitat Viewer is a fairly straightforward task. After ensuring that all of the
required components discussed in Section 3: Dependencies are present, load the project into
Visual Studio .Net 2003. This Plugin was created using Visual Basic (VB).
The project needs to include the following files:
File Name
Purpose
AssemblyInfo.vb
clsDBFunctions.vb
clsEHFlowInfo.vb
34
Contains information relating to the DLL assembly. Generated
by VB.NET.
Contains functions used for accessing and updating the
associated database.
Contains classes for accessing and storing Expected Habitat
data.
clsObservedInfo.vb
clsObservedVelocities.vb
clsPredictedFlow.vb
clsPredictedHabitat.vb
clsPS1DMain.vb
clsSpecies.vb
clsXSecPoints.vb
frmDBConnection.vb,
frmDBConnection.resx
frmHotSpot.vb,
frmHotSpot.resx
frmPS1DVisualization.vb,
frmPS1DVisualization.resx
frmSelectLayer.vb,
frmSelectLayer.resx
frmSelectPDF.vb,
frmSelectPDF.resx
ImageConverter.vb
modDSSDefinitions.vb
modFormFunctionality.vb
Contains a class for accessing and storing Calibration Set
(Observed) Data.
Contains a class for accessing and storing Observed Velocity
data for the Calibration Set (Observed) Data.
Contains a class for accessing and storing Flow, Water Surface
Level (WSL), and Velocity data for the simulated Predicted
Flow Data.
Contains a class for access and storing Predicted Habitat data
for the simulated Predicted Flow Data.
Contains a class that implements the MapWindow plugin
interface.
Contains a class for accessing and storing Species and
SpeciesSI data for the simulated Predicted Flow Data.
Contains a class for accessing and storing Cross Section Data.
Displays the Connection form that allows the user to associate
the shapefile and shapefile field (if desired), the database type,
and the database with the 1D Habitat Viewer plug-in.
Displays the form that allows the user view the data for a
specific point on any of the graphs.
Displays the 1D Habitat Viewer form. This form contains the
many plots, photographs, and other miscellaneous viewable
data for available stations. You show this form by selecting the
1D Habitat icon, , from the Map Window toolbar or by
selecting one or more points on the associated shapefile.
Displays the form to select the point shapefile associated with
the 1D Habitat Viewer plug-in. It allows the user to either
select a shapefile already loaded into Map Window, or to select
one from disk. This form will only be shown if the user decides
to associate a shapefile with this plug-in.
Displays the form to select a PDF Filename to view.
Contains a class that implements functions that allows you to
convert images to and from an IPictureDisp object. This is
needed so that the VBCompatibility.dll does not need to be
referenced. This class allows the 1D Habitat image, , to be
associated with the points on the associated (if desired)
shapefile.
This module contains the variables that define the table and
field variable name for the 1D Habitat Viewer database. These
variables are used throughout the project, so if anything should
change in the database, the table or field name value only has to
be changed in 1 location in the program.
This module contains variables for copying and saving the data
in the various plots in the 1D Habitat Viewer.
35
modGlobals.vb
This module contains the variables used throughout the forms,
such as the form declaration variables, MapWindow variables,
and others.
modPlotColors.vb
This module contains the variable definitions and functions for
creating and setting the various plots’ colors.
modPlotNameDefinitions.vb This module contains the variable definitions for the available
plot types in the 1D Habitat Viewer.
modUtils.vb
This module contains functions that are used throughout the
project for reporting errors, file functionality, searching
shapefiles, and other necessary functionality.
PluginInfo.vb
Contains a class that implements an interface to access (read
from and write to) the Project File.
trout1D.bmp
Bitmap version of the trout1D.ico. It is used as a custom image
for the point shapefile associated with the 1D Habitat Viewer
plug-in.
NOTE: this file needs to be an embedded resource
trout1D.ico
Icon that is used as the Map Window Legend picture when
using a custom image for the point shapefile if associated with
the 1D Habitat Viewer. It also is the icon on the Map Window
Toolbar for the 1D Habitat Viewer plug-in.
NOTE: this file needs to be an embedded resource
1148
1149
1150
1151
1152
1153
1154
1155
1156
1157
1158
1159
1160
1161
1162
1163
1164
1165
1166
1167
1168
1169
1170
1171
1172
Now that the files and resources are there and the project is loaded into Microsoft Visual Studio
.NET 2003, please double check a couple of settings. These settings are all related to the
references associated with the project (see Section 3: Dependencies ).
Reference Settings:
AxPE3DO32BLib
CopyLocal = True
AxPESGO32BLib
CopyLocal = True
BLOBMANAGELib
CopyLocal = True
MapWinGIS
CopyLocal = False
MapWinInterfaces
CopyLocal = False
PE3DO32BLib
CopyLocal = True
PESGO32BLib
CopyLocal = True
stdole
CopyLocal = False
System
CopyLocal = False
System.Data
CopyLocal = False
System.Drawing
CopyLocal = False
System.Windows.Forms
CopyLocal = False
System.XML
CopyLocal = False
Now that these settings have been set correctly, click the Build icon, or select Build from the
menu. The mwPhabSim1DViewer.dll has now been created with Microsoft Visual Studio .NET
2003. It is created in the mwPhabSim1DViewer subdirectory in the \Plugins folder. Next time
that MapWindow is run, if the mwPhabSim1DViewer.dll was built to the correct folder, the
updated changes to the 1D Habitat Viewer will be available.
36
1173
1174
1175
Technical Documentation: 2D Habitat Viewer
Last Revision: 06/13/06
1176
1177
1178
1179
1180
1181
1182
1183
1184
1185
1186
1187
1188
1189
1190
1191
1192
1193
1194
1195
1196
1197
1198
Table of Contents
1. Table Design
¾ Table Descriptions and Notes
¾ Schema, Keys, Indexes and Structure
¾ Table Relationship Diagrams
2. Data Needs
¾ Type/Location of Data
¾ Tags on Layers
3. Dependencies
¾ Software
¾ Modules and Components
¾ Integrated Development Environment (IDE)
4. Setup
¾ Setup
5. Code Compiling
¾ Project Files
¾ Reference Settings
37
1199
1200
1201
1202
1203
1204
1205
1206
1207
1208
1209
1210
1211
1212
1213
1. Table Design
Following is a list of tables that must be included with the 2D Habitat Viewer Database.
Other tables and information may exist, but these tables must follow the described
naming conventions, spelling, and cases, and types for each table and its parameters.
NOTE: Some of the data in this database, and some of the files used by the 2D Habitat
Viewer plug-in were created using a specialized 2D Data Importer. The data created
using this importer is in a specialized format that can only be written using this program.
Field
Table: tblBackgroundImageFiles
Description: Contains the available Background Image File name and location for a
given station.
Primary
Comments
Type Size Key Field
Key
Yes
Auto
Long
Background_ID
Yes
(No
Number Integer
Duplicates)
Station_ID
Yes
Long
Number
(Duplicates No
Integer
OK)
Image_Filename Text
1214
1215
38
255
No
No
Unique ID for each Background Image.
The ID for the Station that this
Background Image belongs to.
It
corresponds with the Station_ID Field in
the tblStations table.
This is the File path where the
Background Image is located. This file
must be in a BMP, PNG, or GIF format.
If this Background Image has a World
File associated with it, the World File
needs to be located next to the
Background Image File.
NOTE: This value is a relative path value.
It is stored relative to this database.
For Example:
\Station\BackgroundImage\Filename.bmp.
1216
1217
1218
1219
Table: tblFishDistribution
Description: Contains the available Fish Distribution File names, types, and locations for
each Species.
NOTE: this set of data is not based on Station, it is Area wide.
Primary
Field
Type Size Key Field
Comments
Key
FD_ID
Yes
Auto
Long
Yes
(No
Number Integer
Duplicates)
Species_Name Text
FD_FileType Text
FD_Filename Text
1220
1221
1222
1223
1224
1225
255
255
255
No
No
No
This is a unique ID for each Fish
Distribution File.
No
This is the Name of the Species that this
Fish Distribution File belongs to.
NOTE: if this file is a background file,
then the value = ALL.
No
This is the Type of Shapefile or Grid that
this Fish Distribution File is.
NOTE : Possible values include
Fish Distribution, Hillshade, Watershed
Boundary, County Boundary, or Marine
Boundary.
No
This is the File path where the Fish
Distribution File is located. This file
must be a valid Shapefile or Grid file.
NOTE: This value is a relative path value.
It is stored relative to this database.
For Example:
\FishDistribution\FDLayers\Filename.shp
Table: tblFishObsFiles
Description: Contains the available Fish Observation shapefile overlays for the given
Station.
Primary
Comments
Field
Type
Size Key Field
Key
FishObs_ID
Station_ID
AutoNumber
Number
Yes
Long
Yes
(No
Integer
Duplicates)
This is a unique ID for each
Fish Observation Overlay.
Yes
Long
(Duplicates No
Integer
OK)
This is the ID for the Station
that this Fish Observation
Overlay belongs to.
It
corresponds
with
the
Station_ID Field in the
tblStations table.
39
FishObs_Filename Text
1226
1227
1228
1229
1230
255
No
No
This is the File path where the
Fish Observation Overlay File
is located. This file must be a
valid Polygon Shapefile.
NOTE: This value is a relative
path value. It is stored relative
to this database.
For Example:
\Station\FishObs\Filename.shp
Table: tblFlows
Description: Contains the Flow values for the given Station.
NOTE: This table needs to be filled in previous to running the 2D Data Importer.
Primary
Comments
Field
Type
Size
Key Field
Key
Flow_ID
Yes
Long
AutoNumber
Yes
(No
Integer
Duplicates)
This is a unique ID for each Flow. It
corresponds with the Flow_ID Field
in the tblMeshFiles table.
This is the ID for the Station that this
Flow belongs to. It corresponds with
the Station_ID Field in the
tblStations table.
Station_ID Number
Yes
Long
(Duplicates No
Integer
OK)
Flow_cms
Number
Double
(Fixed:
No
2
decimal
places)
No
Number
Double
(Fixed:
No
2
decimal
places)
No
This is the Flow value in cubic feet
per second (cfs : ft^3/sec).
AVI_Frame Number
Long
No
Integer
No
This is the AVI Frame number that
this Flow corresponds with.
Flow_cfs
1231
1232
40
This is the Flow value in cubic
meters per second (cms : m^3/sec).
1233
1234
1235
1236
1237
Field
Table: tblMediaFiles
Description: Contains the File paths and names for the available miscellaneous Media
Files for a given Station.
NOTE: Available miscellaneous Media File Types are AVI, Aerial View, PDF,
Photograph, and Habitat Suitability Curve Definition Files.
Primary
Comments
Type
Size Key Field
Key
Yes
Long
Media_Files_ID AutoNumber
Yes
(No
Integer
Duplicates)
Number
Yes
Long
(Duplicates No
Integer
OK)
This is the ID for the Station that
this Media File belongs to. It
corresponds with the Station_ID
Field in the tblStations table.
Media_Type_ID Number
Yes
Long
(Duplicates No
Integer
OK)
This is the Media Type for this
Media File. It corresponds with the
Media_Type_ID Field in the
tblMediaTypes table.
255
No
This is the File path where the
Media File is located.
NOTE: This value is a relative path
value. It is stored relative to this
database.
For Example:
\Station\Miscellaneous\Filename.ext
No
This contains any information that
is needed to be displayed or noted
about this Media File.
Station_ID
Media_Filename Text
Comments
1238
1239
1240
1241
1242
This is a unique ID for each Media
File.
Memo
No
No
Table: tblMediaTypes
Description: Contains the available miscellaneous Media File Types.
NOTE: This table should already be completed for you. Only these types are viewable.
Primary
Field
Type
Size Key Field
Comments
Key
Yes
Long
Media_Type_ID AutoNumber
(No
Yes
Integer
Duplicates)
This is a unique ID for each
Media Type. It corresponds with
the Media_Type_ID Field in the
tblMediaFiles table.
Media_Type
This is the name of the Media
Type.
NOTE: Available Types = AVI,
Aerial View, PDF, Photograph,
Text
50
No
No
41
HSC
Description
1243
1244
1245
1246
1247
1248
1249
Field
Text
No
No
Table: tblMeshFiles
Description: Contains the Base Meshfile, and the compressed Flow and Species Files for
a given Station.
NOTE: This table and the files associated with this table are populated and created by
the 2D Data Importer program.
Primary
Comments
Type
Size Key Field
Key
Mesh_ID
Station_ID
Flow_ID
Species_ID
Yes
Long
AutoNumber
Yes
(No
Integer
Duplicates)
Number
Number
Number
Mesh_Filename Text
42
255
This is a description of the Media
File Type.
For Example: For Media_Type =
AVI, Description = AVI Files
This is a unique ID for each Mesh
File or Compressed File.
Yes
Long
(Duplicates No
Integer
OK)
This is the ID for the Station that
this Mesh File or Compressed File
belongs to. It corresponds with the
Station_ID Field in the tblStations
table.
Yes
Long
(Duplicates No
Integer
OK)
This is the ID for the Flow that this
Mesh File or Compressed File
belongs to. It corresponds with the
Flow_ID Field in the tblFlows table.
NOTE: This value is only used if this
Mesh File is a Compressed Flow or
Species File. Otherwise it’s value =
0.
Yes
Long
(Duplicates No
Integer
OK)
This is the ID for the Species that
this Mesh File or Compressed File
belongs to. It corresponds with the
Species_ID Field in the tblSpecies
table.
NOTE: This value is only used if this
Mesh File is a Compressed Species
File. Otherwise it’s value = 0.
255
This is the File path where the Mesh
File or Compressed File is located.
NOTE: This value is a relative path
value. It is stored relative to this
database.
No
No
For Example:
\Station\Mesh\FileType\Filename.ext
1250
1251
1252
1253
1254
1255
1256
Table: tblSpecies
Description: Contains the available Species for a given Station.
NOTE: This table needs to be filled in previous to running the 2D Data Importer.
The values in this table are only used with the tblMeshFiles table, they are not used for
the tblFishDistribution table.
Primary
Field
Type
Size Key Field
Comments
Key
Species_ID
Station_ID
Yes
Long
AutoNumber
(No
Yes
Integer
Duplicates)
Number
Species_Name Text
1257
1258
1259
1260
1261
1262
This is a unique ID for each
Species. It corresponds with the
Species_ID
Field
in
the
tblMeshFiles table.
Yes
Long
(Duplicates No
Integer
OK)
This is the ID for the Station that
this Species belongs to.
It
corresponds with the Station_ID
Field in the tblStations table.
50
This is the name of the Species.
NOTE: The format for this value is:
Species : Lifestage
No
No
Table: tblStations
Description: Contains the available Stations and the Flow Direction for the river section
at that Station.
NOTE: This table needs to be filled in previous to running the 2D Data Importer.
Primary
Comments
Field
Type
Size Key Field
Key
Station_ID
Yes
Long
AutoNumber
(No
Yes
Integer
Duplicates)
This is a unique ID for each
Station. It corresponds with the
Station_ID
Field
in
the
tblBackgroundImageFiles table,
the tblFishObsFiles table, the
tblFlows table, the tblMediaFiles
table, the tblMeshFiles table, the
tblSpecies
table,
and
the
tblWUAFiles table.
Station_Name Text
50
No
No
This is the Name of the Station.
Flow_Direction Text
2
No
No
This is the Flow Direction for the
river section at this Station.
NOTE: Valid values are the
43
standard 8 compass directions =
(N, NE, E, SE, S, SW, W, NW).
1263
1264
1265
1266
1267
Table: tblWUAFiles
Description: Contains the File paths and names for the available Weighted Usable Area
(WUA) Files at the given Station.
Primary
Field
Type
Size Key Field
Comments
Key
WUA_ID
Station_ID
AutoNumber
Yes
Long
Yes
(No
Integer
Duplicates)
This is a unique ID for each
Weighed Usable Area (WUA)
File.
Number
Yes
Long
(Duplicates No
Integer
OK)
This is the ID for the Station that
this Weighted Usable Area
(WUA) File belongs to.
It
corresponds with the Station_ID
Field in the tblStations table.
255
This is the File path where the
Weighted Usable Area (WUA)
File is located.
NOTE: This value is a relative
path value. It is stored relative to
this database.
For Example:
\Station\WUA\Filename.csv
WUA_Filename Text
1268
1269
1270
44
No
No
tblMediaFiles
tblMediaTypes
Media_Type_ID
Media_Type
Description
Media_Files_ID
Station_ID
Media_Type_ID
Media_Filename
Comments
tblBackgroundImageFiles
Background_ID
Station_ID
Image_Filename
tblFishObsFiles
FishObs_ID
Station_ID
FishObs_Filename
tblStations
Station_ID
Station_Name
Flow_Direction
tblFlows
Flow_ID
Station_ID
Flow_cms
Flow_cfs
AVI_Frame
tblSpecies
tblFishDistribution
FD_ID
Species_Name
FD_FileType
FD_Filename
tblMeshFiles
Mesh_ID
Station_ID
Flow_ID
Species_ID
Mesh_Filename
Species_ID
Station_ID
Species_Name
tblWUAFiles
WAU_ID
Station_ID
WUA_Filename
1271
45
1272
1273
1274
1275
1276
1277
1278
1279
1280
1281
1282
1283
1284
1285
1286
1287
1288
1289
1290
1291
1292
1293
1294
1295
1296
1297
1298
1299
1300
1301
2. Data Needs
1302
3. Dependencies
There are two types of data needed for the 2D Habitat Viewer: a point shapefile and a
database.
• Point Shapefile – this needs to be in the same projection as the other shapefiles in
your project. It contains the point locations of where each of the Stations are
located. This file will have a tag that will be associated with it by the plug-in:
“2DIntensiveSites”. There needs to be a field containing the Station ID in this
shapefile.
• Database – this is the database of 2D Habitat Data that has been imported using
the 2D Data Importer and the rest of the tables created/entered manually. This
database needs to be organized as described in Section 1. Table Design.
The layer corresponding with the point shapefile stated above is marked with the tag
“2DIntensiveSites”. If the user removes the layer associated with this tag without first
closing the 2D Habitat Viewer plug-in, then the Shapefile settings will be reset, and if the
Project is then saved, then the Shapefile Connection Settings in the project file will also
be over-written.
As stated above, the shapefile requires one field to be found in the data table. Following
is the description of the required Field in the shapefile (an example field name, the field
type, a description of the data that gets entered into this field, and how the field data is
associated with the data in the database.
Required data layer field:
a. Station ID – Integer – The ID for the Station at this location. It
corresponds with the Station_ID field in the tblStations table found in
the database. Each value that is found in this field (in the shapefile) also
needs to be found in the database.
1303
1304
1305
1306
1307
1308
1309
1310
1311
1312
1313
1314
1315
The 2D Habitat Viewer plug-in requires the following software components and modules
to be installed:
Software:
Gigasoft’s ProEssentials Graphing Tools Version 4
MapWindow 3.1
Windows Media Player
Visual Studio .NET 2003
Modules and Components:
Gigasoft ProEssentials Sci-Graph v4
ICSharpCode.SharpZipLib
46
1316
1317
1318
1319
1320
1321
1322
1323
1324
MapWindow Interfaces
MapWinGIS Map Control
Integrated Development Environment (IDE)
Visual Studio .NET 2003
4. Setup
To begin using the 2D Habitat Viewer, it must first be loaded into MapWindow. Once it
1325
1326
1327
1328
1329
1330
1331
is loaded, click on the 2D Habitat icon, , located on the Map Window toolbar If the
shapefile and database associations (as described in Section 2: Data Needs) have been
configured properly and the database is accessible, then the 2D Habitat Viewer will
appear allowing the user to select and view the 2D Habitat Data for available stations.
1332
1333
1334
1335
1336
1337
, from the Map
database have been properly associated, select the 2D Habitat icon,
Window toolbar and the viewer will appear allowing the user to view the data.
1338
1339
1340
1341
1342
1343
1344
1345
1346
If the data associations have not been properly set, then a Connection Form will appear
allowing you to set the shapefile and the database. Then, after the shapefile and the
See the User’s Manual for more information and details on associating the data with the
2D Habitat Viewer.
5. Code Compiling
Compiling the 2D Habitat Viewer is a fairly straightforward task. After ensuring that all
of the required components (those discussed in Section 3: Dependencies) are present,
load the project into Visual Studio .Net 2003. This Plugin was created using Visual
Basic (VB).
The project needs to include the following files:
File Name
Purpose
AssemblyInfo.vb
Contains information relating to the DLL assembly.
Generated by VB.NET.
Contains a class that defines variables and functions used
for drawing the Direction Arrow on the Map.
Contains classes for accessing and storing Habitat
Suitability Curve Data.
Contains a class that defines variables and functions for
loading Shapefiles into the Map.
Contains a class that implements the MapWindow plugin
interface.
clsDirectionPtVals.vb
clsHSCData.vb
clsMapData.vb
clsPS2DMain.vb
47
clsWUAData.vb
frmDBConnection.vb,
frmDBConnection.resx
frmFlowFrameIndex.vb,
frmFlowFrameIndex.resx
frmPS2DViewer.vb,
frmPS2DViewer.resx
frmSelectFishObs.vb,
frmSelectFishObs.resx
frmSelectLayer.vb,
frmSelectLayer.resx
ImageConverter.vb
modColorSchemes.vb
modDBDefinitions.vb
modFDDefinitions.vb
modGlobals.vb
modHSCDefinitions.vb
modMapDefinitions.vb
modOtherDefinitions.vb
48
Contains classes for accessing and storing Weighted Usable
Area (WUA) Data.
Displays the Connection form that allows the user to
associate the shapefile and shapefile field, and the database
with the 2D Habitat Viewer plug-in.
Displays the form that allows the user view the AVI Frame
vs. Flow Indexing.
Displays the 2D Habitat Viewer form. This form contains
the Physical (Map), HSC, WUA, Fish Distribution, and
other Miscellaneous viewable data for available stations.
,
You show this form by selecting the 2D Habitat icon,
from the Map Window toolbar or by selecting one or more
points on the associated shapefile.
Displays the form to select the Fish Observation Overlay
File to view with the Physical (Map) Data.
Displays the form to select the point shapefile associated
with the 2D Habitat Viewer plug-in. It allows the user to
either select a shapefile already loaded into Map Window,
or to select one from disk.
Contains a class that implements functions that allows you
to convert images to and from an IPictureDisp object. This
is needed so that the VBCompatibility.dll does not need to
be referenced. This class allows the 2D Habitat image,
,
to be associated with the points on the associated shapefile.
This module contains the variables that define the Coloring
Schemes for the Physical (Map) Data Plots.
This module contains the variables that define the table and
field variable name for the 2D Habitat Viewer database.
These variables are used throughout the project, so if
anything should change in the database, the table or field
name value only has to be changed in 1 location in the
program.
This module contains the variables that define the Coloring
Schemes, Legend Colors, File Types, Fish Distribution
Types, and Shapefile Info for the Fish Distribution Data.
This module contains the variables used throughout the
forms, such as the form declaration variables, MapWindow
variables, conversion constants, resizing variables, Shapefile
and Database variables, and others.
This module contains the variable definitions for the Habitat
Suitability Curve Data.
This module contains the variable definitions of the Plot
Types, Shapefile Fieldnames, and Species SI Types for the
Physical (Map) Data.
This module contains the enumeration and variable
modUtils.vb
PluginInfo.vb
ScaleBarUtils.vb
trout2D.bmp
trout2D.ico
1347
1348
1349
1350
1351
1352
1353
1354
1355
1356
1357
1358
1359
1360
1361
1362
1363
1364
1365
1366
1367
1368
1369
1370
1371
1372
1373
definitions for the Miscellaneous Data.
This module contains functions that are used throughout the
project for reporting errors, file functionality, Drawing the
North and Direction Arrows, shapefile functionality,
decompressing Physical Data files, conversion functionality,
and other necessary functionality.
Contains a class that implements an interface to access (read
from and write to) the Project File.
Contains enumerations, conversion constants, and a class to
draw a Scalebar in the desired units.
Bitmap version of the trout2D.ico. It is used as a custom
image for the point shapefile associated with the 2D Habitat
Viewer plug-in.
NOTE: this file needs to be an embedded resource
Icon that is used as the Map Window Legend picture when
using a custom image for the point shapefile associated with
the 2D Habitat Viewer. It also is the icon on the Map
Window Toolbar for the 2D Habitat Viewer plug-in.
NOTE: this file needs to be an embedded resource
Now that the files and resources are there and the project is loaded into Microsoft Visual
Studio .NET 2003, please double check a couple of settings. These settings are all related
to the references associated with the project (see Section 3: Dependencies ).
Reference Settings:
AxMapWinGIS
CopyLocal = True
AxMediaPlayer
CopyLocal = True
AxPESGO32BLib
CopyLocal = True
ICSharpCode.SharpZipLib
CopyLocal = True
MapWinGIS (Interop.MapWinGIS) CopyLocal = True
MapWinInterfaces
CopyLocal = False
MediaPlayer
CopyLocal = True
PESGO32BLib
CopyLocal = True
stdole
CopyLocal = False
System
CopyLocal = False
System.Data
CopyLocal = False
System.Drawing
CopyLocal = False
System.Windows.Forms
CopyLocal = False
System.XML
CopyLocal = False
Now that these settings have been set correctly, click the Build icon, or select Build from
the menu. The mwPhabsim2DViewer.dll has now been created with Microsoft Visual
Studio .NET 2003. It is created in the mwPS2DViewer subdirectory in the \Plugins
folder. Next time that MapWindow is run, if the mwPhabsim2DViewer.dll was built to
the correct folder, the updated changes to the 2D Habitat Viewer will be available.
49
1374
Technical Documentation:
Best Management Practices Tool
1375
1376
1377
1378
1379
Last Revision: Feb 21, 2006
Table of Contents
1380
1381
1382
1383
1384
1385
1386
1387
1388
1389
1390
1391
1392
1393
1394
1395
1396
1397
1398
1. Table Designs
¾ Table Descriptions and Notes
2. GIS Data Needs
¾ Location of GIS Data
3. Dependencies
¾ Software
¾ Integrated Development Environment (IDE)
4. Setup
¾ Setup
5. Building
¾ Code Compiling
¾ Installations
50
1399
1400
1401
1402
1403
1404
1. Table Designs
Best Management Practices Database: BestManagementPractices.bmp
Table: BMP_DefaultValues
Field Name
Data Type
BMP_Name
Text
PercentApplication
Long Integer
N_Reduction
Long Integer
NH3_NH4_N_Reduction
Long Integer
NO2_N03_N_Reduction
Long Integer
Phos_Reduction
Long Integer
BOD_Reduction
FecalColBac_Reduction
Long Integer
Long Integer
11
Yes/No
12
Yes/No
21
Yes/No
22
Yes/No
23
Yes/No
31
Yes/No
32
Yes/No
33
Yes/No
41
Yes/No
Description
The name of the best management
practice
The percentage of the land cover or
watershed area the best management
practice is applied to
The percentage of reduction for
nitrogen
The percentage of reduction for NH_3
+ NH_4 - N
The percentage of reduction for NO_2
+ NO_3 - N
The percentage of reduction for
phosphorus
The percentage of reduction for BOD
The percentage of reduction for fecal
coliform bacteria
Does the BMP affect this land cover
classification (OpenWater)
Does the BMP affect this land cover
classification (Perennial Ice/Snow)
Does the BMP affect this land cover
classification (Low Intensity
Residential)
Does the BMP affect this land cover
classification (High Intensity
Residential)
Does the BMP affect this land cover
classification
(Commercial/Industrial/Transportation)
Does the BMP affect this land cover
classification (Bare Rock/Sand/Clay)
Does the BMP affect this land cover
classification (Quarries/Strip Mines,
Gravel Pits)
Does the BMP affect this land cover
classification (Transitional)
Does the BMP affect this land cover
classification (Deciduous Forest)
51
1405
1406
1407
1408
1409
1410
42
Yes/No
43
Yes/No
51
Yes/No
61
Yes/No
71
Yes/No
81
Yes/No
82
Yes/No
83
Yes/No
84
Yes/No
85
Yes/No
89
Yes/No
91
Yes/No
92
Yes/No
Table: MapSelect
Field Name
ShapeIndex
Data Type
Long Integer
Table: Scenario_BMPs
Field Name
ScenarioId
Data Type
Long Integer
DrainageId
Long Integer
DrainageName
Text
BMP_Name
PercentAffected
Text
Long Integer
52
Does the BMP affect this land cover
classification (Evergreen Forest)
Does the BMP affect this land cover
classification (Mixed Forest)
Does the BMP affect this land cover
classification (Shrubland)
Does the BMP affect this land cover
classification (Orchards/Vineyards)
Does the BMP affect this land cover
classification (Grasslands/Herbaceous)
Does the BMP affect this land cover
classification (Pasture/Hay)
Does the BMP affect this land cover
classification (Row Crops)
Does the BMP affect this land cover
classification (Small Grains)
Does the BMP affect this land cover
classification (Fallow)
Does the BMP affect this land cover
classification (Urban/Recreational
Grasses)
Does the BMP affect this land cover
classification (Dairy)
Does the BMP affect this land cover
classification (Woody Wetlands)
Does the BMP affect this land cover
classification (Emergent Herbaceous
Wetlands)
Description
The index of the shape last selected
in the shapefile
Description
The scenario associated with the best
management practice
The drainage id associated with the best
management practice
The drainage name associated with the best
management practice
The name of the best management practice
The percentage of the land cover or watershed
Phos_Reduction
N_Reduction
NH3_NH4_N_Reduction
Long Integer
Long Integer
Long Integer
NO2_N03_N_Reduction
Long Integer
BOD_Reduction
FecalColBac_Reduction
Long Integer
Long Integer
11
Yes/No
12
Yes/No
21
Yes/No
22
Yes/No
23
Yes/No
31
Yes/No
32
Yes/No
33
Yes/No
41
Yes/No
42
Yes/No
43
Yes/No
51
Yes/No
61
Yes/No
71
Yes/No
81
Yes/No
82
Yes/No
83
Yes/No
area the best management practice is applied to
The percentage of reduction for phosphorus
The percentage of reduction for nitrogen
The percentage of reduction for NH_3 + NH_4
-N
The percentage of reduction for NO_2 + NO_3
-N
The percentage of reduction for BOD
The percentage of reduction for fecal coliform
bacteria
Does the BMP affect this land cover
classification (OpenWater)
Does the BMP affect this land cover
classification (Perennial Ice/Snow)
Does the BMP affect this land cover
classification (Low Intensity Residential)
Does the BMP affect this land cover
classification (High Intensity Residential)
Does the BMP affect this land cover
classification
(Commercial/Industrial/Transportation)
Does the BMP affect this land cover
classification (Bare Rock/Sand/Clay)
Does the BMP affect this land cover
classification (Quarries/Strip Mines, Gravel
Pits)
Does the BMP affect this land cover
classification (Transitional)
Does the BMP affect this land cover
classification (Deciduous Forest)
Does the BMP affect this land cover
classification (Evergreen Forest)
Does the BMP affect this land cover
classification (Mixed Forest)
Does the BMP affect this land cover
classification (Shrubland)
Does the BMP affect this land cover
classification (Orchards/Vineyards)
Does the BMP affect this land cover
classification (Grasslands/Herbaceous)
Does the BMP affect this land cover
classification (Pasture/Hay)
Does the BMP affect this land cover
classification (Row Crops)
Does the BMP affect this land cover
classification (Small Grains)
53
84
Yes/No
85
Yes/No
89
Yes/No
91
Yes/No
92
Yes/No
Does the BMP affect this land cover
classification (Fallow)
Does the BMP affect this land cover
classification (Urban/Recreational Grasses)
Does the BMP affect this land cover
classification (Dairy)
Does the BMP affect this land cover
classification (Woody Wetlands)
Does the BMP affect this land cover
classification (Emergent Herbaceous Wetlands)
1411
1412
1413
1414
1415
1416
1417
2. GIS Data Needs
1418
1419
1420
1421
1422
1423
1424
1425
3. Dependencies
1426
1427
1428
1429
1430
4. Setup
1431
1432
1433
1434
1435
1436
1437
5. Building
The Best Management Practices Tool requires a drainages shapefile to manage BMPs on a per
drainage basis. The default installation location for this drainage shapefile is:
C:\Program Files\WRIA-1_DSS
\DSS_Data\GIS_Data\Shapefiles\Watershed\bsnwria1_v7.shp
The Best Management Practices plug-in requires the following software to be installed:
Software:
MapWindow 3.1
DSS Model Manager
Integrated Development Environment (IDE):
Visual Studio .NET 2003 Complete Install
The WRIA-1_DSS Installation installs the Best Management Practices Tool in the MapWindow
Plugins folder.
(This is usually located at C:\Program Files\MapWindow\Plugins\ModelManager\Elements”).
To compile the Best Management Practices Tool, add the files below to a Microsoft Visual
Studio .NET 2003 Visual Basic .NET Library Project.
mwBestManagementPractices project files:
File Name
AssemblyInfo.vb
BestManagementPractice.vb
54
Purpose
Contains information relating to the DLL assembly.
Generated by VB.NET.
Implements MapWindow Plugin and the DSS
Interface routines, allowing the Best Management
ChangeDatabase.ico
DBClient.vb
Delete.ico
Edit.ico
frmConfiguration.vb
frmCreateBMP.vb
frmEditDefaultParameters.vb
frmOpenScenarioBMPs.vb
frmSelectLayer.vb
New.ico
Open.ico
Save.ico
1438
1439
1440
1441
1442
1443
1444
1445
1446
1447
1448
1449
1450
1451
1452
1453
1454
1455
1456
1457
Practices Tool to act as a MapWindow Plugin and a
DSS element.
An icon used for the Change Database button on
the toolbar.
Contains the routines used to connect to a database
and store the best management practices created.
An icon used for the Delete BMP button on the
toolbar.
An icon used for the Edit BMP button on the
toolbar.
Contains the routines used to select a best
management practices database.
Allows the user to create best management
practices for specified drainages.
Allows the user to edit default bmp parameters in
the database (THIS HAS BEEN DISABLED IN
THE CODE TO AVOID DATA CORRUPTION)
Allows the user to select a previous set of BMPs for
a specified scenario number.
Contains the routines used to select a layer from
MapWindow’s view.
An icon used for the New BMP button on the
toolbar.
An icon used for Open BMP button on the toolbar.
An icon used for the Save BMP button on the
toolbar.
Add the following references to the project:
DssIntfcLib.dll
MapWinGIS.ocx
MapWinInterfaces.dll
stdole.dll
System.dll
System.Data.dll
System.Drawing.dll
System.Windows.Forms.dll
System.Xml.dll
You are now ready to compile the project by clicking the Build Solution menu option under the
menu Build.
The Best Management Practices Tool is installed in all versions of the WRIA-1 DSS installation.
55
1458
Technical Documentation: Nooksack DBMS/LaunchPad
1459
1460
Last Revision: 3/22/04
1461
Table of Contents
1462
1463
1464
1465
1466
1467
1468
1469
1470
1471
1472
1473
1474
1475
1476
1477
1478
1479
1480
1481
1482
1. Table Designs
¾ Schema, Keys, Indexes and Structure
¾ Table Descriptions and Notes
2. Dependencies
¾ Software
¾ Module and Components
¾ Integrated Development Environment (IDE)
3. Setup
¾ Setup and Configuration
¾ Interactions between Client and Server
4. Building
¾ Code Compiling
¾ Individual Projects of the DBMS
¾ Installations
1483
56
1484
1485
1486
1487
1488
1489
1490
1. Table Designs
Database: LaunchPad
Table: Binaries
Description: Contains information about the products that the DBMS supports updating.
Any product in this list will be checked to see if the local computer has an up-to-date
copy, as well as giving users the option to install any missing component.
Primary
Field
Type Size Indexed
Comments
Key
productName
Text
50
Yes
No
Name of product or component.
currentVersion Text
50
No
No
Most recent version (version the server is
distributing)
No
No
Last date updated by the Update Tool
allowDownload Boolean
No
No
True/False – allow user to download the
component? [Not Implemeted]
recordnumber
Yes
Yes
Internal record number.
No
The last place the component was located
on the local computer when being
updated. Used for convenience from the
Updater tool.
updateDate
lastLocalPath
1491
1492
1493
1494
1495
Date/Time
Numeric
Text
255 No
Table: BinariesFiles
Description: Contains information about the files associated with each of the products in
the Binaries table.
Primary
Field
Type Size Indexed
Comments
Key
binaryRecNumber
Numeric
fullPathOnRemote
Text
filerecordnumber
Numeric
VersionFileForProduct Boolean
downloadPath
Text
filesize
Numeric
No
Recordnum from the Binaries table
that this record is associated with.
No
Where this file belongs on the client
computers.
Yes
Internal record number.
No
No
True/False – indicates that this file is
the file which determines the version
of the whole product.
400 No
No
Location (URL) where the file may
be downloaded from.
No
No
Size of the file, in bytes.
Yes
400 No
Yes
57
1496
1497
1498
1499
1500
Database: ChangeLog
Table: Changes
Description: Contains a log of who has changed data in the database. This table is filled
by triggers on every SQL server table.
Primary
Field
Type Size Indexed
Comments
Key
tablename
Text
150 No
No
The name of the table modified.
datemodified
Date/Time
No
No
Date the changes were made.
hostname
Text
150 No
No
The hostname of the computer making the
changes
username
Text
150 No
No
The username (if retrievable) of the user
making the changes.
appname
Text
150 No
No
Name of application making change
actiontaken
Text
150 No
No
Action taken – insert/delete/update
No
No
Record number altered in the table, if
available.
recordnumIFA Numeric
1501
1502
1503
1504
1505
Table: CommonUsers
Description: Known users who make changes to the database. Related to the table above
by username. Provides descriptive information about known users who make changes.
Primary
Field
Type Size Indexed
Comments
Key
Text 255 No
No
Username corresponding to the username in
Changes
commonname Text 255 No
No
The full name or descriptive information.
username
1506
1507
2. Dependencies
1508
1509
1510
1511
1512
1513
1514
1515
1516
1517
1518
1519
The DBMS requires the following software components and modules to be installed:
Software:
Visual Studio .NET 2002
Microsoft SQL Server 2000 (optional)
--This will provide administration tools which make management of the
databases much easier.-InstallShield Express 3.5 with Service Pack 4 (or better)
Components:
Microsoft Common Controls 6.0
Microsoft Common Controls-2 6.0
58
1520
1521
1522
1523
1524
1525
1526
1527
1528
1529
1530
1531
1532
1533
1534
1535
1536
1537
1538
1539
1540
1541
1542
1543
1544
1545
1546
1547
1548
1549
1550
1551
1552
1553
1554
1555
1556
1557
1558
1559
1560
1561
1562
1563
1564
Microsoft Common Controls-3 6.0
Microsoft FlexGrid Control 6.0
Fish Periodicity Lifestage Plotter Control (USU)
Microsoft SQL-DMO Data Object
Other parts of the DBMS/LaunchPad Suite: (described in section 4)
The DBMS/LaunchPad itself
DBMS Server (Windows Service)
DBMS Server Configuration Editor
DBMS Update Assistant
LaunchPad Product Updater
3. Setup
DBMS Server
The DBMS Server is a windows service. This needs to first be configured with the
DBMS Server configuration tool. First, set the root path for GIS data; this is the directory
containing the GIS data for which updates need to be propagated. Also set the
administrator’s e-mail address and a mail server which may be used to send mail, and set
the interval between data reindexes. This interval should be often enough to capture data
changes, but not more than every half hour.
When complete, save this configuration file to a location you’ll remember.
Next, install the DBMS Server service. This may be done by copying the binary
executable to a location on the server (any location is fine; typically, this is in a
subdirectory of c:\Program Files). Once the binary has been copied, use the
InstallUtil.exe file that should be with the binary executable. Type the following
command:
InstallUtil DBMSService.exe
The command will provide a great deal of output, hopefully finishing with an “Install
Successful”. Now, the service is listed under Services (Start-Settings-Control PanelAdministrative Tools-Services).
Move the configuration file you saved above so that it is located next to the
DBMSService.exe file. Do this before starting the service!
Now, it’s necessary to decide where to place binary update components and binary
installation packages. This can be anywhere you prefer. Copy these files into place, and
write down the path to each of these locations.
You’ll also need to create a database backup directory, where the DBMS Client will ask
the server to create a database backup to download (for updating databases). Write down
this path as well.
59
Finally, you’ll need a web server such as IIS (Internet Information Services) or Apache (a
free web server) installed. Configure your web server such that the directories above are
accessible.
1565
1566
1567
1568
1569
1570
1571
1572
1573
1574
1575
1576
1577
1578
1579
1580
1581
1582
1583
1584
1585
1586
1587
1588
1589
1590
1591
1592
1593
1594
1595
1596
1597
1598
1599
1600
1601
1602
1603
1604
1605
1606
1607
1608
1609
The directories which need to be accessible through the web browser, in summary:
1. GIS Data directory. This is the same directory that you
configured in the DBMS Server Configuration Tool.
2. The binary component update directory, storing the binary
components which will be updated with the DBMS.
3. The binary installation directory, storing the installation
programs which will be downloaded by the DBMS.
4. The database backup directory. Nothing needs to be placed in
this directory immediately; backups will be generated and
placed here for the database updater to download.
Items number two and three may optionally be the same directory, but number 1 should
not be shared with any other data items or files. It’s recommended that you use a separate
directory for each of these items.
Items 1, 3, and 4 are configured in the DBMS Client’s configuration file; item number 2
is configured on a per-component basis in the LaunchPad database.
Write down the URLs to get to each of these directories through the web server, as they
will be needed in the DBMS Client (LaunchPad) setup instructions. Also write down the
actual path to the database backup directory, relative to the server’s directory structure.
Next, MS SQL Server or MSDE will need to be installed on the server. Follow the
installation instructions for whichever of these two you’d like to use, then attach the
LaunchPad database and any other databases that you wish to update using the DBMS.
There should be five user databases total: ChangeLog, LaunchPad, WRIAReportData,
FlowData, and WaterQuality.
After attaching the LaunchPad database, check the contents of the Binaries table to
ensure that the products that you wish to be automatically updated are listed. You may do
this with the LaunchPadProductUpdater tool, or you may use a third-party database
modification tool. If you choose the latter, you’ll need to know this: for each Binaries
recordnumber, there are one or more BinariesFiles records that are associated with it
(Binaries.recordnumber -> BinariesFiles.binaryRecNumber). Also ensure that the
downloadpath and fullpathonremote fields in the BinariesFiles records are correct.
At this point, the server should be configured and ready for use.
DBMS Client (LaunchPad)
The DBMS Client uses a configuration file similar to that used by the server. There is not
a standalone configuration program for the DBMS Client, however. The configuration
60
1610
1611
1612
1613
1614
1615
1616
1617
1618
1619
1620
1621
1622
file, DBMS.conf, may be edited by hand using Notepad or it may be written by making
the appropriate changes using the Administrative Tools button in the DBMS Client itself.
Once this configuration file has been properly generated and set up, it may be distributed
to all clients along with the DBMS executable. You may also include the DBMS.conf file
with the binaries in an installer and distribute the installer to the clients. (A DBMS
standalone installer already exists.)
The configuration file contains connection information to reach the SQL server, as well
as the URLs for each of the directories listed under DBMS Server configuration. The
contents of the configuration file follow in the table below. Once each of these values is
configured, the DBMS Client configuration is complete.
Tag in Configuration
File
Purpose
Default Value
SQLServerAddr
SQL Server address.
Nooksack.uwrl.usu.edu
SQLPort
Port number of SQL
server
SQL Server
Username
SQL Server Password
Indicates whether to
use Integrated
Security.
Where to download
GIS data updates.
Where to download
binary installation
packages. (Individual
components
configured in
database.)
Where to download
database backups for
updating databases.
Path on server
(relative to server)
where database
backups are created
and stored.
Location of the binary
updates (NOT the
installers!) on the
server. Relative to the
22
SQLUID
SQLPWD
SQLTrusted
UpdateDLPath
BinaryDLPath
DatabaseDLPath
DatabaseBKPath
BinaryUpdatesPath
WRIAUser
quebec41
False
http://nooksack.uwrl.usu.edu/DBMSSource/
http://nooksack.uwrl.usu.edu/download/
http://nooksack.uwrl.usu.edu/dbupdates/
e:\nookweb\dbupdates\
e:\nookweb\DBMSSource\
61
DataUpdatesPath
ProxyUID
ProxyPWD
1623
1624
1625
1626
1627
1628
server.
Path to GIS data
updates, relative to
server.
Username to access
the proxy server with.
Encrypted.
Password to access
the proxy server with.
Encrypted.
E:\nookweb\DBMSSource
(blank)
(blank)
The DBMS needs to know the locations relative to the server so that it may prune
directories when necessary; it also needs to know the URLs to get the files in the first
place.
4. Building
1629
1630
1631
1632
1633
1634
1635
1636
1637
1638
1639
1640
1641
1642
1643
1644
1645
Compiling the DBMS and any of the DBMS-related tools is a straightforward task. After
ensuring that all of the required components discussed in item 3 above are present, load
the project into Visual Studio and click the Build icon, or select Build from the menu.
These instructions hold true for any of the individual projects of the DBMS.
The individual projects, their purpose, and their contents are described below.
DBMS Server (Windows Service)
This tool is used to maintain an index file of data available for the client tool (the
LaunchPad) to download. It runs as a windows service and scans the target directory (and
all subdirectories) to create the index file, taking the time between index scans and the
location for all files from the configuration file next to the executable. The server also
listens for requests to update the replication databases (the database backups that are
zipped in the download directory). The client can send the request, then disconnect and
let the server finish without an active connection; or, the client can send a request and
wait for completion, receiving progress updates along the way.
File Name
Purpose
AssemblyInfo.vb
Contains information relating to the DLL assembly. Generated by
VB.NET.
DBMSService.vb
The actual service routines. Contains an implementation of a
windows service.
This class causes the service to be installed as a service instead of
just as a binary application.
Contains a user connection class, a new instance of which is created
every time a new user connects to the service. This is currently
unused – see the DBMS source code.
ProjectInstaller.vb
UserConnection.vb
62
1646
1647
1648
1649
1650
1651
1652
1653
1654
1655
1656
1657
1658
1659
1660
1661
1662
1663
1664
1665
1666
DBMS Server Configuration Editor
This tool allows the configuration file used by the DBMS Server to be edited. This
provides a simple, easy-to-use interface to change values such as the time between
reindexes, location of GIS data, and administrator e-mail address.
Purpose
File Name
AssemblyInfo.vb
Contains information relating to the DLL assembly. Generated
by VB.NET.
frmConfigOptions.vb
Form containing the configuration file editor, providing a user
interface.
DBMS Update Assistant
This is a tool used by the DBMS/LaunchPad when it needs to download a product update
for itself. When started, it ends all instances of the DBMS it finds running, then
downloads the updated DBMS/LaunchPad executable from the location specified in the
LaunchPad database. After finishing, it restarts the DBMS.
File Name
Purpose
AssemblyInfo.vb
Contains information relating to the DLL assembly. Generated by
VB.NET.
DBMSAssist.vb
The form contains a progress meter showing activity – on load, the
form performs its actions described above.
LaunchPad Product Updater
This is a tool to facilitate uploading new versions of components by programmers. The
program lists all of the components available for updating and their associated files; a
product may be updated, or a new product may be added. The tool uploads the files to the
server and adds appropriate entries into the LaunchPad database.
Note: The “Allow User Download” feature is not implemented, i.e. all components may
be downloaded by the user.
Purpose
File Name
AssemblyInfo.vb
Contains information relating to the DLL assembly. Generated by
VB.NET.
Form1.vb
The form contains the fields to display all product information, and
allows the user to change the data or upload a new project to the
server.
1667
1668
1669
1670
63
1671
1672
1673
1674
1675
1676
1677
1678
1679
1680
1681
DBMS/LaunchPad Main Project
This is the main DBMS/LaunchPad. When the LaunchPad is first run, it will scan the
computer for all requisite components and data items. If something is missing, it will
provide the user with the opportunity to download and install it. If all necessary
components are present, the DBMS will allow the user to edit data on the master server
(if the Administrative Edition is in use), or the user may launch the Nooksack DSS. The
user may also check for updates – this causes the DBMS to scan the local computer to see
if any data items or binary components on the remote computer are newer than the local
components/data items. If newer components are found, the user may download and
install the updates. The LaunchPad may also be used to send a request to the server to
update the databases that are available for download (“replication databases”).
Purpose
File Name
AssemblyInfo.vb
Contains information relating to the DLL assembly.
Generated by VB.NET.
frmChangeLogView.vb
frmEditGlossary.vb
This form shows the log of changes made to the
database.
This is a simple status indicator used to show the
progress in updating the remote databases. This is
used only if the user decides to wait for the server to
finish, rather than disconnecting.
Allows the user to change fish distribution for a
drainage.
Allows the user to change the text block representing
fish habitat restoration projects.
Allows editing of the glossary terms and definitions.
frmEditISF.vb
Allows editing of instream flow requirements.
frmEditOverview.vb
Allows editing of the report overview. The
disclaimer is static and may not be edited.
Lets the user edit fish periodicity for a given dataset,
drainage, and stream segment.
Allows editing of recreational data – location and
activities – for a drainage.
Allows editing of stream closure data for a drainage.
Allows editing of the census data used in the report.
frmDlStatus.vb
frmEditFishDist.vb
frmEditFishHabitatRestoration.vb
frmEditPeriodicity.vb
frmEditRecreation.vb
frmEditStreamClosures.vb
frmEditWashingtonCensus.vb
frmEditZoningAbbrev.vb
frmFlowData.vb
frmFlowDataAgenciesImport.vb
64
Lets the user edit zoning abbreviations; i.e. R-Forest
= Rural Forest.
Lists flow data collected for a given station. Allows
user to select the station from a combo box.
Allows flow data agencies to be imported into the
database from a delimited text file.
frmFlowDataCommentsImport.vb
Allows flow data comments to be imported into the
database from a delimited text file.
frmFlowDataGageStationImport.vb Allows flow data gage stations to be imported into
the database from a delimited text file.
frmFlowDataImport.vb
Allows flow data to be imported into the database
from a delimited text file.
frmGridEditor.vb
Provides a generic form and datagrid to edit large
tables. The specific database and table are set at
runtime, as are the window caption, window labels,
and other details. The table can then be edited
through the bound datagrid. These settings are
accomplished through public data members
(.settings_*)
frmImportPreview.vb
Shows a preview of what the data will look like once
imported from the text file, to ensure it’s as desired
before performing an actual import. This is a generic
screen used from all of the import screens.
frmProxyConfiguration.vb
Web proxy configuration screen; appears whenever a
proxy server that requires authentication is detected.
frmREditAddAggrDrainage.vb
Inserts a drainage into a predefined aggregation.
frmREditAggregations.vb
Allows the user to add and remove drainages from
predefined aggregations, or add and remove
predefined aggregations.
frmREditDrainages.vb
Allows editing of the drainage information, e.g.
name, description, area.
frmRemoteEdit.vb
This is the “launcher screen” for remote data editors;
after a user has selected which database to edit, gives
the user a list of tables they may edit. Clicking a
table name launches the appropriate data editor form.
Also allows the user to alter database connection
information and alter installation and data download
URLs.
frmSectionEdit.vb
Allows the user to edit data sources, headings,
commentary, and visibility for all of the sections
within the report. These changes are made on the
master server, as with everything in DBMS, for
propagation to clients.
frmShellfishByDrainage.vb
Allows editing of the text block representing
shellfish comments for each drainage.
ReportMain.vb
This contains all of the preparation the reports
themselves. Maps are generated in this module as
well.
frmSplash.vb
This is the main screen – This does the component
checking to ensure requisite components are present.
This form is also responsible for the data update
scanning.
65
frmWaterQuality.vb
Allows the user to edit Water Quality data, including
import water quality data (Calls importer screens
below).
frmWellsByDrainage.vb
Allows altering the number of wells per drainage as
well as changing the well-related comments for the
drainage.
Allows the user to import water quality agency code
data from a delimited text file.
Allows the user to import water quality comment
code data from a delimited text file.
Allows the user to import water quality data from a
delimited text file.
Allows the user to import water quality data from a
delimited text file. All code descriptions must be
imported separately.
Allows the user to import water quality parameter
code data from a delimited text file.
Allows the user to import water quality QAQC
(quality assurance/quality check) codes from a
delimited text file.
Allows the user to import water quality source
database codes from a delimited text file.
Allows the user to import water quality stations from
a delimited text file.
This is the file transfer animation shown during a file
download or data update.
frmWQAgencyCodeImport.vb
frmWQCommentCodeImport.vb
frmWQDataCodeImport.vb
frmWQDataImport.vb
frmWQParameterCodeImport.vb
frmWQQAQCCodeImport.vb
frmWQSourceDatabaseImport.vb
frmWQStationImport.vb
web.avi
1682
1683
1684
1685
1686
1687
1688
1689
1690
1691
1692
1693
1694
1695
1696
1697
1698
1699
1700
Installers
An installer exists for only the DBMS/LaunchPad, as it is the only project intended to be
widely distributed. The Update Assistant is automatically downloaded when needed by
the DBMS, so no installer is necessary for it.
The DBMS/LaunchPad tool will download other components or installers as necessary,
so no other installations need to be built and shipped with this one.
66
1701
1702
1703
1704
1705
1706
1707
1708
1709
1710
1711
1712
1713
1714
1715
1716
1717
1718
1719
1720
1721
1722
1723
1724
1725
1726
1727
1728
1729
1730
1731
1732
1733
1734
1735
1736
1737
1738
1739
1740
1741
1742
Technical Documentation: The Habitat Time Series Model
Last Revision: 06/21/06
Table of Contents
1. Input Habitat Database Table Design
¾ Table Descriptions and Notes
¾ Schema, Keys, Indexes and Structure
¾ Table Relationship Diagrams
2. Input Daily Flow Database Table Design and Data Needs
¾ Table Descriptions and Notes
¾ Schema, Keys, Indexes and Structure
¾ Table Relationship Diagrams
¾ Scenario Run Data Needs
3. Input Model Nodes Shapefile Data Needs
¾ Type/Location of Data
¾ Tags on Layers
¾ Necessary Fields
¾ Selecting Nodes for Modeling
4. Weighted Usable Area (WUA) Data Needs
¾ Extrapolation Method Information
5. Output Database Table Design
¾ Table Descriptions and Notes
¾ Schema, Keys, Indexes and Structure
¾ Table Relationship Diagrams
6. Dependencies
¾ Software
¾ Modules and Components
¾ Integrated Development Environment (IDE)
7. Setup
¾ Setup
8. Code Compiling
¾ Project Files
¾ Reference Settings
67
1743
1744
1745
1746
1747
1748
1749
1750
1751
1752
1753
1. Input Habitat Database Table Design
Following is a list of tables that must be included with the Input Habitat Database. Other
tables and information may exist, but these tables must follow the described naming
conventions, spelling and cases, and types for each table and its parameters.
Table: tblLifestages
Description: Contains the Lifestage Information for each of the Species that are
available.
Primary
Field
Type
Size
Key Field
Comments
Key
Lifestage_ID
Yes
Auto
Long
(No
Yes
Number Integer
Duplicates)
Unique ID for each Lifestage
available. It corresponds with the
Lifestage_ID
Field
in
the
tblPeriodicity
table,
the
tblWUA_MethodB table, and the
tblWUA_MethodC table.
Species_ID
Yes
Long
Number
(Duplicates No
Integer
OK)
The ID for the Species that this
Lifestage belongs to. It corresponds
with the Species_ID Field in the
tblSpecies table.
Lifestage_Name Text
1754
1755
1756
1757
1758
255
No
No
Name of the Lifestage.
Table: tblNodes
Description: Contains the Node Info (ID, Drainage Info, Reach Info) for all available
nodes.
Primary
Field
Type
Size
Key Field
Comments
Key
Pk_NodeID
Node_ID
68
Auto
Number
Number
Yes
Long
Yes
(No
Integer
Duplicates)
This is a unique ID for each Node.
Yes
Long
(No
No
Integer
Duplicates)
This is the ID for this Node. It is the
value that corresponds with NodeID
that is stored in the Input Model
Nodes Point Shapefile.
It also
corresponds with the Node_ID Field
in the tblPeriodicity table, the
tblWUA_MethodB table, and the
tblWUA_MethodC.
Yes
Long
(Duplicates No
Integer
OK)
This is the ID for the Drainage that
this node belongs to.
Drainage_Name Text
255
No
This is the Name of the Drainage that
this node belongs to.
Reach_ID
Number
Yes
Long
(Duplicates No
Integer
OK)
This is the ID for the Reach that this
node belongs to.
Reach_Name
Text
255
This is the Name of the Reach that
this node belongs to.
Drainage_ID
1759
1760
1761
1762
Number
No
No
No
Table: tblPeriodicity
Description: Contains the Bi-Monthly Periodicity values.
Primary
Comments
Field
Type
Size
Key Field
Key
Periodicity_ID
Node_ID
Lifestage_ID
Jan_1
Jan_2
Auto
Number
Long
Integer
Yes
Yes
(No
Duplicates)
This is a unique ID for each set of
Periodicity values in the table.
Number
Long
Integer
Yes
(Duplicates No
OK)
This is the ID for the Node that this
set of Periodicity values belong to. It
corresponds with the Node_ID Field
in the tblNodes table.
Number
Long
Integer
Yes
(Duplicates No
OK)
This is the ID for the Fish that this set
of Periodicity values belong to. It
corresponds with the Lifestage_ID
Field in the tblLifestages table.
No
No
Periodicity Value for the 1st half of
January for the given fish, node pair.
Note: 0=Not Present, 1=Present,
2=Peak
No
Periodicity Value for the 2nd half of
January for the given fish, node pair.
Note: 0=Not Present, 1=Present,
2=Peak
Number
Number
Integer
Integer
No
Feb_1
Number
Integer
No
No
Periodicity Value for the 1st half of
February for the given fish, node
pair.
Note: 0=Not Present, 1=Present,
2=Peak
Feb_2
Number
Integer
No
No
Periodicity Value for the 2nd half of
February for the given fish, node
69
pair.
Note: 0=Not Present, 1=Present,
2=Peak
Mar_1
Mar_2
Apr_1
Apr_2
May_1
May_2
Jun_1
Jun_2
Jul_1
Jul_2
70
Number
Number
Number
Number
Number
Number
Number
Number
Number
Number
Integer
Integer
Integer
Integer
Integer
Integer
Integer
Integer
Integer
Integer
No
No
No
No
No
No
No
No
No
No
No
Periodicity Value for the 1st half of
March for the given fish, node pair.
Note: 0=Not Present, 1=Present,
2=Peak
No
Periodicity Value for the 2nd half of
March for the given fish, node pair.
Note: 0=Not Present, 1=Present,
2=Peak
No
Periodicity Value for the 1st half of
April for the given fish, node pair.
Note: 0=Not Present, 1=Present,
2=Peak
No
Periodicity Value for the 2nd half of
April for the given fish, node pair.
Note: 0=Not Present, 1=Present,
2=Peak
No
Periodicity Value for the 1st half of
May for the given fish, node pair.
Note: 0=Not Present, 1=Present,
2=Peak
No
Periodicity Value for the 2nd half of
May for the given fish, node pair.
Note: 0=Not Present, 1=Present,
2=Peak
No
Periodicity Value for the 1st half of
June for the given fish, node pair.
Note: 0=Not Present, 1=Present,
2=Peak
No
Periodicity Value for the 2nd half of
June for the given fish, node pair.
Note: 0=Not Present, 1=Present,
2=Peak
No
Periodicity Value for the 1st half of
July for the given fish, node pair.
Note: 0=Not Present, 1=Present,
2=Peak
No
Periodicity Value for the 2nd half of
July for the given fish, node pair.
Note: 0=Not Present, 1=Present,
2=Peak
Aug_1
Aug_2
Sep_1
Sep_2
Oct_1
Oct_2
Nov_1
Nov_2
Number
Number
Number
Number
Number
Number
Number
Number
Integer
Integer
Integer
Integer
Integer
Integer
Integer
Integer
No
No
No
No
No
No
No
No
No
Periodicity Value for the 1st half of
August for the given fish, node pair.
Note: 0=Not Present, 1=Present,
2=Peak
No
Periodicity Value for the 2nd half of
August for the given fish, node pair.
Note: 0=Not Present, 1=Present,
2=Peak
No
Periodicity Value for the 1st half of
September for the given fish, node
pair.
Note: 0=Not Present, 1=Present,
2=Peak
No
Periodicity Value for the 2nd half of
September for the given fish, node
pair.
Note: 0=Not Present, 1=Present,
2=Peak
No
Periodicity Value for the 1st half of
October for the given fish, node pair.
Note: 0=Not Present, 1=Present,
2=Peak
No
Periodicity Value for the 2nd half of
October for the given fish, node pair.
Note: 0=Not Present, 1=Present,
2=Peak
No
Periodicity Value for the 1st half of
November for the given fish, node
pair.
Note: 0=Not Present, 1=Present,
2=Peak
No
Periodicity Value for the 2nd half of
November for the given fish, node
pair.
Note: 0=Not Present, 1=Present,
2=Peak
Dec_1
Number
Integer
No
No
Periodicity Value for the 1st half of
December for the given fish, node
pair.
Note: 0=Not Present, 1=Present,
2=Peak
Dec_2
Number
Integer
No
No
Periodicity Value for the 2nd half of
December for the given fish, node
71
pair.
Note: 0=Not Present, 1=Present,
2=Peak
1763
1764
1765
1766
1767
Table: tblSpecies
Description: Contains the Species Information (ID, Name) for each one available.
Primary
Field
Type
Size
Key Field
Comments
Key
Species_ID
Yes
Auto
Long
Yes
(No
Number Integer
Duplicates)
Species_Name Text
1768
1769
1770
1771
1772
1773
255
No
No
This is a unique ID for each Species.
It corresponds with the Species_ID
Field in the tblLifestages table.
This is the Name of the Species.
Table: tblWUA_MethodB
Description: Contains the Weighted Usable Area (WUA) data for the Method B Data
Extrapolation Method.
Field
Type
Size
Key Field Primary Key Comments
Auto
WUAB_ID
Number
Node_ID
Number
Long
Integer
Yes
Yes
(No
Duplicates)
A unique ID for each Weighted
Usable Area (WUA) value.
Long
Integer
Yes
(Duplicates No
OK)
The ID for the Node that this
Weighted Usable Area (WUA)
value belongs to.
It
corresponds with the Node_ID
Field in the tblNodes table.
Yes
(Duplicates No
OK)
The ID for the fish that this
Weighted Usable Area (WUA)
value belongs to.
It
corresponds
with
the
Lifestage_ID Field in the
tblLifestages table.
Lifestage_I
Number
D
Long
Integer
Q
Number
Double
(Fixed: 3
No
decimal
places)
No
The Flow value for this
Weighted Usable Area (WUA)
value.
WUABVal
Number
_Feet
Double
(Fixed: 3 No
decimal
No
The Weighted Usable Area
(WUA) value where Units =
Ft/1000 Ft.
72
places)
WUABVal
Number
_Percent
1774
1775
1776
1777
1778
1779
Double
(Fixed: 3
No
decimal
places)
The Weighted Usable Area
(WUA) value where Units =
Percent of Maximum.
No
Table: tblWUA_MethodC
Description: Contains the Weighted Usable Area (WUA) data for the Method C Data
Extrapolation Method.
Primary
Field
Type
Size
Key Field
Comments
Key
WUAC_I
D
Node_ID
Auto
Long
Number Integer
Number
Long
Integer
Q
Double
WUACVal
(Fixed:
Number
_Percent
decimal
places)
A unique ID for each Weighted
Usable Area (WUA) value.
Yes
(Duplicates
OK)
No
The ID for the Node that this
Weighted Usable Area (WUA)
value belongs to. It corresponds
with the Node_ID Field in the
tblNodes table.
No
The ID for the fish that this
Weighted Usable Area (WUA)
value belongs to. It corresponds
with the Lifestage_ID Field in
the tblLifestages table.
No
The Flow value for this
Weighted Usable Area (WUA)
value.
No
The Weighted Usable Area
(WUA) value where Units =
Percent of Maximum
Yes
(Duplicates
OK)
Lifestage_
Long
Number
ID
Integer
Double
(Fixed:
Number
decimal
places)
Yes
Yes
(No Duplicates)
3
3
No
No
1780
1781
73
tblPeriodicity
tblLifestages
tblSpecies
Lifestage_ID
Species_ID
Lifestage_Name
Species_ID
Species_Name
tblNodes
pk_NodeID
Node_ID
Drainage_ID
Drainage_Name
Reach_ID
Reach_Name
Periodicity_ID
Node_ID
Lifestage_ID
Jan_1
Jan_2
Feb_1
Feb_2
Mar_1
Mar_2
Apr_1
Apr_2
May_1
May_2
Jun_1
Jun_2
Jul_1
Jul_2
Aug_1
Aug_2
Sep_1
Sep_2
Oct_1
Oct_2
Nov_1
Nov_2
Dec 1
tblWUA_MethodB
WUAB_ID
Node_ID
Lifestage_ID
Q
WUABVal_Feet
WUABVal_Percent
tblWUA_MethodC
WUAC_ID
Node_ID
Lifestage_ID
Q
WUACVal_Percent
1782
74
1783
1784
1785
1786
1787
1788
1789
1790
1791
1792
1793
1794
1795
1796
1797
2. Input Daily Flow Database Table Design and Data Needs
Following is a list of tables that must be included with the Input Daily Flow Database.
Other tables and information may exist, but these tables must follow the described
naming conventions, spelling and cases, and types for each table and its parameters.
Table: Parameter_Code Descriptions
Description: Contains the Code and Name for the available Parameters.
NOTE: The Parameters correspond with the Scenario Runs from the Water Quantity
Model.
Primary
Field
Type
Size
Key Field
Comments
Key
Yes
Parameter_
Long
Number
(Duplicates No
Code
Integer
OK)
This is a unique ID or Code for each
Parameter.
It corresponds with the
Parameter_Code Field in the WQData
table.
Parameter_
Text
Name
This is the Name of the Parameter.
For example: ScenarioID_StreamFlow.
50
No
Table: Stations
Description: Contains the ID and Name for the available Stations.
Primary
Field
Type Size Key Field
Comments
Key
Station
Text 50
Station_Name Text 50
1798
1799
1800
1801
1802
No
Yes
(Duplicates No
OK)
This is a unique ID for each Station. It
corresponds with the Station Field in the
WQData table.
No
This is the Name for the Station.
No
Table: WQData
Description: Contains the modeled Daily Stream Flow data from the Water Quantity
Model.
Primary
Field
Type
Size
Key Field
Comments
Key
Station
Text
Date
Date/Ti
me
50
Yes
(Duplicates
OK)
No
This is the Station that this value
belongs to. It corresponds with the
Station Field in the Stations table.
No
No
This the Date/Time of this value.
75
Yes
Parameter_
Long
Number
(Duplicates
Code
Integer
OK)
No
This is the Parameter Code for this
sample.
It corresponds with the
Parameter_Code
Field
in
the
Parameter_Code Descriptions table.
Value
No
This is the Daily Streamflow value.
Number Double No
Stations
Station
Station_Name
WQData
Station
Date
Parameter_Code
Value
Parameter_Code
Parameter_Code
Parameter_Name
1803
1804
1805
1806
1807
1808
1809
1810
1811
1812
1813
1814
1815
1816
1817
1818
1819
1820
1821
1822
1823
1824
Input Scenario Run Data Needs
The daily flow values written by the Water Quantity Model for a scenario run are all stored
with the same Parameter Name. These Parameters follow the naming convention:
ScenarioID_StreamFlow, where the ScenarioID is the Scenario ID from the model run in the
DSS Scenario Builder. Although the Habitat Time Series Model with most likely be run in
conjunction with the Water Quantity Model and the selected Input Scenario Run, the
Parameter Names in Parameter_Code Descriptions table in the Input Daily Flow Database,
will follow the described naming convention, it does not have to be selected from a Water
Quantity Model Run, so it can be named anything.
3. Input Model Nodes Shapefile Data Needs
There are two types of data required for the Input Model Nodes Shapefile: a point
shapefile path, and a Node ID shapefile field.
• Point Shapefile – this shapefile needs to be in the same project as the other
shapefiles in your project. It contains the point locations of each of the Model
Nodes. Connection Name – this is the name of the Time Series Analyst
Connection.
76
1825
1826
1827
1828
1829
1830
1831
1832
1833
1834
1835
1836
•
Node ID Shapefile Field – this field is a String field that contains the Node ID for
each of the Model Nodes. It corresponds with the Node_ID Field in the tblNodes
table for the Input Habitat Database, and with the Station Field in the Stations
table for the Input Daily Flow Database.
NOTE: If the Node ID in the shapefile is not found in either of the Input
Databases, then the model will still run, values will just not be computed for those
nodes, and there will be an entry in the log explaining why.
In order to specify the Nodes to model, the Model Nodes Shapefile must be selected and
added to the project. Then you can either select the which Nodes to model by specifying
the Node ID’s or by going to map and selecting with the Map Window Selection tools.
1837
1838
1839
1840
1841
1842
1843
1844
1845
1846
1847
1848
1849
1850
1851
4. Weighted Usable Area (WUA) Data Needs
1852
1853
1854
1855
1856
1857
1858
1859
1860
1861
5. Output Database Table Design
To be able to compute and write results to the Output Database for the Habitat Time
Series Model, the Weighted Usable Area (WUA) Data must be present in the Input
Habitat Database (see Section 1: Input Habitat Database Table Design). If it is not
present, then no data will be written to the Output Database, a message will be in the log
explaining why, and the Habitat Time Series Model will complete successfully.
The Weighted Usable Area (WUA) data is located in two tables: tblWUA_MethodB and
tblWUA_MethodC. The table tblWUA_MethodB is used to store the data that was created
using the Method B Data Extrapolation Method. The table tblWUA_MethodC is used to
store data that was created using the Method C Data Extrapolation Method. The data in
these tables is stored by reference to the Node, Fish, and Flow for that Weighted Usable
Area (WUA) value.
Following is a list of tables that must be included with the Output Database. Other tables
and information may exist, but these tables must follow the described naming
conventions, spelling and cases, and types for each table and its parameters.
Table: Fish
Description: Contains the Fish (Species and Lifestage) that have been modeled with the
Habitat Times Series Model.
Primary
Field
Type Size Key Field
Comments
Key
Fish_ID
Yes
Long
Number
(No
Yes
Integer
Duplicates)
This is a unique ID for each Fish. A
Fish is a Species and Lifestage pair.
This values is passed from the Habitat
Time Series Model. It corresponds
77
with the Lifestage_ID Field in the
tblPeriodicity table for the Input
Habitat Database (see Section 1: Input
Habitat Database Table Design).
Text
50
No
No
This is the name of the Species that
this Fish belongs to.
Lifestage_Name Text
50
No
No
This is the name of the Lifestage that
this Fish belongs to.
Species_Name
1862
1863
1864
1865
Table: Notes
Description: Contains any Notes about the Model Nodes (Stations).
Primary
Field Type
Size Key Field
Comments
Key
Yes
Long
NoteID AutoNumber
Yes
(No
Integer
Duplicates)
Station Text
Notes
1866
1867
1868
1869
1870
1871
50
Memo
This is a unique ID for each Note.
Yes
(Duplicates No
OK)
This is the Node (Station) that the Note
belongs to.
It corresponds with the
Node_ID Field in the tblNodes table for
the Input Habitat Database (see Section 1:
Input Habitat Database Table Design) and
the Station Field in the Stations table for
the Input Daily Flow Database (see
Section 2: Input Daily Flow Database
Design and Data Needs).
No
The Notes about the given Node (Station).
No
Table: Parameter_Code Descriptions
Description: Contains the Code and Name for the available Parameters.
NOTE: The parameters are created by the model using the Daily Flow Scenario Run
and the Weighted Usable Area (WUA) Units.
Primary
Comments
Field
Type
Size Key Field
Key
Parameter_Code AutoNumber
Parameter_Name Text
78
Yes
Long
Yes
(No
Integer
Duplicates)
100
No
No
This is a unique ID for each
Parameter.
This is the Name of the
Parameter.
Its value = “Habitat Times
Series Scenario Run ID”_HabTS
: Daily Flow Scenario Run”
(“WUA Units”).
1872
1873
1874
1875
Table: Stations
Description: Contains the ID and Name for the available Stations (Nodes).
Primary
Field
Type Size Key Field
Comments
Key
Station
Text 50
Station_Name Text 50
1876
1877
1878
Yes
(No
Yes
Duplicates)
This is a unique ID for each Station (Node). It
is the NodeID for the modeled nodes in the
Habitat Time Series Model. It corresponds
with the Node_ID Field in the tblNodes table
for the Input Habitat Database (see Section 1:
Input Habitat Database Table Design) and the
Station Field in the WQData table for the
Input Daily Flow Database (see Section 2:
Input Daily Flow Database Table Design and
Data Needs).
No
This is the description for the Station.
NOTE: It is often the same value as the
Station Field.
No
Table: TSData
Description: Contains the modeled Habitat Time Series data.
Primary
Field
Type
Size
Key Field
Comments
Key
No
This is the Station that this
modeled value belongs to. It
corresponds with the Station
Field in the Stations table.
Number
Yes
Long
(Duplicates No
Integer
OK)
This is the Parameter Code
that this modeled value
belongs to. It corresponds
with the Parameter_Code
Field in the Parameter_Code
Descriptions table.
Fish_ID
Number
Yes
Long
(Duplicates No
Integer
OK)
This is the Fish that this
modeled value belongs to. It
corresponds with the Fish_ID
Field in the Fish table.
TSDate
Date/Time
WUA
Number
Station
Parameter_Code
Text
255
No
No
No
This is the Date/Time for this
modeled value.
Double No
No
This is the modeled Weighted
79
Usable Area (WUA) value.
Flow
Number
Extrapolation_Method Text
EMethod_Units
1879
1880
80
Text
Double No
50
50
No
No
No
This is the Flow for this
modeled value.
No
This is the Weighted Usable
Area Data Extrapolation
Method used in the Input
Weighted
Usable
Area
(WUA) Data for this modeled
value.
NOTE: Valid values are:
Method B or Method C
No
This is the units of the
Weighted Usable Area Data
Extrapolation Method used in
the Input Weighted Usable
Area (WUA) Data for this
modeled value.
NOTE: Valid values are:
Ft^2/1000Ft or Percent of
Maximum Habitat (%)
Notes
NoteID
Station
Notes
Stations
Station
Station_Name
TSData
Parameter_Code Descriptions
Parameter_Code
Parameter_Name
Station
Parameter_Code
Fish_ID
TSDate
WUA
Flow
Extrapolation_Method
EMethod_Units
Fish
Fish_ID
Species_Name
Lifestage_Name
1881
1882
1883
1884
1885
1886
1887
1888
1889
1890
1891
1892
1893
1894
1895
1896
1897
6. Dependencies
The Time Series Analyst plug-in requires the following software components and
modules to be installed:
Software:
MapWindow 3.1
Visual Studio .NET 2003
Modules and Components:
DSS Interface Definitions
MapWindow Interfaces
MapWinGIS Components
Integrated Development Environment (IDE)
Visual Studio .NET 2003
81
1898
1899
1900
1901
1902
1903
1904
1905
1906
1907
1908
1909
1910
1911
1912
1913
1914
1915
1916
1917
1918
7. Setup
1919
1920
1921
1922
1923
1924
1925
1926
1927
8. Code Compiling
To begin using the Habitat Time Series Model, you must first load the Scenario
Builder/DSS Plug-in into Map Window. Once it is loaded, click on the DSS Menu
located on the Map Window Menu bar and select either Scenario Builder, or the name of
the Scenario that you want to run. Once the Scenario Builder is and the Habitat Time
Series Model is added to the current Scenario and the Run Date values selected, Run the
Scenario. If all of the input and output parameters have been correctly set and they are all
accessible, then the Habitat Time Series Model will run for the selected data. After it is
finished the user may view the run log if they desire. If any errors occur during the run,
an error log will appear explaining the error.
If the input and output data associations have not been properly set, then double click on
the Habitat Time Series scenario node, and a Parameters Form will appear allowing you
to edit the input and output data. Then, after the parameters have been properly
associated, Run the Scenario and after it is finished, the user may view the run log if they
desire or if any errors occurred, then an error log will appear explaining the error.
See the User’s Manual for more information and details on setting the parameters for the
Habitat Time Series Model.
Compiling the Time Series Analyst is a fairly straightforward task. After ensuring that all
of the required components discussed in Section 6: Dependencies are present, load the
project into Visual Studio .Net 2003. This DSS Model was created using Visual Basic
(VB).
The project needs to include the following files:
File Name
Purpose
AssemblyInfo.vb
clsFlow.vb
clsMainPhabTS.vb
clsPeriodicity.vb
82
Contains information relating to the DLL assembly.
Generated by VB.NET.
Contains a class for accessing and storing the Date/Flow data
from the Input Daily Flow Database (see Section 2: Input
Daily Flow Database Table Design and Data Needs) for a
fish.
Contains a class that implements the Map Window plug-in
interface and the DSS Model Interface and other functions
for editing the parameters for and running the Habitat Time
Series Model.
Contains an enumeration and a class for accessing and
storing the Periodicity Data from the Input Habitat Database
(see Section 1: Input Habitat Database Table Design).
clsWUA.vb
clsWUAInput.vb
frmConfiguration.vb,
frmConfiguration.resx
frmParameters.vb,
frmParameters.resx
frmSelectLayer.vb,
frmSelectLayer.resx
frmSelectNodes.vb,
frmSelectNodes.resx
frmSelectWUA.vb
frmSelectWUA.resx
modDatabase.vb
Contains a class for accessing and storing the calculated
Flow and Weighted Usable Area (WUA) values (Output
values) created when the model is run for a node.
Contains a class for access and storing the Weighted Usable
Area (WUA) values from the Input Habitat Database (see
Section 1: Input Habitat Table Design and Section 4:
Weighted Usable Area (WUA) Data Needs). It also contains
a class for calculating the output WUA, Flow values.
A Database Configuration form. This form is shown when
the user edits an Input or Output Database (see Section 1:
Input Habitat Database Table Design or Section 2: Input
Daily Flow Database Table Design and Data Needs or
Section 5: Output Database Table Design). It allows the
user to specify settings for an SQL Database (the Server
Address, User ID and Password, and Database Name) or the
Path for an Access Database. The connection for the
specified values can then be tested to make sure a valid
database is specified. To save the selected settings, click on
the Save Changes button; to cancel the changed settings,
close the form with the Red X button at the top of the form.
This form will only be shown if the user decides to edit any
of the Input or Output databases already associated with the
Habitat Times Series model.
A form that allows the user to view and edit the set the Input
and Output Parameters for the Habitat Time Series Model.
A form to select the Input Model Nodes point shapefile for
the Habitat Time Series Model (see Section 3: Input Model
Nodes Shapefile Data Needs). It allows the user to either
select a shapefile already loaded into Map Window, or to
select one from disk. This form will only be shown if the
user decides to edit the shapefile already associated with the
Habitat Time Series Model.
A form that allows the user to select the nodes to model,
either from the Map Window Map or from the list of
available nodes (see Section 3: Input Model Nodes Shapefile
and Data Needs). This form will only be shown if the user
decides to edit the selected nodes already associated with the
Habitat Time Series Model.
A form that allows the user the select the Weighted Usable
Area (WUA) Data Extrapolation Method and Units (see
Section 4: Weighted Usable Area (WUA) Data Needs). This
form will only be shown if the user decides to edit the
Weighted Usable Area Extrapolation Data already associated
with the Habitat Time Series Model.
Contains functions for access and writing to the Input and
Output database, and the variable definitions for the Input
83
modGlobals.vb
modParameters.vb
modShapefile.vb
modUtils.vb
1928
1929
1930
1931
1932
1933
1934
1935
1936
1937
1938
1939
1940
1941
1942
1943
1944
1945
1946
1947
1948
1949
1950
1951
1952
1953
1954
1955
1956
1957
1958
1959
and Output Database types, table and field names, and the
SQL default values.
Contains the definitions for variables used throughout the
project, such as MapWindow variables, model variables,
parameter variables, error variables, and others.
Contains the variable definitions for the Input Parameter
Names.
Contains the variable definitions and functions for accessing
data on the associated Model Nodes Shapefiles (see Section
3: Input Model Nodes Shapefile Data Needs).
Contains functions used throughout the project for reporting
errors, accessing files, and other functionality.
Now that the files and resources are there and the project is loaded into Microsoft Visual
Studio .NET 2003, please double check a couple of settings. These settings are all related
to the references associated with the project (see Section 6: Dependencies ).
Reference Settings:
ADODB
DssIntfcLib
MapWinGIS
MapWinInterfaces
stdole
System
System.Data
System.Drawing
System.Windows.Forms
System.XML
CopyLocal = False
CopyLocal= True
CopyLocal = False
CopyLocal = False
CopyLocal = False
CopyLocal = False
CopyLocal = False
CopyLocal = False
CopyLocal = False
CopyLocal = False
Now that these settings have been set correctly, click the Build icon, or select Build from
the menu. The mwPhabTimeSeriesModel.dll has now been created with Microsoft
Visual Studio .NET 2003. It is created in the mwTimeSeries subdirectory in the
\Plugins\ModelManager\Elements\mwPhabTimeSeriesModel\
folder. Next time that MapWindow is run, if the mwPhabTimeSeriesModel.dll was built
to the correct folder, the updated changes to the Habitat Time Series Model will be
available.
84
1960
Technical Documentation:
Lake Whatcom Water Quality Model
1961
1962
1963
1964
1965
1966
1967
1968
1969
1970
1971
1972
1973
1974
1975
1976
1977
1978
1979
1980
1981
1982
1983
1984
Last Revision: Feb 21, 2006
Table of Contents
1. Table Designs
¾ Table Descriptions and Notes
¾ Table Relationship Diagrams
2. Dependencies
¾ Software
¾ Module and Components
¾ Integrated Development Environment (IDE)
3. Setup
¾ Setup
¾ Customizations
4. Building
¾ Code Compiling
¾ Installations
85
1985
1986
1987
1988
1989
1990
1991
1992
1993
1994
1995
1996
1997
1998
1999
1. Table Designs
Land Cover Database: LandCoverSummary.mdb
(See “Technical Documentation For Land Cover Summarizer” for table designs)
Best Management Practices Database: BestManagementPractices.mdb
(See “Technical Documentation For Best Management Practices Tool” for table designs)
Lake Whatcom Water Quality Parameters Database: LakeWhatcomWQParameters.mdb
Table: EMCs
Field Name
DrainageID
Land_Cover_Code
EMC_TN
Data Type
Long Integer
Long Integer
Text
EMC_NH3
EMC_N03
EMC_TP
EMC_BOD
EMC_FC
Text
Text
Text
Text
Text
Table: Input Air Temperatures
Field Name
2000
2001
2002
Description
WRIA 1 Drainage ID
The associated land cover class id
Expected mean concentration (EMC) for total
nitrogen (mg/L)
EMC for ammonia (mg/L)
EMC for nitrate (mg/L)
EMC for total phosphorus (mg/L)
EMC for BOD (mg/L)
EMC for fecal coliform (mg/L)
Date
AvgTemperature
Data Type
Date / Time
Double
AirTempFlag
Text
Description
The date the temperature data was recorded
Average daily temperature at Abbotsford
Canada in degrees C
Flag for average daily air temperatures from
Abbotsford data
Table: Nodes
Field Name
DrainageID
NodeID
2003
86
Data Type
Long Integer
Long Integer
Description
WRIA 1 Drainage ID
ID of water quantity model nodes contained
within the drainage
2004
Table: Parameters
Field Name
DrainageID
DrainageName
AreaAcres
Areakm2
StreamDOPercentSat
Data Type
Long Integer
Text
Double
Double
Double
SurfaceDOPercentSat Double
2005
2006
2007
AirSoilSlope
Double
AirSoilIntercept
Double
TStreamSlope
Double
TStreamIntercept
Double
QbTemp
QbDO
Double
Double
Cb_TN
Cb_NH3
Cb_NO3
Cb_TP
Double
Double
Double
Double
Cb_BOD
Cb_FC
Double
Double
Description
WRIA 1 Drainage ID
Name of the WRIA 1 Drainage
Area of the drainage in acres
Area of the drainage in square kilometers
Streamflow DO Percent Saturation Parameter
(Calibration Parameter)
Surface Flow DO Percent Saturation Parameter
(Calibration Parameter)
Slope of Air Temperature Surface Soil
Temperature Relationship (Calibration
Parameter)
Intercept of Air Temperature Surface Soil
Temperature Relationship (Calibration
Parameter)
Slope of linear relationship between air
temperature and stream flow temperature
(Calibration Parameter)
Intercept of linear relationship between air
temperature and stream flow temperature
(Calibration Parameter)
Simulation Base Flow Temperature Deg. C
Base Flow Dissolved Oxygen Concentration
(mg/L)
Base Flow Total Nitrogen Concentration (mg/L)
Base Flow Ammonia Concentration (mg/L)
Base Flow Nitrate Concentration (mg/L)
Base Flow Total Phosphorus Concentration
(mg/L)
Base Flow BOD Concentration (mg/L)
Base Flow Fecal Coliform Bacteria
Concentration (#/100 mL)
Table: ZZZ_Land_Cover_Classes (NEW table in database)
Field Name
LC_ID
LC_Code
LC_Category
LC_Description
Data Type
Description
Double
Double
Text
Text
2008
2009
87
2010
2011
2012
2013
2014
2015
2016
2017
2018
2019
2020
2021
2022
2023
2. Dependencies
The Lake Whatcom Water Quality Model requires the following software to be installed:
Software:
MapWindow 3.1
DSS Model Manager
Integrated Development Environment (IDE):
Visual Studio .NET 2003 Complete Install
The Lake Whatcom Water Quality Model requires the data output by the following DSS
elements:
Land Cover Summary Tool
Best Management Practices Tool
2024
2025
2026
2027
2028
2029
3. Setup
2030
4. Building
2031
2032
2033
2034
2035
The WRIA-1_DSS Installation installs the Lake Whatcom Water Quality Model in the
MapWindow Plugins folder.
(This is usually located at C:\Program Files\MapWindow\Plugins\ModelManager\Elements”).
To compile the Best Management Practices Tool, add the files below to a Microsoft Visual
Studio .NET 2003 Visual Basic .NET Library Project.
mwLakeWhatcomWQModel project files:
File Name
AssemblyInfo.vb
clsLakeWhatcomWQModel.vb
DBClient.vb
DirectoryPicker.vb
frmConfiguration.vb
frmInputs.vb
frmSelectLayer.vb
frmSelectModelDirectory.vb
88
Purpose
Contains information relating to the DLL assembly.
Generated by VB.NET.
Runs the Lake Whatcom water quality model given the
settings provided.
Contains the routines used to connect to a database.
Custom component which allows a user to select a directory
from the computer’s file system.
Contains the routines used to select a database.
Allows the user to select the location of input and output
data for the model.
Contains the routines used to select a layer from
MapWindow’s view.
A form containing a DirectoryPicker component which
allows the user to select a directory from the file system, or
a directory to be created by the Water Quantity Model in
WaterQualityModel.vb
2036
2037
2038
2039
2040
2041
2042
2043
2044
2045
2046
2047
2048
2049
2050
2051
the current DSS Scenario Run.
Implements MapWindow Plugin and DSS Interface
routines, allowing the Lake Whatcom Model to act as a
MapWindow Plugin and a DSS element.
Add the following references to the project:
DssIntfcLib.dll
MapWinGIS.ocx
MapWinInterfaces.dll
mwBestManagementPractice.dll
System.dll
System.Data.dll
System.Drawing.dll
System.Windows.Forms.dll
System.Xml.dll
You are now ready to compile the project by clicking the Build Solution menu option under the
menu Build.
Lake Whatcom Waterbody Response Model project files
File Name
resenlwfpath.f95
apifunctions.f95
ConvertwsmodelOutputPath.f95
mapi.bat
Purpose
Lake Whatcom Waterbody Response Model
Fortran 95 source file
Library of file management routines through
Windows API
Conversion of LWWLM output to binary
format for Fortran model use
Fortran compiler script for creating LWWRM
executable
lf95 resenlwfpath apifunctions.f95
ConvertwsmodelOutputPath -exe rp.exe
-g -trace -ml winapi
2052
2053
2054
2055
2056
2057
2058
2059
2060
2061
2062
2063
2064
The rp.exe file is built using the Lahey Professional Fortran compiler version 5.6. It has no
additional dependencies.
The Lake Whatcom Water Quality Model is installed in all versions of the WRIA-1 DSS
installation.
89
2065
2066
2067
2068
Technical Documentation: Land Cover Changer Tool
Last Revision: Feb 21, 2006
2069
Table of Contents
2070
2071
2072
2073
2074
2075
2076
2077
2078
2079
2080
2081
2082
2083
2084
2085
2086
2087
1. GIS Data Needs
¾ Location of GIS Data
¾ Tags on Layers
2. Dependencies
¾ Software
¾ Integrated Development Environment (IDE)
3. Setup
¾ Setup
¾ Customizations
4. Building
¾ Code Compiling
¾ Installations
90
2088
2089
2090
2091
2092
2093
2094
2095
2096
1. GIS Data Needs
2097
2098
2099
2100
2101
2102
2103
2. Dependencies
2104
2105
2106
2107
2108
2109
3. Setup
2110
2111
2112
2113
2114
2115
4. Building
The Land Cover Changer Tool makes changes to land cover grids supported by MapWindow.
These grids include ASCII grids (*.asc), and binary grids (*.bgd). The Land Cover Changer
takes a grid as input, and outputs a grid reflecting the changes selected by the user.
The Land Cover Changer Tool sets the tag of a land cover layer in MapWindow to the string
value “LANDCOVER”.
The Land Cover Changer plug-in requires the following software to be installed:
Software:
MapWindow 3.1
Visual Studio .NET 2003 Complete Install
The WRIA-1_DSS Installation installs the Land Cover Changer Tool in the MapWindow Plugins
folder.
(This is usually located at C:\Program Files\MapWindow\Plugins\ModelManager\Elements”).
To compile the Land Cover Changer, add the files below to a Microsoft Visual Studio .NET
2003 Visual Basic .NET Library Project.
mwChangeLandCover project files:
File Name
AssemblyInfo.vb
BULLSEYE.CUR
ChangeLandCoverPlugin.vb
Common.vb
CURSOR.CUR
frmChangeLandCover.vb
frmSelectChanges.vb
Purpose
Contains information relating to the DLL assembly.
Generated by VB.NET.
Bullseye cursor used for indicating the next mouse click will
close the current land cover change polygon being drawn.
Implements MapWindow Plugin and DSS Interfrace routines,
allowing Land Cover Changer to act as a MapWindow Plugin
and a DSS element.
Common functions used by the land cover changer.
Cursor used for selecting polygons in shapefile for land cover
change boundaries.
Contains the routines used to create land cover change
boundary polygons.
Contains the routines used to select what land cover changes
91
frmSelectLayer.vb
frmSettings.vb
OpenDirectoryDialog.vb
PENCIL.CUR
2116
2117
2118
2119
2120
2121
2122
2123
2124
2125
2126
2127
2128
2129
2130
2131
2132
2133
2134
2135
2136
2137
2138
2139
2140
2141
2142
2143
2144
2145
2146
2147
2148
2149
2150
2151
2152
to perform inside a selected boundary.
Contains the routines used to select a layer from
MapWindow’s view.
Contains the routines used to select the settings for the Land
Cover Change Tool.
Contains the routines used to select a directory to be used by
the Land Cover Change Tool.
Pencil cursor used when drawing a land cover change
boundary on MapWindow’s view.
Add the following references to the project:
DssIntfcLib.dll
MapWinGIS.ocx
MapWinInterfaces.dll
Microsoft.VisualBasic.Compatibility.dll
stdole.dll
System.dll
System.Data.dll
System.Design.dll
System.Drawing.dll
System.Windows.Forms.dll
System.Xml.dll
You are now ready to compile the project by clicking the Build Solution menu option under the
menu Build.
The Land Cover Changer Tool is installed in all versions of the WRIA-1 DSS installation.
92
2153
2154
2155
2156
2157
2158
2159
2160
2161
2162
2163
2164
2165
2166
2167
2168
2169
2170
2171
2172
2173
2174
2175
2176
2177
2178
2179
Technical Documentation: Land Cover Summarizer Tool
Last Revision: Feb 22, 2006
Table of Contents
1. Table Designs
¾ Schema, Keys, Indexes, and Structure
¾ Table Descriptions and Notes
¾ Table Relationship Diagrams
2. GIS Data Needs
¾ Location of GIS Data
3. Dependencies
¾ Software
¾ Module and Components
¾ Integrated Development Environment (IDE)
4. Setup
¾ Setup
¾ Customizations
5. Building
¾ Code Compiling
¾ Installations
93
2180
2181
2182
2183
1. Table Designs
Database: LandCoverSummary
Field Name
ScenarioID
WatershedID
WatershedName
LandCoverValue
Area
Data Type
Number
Number
Text
Number
Number
2184
2185
2186
2187
2188
2189
2190
2191
2. GIS Data Needs
2192
2193
2194
2195
2196
2197
2198
3. Dependencies
2199
2200
2201
2202
2203
2204
4. Setup
2205
2206
2207
2208
2209
2210
2211
2212
2213
5. Building
The Land Cover Summarizer Tool summarizes the land cover types within each shape in a
watershed shapefile using a land cover grid supported by MapWindow. These grids include
ASCII grids (*.asc), and binary grids (*.bgd). The Land Cover Summarizer takes a shapefile and
a grid as input, and outputs a list of land cover summaries for each shape in the shapefile.
The Land Cover Summarizer plug-in requires the following software to be installed:
Software:
MapWindow 3.1
Visual Studio .NET 2003 Complete Install
The WRIA-1_DSS Installation installs the Land Cover Summarizer Tool in the MapWindow
Plugins folder.
(This is usually located at C:\Program Files\MapWindow\Plugins\ModelManager\Elements”).
To compile the Land Cover Summarizer, add the files below to a Microsoft Visual Studio .NET
2003 Visual Basic .NET Library Project.
Add the following references to the project:
DssIntfcLib.dll
MapWinGIS.ocx
MapWinInterfaces.dll
stdole.dll
94
2214
2215
2216
2217
2218
2219
2220
2221
2222
2223
2224
2225
2226
2227
2228
2229
2230
2231
2232
2233
2234
2235
2236
2237
2238
2239
2240
2241
2242
2243
2244
2245
2246
System.dll
System.Data.dll
System.Drawing.dll
System.Windows.Forms.dll
System.Xml.dll
You are now ready to compile the project by clicking the Build Solution menu option under the
menu Build.
LandCoverSummarizer project files:
File Name
Purpose
AssemblyInfo.vb
Contains information relating to the DLL assembly. Generated by
VB.NET.
Common.vb
Common functions used by the land cover changer.
DBClient.vb
Contains the routines used to connect to a database and store the
computed land cover summary.
frmConfiguration.vb Contains the routines used to select a land cover summary database.
frmModelProps.vb
Contains the routines used to select the settings for the Land Cover
Summarizer.
frmSelectLayer.vb
Contains the routines used to select a layer from MapWindow’s view.
LandCoverFilter.vb
Implements MapWindow Plugin and DSS Interface routines, allowing
Land Cover Summarizer to act as a MapWindow Plugin and a DSS
element.
The Land Cover Summarizer is installed in all versions of the WRIA-1 DSS installation.
95
2247
Technical Documentation: Macroinvertebrate Data Viewer
2248
2249
Last Revision: 06/15/06
Table of Contents
2250
2251
2252
2253
2254
2255
2256
2257
2258
2259
2260
2261
2262
2263
2264
2265
2266
2267
2268
2269
1. Table Design
¾ Schema, Keys, Indexes and Structure
¾ Table Descriptions and Notes
¾ Table Relationship Diagrams
2. Data Needs
¾ Type/Location of Data
3. Dependencies
¾ Software
¾ Module and Components
¾ Integrated Development Environment (IDE)
4. Setup
¾ Setup
5. Code Compiling
96
2270
2271
2272
2273
2274
2275
2276
2277
2278
2279
2280
2281
2282
2283
2284
2285
1. Table Design
Following is a list of tables that must be included with the Macroinvertebrate Data
Viewer Database. Other tables and information may exist, but these tables must follow
the described naming conventions, spelling and cases, and types for each table and its
parameters. This database must be an Access or *.mdb database.
Table: Group_Identification
Description: Contains the Group_ID, Taxa, and Sorting Crew for each of the
macroinvertebrate samples.
Primary
Comments
Field
Type Size Key Field
Key
Group_ID Text 50
Yes
(Duplicates No
OK)
This is an ID for each Group that processed a
sample. It corresponds with the Group_ID Field in
the Macroinvertebrate_Data table.
NOTE: INSE used the list with numbers, while
Bellingham used the list with letters.
Taxa
Text 50
No
No
Name of the bugs that define this group
Sorted By Text 50
No
No
Indicates which crew sorted the original sample
Table: Macroinvertebrate_Data
Description: Contains the MacroInvertebrate Sample data for each Site, Group pair for
the sizing groups = 1-2mm, 2-4mm, 4-6mm, 6-8mm, 8-10mm, >10mm.
Primary
Field
Type Size
Key Field
Comments
Key
Site_ID
Yes
Number Double (Duplicates No
OK)
Site Identifier for this sample.
It
corresponds with the Site_ID Field in the
Site_Information
table
and
the
Unique_SiteID_List table.
Group_ID
Text
No
Group Identifier for this sample. It
corresponds with the Group_ID Field in
the Group_Identification table.
Size1_2_mm Number Double No
No
Sample count for the Group Size = 1 –
2mm. The Default Value = 0 for this
field.
Size2_4_mm Number Double No
No
Sample count for the Group Size = 2 –
4mm. The Default Value = 0 for this
field.
Size4_6_mm Number Double No
No
Sample count for the Group Size = 4 –
6mm. The Default Value = 0 for this
50
No
97
field.
2286
2287
2288
2289
2290
2291
Size6_8_mm Number Double No
No
Sample count for the Group Size = 6 –
8mm. The Default Value = 0 for this
field.
Size8_10_mm Number Double No
No
Sample count for the Group Size = 8 –
10mm. The Default Value = 0 for this
field.
Size10_+_mm Number Double No
No
Sample count for the Group Size =
>10mm. The Default Value = 0 for this
field.
Table: Site_Information
Description: Contains all the information (Site ID, Site Name, Sample Name, Sample
Type, Time In and Out, Velocity In and Out, Site Location, Net size, etc.) about a Site for
each sample that was taken and processed.
Primary
Field
Type
Size
Key Field
Comments
Key
Site_ID
Site_Name
Number
Text
Sample_Nam
Text
e
Yes
Double (Duplicates No
OK)
This is a unique ID for each Site
where a sample was taken.
It
corresponds with the Site_ID Field in
the Macroinvertebrate_Data table and
the Unique_SiteID_List table.
255
No
This is the Name of the Site where the
sample was taken. It corresponds
with the Site_Name Field in the
Unique_SiteID_List table.
No
This is the Name for the sample that
was taken. It corresponds with the
Sample_Name
Field
in
the
Unique_SiteID_List table.
255
No
No
Fraction_Sub
Number
sampled
Double No
No
This is the fraction of the sample that
was actually counted.
For Example: A value = 0.5 would
mean that 50% or 1/2 of the sample
was counted.
Sample_Typ
Text
e
255
No
This is the Type of sample that was
taken. There are two types available :
drift and benthic
No
These are the initials of the technician
who dealt with the sample in house.
NOTE: The technician did not
necessarily collect the sample.
Initials
98
Text
255
No
No
Time_In
Time_Out
Text
Text
Velocity_In_
Number
(m/s)
Velocity_Out
Number
_(m/s)
Northing_(U
Number
TM_NAD83)
Easting_(UT
Number
M_NAD83)
255
255
No
No
Double No
Double No
Double No
Double No
No
This is the Time that the net
into the water to collect the
Value is in Military Time
24:00).
NOTE: this value is only
Sample_Type = drift.
was put
sample.
(0:00 –
valid if
No
This is the Time that the net was taken
out of the water when collecting the
sample. Value is in Military Time
(0:00 – 24:00).
NOTE: this value is only valid if
Sample_Type = drift.
No
This is the Velocity of the water when
the net was put into the water to
collect the sample. Value is in meters
per second (m/s).
NOTE: this value is only valid if
Sample_Type = drift.
No
This is the Velocity of the water when
the net was taken out of the water
when collecting the sample. Value is
in meters per second (m/s).
NOTE: this value is only valid if
Sample_Type = drift.
No
This is the Northing value (Y-value)
of the location of the Site where the
sample was taken.
Value is in
UTM_NAD83 coordinate projection.
NOTE: this is NOT the location of the
net or benthic device used to collect
the sample.
No
This is the Easting value (X-value)
of the location of the Site where the
sample was taken.
Value is in
UTM_NAD83 coordinate projection.
NOTE: this is NOT the location of the
net or benthic device used to collect
the sample.
Net_Area_(m
Number
^2)
Double No
No
This is the Area of the Net that was
used to collect the sample. Value is in
square meters (m^2).
NOTE: this value is only valid if
Sample_Type = drift
Bed_Area_(
255
No
This is the Area enclosed by the
Text
No
99
m^2)
benthic device that was used to collect
the sample. Value is in square meters
(m^2).
NOTE: this value is only valid if
Sample_Type = benthic.
Net_Meshsiz
Number
e_(um)
2292
2293
2294
2295
Double No
No
This is the Size of the mesh that is in
the net or benthic device used to
collect the sample. Value is in
micrometers (um).
Table: Unique_SiteID_List
Description: Contains the unique list of Site, Sample pairs available.
Primary
Comments
Field
Type Size Key Field
Key
Site_ID
Site_Name
Yes
Number Integer (Duplicates No
OK)
This is a unique ID for each Site,
Sample pair. It corresponds with the
Site_ID
Field
in
the
Macroinvertebrate_Data table and the
Site_Information table.
Text
No
This is the Name of the Site where the
sample was taken. It corresponds with
the Site_Name Field in Site_Information
table.
No
This is the Name for the sample that was
taken.
It corresponds with the
Sample_Name
Field
in
the
Site_Information table.
Sample_Name Text
2296
2297
2298
100
255
255
No
No
Unique_SiteID_Lis
Site_ID
Site_Name
Sample_Name
Site Information
Site_ID
Site_Name
Sample_Name
Fraction_Subsampled
Sample_Type
Initials
Time_In
Time_Out
Velocity_In_(m/s)
Velocity_Out_(m/s)
Northing_(UTM_NAD83)
Easting_(UTM_NAD83)
Net_Area_(m^2)
Bed_Area_(m^2)
Macroinvertebrate Data
Site_ID
Group_ID
Size1_2_mm
Size2_4_mm
Size4_6_mm
Size6_8_mm
Size8_10_mm
Size10 + mm
Group Identification
Group_ID
Taxa
Sorted By
2299
2300
2301
2302
2303
2304
2305
2306
2307
2308
2309
2. Data Needs
2310
3. Dependencies
2311
2312
2313
2314
2315
2316
2317
The only data that is required for the MacroInvertebrate Viewer is the Access database
with the above defined table design. The database connection is only set up for an
Access database. The associated database should be located in the
C:\Program Files\WRIA-1_DSS\DSS_Data\Macroinvert Data\
file folder.
The Macroinvertebrate Data Viewer plug-in requires the following software components
and modules to be installed:
Software:
MapWindow 3.1
Visual Studio .NET 2003
101
2318
2319
2320
2321
2322
2323
2324
2325
Modules and Components:
MapWindow Interfaces
Microsoft Chart Control 6.0 (SP4) (OLEDB)
MSDATARC
Integrated Development Environment (IDE)
Visual Studio .NET 2003
2326
2327
2328
2329
2330
2331
2332
2333
2334
2335
2336
2337
2338
2339
2340
2341
4. Setup
2342
2343
2344
2345
2346
2347
2348
2349
5. Code Compiling
To begin using the Macroinvertebrate Data Viewer, it must first be loaded into
MapWindow. Once it is loaded, click on the bug icon, , located on the Map Window
toolbar If the database associations (as described in Section 2: Data Needs) have been
configured properly and the database is accessible, then the Macroinvertebrate Data
Viewer will appear allowing the user to select and view macroinvertebrate sample data.
If the data associations have not been properly set, then a Connection Form will appear
allowing you to type a path to or select the database. Then, after the database has been
properly associated, select the bug icon, , from the Map Window toolbar and the viewer
will appear allowing the user to view the collected data.
See the User’s Manual for more information and details on associating the data with the
Macroinvertebrate Data Viewer.
Compiling the Macroinvertebrate Data Viewer is a fairly straightforward task. After
ensuring that all of the required components discussed in Section 3: Dependencies are
present, load the project into Visual Studio .Net 2003. This Plugin was created using C#
(C Sharp).
The project needs to include the following files:
Purpose
File Name
AssemblyInfo.cs
bug.ico
dbManager.cs
frmDBConnection.cs,
frmDBConnection.resx
102
Contains information relating to the DLL assembly. Generated by
C#.NET.
Bug icon that is used in the MapWindow Toolbar and on the
Macroinvertebrate Data Viewer.
NOTE: this file needs to be an embedded resource
Class that contains variables and functions to access and read the
sample data stored in the associated database.
Displays the Connection form that allows the user to associate the
access database with the Macroinvertebrate Data Viewer plug-in.
frmErrorDialog.cs,
frmErrorDialog.resx
Displays the form to display an Error Message when an error
occurs in the Plugin. It allows the user to view the specific
details of an error if they desire.
frmMacroDataViewer.cs, Displays the Macroinvertebrate Data Viewer form. You show the
frmMacroDataViewer.resx viewer by selecting the bug icon, , from the Map Window
toolbar. This form contains plots, tables to display the data
contained in the associated database.
Globals.cs
Contains a class that contains variables (for Map components),
properties, and functions that can be used throughout the project.
main.cs
Contains a class that implements the MapWindow plugin
interface.
PluginInfo.cs
Contains a class that implements an interface to access (read from
and write to) the Project File.
2350
2351
2352
2353
2354
2355
2356
2357
2358
2359
2360
2361
2362
2363
2364
2365
2366
2367
2368
2369
2370
2371
2372
2373
2374
2375
2376
2377
2378
2379
2380
2381
2382
Now that the files and resources are there and the project is loaded into Microsoft Visual
Studio .NET 2003, please double check a couple of settings. These settings are all related
to the references associated with the project (see Section 3: Dependencies ).
Reference Settings:
AxMSChart20Lib
CopyLocal = True
MapWinInterfaces
CopyLocal = False
MSChart20Lib
CopyLocal = True
MSDATASRC
CopyLocal = False
stdole
CopyLocal = False
System
CopyLocal = False
System.Data
CopyLocal = False
System.Drawing
CopyLocal = False
system.web.services
CopyLocal = False
System.Windows.Forms
CopyLocal = False
System.XML
CopyLocal = False
Now that these settings have been set correctly, click the Build icon, or select Build from
the menu. The mwMacroInvertDataViewer.dll has now been created with Microsoft
Visual Studio .NET 2003. It is created in the mwMIVViewer subdirectory in the \Plugins
folder. Next time that MapWindow is run, if the mwMIVViewer.dll was built to the
correct folder, the updated changes to the Macroinvertebrate Data Viewer will be
available.
103
2383
Technical Documentation:
Model Manager / Scenario Builder / DSS
2384
2385
2386
Last Revision: 12/30/04
2387
Table of Contents
2388
2389
2390
2391
2392
2393
2394
2395
2396
2397
2398
2399
2400
2401
2402
2403
2404
2405
2406
2407
2408
2409
2410
1. Table Designs
¾ Schema, Keys, Indexes and Structure
¾ Table Descriptions and Notes
2. Dependencies
¾ Software
¾ Module and Components
¾ Integrated Development Environment (IDE)
3. Setup
¾ Setup and Configuration
¾ Interactions between Client and Server
4. Building
¾ Code Compiling
5. Model Manager Elements
¾ Model Manager Interface
104
2411
2412
2413
2414
2415
2416
2417
2418
2419
2420
2421
1. Table Designs
Database: DSSData.mdb
Table: FilePaths
Description: This table stores the locations of the files used by models running inside the
model manager. A model can request a file of a specific DataType, which will present the
user with a dialog asking which of the matching datatypes should be used. They’re
differentiated by FileID, which can be any identifier – string, number, etc. ScenarioID
refers to the scenario which added the file path to the database – scenario 0 is reserved for
unedited, base data.
Primary
Field
Type
Size Indexed
Comments
Key
RecordID Numeric
Yes
Internal record identifier.
Yes
No
Identifier for this file. For example, “Commercial
Zoning”, “Comprehensive Zoning”
No
This is the full path to the file on disk.
Yes
No
The ID of the scenario which added this file path.
0 is reserved for unedited base data.
No
No
Type of data. Can be any string, for example
“zoning”, “land use”
FileID
Text
50
FilePath
Text
255 No
ScenarioID Numeric
DataType Text
2422
2423
2424
2425
2426
Yes
25
Table: scenario_logs
Description: This table stores the run log generated by a scenario when it is executed.
The log contains information about what elements were run and with what parameters.
Primary
Field
Type
Size Indexed
Comments
Key
ScenarioLogID Numeric
Yes
Yes
Unique identifier for this scenario log.
RunDate
Date/Time
No
No
The date that the run was executed
UserName
Text
No
No
The name of the user logged in while
running this scenario.
StartDate
Date/Time
No
No
The start date for the date range of the run.
Not all elements use this.
EndDate
Date/Time
No
No
The end date for the date range for this
scenario run. Not all elements use this.
50
MapWinVersion Text
50
No
No
The version of MapWindow in use for this
run.
OSName
50
No
No
The operating system this run was
executed on.
Text
105
2427
2428
2429
2430
2431
2432
OSVersion
Text
50
No
No
The version of the operating system this
run was executed on.
DSSVersion
Text
50
No
No
The version of the Model Manager in use
for the run.
SysRAM
Text
50
No
No
The amount of RAM in the system
running this scenario.
SysSpeed
Text
50
No
No
The speed of the system running this
scenario.
SysOther
Text
50
No
No
Used for other information about the
computer which ran this scenario.
DataVersion
Text
50
No
No
The version of the GIS data in use for the
run.
No
No
The textual log for the scenario run,
including the results of each individual
element that was run.
Yes
No
This is the scenario
ScenarioLog
Text
0
ControlFileID
Numeric
Table: ScenarioControlFiles
Description: This table holds the actual scenarios themselves; when the user saves the
scenario, it goes into this table – opening a scenario similarly lists the scenarios in this
table.
Primary
Field
Type
Size Indexed
Comments
Key
ScenarioID
Numeric
Yes
Yes
The ID number for this scenario, referenced
by all other tables in this database.
ScenarioName Text
50
Yes
No
The textual name of the scenario.
FileData
0
No
No
This is the actual scenario data, in a
proprietary binary format.
50
Yes
No
The GUID of the scenario – a type of unique
identifier.
Binary
ScenarioGUID Text
2433
2434
2435
2436
2437
2438
2439
2440
2441
2442
2443
2. Dependencies
The Model Manager, aka Scenario Builder, aka “DSS”, requires the following software
components and modules to be installed:
Software:
Visual Studio .NET 2002
106
2444
2445
2446
2447
2448
2449
2450
2451
2452
2453
2454
2455
2456
2457
2458
2459
2460
2461
2462
2463
2464
2465
2466
2467
2468
2469
2470
2471
2472
2473
2474
2475
2476
2477
2478
2479
2480
Components:
Microsoft Common Controls 6.0
Microsoft Common Controls-2 6.0
Microsoft Common Controls-3 6.0
Microsoft FlexGrid Control 6.0
MDAC (Microsoft Data Access Components) 2.7
AddFlow ActiveX Component Version 3.0
DotNetBar Component for Menus and Dockable Toolbars Version 2.6.0.1
3. Setup
After building the plugin DLL, create a folder called ModelManager inside the Plugins
folder, which may be found wherever MapWindow is installed (typically c:\Program
Files\MapWindow). Copy the compiled DLL and any other files produced by the
compilation in this directory.
In this folder (ModelManager), create a folder called Elements. Inside this folder, place
any compiled model element DLLs you wish to use with the Model Manager.
Start MapWindow, and start the DSS / Scenario Builder as indicated by the user’s
manual. You will likely be presented with the database configuration screen, which you
will need to use to locate the DSSData.mdb file on your hard disk (or locate a DSSData
SQL Server database). If you have installed a complete pre-assembled DSS, this will
probably be set already. The model manager will save its configuration when the proper
database has been located. The Model Manager will then be ready for use.
4. Building
Compiling the Model Manager is a simple process, after ensuring that all of the
components listed in section 2 are present. Open the mwDSS.sln project with Visual
Studio, and select the Build menu; then select Build All.
The Model Manager Visual Studio project is described below:
mwDSS Model Manager / Scenario Builder Project
File Name
Purpose
DataManager\DataManager.vb
Automates the connection to the underlying DSS
database.
Images\
Contains various images used within forms, such
as the start and stop images for scenarios.
This is the container for the ActiveX addflow
component, instantiated once for each open
ScenarioBuilder\AddFlowWrapper.vb
107
scenario.
ScenarioBuilder\frmAuthenticate.vb
Used to set the scenario password.
ScenarioBuilder\frmConfiguration.vb
This form is used to configure the database
connection for the scenario builder.
ScenarioBuilder\frmEditBaseData.vb
This allows editing of the file paths for the base
data stored in the underlying DSS database.
ScenarioBuilder\frmLogViewer.vb
This provides a user interface to view the
scenario run log generated by a scenario run.
ScenarioBuilder\frmNodeProps.vb
Displays the properties of the model element or
node currently selected in the scenario.
ScenarioBuilder\
Settings file controlling the menu items and the
frmScenarioBuilder.DockManager.xml
attributes of those items within the scenario
builder. Read by the DotNetBar ActiveX control.
ScenarioBuilder\frmScenarioBuilder.vb Main scenario builder form. Utilizes DotNetBar
and AddFlow (through the wrapper) to put
together the form on initialization.
ScenarioBuilder\frmScenarioProps.vb
Shows and allows editing of the scenario
properties, such as name and comments.
ScenarioBuilder\frmSelectControlFile.vb This is essentially the “open scenario” dialog
box.
ScenarioBuilder\frmSelectFileID.vb
This is essentially a “select layer” dialog box,
retrieving the options from the file paths stored in
the underlying database.
ScenarioBuilder\ModelInfo.vb
A class used to hold the attributes for each model
in the scenario builder.
ScenarioBuilder\ModelLoader.vb
This is the class used to load the models from
their DLL files, creating a ModelInfo class for
each.
Utils\Common.vb
Contains miscellaneous common functions such
as swap, append/delete attribute from XML file,
etc.
Utils\DBClient.vb
Provides a layer of abstraction to access the
database interface.
Utils\FolderUtils.vb
Provides the “browse for folder” dialog box as
well as the CopyFolder function.
Utils\frmSelectLayer.vb
This dialog allows the user to select a layer from
a file or from layers currently loaded in
MapWindow.
Utils\SystemInfo.vb
This class retrieves information about the system,
for storage into the scenario run log.
AssemblyInfo.vb
Contains versioning information for this product.
DSSPlugin.vb
108
This is where the MapWindow plug-in interface
is implemented, typing the scenario builder into
MapWindow.
2481
2482
2483
2484
2485
2486
2487
2488
2489
2490
2491
2492
2493
2494
2495
2496
2497
2498
2499
2500
2501
2502
2503
2504
2505
2506
2507
2508
2509
2510
2511
2512
2513
2514
2515
2516
2517
2518
2519
2520
2521
2522
2523
2524
2525
2526
5. Model Manger Elements
Model Manager elements will need to implement the model interface. This is a .NET
DLL interface very similar to the MapWindow interface. A model manager element will
compile to a DLL, and, assuming it properly implements the model interface and is
placed inside the Elements folder (located where the Model Manager DLL is located), it
will appear as an element inside the Model Manager.
It’s useful to note that a model element can implement both the MapWindow plug-in
interface and the Model Manager interface at the same time. Any other interface which is
useful to implement may also be implemented. If both MapWindow and Model Manager
interfaces are implemented, some functions will overlap, such as “Author”, “BuildDate”,
and “Version”. If your programming language supports it, you may have one function
implement the function from both interfaces at the same time. In VB.NET, this is
accomplished by listing all desired functions to be implemented, for example: “string
Author implements DssIntfc.IDssModel.Author, MapWinInterfaces.IPlugin.Author”
(Exact names of the interfaces may change slightly.)
The Model Interface is described below:
Model Manager Interface
The following functions need to be implemented in any scenario element intended to be
used within the model manager. More detail and examples are given in a separate
document entitled “Programmer’s Tutorial: How to Create a DSS Model”. The functions
are shown in C syntax:
return_type function_name (parameter1_type parameter1_name, parameter2_type
parameter2_name, …)
string RevisionNotes
Provides notes about the scenario element. This information will appear on the
“scenario properties” dialog. This is a “get” property (cannot be set). So, the
Microsoft C# .NET code would look something like:
public string RevisionNotes
{
get
{
return “This is a simple example of a get property.”;
}
}
This is the same syntax that should be followed with any other “get” property. See
the reference for your particular programming language to see how to implement
get properties. For most languages, it will suffice to return the appropriate value
in the function body.
109
2527
2528
2529
2530
2531
2532
2533
2534
2535
2536
2537
2538
2539
2540
2541
2542
2543
2544
2545
2546
2547
2548
2549
2550
2551
2552
2553
2554
2555
2556
2557
2558
2559
2560
2561
2562
2563
2564
2565
2566
2567
2568
2569
2570
2571
2572
bool Execute(DssIntfcLib.IDssManager DssManager, int TimeStep, string DataPath,
DateTime StartDate, DateTime EndDate, string ScenarioID)
The Model Manager calls this function to initiate the execution of the model. All
parameters and data that have been configured as a consequence of the
ShowDialog function (below) will have been loaded and made ready before this
function is called.
Parameters:
DSSManager: This is a reference to the Model Manager that called the
execute function.
TimeStep: This is the time step for execution in seconds. For example,
3600 would mean a timestep occurs every 5 minutes.
DataPath: This is the path where data should be written if the element
needs to write directly to disk.
StartDate: This is the start date chosen with the date range selectors in the
model manager interface. This may be ignored if your scenario element
does not use a date range.
End Date: This is the end date chosen as above. This also may be ignored
if you don’t need to restrict operations to a particular date range.
ScenarioID: This is the scenario ID of the scenario which has called the
execute function. This is provided as a way for the element to mark any
output, for example naming a file with the scenario ID, so that the end user
can tell what scenario produced the file.
int ParamCount
This is a “get” property which should return the number of data items that your
scenario element needs to save and retrieve as a part of the scenario into which
the element is embedded. See also get_ParamValue, set_ParamValue, and
get_ParamName.
DssIntfcLib.DssModelType ModelType
This is a “get” property which will return what type of model this is. The options
are “filter”, “model”, “data editor”, or “other”. There are no rules specifying what
makes a scenario element any one of these; it’s only intended for organizational
purposes. The only thing this will affect is which tab the element will appear on
inside the model manager.
string BuildDate
This is a “get” property which will return the date that the element was last
compiled.
110
2573
2574
2575
2576
2577
2578
2579
2580
2581
2582
2583
2584
2585
2586
2587
2588
2589
2590
2591
2592
2593
2594
2595
2596
2597
2598
2599
2600
2601
2602
2603
2604
2605
2606
2607
2608
2609
2610
2611
2612
2613
2614
2615
2616
2617
string Description
This is a “get” property which will return a textual description of what the
scenario element does. This will appear on the “element properties” dialog.
string Author
This is a “get” property which will return a string identifying the author of the
scenario element. This may be any string – a name, an organization, or any text.
bool ShowDialog(bool Locked, DssIntfcLib.IDssManager DssManager, string DataPath)
This function is called when the scenario element is double-clicked within the
model manager. This function should show a form with any configuration options
or settings which need to be configured for the model to execute. The function
should save the settings retrieved from the user into the properties which will be
set and retrieved using set_ParamValue, get_ParamValue, get_ParamName and
ParamCount. The function does not need to worry about saving the settings
anywhere – so long as the settings are accessible using the functions just named,
the model manager will deal with saving and restoring these values automatically.
Parameters:
Locked: This indicates that the scenario is locked, and changes should not
be allowed. Settings may still be viewed, however.
DssManager: This is a reference to the instance of the model manager
which has called this function.
DataPath: This is the path that the scenario element should use if the
element needs to read or write directly to data on disk. This should be
avoided in favor of the automatic parameter saving system.
string Name
This is a “get” parameter which should return the name of the scenario element as
it will be displayed in the scenario builder. This should be fairly short.
string Version
This is a “get” parameter which should return the version of the scenario element.
void set_ParamValue(int Index, string pVal)
This function is called by the model manager when previously saved values are
being restored to the element. The model manager will call this function as many
times as the function ParamCount returns, also providing the appropriate value for
each parameter. These values should be saved into appropriate variables in the
111
2618
2619
2620
2621
2622
2623
2624
2625
2626
2627
2628
2629
2630
2631
2632
2633
2634
2635
2636
2637
2638
2639
2640
2641
2642
2643
2644
2645
2646
2647
2648
2649
2650
2651
2652
2653
2654
2655
2656
2657
2658
2659
2660
2661
2662
scenario. The index provided to this function will match the index used by
get_ParamValue and get_ParamName.
Parameters:
Index: This is the identifier for the value being restored into the element.
pVal: This is the value to be restored to the element. Note that this is a
string; this doesn’t mean that only string data can be saved and restored:
non-string data can be marshaled into a string format and saved.
string get_ParamValue(int Index)
This function is called by the model manager when the scenario is saved. The
function should return the value for the parameter indicated by Index, which will
then be saved by the model manager. Like set_ParamValue, the function will be
called as many times as the function ParamCount returns. If ParamCount returns
2, the function will be called twice to get both values.
Parameters:
Index: This is the identifier for the value being saved from within the
element.
object ToolBoxIcon
This is a “get” parameter which should return the image which will be displayed
as the icon for this element inside the model manager toolbox. The image can be a
bitmap or icon, and should be 32 pixels by 32 pixels. A default image will be used
if the image provided is invalid.
string get_ParamName(int Index)
This function should return the name of the parameter referenced by Index. This
function yields a name for the Index values used by get_ParamValue and
set_ParamValue.
string ResultsSummary
This function is a “get” parameter which should return a summary of the
execution of the model. The model manager will call this function after calling
Execute, to get the results of the execution. The function should return a string
specifying any input files that were used and any output files that were created,
and the string should also summarize any actions taken during execution. The
summary should also contain any error string which may have been generated.
The text returned by this function will appear in the scenario log.
112
2663
2664
2665
2666
2667
2668
2669
2670
2671
2672
2673
2674
2675
2676
2677
2678
2679
2680
2681
2682
2683
2684
2685
2686
2687
2688
2689
2690
2691
2692
2693
2694
2695
2696
2697
2698
2699
2700
2701
2702
2703
2704
2705
2706
2707
2708
Some of the functions in the Model Manager return an object called IDssManager. This is a
reference to the Model Manager that’s currently running your scenario element. The methods
available on this object are as follows: (again, shown in C syntax.)
HRESULT ReportProgress(IDssModel * sender, BSTR Message, long PercentDone)
This function is used to report the progress of your scenario element’s execution
to the Scenario Builder; the percentage done will be reflected in the progress bar
along with the message you give.
The HRESULT return may be ignored in most languages.
Parameters:
Sender: This is a reference or a pointer to your scenario element itself.
Message: This is the progress message to be displayed on your progress bar.
High-level languages like most Microsoft .NET languages will interpret
the BSTR type as a simple “String” type. Low-level languages like C will
need to pass a B-string.
PercentDone: This is the percent done expressed numerically. This
will be displayed on the progress bar.
HRESULT ReportError(IDssModel * sender, BSTR Message)
This function is used to report an error during execution to the Scenario Builder.
This will appear in the scenario run log.
Parameters:
Sender: This is a reference or a pointer to your scenario element itself.
Message: This is the error message to be placed in the run log.
High-level languages like most Microsoft .NET languages will interpret
the BSTR type as a simple “String” type. Low-level languages like C will
need to pass a B-string.
HRESULT CancelWasRequested(VARIANT_BOOL *result)
This function is used to ask the scenario builder if a cancel has been requested (by
the user clicking the stop button in the scenario builder). This should be checked
periodically during your Execute function if you’re doing complex calculations;
the model manager will never halt your scenario element, so it’s your
responsibility to check to see if the run has been cancelled and stop processing
nicely.
113
2709
2710
2711
2712
2713
2714
2715
2716
2717
2718
2719
2720
2721
2722
2723
2724
2725
2726
2727
2728
2729
2730
2731
2732
2733
2734
2735
2736
2737
2738
2739
2740
2741
2742
2743
2744
2745
2746
2747
2748
2749
2750
2751
2752
2753
2754
Parameters:
Result: This should be a pointer or a reference to a Boolean data type. This
will be set by the function to True or False to indicate whether a cancel
has been requested.
HRESULT ReportDialogClosing(IDssModel * sender, VARIANT_BOOL
SaveParameters)
This function is used to report to the scenario builder that a dialog box is closing.
Typically, dialog boxes in scenario elements are used to gather data – so, this is
important to call at dialog closing because signaling that a dialog is closing tells
the model manager that it’s time to save the parameters in your scenario element
(using the interface functions get_ParamValue, set_ParamValue,
get_ParamName, and ParamCount). Therefore, make sure that you’ve set the
variables which get_ParamValue is returning before calling this function.
Parameters:
Sender: This is a reference or a pointer to your scenario element itself.
SaveParameters: This tells the Scenario Builder whether you’d like your
scenario element’s parameters saved (using the interface functions
mentioned above). Most high-level languages can pass any Boolean data
type into this function.
HRESULT GetFilePath(BSTR FileID, BSTR * result)
This function is used to get the path on disk to the file identified by the string
FileID. This is used in tandem with the function ShowSelectFileDialog.
Parameters:
FileID: This is the string uniquely identifying the file whose path you need.
Result: This should be given a pointer or a reference to a string where the path
to the requested file can be written. In other words, the string you provide
to Result will contain the path to the file you’ve requested after the
function call.
HRESULT AddFilePath(BSTR FileID, BSTR FilePath, BSTR DataType,
VARIANT_BOOL * result)
This function is used to add information about a file to the Scenario Builder’s
database for later retrieval using GetFilePath or ShowSelectFileDialog.
114
2755
2756
2757
2758
2759
2760
2761
2762
2763
2764
2765
2766
2767
2768
2769
2770
2771
2772
2773
2774
2775
2776
2777
2778
2779
2780
2781
2782
2783
2784
2785
2786
2787
2788
2789
2790
2791
2792
2793
2794
2795
2796
2797
2798
2799
2800
Parameters:
FileID: This is the unique string identifier for this file. (Most high-level
languages, like VB.NET, can pass a “String” data type to BSTR
parameters).
FilePath: This is the full path to the file on disk.
DataType: This is a string representing the type of data that the file is. The
string may be anything you desire – e.g., “Land Cover Data”, “Access
Database”, etc.
Result: A reference or pointer to a Boolean data type should be provided for
this parameter. After the function call, the variable passed as this
parameter will contain True or False depending on whether the call was
successful.
HRESULT ShowSelectFileDialog(BSTR AllowedDataType, BSTR * result)
This function will display a dialog to the user with a list of files which match the
parameter AllowedDataType. The user will see a list of the FileIDs for the files
matching the data type.
Parameters:
AllowedDataType: This is the string representing the type of data that
you wish the user to select. See DataType under the
function AddFilePath; these two parameters correspond.
Result: A reference or pointer to a string data type should be passed as
this argument. After the function call completes, the variable
passed as this parameter will contain the FileID of the file that the
user selected in the dialog.
HRESULT GetScenarioFilePath(BSTR ScenarioID, BSTR FileID, BSTR * result)
This function returns the path to the directory where scenario data is being stored.
Parameters:
ScenarioID: The scenario ID for which you’d like the path to data.
FileID: The FileID of the file which you’d like the data path for.
Result: A reference or pointer to a string data type should be passed as
115
2801
2802
2803
2804
2805
2806
2807
2808
2809
2810
2811
2812
2813
2814
2815
2816
this argument. After the function call completes, the variable passed as
this parameter will contain the path to the data.
HRESULT MinimizeModelManager()
This function will cause the scenario builder screen to minimize, allowing any
windows below (such as MapWindow) to become visible. This is useful when a
scenario element is implementing both the MapWindow interface and the Model
interface, and the scenario element wishes to use the MapWindow map to collect
information or interact with the user.
HRESULT MaximizeModelManager()
This function will cause the scenario builder screen to restore itself if it has been
minimized. If MinimizeModelManager has been called, then this should
eventually be called as well.
116
2817
Appendix
2818
2819
2820
2821
2822
Programmer Tutorial:
2823
2824
2825
2826
2827
2828
2829
2830
2831
2832
2833
2834
2835
2836
2837
2838
2839
2840
2841
2842
2843
2844
2845
2846
2847
2848
2849
How to create a DSS Model for the
MapWindow 3.0 DSS Model Manager
Darrel Brown
9/18/2003
117
2850
2851
2852
2853
2854
2855
2856
2857
2858
2859
2860
2861
2862
2863
2864
2865
2866
2867
2868
2869
2870
2871
2872
Table of Contents
Index:
Introduction............................................................................................................. 119
Project creation ....................................................................................................... 119
Implement Interface(s)............................................................................................ 122
Basic model properties............................................................................................ 122
Inputs, Outputs and Parameters .............................................................................. 123
Filling in the details ................................................................................................ 124
Table of Figures:
Figure 1- Creating a new Class Library project............................................................ 120
Figure 2 - Add references ............................................................................................. 120
Figure 3 - Add Reference dialog................................................................................... 121
Figure 4 - Dual implementation.................................................................................... 122
Figure 5 - Adding parameters dialog ............................................................................ 125
Figure 6 - Completed parameters page layout .............................................................. 125
Figure 7 - Validation Function...................................................................................... 126
Figure 8 – Parameter access properties......................................................................... 127
Figure 8 – ShowDialog function................................................................................... 128
Figure 8 – Declaration of model variables.................................................................... 129
Figure 9 – Execute function.......................................................................................... 130
Figure 10 – Results summary ....................................................................................... 130
118
2873
2874
2875
2876
2877
2878
2879
2880
2881
2882
2883
2884
2885
2886
2887
2888
2889
2890
2891
2892
2893
2894
2895
2896
2897
1. Introduction
In this tutorial paper, I will discuss how to create a DSS model plug-in. The model plug-in can
be written in any language that supports COM. For this tutorial, I will give examples in Visual
Basic.net (VB.net) because I think that VB.net illustrates the concepts required to create the
plug-in more clearly than the other popular alternatives. Some alternatives are: Microsoft Visual
C++, Microsoft C#, Microsoft Visual Basic 6, Borland C++ Builder and Borland Delphi. I have
found that implementing COM interfaces is easiest to do in Visual Basic (6 or .net) and C#.
Before you can create a DSS Model Manager plug-in, you must have the MapWindow and DSS
Model Manager installed. You can get the MapWindow from http://www.mapwindow.com if
you do not already have it.
Before I begin the details of this tutorial, I must emphasize again that I am using VB.net for
reasons of clarity and personal preference. You may use any language that supports COM.
2. Project creation
In Visual Studio.net, create a new project. Create the project as a Class Library. Give the
project a name that represents the function of the model. In my case I chose to call this model
“SampleModel.” After you press OK, change the name of your class from Class1 to something
more descriptive. For this tutorial I called my class “MyModel.” Ideally this class name
describes your model in some way.
119
2898
2899
2900
2901
2902
2903
2904
2905
2906
2907
2908
2909
2910
2911
2912
2913
Figure 1- Creating a new Class Library project.
The first step is to add references to the MapWindow Interfaces and DSS Model Manager
Interfaces. The easiest way to do this is to right-click on the references item in the Solution
Explorer, then select Add Reference.
Figure 2 - Add references
It doesn’t matter which reference you add first, but since the Add Reference dialog defaults to
.NET references first, I’ll add the MapWinInterfaces reference first. This reference will not
show up automatically in the list. You must browse to the file in order to add it. In most cases,
the needed interface is installed at “C:\Program Files\MapWindow3.0\MapWinInterfaces.dll”
unless the file was installed in another location.
120
2914
2915
2916
2917
2918
2919
2920
The next reference is listed on the COM tab. The reference needed is called “DSS Interface
Definitions 1.0.” Select this reference then press OK. These references contain the interfaces
used to access the Model Manager and the MapWindow. (See Figure 3)
Figure 3 - Add Reference dialog
121
2921
2922
2923
2924
2925
2926
2927
2928
2929
2930
2931
2932
2933
2934
3. Implement Interface(s)
In order for the Model Manager to recognize your program as a model, you must implement the
IDssModel interface located in the DssIntfcLib namespace. If you are not sure what this means
then perhaps it would be a good time to look up the Implements statement in the Visual Studio
documentation. Implement all of the methods and properties from the IDssModel interface. You
can leave all of the details blank for now. We will get to them shortly.
If your model must interact with the MapWindow, it must also implement the IPlugin interface
in the MapWindow.Interfaces namespace. All of the methods must be implemented from this
interface also. Note, there are some properties that are shared between the IDssModel and
IPlugin interfaces. In these cases it is easiest to have one property declaration that handles both
interfaces, illustrated in Figure 4.
Public ReadOnly Property Author() As String _
Implements DssIntfcLib.IDssModel.Author, _
MapWindow.Interfaces.IPlugin.Author
Get
Return "Utah State University"
End Get
End Property
2935
2936
2937
2938
2939
2940
2941
2942
2943
2944
2945
2946
2947
2948
2949
2950
2951
2952
2953
2954
2955
2956
2957
2958
2959
Figure 4 - Dual implementation
Only having one property that returns the values shared by both interfaces reduces code
duplication and makes it easier to keep your values synchronized. The properties that are shared
are:
• Author
• BuildDate
• Description
• Name
• Version
For the purposes of this tutorial, I am going to keep it simple, implementing only the IDssModel
interface.
Make sure that all methods and properties for the interfaces are implemented. If you forget one,
the Implements statement at the top of the class will be underlined. Another way to make sure
that you have implemented the interface completely is to build the project. If there are any
errors, the compiler will notify you.
Basic model properties:
Now is a good time to go through the Author, BuildDate, Description, Name, Revision Notes
and Version properties, returning the values you wish the user to see on the Model Properties
dialog in the Model Manager.
122
2960
2961
2962
2963
2964
2965
2966
2967
2968
2969
2970
2971
2972
2973
2974
2975
2976
2977
2978
2979
2980
2981
2982
2983
2984
2985
2986
2987
2988
2989
2990
2991
2992
2993
2994
2995
2996
2997
2998
2999
3000
3001
3002
3003
3004
The ModelType property determines which toolbox your model will be dropped in. This
property has very little effect on how the model is treated but it does help to organize models by
function. If your model simply changes data into a format that can be recognized by another
model then it should be called a Filter. If your model modifies data but does not do any real
analysis on the data then it should be a Data Editor. These categories are not enforced in any
way, so it is really up to you to decide how you wish your model to be classified.
Along with the ModelType, you can also define a custom icon to override the default icon used
in the Toolbox and Layout. This property will accept every standard image type used in Visual
Studio. The supported image types are Icon, Bitmap and StdPicture. The model manager resizes
the icon to make it the same size as all the other icons in the Toolbox and on the Layout.
4. Inputs, Outputs and Parameters
Before we can discuss how to implement inputs, outputs and parameters it is very important to
understand the difference between them and how the Model Manager handles each of them.
Inputs and outputs are text strings that are stored in the DSS database using a “key” value. The
text string can be the path to a file that used by the model while executing. This way, when the
model runs it can request an input from the database using its Key, for example,
“LANDCOVER”, the DSS return to the model the string value in the database stored with the
Key identifier. In the example, it would probably return a file path to the land cover grid. Inputs
are also stored with a scenario ID. For the raw data sets, the scenario ID is 0. However when a
model runs, it can add a new record to the inputs and outputs table identifying the output data
and associating a scenario number with it.
This is best illustrated with an example. Say that your scenario has a land cover data changer
followed by a model that uses a land cover grid as an input. When the scenario executes, the
land cover data changer is invoked. This data changer requests data from the DSS database
stored with the key, “LANDCOVER”. The DSS knows that we are in the middle of a scenario
run, for example, #36. When the land cover changer requests the LANDCOVER data set, the
DSS looks in the table for an entry with the key, “LANDCOVER” and the scenario ID #36. Not
finding it, the DSS then looks for an entry with the key, “LANDCOVER” and the scenario ID
#0. Finding this entry, it returns the string data to the model. The string data in this case would
contain the path and filename to the raw land cover grid file. The land cover data changer then
makes specified changes to the land cover grid and saves the changes under a new filename such
as “lc36.bgd”. It then stores this information as a new entry in the DSS database under the same
key name, “LANDCOVER” but with the new file path and the scenario ID that created it (#36).
Next the DSS executes the model. This model requires a land cover grid as an input, so it makes
a request to the DSS for this dataset. The DSS repeats the same steps performed previously for
the land cover changer, looking in the database for an entry with the Key “LANDCOVER” and
the scenario ID #36. Finding this entry, it returns the string value to the model – in this case it
returns the string, “lc36.bgd”. Now the model has an input data file that has been edited by the
123
3005
3006
3007
3008
3009
3010
3011
3012
3013
3014
3015
3016
3017
3018
3019
3020
3021
3022
3023
3024
land use changer in the previous step of the same scenario. Doing this allows one to build
complex scenarios with many changes to data while passing only pointers to the changed data
between scenario elements.
3025
3026
3027
3028
3029
3030
3031
3032
3033
5. Filling in the details
“Parameters” are different than model inputs and outputs and are saved on a per-node basis in the
scenario layout meaning that each instance of the model in a Layout can have its own set of
parameter values. Parameters are typically modifiers that your model uses when executing. For
example, the model mentioned above might compute sediment load from a watershed using the
land cover grid as an input. However there are likely parameters that define how the model
works and these are editable by the user through a parameter page that is displayed when the user
double-clicks on the model element node in the DSS.
Parameters can be used to store data entered by the user for each model instance. When the
model node is deleted or the layout is deleted any parameters that were set are discarded.
The sample model used in this tutorial will calculate a simple weighted average. Choosing a
simple model makes it easier to see the mechanics of creating a model without cluttering thing
up with complicated code. The inputs to this model will be the values to average. The
parameters will be the weights for the input values. The output will be the value of the weighted
average.
The first step I will take in this tutorial is to create the parameters page. The parameters for this
tutorial are two numeric values that are the weights for the weighted average.
To create a parameters page, right click on the title of your Model in the Solution Explorer, then
click on Add, then Add Windows Form… Name your parameter page whatever you like. I
named mine frmParameters.
124
3034
3035
3036
3037
3038
3039
3040
3041
3042
3043
3044
3045
3046
3047
Figure 5 - Adding parameters dialog
Next I added two labels and text boxes for the two weights. I also grouped these in a group box
for the sake of appearance. There is also an OK and a Cancel button. I changed the form’s text
property to Sample Model Parameters. A good suggestion to make your dialogs look and feel
more professional is to set the form’s AcceptButton and CancelButton properties. I also set
the DialogResult properties on the Accept and Cancel Buttons to be OK and Cancel
respectively. Another nice touch is to change the FormBorderStyle better represent the purpose
of the form. In this case I decided that a FixedDialog style worked best. Since the dialog is not
resizable I turned off the MinimizeBox and MaximizeBox. Finally, I set the StartPosition to
be CenterScreen. Of course, all of these details are up to you, and depend a great deal on your
needs.
3048
3049
Figure 6 - Completed parameters page layout
3050
3051
3052
3053
The only tasks for the parameters page dialog are to validate the inputs and make them accessible
from the model. I will write a validate routine that makes sure the text entered is numeric. One
important thing to note is that a layout can be locked and password protected so that the values
125
3054
3055
3056
3057
on the parameter pages cannot be modified. The model manager passes a Boolean parameter in
ShowDialog called Locked. If this value is true, the model writer should make sure that his/her
parameters can be viewed but not changed.
' The Weight_Validating Method handles the validation
' for both of the text boxes
Private Sub Weight_Validating(ByVal sender As Object, _
ByVal e As System.ComponentModel.CancelEventArgs) _
Handles txtWeight1.Validating, txtWeight2.Validating
' Make sure to catch all exceptions
Try
' Cast the sender to a text box object. If this
' fails, an exception will be thrown
Dim txt As System.Windows.Forms.TextBox
txt = CType(sender, System.Windows.Forms.TextBox)
If IsNumeric(txt.Text) = False Then
' Setting cancel = true makes sure that the user
' cannot leave until the problem is fixed
e.Cancel = True
' Just to be nice, we will select all text
' to help the user see what went wrong
txt.SelectAll()
' Exit immediately because the validation failed
Exit Sub
End If
3058
3059
3060
3061
3062
Catch ex As System.Exception
' There was an error, show a descriptive message
MsgBox("The following error has occurred:" & vbCrLf & _
ex.Message & vbCrLf & ex.StackTrace.ToString(), _
MsgBoxStyle.Exclamation Or MsgBoxStyle.OKOnly, _
"Error in Weight_Validating")
End Try
End Sub
Figure 7 - Validation Function
Now that the inputs are properly validated, the only thing left is to make the values accessible to
the model.
126
Public Property Weight1() As Double
Get
If IsNumeric(txtWeight1.Text) Then
Return CDbl(txtWeight1.Text)
Else
Return 1.0
End If
End Get
Set(ByVal Value As Double)
If IsNumeric(Value) Then
txtWeight1.Text = Value.ToString()
End If
End Set
End Property
Public Property Weight2() As Double
Get
If IsNumeric(txtWeight2.Text) Then
Return CDbl(txtWeight2.Text)
Else
Return 1.0
End If
End Get
Set(ByVal Value As Double)
If IsNumeric(Value) Then
txtWeight2.Text = Value.ToString()
End If
End Set
End Property
Public Property IsLocked() As Boolean
Get
Return Not grpWeights.Enabled
End Get
Set(ByVal Value As Boolean)
grpWeights.Enabled = Not Value
End Set
End Property
3063
3064
Figure 8 – Parameter access properties
3065
3066
3067
3068
3069
3070
3071
3072
3073
3074
3075
3076
3077
The parameter page is now completely done so we need to go back to the model and show the
dialog when the user requests it. This is done by the ShowDialog method that you implemented
from the IDssModel interface. There is only one tricky thing about the ShowDialog method:
You must tell the Model Manager when you are done showing your dialog. This is necessary
because it is possible to have a non-modal dialog that interacts with the MapWindow. A nonmodal dialog is one that allows you to interact with other forms while the dialog is open. A
modal dialog does not allow the user to interact with anything else until the dialog is closed. To
summarize, modal dialogs are synchronous, non-modal dialogs asynchronous. If the dialog is
asynchronous you have to have your form notify the model when it closes. This can be done in a
number of ways:
• Implement a callback system so that the parameter page itself notifies the model that it is
closing
127
3078
3079
3080
3081
3082
3083
3084
3085
3086
3087
3088
•
Create a function in the model class that is a FormClosing delegate, and then before you
display the dialog, add the model class FormClosing delegate function as a handler of the
dialog form’s FormClosing event.
Neither of these two options is really very difficult if you are familiar with delegates or
callbacks. If you are not familiar with either of those two concepts it is worthwhile to learn
about them because they can in some situations make a task that seems complicated simple. In
the tutorial I will use a modal (synchronous) dialog to make things simpler. Note that I it is
important to return true. If you do not return true, the Model Manager will not save any
parameters because it assumes something went wrong.
Public Function ShowDialog(ByVal Locked As Boolean, _
ByVal DssManager As DssIntfcLib.IDssManager, _
ByVal DataPath As String) As Boolean _
Implements DssIntfcLib.IDssModel.ShowDialog
Try
' Create a new instance of the parameters form
Dim myDialog As New frmParameters()
' Load the values from the model
myDialog.Weight1 = m_Weight1
myDialog.Weight2 = m_Weight2
myDialog.IsLocked = Locked
' If the user clicks ok then save the values.
If myDialog.ShowDialog = Windows.Forms.DialogResult.OK Then
' Save the values entered on the parameters page
m_Weight1 = myDialog.Weight1
m_Weight2 = myDialog.Weight2
' Report that my dialog has closed, and request
' that the parameters should be saved
DssManager.ReportDialogClosing(Me, True)
Else
' Don't attempt to save any parameters
DssManager.ReportDialogClosing(Me, False)
End If
' Clean up the dialog form
myDialog.Dispose()
myDialog = Nothing
Return True
Catch ex As System.Exception
MsgBox("An error occurred in ShowDialog:" & vbCrLf & _
ex.StackTrace.ToString(), , "Error in ShowDialog")
End Try
End Function
3089
3090
Figure 8 – ShowDialog function
3091
3092
3093
You might have noticed that I made references to m_Weight1 and m_Weight2 in the
ShowDialog method. These are declared at the top of the model class along with the values from
128
3094
3095
3096
3097
3098
3099
3100
the inputs that will be used during the model execution. Notice that there are provisions
provided for default values. This is recommended so that the output is at predictable and useful
in the case that the user does not actually change the values through the parameters dialog.
Private m_Weight1 As Double = 1.0
Private m_Weight2 As Double = 1.0
Private m_Value1 As Double
Private m_Value2 As Double
3101
3102
3103
3104
3105
3106
3107
3108
3109
3110
3111
3112
3113
3114
3115
3116
3117
3118
3119
3120
3121
3122
Private m_Summary As String = ""
Figure 8 – Declaration of model variables
So far we have created the model class, implemented the IDssModel interface, created the
parameters page, filled in the implementation of ShowDialog and handled parameters to and
from the Model Manager. We still need to handle inputs, outputs, summary reports and the
actual execution of the model.
Inputs are stored in the DSSData.mdb database. The Model Manager will provide the inputs you
request as long as they exist in the database. The most common place to work with inputs is in
the Execute function. Figure 9 contains the code in the Execute function of the sample model.
Notice that there are several parameters that were not used in this example:
•
•
•
TimeStep: The TimeStep parameter is used when a loop node is utilized on the layout to
execute more than once. This parameter is here for the models that require a time step to
run.
StartDate/StopDate: Some models require a start and stop date as an additional
parameter. The user can select a start and stop date in the Model Manager that applies to
all models being run.
ScenarioID: Each scenario is given a unique ID so that outputs from different scenarios
can be compared and analyzed side by side.
129
Public Function Execute(ByVal DssManager As DssIntfcLib.IDssManager, _
ByVal TimeStep As Integer, ByVal DataPath As String, _
ByVal StartDate As Date, ByVal EndDate As Date, _
ByVal ScenarioID As String) As Boolean _
Implements DssIntfcLib.IDssModel.Execute
Dim input_path As String
' Get the input from the DSSData.mdb database
input_path = DssManager.GetFilePath("SampleModelInputFile")
If System.IO.File.Exists(input_path) Then
' Open the input file and read the data from it
Dim stream As System.IO.StreamReader
stream = System.IO.File.OpenText(input_path)
m_Value1 = System.Convert.ToDouble(stream.ReadLine())
m_Value2 = System.Convert.ToDouble(stream.ReadLine())
stream.Close()
' Run the model now
Dim result_value As Double
result_value = (m_Weight1 * m_Value1 + m_Weight2 * m_Value2) / 2
m_Summary = "Model run succeeded." & vbCrLf & " "
m_Summary &= m_Weight1 & " * " & m_Value1 & " + "
m_Summary &= m_Weight2 & " * " & m_Value2 & " = "
m_Summary &= result_value
Return True
Else
' If the input file was not found then report an error
DssManager.ReportError(Me, "Could not find the input file '" & _
input_path & "'. Model could not execute.")
Return False
End If
End Function
3123
3124
3125
3126
3127
Figure 9 – Execute function
The only remaining task is to return summary reports so that the Model Manager can combine
the summary reports from all the models that were run in a layout.
Public ReadOnly Property ResultsSummary() As String _
Implements DssIntfcLib.IDssModel.ResultsSummary
Get
Return m_Summary
End Get
End Property
3128
3129
3130
3131
3132
3133
Figure 10 – Results summary
The model is now complete. If you have understood the process to this point you should be able
to create a Model Manager wrapper for any model that you have written.
130
3134
3135
3136
3137
3138
3139
3140
3141
3142
3143
3144
3145
3146
3147
3148
3149
3150
3151
3152
3153
3154
3155
3156
3157
Technical Documentation: Photo Viewer
Last Revision: 06/15/06
Table of Contents
1. Table Designs
¾ Schema, Keys, Indexes and Structure
¾ Table Descriptions and Notes
¾ Table Relationship Diagrams
2. Data Needs
¾ Type/Location of Data
¾ Tags on Layers
3. Dependencies
¾ Software
¾ Module and Components
¾ Integrated Development Environment (IDE)
4. Setup
¾ Setup
5. Code Compiling
131
3158
3159
3160
3161
3162
3163
3164
3165
3166
3167
3168
3169
3170
3171
1. Table Designs
There are two types of Table Designs available for the Photo Viewer. The Table Design
is dependent on the type of viewer that is being used. Design #1 is correct if the data
being used is organized by Location and then by Photo. Design #2 is correct if the data
being used is organized by Watershed, then Stream, then Segment, then Unit, and finally
by Photo.
Database: Design #1
Table: Comments
Description: Contains the information needed to select and display the Comments and
Comment Information for the selected Photo or Location. Data is selected by either
Location_ID or by Location_ID and Photo_ID depending on whether the user is viewing
the comments for the location, or for an individual photo.
Key Primary
Comments
Field
Type
Size
Field Key
Location_ID
Numeric
No
No
The unique ID for the Location
Photo_ID
Numeric
No
No
The unique ID for the Photo for the given
location
Comment_ID
Numeric
No
No
The unique ID for the comment for the given
photo
Author
Text
50
No
No
The Author of the comment
Organization
Text
50
No
No
The Organization the Author belongs to
Comment_Date Text
50
No
No
The date of the comment
No
No
The Comment
Comment
3172
3173
3174
3175
3176
3177
3178
Memo
Table: Photos
Description: Contains the information needed to select and display the Photo and Photo
Information for the selected Location. Data is selected by either Location_ID, or by
Location_ID, and Photo_ID depending on whether a new photo is being loaded or a new
location is being loaded.
Key
Primary
Field
Type
Size
Comments
Field
Key
Location_ID
Numeric
Location_Description Text
Photo_ID
132
Number
50
No
No
The unique ID for the Location
No
No
The Location Name
No
No
The unique ID for the Photo for the
given Location
Photo_Description
Text
255 No
No
A description of the photo
Photo_Date
Text
255 No
No
The date the Photo was taken
Direction
Text
50
No
No
The direction of the Photo
Notes
Text
255 No
No
Any Notes about the photo
File_Name
Text
255 No
No
The filename of the Photo
X_Coordinate
Numeric
No
No
X-Coordinate value of the location
Y_Coordinate
Numeric
No
No
Y-Coordinate value of the location
3179
Photos
Location_ID
Location_Description
Photo_ID
Photo_Description
Photo_Date
Direction
Notes
File_Name
X_Coordinate
Y_Coordinate
Comments
Location_ID
Photo_ID
Comment_ID
Author
Organization
Comment_Date
Comment
3180
3181
133
3182
3183
3184
3185
Database: Design #2
Table: Watersheds
Description: Contains the Watersheds for the availablePhotos.
Key Primary
Field
Type Size
Comments
Field Key
Watershed_ID
Numeric
Watershed_Name
Text
Watershed_Description Text
3186
3187
3188
3189
3190
3191
3192
Yes
Yes
The unique ID for the Watershed
255 No
No
The name for the Watershed
50
No
A description for the Watershed
No
Table: Streams
Description: Contains the Streams for the Watersheds for the available Photos.
Stream_ID’s are unique for each Watershed. This means that if there are multiple
Watersheds, then there can be duplicate Stream_ID’s as long as the Watershed_ID is
different.
Key Primary
Comments
Field
Type Size
Field Key
Watershed_ID
Numeric
Yes
No
The ID for the Watershed that the Stream
belongs to
Stream_ID
Numeric
Yes
No
The unique ID for the Stream
Stream_Name
Text
255 No
No
The name for the Stream
Stream_Description Text
255 No
No
A description for the Stream
3193
3194
3195
3196
3197
3198
3199
Table: Stream_Segments
Description: Contains the Segments for the Streams for available Photos. Segment_ID’s
are unique for each Stream. This means that if there are multiple Streams and/or
Watersheds, then there can be duplicate Segment_ID’s as long as the combination of the
Stream_ID and Watershed_ID are different.
Key Primary
Field
Type Size
Comments
Field Key
Watershed_ID
Numeric
Yes No
The ID for the Watershed that the
Segment belongs to
Stream_ID
Numeric
Yes No
The ID for the Streams that the Segment
belongs to
Segment_ID
Numeric
Yes No
The unique ID for the Segment
Segment_Name
Text
255 No
No
The name for the Segment
Segment_Description Text
255 No
No
The description for the Segment
3200
134
3201
3202
3203
3204
3205
3206
3207
3208
Table: Photos
Description: Contains the information needed to select and display the Photo and Photo
Information for the selected Watershed, Stream, Segment, Unit, Photo group.
Photo_ID’s are unique for each Unit. This means that if there are multiple Units,
Segments, Streams, and/or Watersheds, then there can be duplicate Photo_ID’s as long as
the combination of the Photo_ID, Unit_ID, Segment_ID, Stream_ID and Watershed_ID
are different.
Key Primary
Field
Type Size
Comments
Field Key
Watershed_ID
Numeric
Yes
No
The ID for the Watershed
Stream_ID
Numeric
Yes
No
The ID for the Stream
Segment_ID
Numeric
Yes
No
The ID for the Segment
Unit_ID
Numeric
Yes
No
The ID for the Habitat Unit
Seg_#
Numeric
No
No
The ID for the Habitat Unit within the
Segment
Photo_ID
Numeric
Yes
No
The unique ID for the Photo
255 No
No
The description for the Photo
No
No
The date the Photo was taken
Photo_Description Text
Photo_Date
Date/Time
Photo_Notes
Text
255 No
No
Any notes about the Photo
File_name
Text
255 No
No
The Filename for the Photo
3209
Watersheds
Streams
Stream Segments
Watershed_ID
Watershed_Name
Watershed_Descriptio
n
Watershed_ID
Stream _ID
Stream_Name
Stream_Descriptio
n
Watershed_ID
Stream_ID
Segment_ID
Segment_Name
Segment_Descriptio
Photos
Watershed_ID
Stream_ID
Segment_ID
Unit_ID
Seg_#
Photo_ID
Photo_Description
Photo_Date
Photo_Notes
File_Name
135
3210
2. Data Needs
3211
3212
3213
3214
3215
3216
3217
3218
3219
3220
3221
3222
3223
3224
3225
3226
3227
3228
3229
3230
3231
3232
3233
3234
3235
3236
3237
3238
3239
3240
3241
3242
3243
3244
3245
3246
3247
3248
3249
3250
3251
3252
There are three types of data needed for the Photo Viewer plug-in. It needs a point
shapefile, a folder location, and a database.
• Point Shapefile – this needs to be in the same projection as the other shapefiles. It
contains the point locations of where the photos were taken. This file will have a
tag that will be associated with it by the plug-in or project file.
• Folder Location – this is the location of all of the images that will be viewed using
the Photo Viewer plug-in.
• Database – this needs to be organized according to one of the database designs
described in Section 1: Table Design.
The layer corresponding with the point shapefile stated above is marked with the tag
“PhotoViewerShpfl”. If the user removes the layer associated with tag without first
closing the Photo Viewer plug-in, then the settings for the PhotoViewer will be reset, and
if the Project is then saved, then the settings in the project file will be over-written.
Depending on the type of Database structure, the shapefile requires certain fields to be
available. Below are the field names and how they correlate to the database.
Required data layers and fields used from each:
1. Design #1 – the following field names need to be named this way
exactly.
a. LOC_ID – corresponds with Location_ID in the database
b. LOC_NAME – corresponds with Location_Description in the
database
2. Design #2 – the following field names do not need to be named this
way
a. Watershed_Name – corresponds with Watershed_Description in the
Watersheds table in the database
b. Stream_Name – corresponds with Stream_Description in the
Streams table in the database
c. Segment_Name – corresponds with Segment_Description in the
Stream_Segments table in the database
d. Unit_ID – corresponds with the Unit_ID in the Photos table in the
database
e. Photo_ID – corresponds with the Photo_ID in the Photos table in the
database
f. X_Coordinate – used for plotting the location on the map in the
viewer
g. Y_Coordinate – used for plotting the location on the map in the
viewer
136
3253
3254
3255
3256
3257
3258
3259
3260
3261
3262
3263
3264
3265
3266
3267
3268
3269
3270
3271
3272
3273
3274
3275
3276
3277
3278
3279
3280
3281
3282
3283
3284
3285
3286
3287
3288
3. Dependencies
The PhotoViewer plug-in requires the following software components and modules to be
installed:
Software:
MapWindow 3.1
Visual Studio .NET 2002
Modules and Components:
MapWinGIS Map Control
MapWindow Interfaces
Integrated Development Environment (IDE)
Visual Studio .NET 2002
4. Setup
To begin using the Photo Viewer, it must first be loaded into MapWindow. Once it is
loaded, to use the Photo Viewer simply click the camera icon, , on the toolbar. If the
data associations (as described in Section 2: Data Needs) have been properly formed,
then the Photo Viewer will appear and will be fully functional.
If the data associations have not been formed, then a Connection Form will appear
allowing you to set the shapefile and associated field(s), database, and photo location
folder. Then, after the data associations have been formed, when the Photo Viewer icon,
, on the Map Window toolbar is clicked, the viewer will appear and can then be used.
5. Code Compiling
Compiling the Photo Viewer is a fairly straightforward task. After ensuring that all of the
required components discussed in Section 3: Dependencies are present, load the project
into Visual Studio .Net 2002. This Plugin was created using Visual Basic (VB).
The project needs to include the following files:
Purpose
File Name
AssemblyInfo.vb
Contains information relating to the DLL assembly. Generated by
VB.NET.
camera.ico
Camera icon for the forms and representing where photos are on
the shapefile.
137
NOTE: this file needs to be an embedded resource
camera.bmp
clsMainMWI.vb
FolderUtils.vb
frmCommentAdder.vb
frmCommentViewer.vb
frmDBConnection.vb
frmLocationAdder.vb
frmPhotoAdder.vb
frmPhotoViewer.vb
frmPluginKey.vb
frmSelectLayer.vb
frmViewer2.vb
globalFunctions.vb
globalStructs.vb
globalVariables.vb
ImageConverter.vb
luginInfo.vb
138
Camera bitmap used in the MapWindow Legend for the associated
layer.
NOTE: this file needs to be an embedded resource
Contains a class that implements the MapWindow plugin
interface.
Contains a class to access and browse for a folder location.
Displays the Comment form that is used to add comments to a
photo or a location if using Database Design #1 (see Section 1:
Table Design for a description).
Displays the Comments available from the database for the current
location or photo if using Database Design #1 (see Section 1:
Table Design for a description).
Displays the Connection form so the user can select the type of
data view, the shapefile, photo location, and database.
Displays the form that is used to add a new location to the
shapefile through the Photo Viewer.
Displays the form to add a photo to the current location.
Displays the Photo Viewer form for Database Design #1 (see
Section 1: Table Design for a description).
A form to enter a Plug-in Key so that the user can specify or edit
the connection settings.
NOTE: This form is no longer being shown, but is being left in the
project.
Displays the form to select the associated point shapefile with the
Photo Viewer plug-in. It allows the user to either select a
shapefile already loaded into Map Window, or to select one from
disk.
Displays the Photo Viewer form for Database Design #2 (see
Section 1: Table Designs for a description).
This module contains functions used throughout the project for
accessing the database, searching shapefiles, initialization, access
folder information, and other important functionality.
This module contains the definition of data Structs used
throughout the Photo Viewer.
This module contains the variables used throughout the forms,
such as the form declaration variables, MapWindow variables, and
others.
Contains a class that implements functions that allows you to
convert images to and from an IPictureDisp object. This is needed
so that the VBCompatibility.dll does not need to be referenced.
This class allows the Photo Viewer image, , to be associated
with the points on the associate shapefile.
Contains a class that implements an interface to access (read from
and write to) the Project File.
3289
3290
3291
3292
3293
3294
3295
3296
3297
3298
3299
3300
3301
3302
3303
3304
3305
3306
3307
3308
3309
3310
3311
3312
3313
3314
3315
3316
3317
3318
3319
3320
3321
3322
3323
3324
3325
3326
3327
3328
3329
3330
3331
3332
3333
3334
Now that the files and resources are there and the project is loaded into Microsoft Visual
Studio .NET 2002, please double check a couple of settings. These settings are all related
to the references associated with the project (see Section 3: Dependencies ).
Reference Settings:
AxMapWinGIS
CopyLocal = True
MapWinGIS
CopyLocal = True
MapWinInterfaces
CopyLocal = False
stdole
CopyLocal = False
CopyLocal = False
System
CopyLocal = False
System.Data
System.Design
CopyLocal = False
CopyLocal = False
System.Drawing
CopyLocal = False
System.Windows.Forms
System.XML
CopyLocal = False
Now that these settings have been set correctly, click the Build icon, or select Build from
the menu. The mwPhotoViewer.dll has now been created with Microsoft Visual Studio
.NET 2002. It is created in the mwPhotoViewer subdirectory in the \Plugins folder. Next
time that MapWindow is run, if the mwPhotoViewer.dll was built to the correct folder,
the updated changes to Photo Viewer will be available.
139
3335
Technical Documentation: Periodicity Viewer/Editor
3336
3337
Last Revision: 06/15/06
Table of Contents
3338
3339
3340
3341
3342
3343
3344
3345
3346
3347
3348
3349
3350
3351
3352
3353
3354
3355
3356
3357
3358
3359
3360
1. Table Design
¾ Schema, Keys, Indexes and Structure
¾ Table Descriptions and Notes
¾ Table Relationship Diagrams
2. Data Needs
¾ Type/Location of Data
¾ Tags on Layers
3. Dependencies
¾ Software
¾ Module and Components
¾ Integrated Development Environment (IDE)
4. Setup
¾ Setup
5. Code Compiling
¾ Project Files
¾ Reference Settings
140
3361
3362
3363
3364
3365
3366
3367
3368
3369
3370
3371
3372
1. Table Design
Following is a list of tables that must be included with the Periodicity Viewer/Editor
Database. Other tables and information may exist, but these tables must follow the
described naming conventions, spelling and cases, and types for each table and its
parameters. This database must be an Access (*.mdb) database.
Table: tblDistribution_Master
Description: Contains the Master copy of the Fish Distribution Data for each Node, Fish
pair. When the default Fish Distribution values are restored, they are restored from this
table of values.
Primary
Field
Type Size Key Field
Comments
Key
DM_ID
Node_ID
Lifestage_ID
Current_Known
Yes
Auto
Long
Yes
(No
Number Integer
Duplicates)
Number
Number
Yes/No
Current_Presumed Yes/No
Presumed_Historic Yes/No
This is a unique ID for each record
in the tblDistribution_Master table.
Yes
Long
(Duplicates No
Integer
OK)
This is the ID for the Node that this
set of Fish Distribution values
belong to. It corresponds with the
Node_ID Field from the tblNodes
table and the tblPeriodicity table.
Yes
Long
(Duplicates No
Integer
OK)
This is the Lifestage ID for the Fish
that this set of Fish Distribution
values belong to. It corresponds
with the Lifestage_ID Field from
the tblLifestages table and the
tblPeriodicity table.
No
No
No
No
This is the “Current Known” Fish
Distribution Set value for the given
node, fish pair.
NOTE: Yes = Present, No = Absent
No
This is the “Current Presumed” Fish
Distribution Set value for the given
node, fish pair.
NOTE: Yes = Present, No = Absent
No
This
is
the
“Presumed
Historic/Potential” Fish Distribution
Set value for the given node, fish
pair.
NOTE: Yes = Present, No = Absent
3373
3374
141
3375
3376
3377
Table: tblLifestages
Description: Contains the Lifestage Information for each of the Species that are
available.
Primary
Field
Type Size Key Field
Comments
Key
Lifestage_ID
Yes
Auto
Long
(No
Yes
Number Integer
Duplicates)
Unique ID for each Lifestage
available. It corresponds with the
Lifestage_ID
Field
in
the
tblDistribution_Master
table,
the
tblPeriodicity
table,
and
the
tblPeriodicity_Master table.
Species_ID
Yes
Long
Number
(Duplicates No
Integer
OK)
The ID for the Species that this
Lifestage belongs to. It corresponds
with the Species_ID Field in the
tblSpecies table.
Lifestage_Name Text
3378
3379
3380
3381
3382
255
No
No
Name of the Lifestage.
Table: tblNodes
Description: Contains the Node Information (Node ID, Drainage Info, Reach Info) for
all available nodes.
Primary
Field
Type
Size
Key Field
Comments
Key
pk_NodeID
Yes
Auto
Long
Yes
(No
Number Integer
Duplicates)
This is a unique ID for each Node that
has
Periodicity
and/or
Fish
Distribution available.
Node_ID
Number
Yes
Long
(Duplicates No
Integer
OK)
This is the NodeID that is used to
reference the Node. It is the value that
corresponds with NodeID that stored
in the associated Point Shapefile. It
also corresponds with the Node_ID
Field in the tblDistribution_Master
table, the tblPeriodicity table, and the
tbl_Periodicity_Master table.
Drainage_ID
Yes
Long
Number
(Duplicates No
Integer
OK)
This is the ID for the Drainage that
this node belongs to.
Drainage_Name Text
255
No
This is the Name of the Drainage that
this node belongs to.
Reach_ID
Yes
Long
(Duplicates No
Integer
OK)
This is the ID for the Reach that this
node belongs to.
142
Number
No
Reach_Name
3383
3384
3385
3386
3387
3388
3389
Text
255
No
No
This is the Name of the Reach that
this node belongs to.
Table: tblPeriodicity
Description: Contains the current Periodicity and Fish Distribution values set by the
user. These are the values that are displayed by the Periodicity Viewer/Editor. NOTE:
The values are initialized to the Master data sets (values found in the
tblDistribution_Master table and the tblPeriodicity_Master table).
Primary
Field
Type Size Key Field
Comments
Key
Periodicity_ID
Node_ID
Lifestage_ID
Jan_1
Jan_2
Feb_1
Yes
Auto
Long
Yes
(No
Number Integer
Duplicates)
This is a unique ID for each set of
Periodicity and Fish Distribution
values in the table.
Yes
Long
Number
(Duplicates No
Integer
OK)
This is the ID for the Node that this
set of Periodicity and Fish
Distribution values belong to. It
corresponds with the Node_ID Field
in the tblDistribution_Master table,
the tblNodes table, and the
tblPeriodicity_Master table.
Yes
Long
(Duplicates No
Integer
OK)
This is the ID for the Fish that this
set of Periodicity and Fish
Distribution values belong to. It
corresponds with the Lifestage_ID
Field in the tblDistribution_Master
table, the tblLifestages table, and
the tblPeriodicity_Master table.
Number
Number Integer No
Number Integer No
Number Integer No
No
Periodicity Value for the 1st half of
January for the given fish, node
pair.
Note: 0=Not Present, 1=Present,
2=Peak
No
Periodicity Value for the 2nd half of
January for the given fish, node
pair.
Note: 0=Not Present, 1=Present,
2=Peak
No
Periodicity Value for the 1st half of
February for the given fish, node
pair.
Note: 0=Not Present, 1=Present,
2=Peak
143
Feb_2
Mar_1
Mar_2
Apr_1
Apr_2
May_1
May_2
Jun_1
Jun_2
Number Integer No
Number Integer No
Number Integer No
Number Integer No
Number Integer No
Number Integer No
Number Integer No
Number Integer No
Number Integer No
No
Periodicity Value for the 2nd half of
February for the given fish, node
pair.
Note: 0=Not Present, 1=Present,
2=Peak
No
Periodicity Value for the 1st half of
March for the given fish, node pair.
Note: 0=Not Present, 1=Present,
2=Peak
No
Periodicity Value for the 2nd half of
March for the given fish, node pair.
Note: 0=Not Present, 1=Present,
2=Peak
No
Periodicity Value for the 1st half of
April for the given fish, node pair.
Note: 0=Not Present, 1=Present,
2=Peak
No
Periodicity Value for the 2nd half of
April for the given fish, node pair.
Note: 0=Not Present, 1=Present,
2=Peak
No
Periodicity Value for the 1st half of
May for the given fish, node pair.
Note: 0=Not Present, 1=Present,
2=Peak
No
Periodicity Value for the 2nd half of
May for the given fish, node pair.
Note: 0=Not Present, 1=Present,
2=Peak
No
Periodicity Value for the 1st half of
June for the given fish, node pair.
Note: 0=Not Present, 1=Present,
2=Peak
No
Periodicity Value for the 2nd half of
June for the given fish, node pair.
Note: 0=Not Present, 1=Present,
2=Peak
Jul_1
Number Integer No
No
Periodicity Value for the 1st half of
July for the given fish, node pair.
Note: 0=Not Present, 1=Present,
2=Peak
Jul_2
Number Integer No
No
Periodicity Value for the 2nd half of
July for the given fish, node pair.
144
Note: 0=Not Present, 1=Present,
2=Peak
Aug_1
Aug_2
Sep_1
Sep_2
Oct_1
Oct_2
Nov_1
Nov_2
Dec_1
Number Integer No
Number Integer No
Number Integer No
Number Integer No
Number Integer No
Number Integer No
Number Integer No
Number Integer No
Number Integer No
No
Periodicity Value for the 1st half of
August for the given fish, node pair.
Note: 0=Not Present, 1=Present,
2=Peak
No
Periodicity Value for the 2nd half of
August for the given fish, node pair.
Note: 0=Not Present, 1=Present,
2=Peak
No
Periodicity Value for the 1st half of
September for the given fish, node
pair.
Note: 0=Not Present, 1=Present,
2=Peak
No
Periodicity Value for the 2nd half of
September for the given fish, node
pair.
Note: 0=Not Present, 1=Present,
2=Peak
No
Periodicity Value for the 1st half of
October for the given fish, node
pair.
Note: 0=Not Present, 1=Present,
2=Peak
No
Periodicity Value for the 2nd half of
October for the given fish, node
pair.
Note: 0=Not Present, 1=Present,
2=Peak
No
Periodicity Value for the 1st half of
November for the given fish, node
pair.
Note: 0=Not Present, 1=Present,
2=Peak
No
Periodicity Value for the 2nd half of
November for the given fish, node
pair.
Note: 0=Not Present, 1=Present,
2=Peak
No
Periodicity Value for the 1st half of
December for the given fish, node
pair.
145
Note: 0=Not Present, 1=Present,
2=Peak
Dec_2
Number Integer No
Current_Known
Yes/No
Current_Presumed Yes/No
Presumed_Historic Yes/No
3390
3391
3392
3393
No
No
No
No
Periodicity Value for the 2nd half of
December for the given fish, node
pair.
Note: 0=Not Present, 1=Present,
2=Peak
No
This is the “Current Known” Fish
Distribution value for the given
node, fish pair.
NOTE: Yes = Present, No = Absent
No
This is the “Current Presumed” Fish
Distribution value for the given
node, fish pair.
NOTE: Yes = Present, No = Absent
No
This
is
the
“Presumed
Historic/Potential” Fish Distribution
value for the given node, fish pair.
NOTE: Yes = Present, No = Absent
Table: tblPeriodicity_Master
Description: Contains the Master copy of the Periodicity Data for each Fish pair. When
the default Periodicity values are restored, they are restored from this table of values.
Primary
Field
Type
Size Key Field
Comments
Key
PM_ID
AutoNumber
Lifestage_ID Number
Jan_1
Jan_2
146
Number
Number
Yes
Long
Yes
(No
Integer
Duplicates)
This is a unique ID for each set of
Master Periodicity values in the
table.
Yes
Long
(Duplicates No
Integer
OK)
This is the ID for the Fish that this
set of Periodicity values belong to. It
corresponds with the Lifestage_ID
Field in the tblLifestages table and
the tblPeriodicity_Master table.
Integer No
No
Periodicity Value for the 1st half of
January for the given fish.
Note: 0=Not Present, 1=Present,
2=Peak
No
Periodicity Value for the 2nd half of
January for the given fish.
Note: 0=Not Present, 1=Present,
2=Peak
Integer No
Feb_1
Feb_2
Mar_1
Mar_2
Apr_1
Apr_2
May_1
May_2
Jun_1
Jun_2
Jul_1
Number
Number
Number
Number
Number
Number
Number
Number
Number
Number
Number
Integer No
Integer No
Integer No
Integer No
Integer No
Integer No
Integer No
Integer No
Integer No
Integer No
Integer No
No
Periodicity Value for the 1st half of
February for the given fish.
Note: 0=Not Present, 1=Present,
2=Peak
No
Periodicity Value for the 2nd half of
February for the given fish.
Note: 0=Not Present, 1=Present,
2=Peak
No
Periodicity Value for the 1st half of
March for the given fish.
Note: 0=Not Present, 1=Present,
2=Peak
No
Periodicity Value for the 2nd half of
March for the given fish.
Note: 0=Not Present, 1=Present,
2=Peak
No
Periodicity Value for the 1st half of
April for the given fish.
Note: 0=Not Present, 1=Present,
2=Peak
No
Periodicity Value for the 2nd half of
April for the given fish.
Note: 0=Not Present, 1=Present,
2=Peak
No
Periodicity Value for the 1st half of
May for the given fish.
Note: 0=Not Present, 1=Present,
2=Peak
No
Periodicity Value for the 2nd half of
May for the given fish.
Note: 0=Not Present, 1=Present,
2=Peak
No
Periodicity Value for the 1st half of
June for the given fish.
Note: 0=Not Present, 1=Present,
2=Peak
No
Periodicity Value for the 2nd half of
June for the given fish.
Note: 0=Not Present, 1=Present,
2=Peak
No
Periodicity Value for the 1st half of
July for the given fish.
Note: 0=Not Present, 1=Present,
147
2=Peak
Jul_2
Aug_1
Aug_2
Sep_1
Sep_2
Oct_1
Oct_2
Nov_1
Nov_2
Number
Number
Number
Number
Number
Number
Number
Number
Number
Integer No
Integer No
Integer No
Integer No
Integer No
Integer No
Integer No
Integer No
Integer No
No
Periodicity Value for the 2nd half of
July for the given fish.
Note: 0=Not Present, 1=Present,
2=Peak
No
Periodicity Value for the 1st half of
August for the given fish.
Note: 0=Not Present, 1=Present,
2=Peak
No
Periodicity Value for the 2nd half of
August for the given fish.
Note: 0=Not Present, 1=Present,
2=Peak
No
Periodicity Value for the 1st half of
September for the given fish.
Note: 0=Not Present, 1=Present,
2=Peak
No
Periodicity Value for the 2nd half of
September for the given fish.
Note: 0=Not Present, 1=Present,
2=Peak
No
Periodicity Value for the 1st half of
October for the given fish.
Note: 0=Not Present, 1=Present,
2=Peak
No
Periodicity Value for the 2nd half of
October for the given fish.
Note: 0=Not Present, 1=Present,
2=Peak
No
Periodicity Value for the 1st half of
November for the given fish.
Note: 0=Not Present, 1=Present,
2=Peak
No
Periodicity Value for the 2nd half of
November for the given fish.
Note: 0=Not Present, 1=Present,
2=Peak
Dec_1
Number
Integer No
No
Periodicity Value for the 1st half of
December for the given fish.
Note: 0=Not Present, 1=Present,
2=Peak
Dec_2
Number
Integer No
No
Periodicity Value for the 2nd half of
148
December for the given fish.
Note: 0=Not Present, 1=Present,
2=Peak
3394
3395
3396
3397
Table: tblSpecies
Description: Contains the Species Information (ID, Name) for each one available.
Primary
Comments
Field
Type Size Key Field
Key
Species_ID
Yes
Auto
Long
Yes
(No
Number Integer
Duplicates)
Species_Name Text
255
No
No
This is a unique ID for each Species. It
corresponds with the Species_ID Field
in the tblLifestages table.
This is the Name of the Species.
3398
3399
3400
3401
3402
3403
149
tblPeriodicity Master
tblNodes
pk_NodeID
Node_ID
Drainage_ID
Drainage_Nam
e
Reach_ID
tblSpecies
Species_ID
Species_Name
tblLifestages
Lifestage_ID
Species_ID
Lifestage_Name
PM_ID
Lifestage_ID
Jan_1
Jan_2
Feb_1
Feb_2
Mar_1
Mar_2
Apr_1
Apr_2
May_1
May_2
Jun_1
Jun_2
Jul_1
Jul_2
Aug_1
Aug_2
Sep_1
Sep_2
Oct_1
Oct_2
Nov_1
Nov_2
Dec_1
Dec 2
tblDistribution Maste
tblPeriodicity
Periodicity_ID
Node_ID
Lifestage_ID
Jan_1
Jan_2
Feb_1
Feb_2
Mar_1
Mar_2
Apr_1
Apr_2
May_1
May_2
Jun_1
Jun_2
Jul_1
Jul_2
Aug_1
Aug_2
Sep_1
Sep_2
Oct_1
Oct_2
Nov_1
Nov_2
Dec_1
Dec_2
Current_Known
Current_Presumed
Presumed Historic
DM_ID
Node_ID
Lifestage_ID
Current_Known
Current_Presumed
Presumed_Historic
3404
3405
3406
3407
3408
3409
3410
3411
3412
2. Data Needs
There are two type of data needed for the Periodicity Viewer/Editor: a point shapefile,
and an Access Database
• Point Shapefile – this needs to be in the same projection as the other shapefiles in
your project. It contains the point locations of where each of the Nodes are
located. There needs to be field in this shapefile containing the Node_ID values
for each of the nodes.
150
3413
3414
3415
3416
3417
3418
3419
3420
3421
3422
3423
3424
3425
3426
•
Access Database – this is the database of Periodicity and Fish Distribution data.
This database needs to be organized as described in Section1: Table Design.
As stated above, the shapefile requires one field to be found in the data table. Following
is the description of the required Field in the shapefile (an example field name, the field
type, a description of the data that gets entered into this field, and how it is associated
with the database).
Required data layer field description:
a. Node_ID – Integer – The Node ID for the node at this location. It
corresponds with the Node_ID field in the tblNodes table in the
database. Each value that is found in this field (in the shapefile) also
needs to be found in the database.
3427
3428
3429
3430
3431
3432
3433
3434
3435
3436
3437
3438
3439
3440
3441
3442
3443
3. Dependencies
3444
3445
3446
3447
3448
3449
3450
3451
3452
3453
3454
3455
3456
3457
4. Setup
The Periodicity Viewer/Editor plug-in requires the following software components and
modules to be installed:
Software:
MapWindow 3.1
Visual Studio .NET 2003
Modules and Components:
MapWindow Interfaces
MapWinGIS Map Control
Microsoft FlexGrid Control 6.0 (SP3)
Integrated Development Environment (IDE)
Visual Studio .NET 2003
To begin using the Periodicity Viewer/Editor, it must first be loaded into MapWindow.
Once it is loaded, click on the periodicity icon, , located on the Map Window toolbar If
the shapefile and database associations (as described in Section 2: Data Needs) have been
configured properly and the database is accessible, then the Periodicity Viewer/Editor
will appear allowing the user to select and view Periodicity and Fish Distribution data for
available nodes.
If the data associations have not been properly set, then a Connection Form will appear
allowing you to set the shapefile and database. Then, after the shapefile and database
have been properly associated, select the periodicity icon, , from the Map Window
toolbar and the viewer will appear allowing the user to view the data.
151
3458
3459
3460
3461
3462
3463
3464
3465
3466
3467
3468
See the User’s Manual for more information and details on associating the data with the
Periodicity Viewer/Editor.
5. Code Compiling
Compiling the Periodicity Viewer/Editor is a fairly straightforward task. After ensuring
that all of the required components discussed in Section 3: Dependencies are present,
load the project into Visual Studio .Net 2003. This Plugin was created using Visual
Basic (VB).
The project needs to include the following files:
File Name
Purpose
AssemblyInfo.vb
Contains information relating to the DLL assembly. Generated by
VB.NET.
clsPeriodicityMain.vb
Contains a class that implements the MapWindow plugin interface.
frmDBConnection.vb,
Displays the Connection form that allows the user to associate the
frmDBConnection.resx shapefile, shapefile field, and database with the Periodicity
Viewer/Editor plug-in.
frmEditDistribution.vb, Displays the form that allows the user to Edit the selected Fish
frmEditDistribution.resx Distribution value.
frmEditPeriodicity.vb,
Displays the form that allows the user to Edit the selected
frmEditPeriodicity.resx Periodicity value.
frmPeriodicity.vb,
Displays the Periodicity Viewer/Editor form. This form contains the
frmPeriodicity.resx
table that displays the Periodicity and Fish Distribution data
contained in the associated database. You show this form by
selecting the periodicity icon, , from the Map Window toolbar.
frmRDESelect.vb,
Displays the form that allows the user to select which types of data
frmRDESelect.resx
(Periodicity and/or Fish Distribution) to either Restore Defaults for,
or to Export (save, print, or copy).
frmSelectLayer.vb,
Displays the form to select the point shapefile associated with the
frmSelectLayer.resx
Periodicity Viewer/Editor plug-in. It allows the user to either select
a shapefile already loaded into Map Window, or to select one from
disk.
ImageConverter.vb
Contains a class that implements functions that allows you to
convert images to and from an IPictureDisp object. This is needed
so that the VBCompatibility.dll does not need to be referenced.
This class allows the periodicity image, , to be associated with the
points on the associated shapefile.
modColorDefinitions.vb This module contains the color definitions used in the table for
displaying the Periodicity Values on the main viewer form.
modDBDefinitions.vb
This module contains the variable definitions that hold the table and
field variable names for the Periodicity database. These variables
are used throughout the project so that if anything should change in
the database, the value only has to be changed in 1 location.
152
modGlobals.vb
modPDDefinitions.vb
modUtils.vb
Periodicity3.bmp
Periodicity3.ico
PluginInfo.vb
3469
3470
3471
3472
3473
3474
3475
3476
3477
3478
3479
3480
3481
3482
3483
3484
3485
3486
3487
3488
3489
3490
3491
3492
3493
3494
This module contains the variables used throughout the forms, such
as the form declaration variables, MapWindow variables, and
others.
This module contains the variable definitions that hold the
Periodicity and Fish Distribution labels and values for displaying,
exporting, and restoring the data.
This module contains functions that are used throughout the project
for accessing the database, reporting errors, conversions, file
functionality, and other necessary functionality.
Bitmap version of the Periodicity3.ico. It is used as a custom image
for the point shapefile associated with the Periodicity Viewer/Editor
plug-in.
NOTE: this file needs to be an embedded resource
Icon that is used as the Map Window Legend picture when using a
custom image for the point shapefile associated with the Periodicity
Viewer/Editor. It also is the icon on the Map Window Toolbar for
the Periodicity Viewer/Editor plug-in.
NOTE: this file needs to be an embedded resource
Contains a class that implements an interface to access (read from
and write to) the Project File.
Now that the files and resources are there and the project is loaded into Microsoft Visual
Studio .NET 2003, please double check a couple of settings. These settings are all related
to the references associated with the project (see Section 3: Dependencies ).
Reference Settings:
AxMapWinGIS
AxMSFlexGridLib
MapWinGIS
MapWinInterfaces
MSFlexGridLib
stdole
System
System.Data
System.Drawing
System.Windows.Forms
System.XML
CopyLocal = True
CopyLocal = True
CopyLocal = True
CopyLocal = False
CopyLocal = True
CopyLocal = False
CopyLocal = False
CopyLocal = False
CopyLocal = False
CopyLocal = False
CopyLocal = False
Now that these settings have been set correctly, click the Build icon, or select Build from
the menu. The mwPeriodicityViewer.dll has now been created with Microsoft Visual
Studio .NET 2003. It is created in the mwPeriodicityViewer subdirectory in the \Plugins
folder. Next time that MapWindow is run, if the mwPeriodicityViewer.dll was built to the
correct folder, the updated changes to the Periodicity Viewer/Editor will be available.
153
3495
3496
3497
3498
3499
3500
3501
3502
3503
3504
3505
3506
3507
3508
3509
3510
3511
3512
3513
3514
3515
3516
3517
3518
3519
3520
3521
3522
Technical Documentation: Surface Water Quantity Model
Last Revision: Dec 28, 2007
Table of Contents
1. Overview
¾ TOPNET Fortran Executable
¾ DSS Interface
2. Interface Table Designs
¾ Table Descriptions and Notes
3. Data
4. Dependencies
¾ Software
¾ Module and Components
¾ Integrated Development Environment (IDE)
5. Setup
¾ Setup
¾ Customizations
6. Building
154
3523
3524
3525
3526
3527
3528
3529
3530
3531
3532
1. Overview
3533
3534
3535
3536
3537
3538
3539
3540
3541
3542
3543
2. Table Designs
The Water Quantity Model is comprised of two components (a) the TOPNET Fortran Executable
that performs the model simulations and calculations, and (b) the Water Quantity Model
Interface that configures the input to this through the decision support system. The TOPNET
Model is described in the Task 4.1 report "Surface Water Quantity Model Development and
Calibration". The electronic appendix to this report includes descriptions of the file formats used
by this model. This documentation describes the databases and information used by the Water
Quantity Model Interface as a plugin component to the DSS.
Land Cover Database: LandCoverSummary.mdb
(See “Technical Documentation For Land Cover Summarizer” for table designs)
Water Management Databases (For each Water Quantity Model dataset: Historic, Existing, and
Full Build Out): HistoricWaterManagement.mdb, ExistingWaterManagement.mdb,
FBOWaterManagement.mdb
Table: MonthlyDemand. Provides information on monthly variation of water demand.
Field Name
InYearDemandType
Data Type
Long Integer
Name
Month1
Text
Long Integer
Month2
Long Integer
Month3
Long Integer
Month4
Long Integer
Month5
Long Integer
Month6
Long Integer
Description
Index matching the InYearDemandType
field in User table.
Monthly Demand Name
Multipliers to adjust the daily demand for
this month with respect to default daily
demand rate.
Multipliers to adjust the daily demand for
this month with respect to default daily
demand rate.
Multipliers to adjust the daily demand for
this month with respect to default daily
demand rate.
Multipliers to adjust the daily demand for
this month with respect to default daily
demand rate.
Multipliers to adjust the daily demand for
this month with respect to default daily
demand rate.
Multipliers to adjust the daily demand for
this month with respect to default daily
demand rate.
155
3544
3545
3546
3547
3548
3549
Month7
Long Integer
Month8
Long Integer
Month9
Long Integer
Month10
Long Integer
Month11
Long Integer
Month12
Long Integer
Multipliers to adjust the daily demand for
this month with respect to default daily
demand rate.
Multipliers to adjust the daily demand for
this month with respect to default daily
demand rate.
Multipliers to adjust the daily demand for
this month with respect to default daily
demand rate.
Multipliers to adjust the daily demand for
this month with respect to default daily
demand rate.
Multipliers to adjust the daily demand for
this month with respect to default daily
demand rate.
Multipliers to adjust the daily demand for
this month with respect to default daily
demand rate.
Table: Reservoir. Provides data on reservoirs to water management model.
Field Name
ReservoirID
Name
DrainageID
Data Type
Long Integer
Text
Long Integer
InOffStream
Long Integer
RightID
MaxStore
InitialStore
MinStore
MaxInFlow
MaxWithdrawal
MinEnvRelease
LossRate
Long Integer
Double
Double
Double
Double
Double
Double
Double
Description
Unique identifier for reservoir
Reservoir Name
WRIA1 drainage where reservoir is
located.
Reservoir type: 1 - Instream, 2 Offstream
ID of water right for this reservoir
Maximum storage (m3)
Initial storage (m3)
Minimum storage (m3)
Maximum inflow (m3/s)
Maximum withdrawal (m3/s)
Minimum environment release (m3/s)
Loss rate (m3/s)
Table: ReturnFlow. Provides information on return flows for the water management model.
Field Name
ReturnFlowID
Data Type
Long Integer
Name
Text
156
Description
Unique identifier for return flow matching
ReturnFlowID in User table.
Return Flow Name
3550
3551
3552
NumReturnFlows
Long Integer
ReturnFlowUnits
Long Integer
ReturnFlowAmt1
Double
ReturnFlowType1
Long Integer
ReturnFlowLocn1
Long Integer
ReturnFlowWWTPID1
Long Integer
ReturnFlowAmt2
Double
ReturnFlowType2
Long Integer
ReturnFlowLocn2
Long Integer
ReturnFlowWWTPID2
Long Integer
Number of return flows associated with
user.
ReturnFlowUnits: 1=FracFlow,
2=FracMinDemand, 3=Volume
Amount of first return flow, fraction or
volume. Units are m3/day if
ReturnFlowUnits=3, volume..
Type of return flow:
1 - Surface Water,
2 - Ground Water,
3 - Reservoir.
WRIA1 drainage ID of drainage where
first return flow occurs. Specifying 0
means the drainage associated with the
user producing this return flow.
Identifier of wastewater treatment plant
(WWTP) if return flow is treated.
Amount of second return flow, fraction or
volume. Units are m3/day if
ReturnFlowUnits=3, volume..
Type of return flow:
1 - Surface Water,
2 - Ground Water,
3 - Reservoir.
WRIA1 drainage ID of drainage where
second return flow occurs. Specifying 0
means the drainage associated with the
user producing this return flow.
Identifier of wastewater treatment plant
(WWTP) if return flow is treated.
Table: Rights. Provides information on water rights to water management model.
Field Name
RightID
Data Type
Long Integer
Name
PriorityDate
LegalDailyMax
Text
Date/Time
Double
LegalAnnMax
Double
Description
Water Rights Identifier matches RightID
in User table.
Name of Water Right
Priority date.
Maximum daily withdrawal in cubic
meters per day.
Maximum annual withdrawal in cubic
meters.
3553
3554
157
3555
3556
3557
3558
3559
3560
3561
3562
Table: SeasonsDefn. Provides start and end day for seasons.
Field Name
SeasonsDefnID
Data Type
Long Integer
Name
StartDaySeason1
StartDaySeason2
StartDaySeason3
StartDaySeason4
Text
Long Integer
Long Integer
Long Integer
Long Integer
Description
Unique identifier for a season definition
record
Name of Season Definition
Day to start season 1
Day to start season 2
Day to start season 3
Day to start season 4
Table: Source. Provides information on user sources to the water management model.
Field Name
SourceID
Name
Type
Data Type
Long Integer
Text
Long Integer
SourceLocationID
PhysicalDailyMax
PhysicalAnnMax
Long Integer
Double
Double
Description
Unique ID Number
Name of source
1 - Surface Water,
2 - Ground Water,
3 – Reservoir
Drainage ID or Reservoir ID
Physical Limitation (m3/day)
Physical Limitation (m3/day)
Table: SourceMixing. Provides information about the apportioning of take between the sources
that the users draw water from.
Field Name
SourceMixingID
Data Type
Long Integer
Name
UsersSourceNum
Text
Long Integer
Units
Season1Amount
Long Integer
Double
Season2Amount
Double
Season3Amount
Double
158
Description
Source mixing index from User table. There
may be multiple records with the same index
as there is a one (record in User) to many
(records in sourcemixing) relationship.
Name of source mixing record
Matches the UsersSourceNum in
UserSourceRight table
1 - fraction, 2 - volume
How much to take from this source for season
1 in the season defined by SeasonsDefnID. If
volume the units are m3/day.
How much to take from this source for season
2 in the season defined by SeasonsDefnID. If
volume the units are m3/day.
How much to take from this source for season
3 in the season defined by SeasonsDefnID. If
3563
3564
3565
3566
3567
3568
3569
3570
Season4Amount
Double
SeasonsDefnID
Long Integer
volume the units are m3/day.
How much to take from this source for season
4 in the season defined by SeasonsDefnID. If
volume the units are m3/day.
ID of row in SeasonsDefinition Table
Table: SourceMixingOld. Earlier format of SourceMixing table. Not used unless importing
information from water management files.
Field Name
SourceMixingID
Data Type
Long Integer
Name
UsersSourceNum
Units
Amount
Text
Long Integer
Long Integer
Double
SeasonNumber
SeasonsDefnID
Long Integer
Long Integer
Description
Source mixing index from User table.
There may be multiple records with the
same index as there is a one (record in User)
to many (records in sourcemixing)
relationship.
Name of source mixing
Matches the source ID in User table
1 - fraction, 2 - volume
How much to take from this source. If
volume the units are m3/day.
Number from 1 to 4
ID of row in SeasonsDefinition Table
Table: User. Provides information about water users and water demands to the water
management component.
Field Name
UserID
Name
UserType
Data Type
Long Integer
Text
Long Integer
Description
Unique sequential id for user
Name of user
User type in one of the following categories:
1 - SoilMoistureIrrigation
2 - FixedDemandIrrigation
3 - DownstreamReservoirRelease
4 - PWS
5 - NonPWSMandI
6 - Dairy
7 - Ranch
8 - Poultry
9 - ParkGolfCemetery
10 - InstreamFlow
11 - Diversion
12 - ReservoirFill
13 - InStreamReservoirRelease
14 - OffStreamReservoirRelease
159
3571
3572
3573
3574
3575
3576
3577
POU_ID
Long Integer
DemandVble
Double
DemandRate
Double
InYearDemandType
Long Integer
ReturnFlowID
Long Integer
SourceMixingID
Long Integer
Place of Use. The WRIA1 Drainage
Identifier DrainID where the use occurs.
Number of quantifiable user units (e.g. people
or cows). Set to one if not relevant. (The
demand is calculated by multiplying this
variable with the DemandRate.)
The amount of water demand per unit time for
one unit of activity (m3/day/unit)
Index to record in Monthly Demand Table
that specifies the monthly (seasonal) variation
associated with this use. InYearDemandType
may be set to zero if the use is constant over
the year or to -1 if this information is not
required, such as is the case for irrigation
users where demand is based on soil moisture
and reference evaporation.
Index to record in return flow table that
specifies information about the return flow
associated with this user.
Index to records in source mixing table in file
sourcemixing.txt that specifies information
about apportioning of take between the
sources that the user draws water from. This
is a one to many relationship.
Table: UserSourceRight. Table that associates sources and rights with users
Field Name
UserID
Data Type
Long Integer
SourceID
RightID
Long Integer
Long Integer
UsersSourceNum
Long Integer
Description
User id of user associated with a source and
water right
Id of source used by specified user
Id of water right associated with the specified
user
Id of record in Source SourceMixingTable
giving the proportioning between sources
associated with a user
Water Quantity Simulated Streamflow Database: WaterQuantityStreamFlow.mdb and
WaterQuantityStreamFlow.mdf
(See “Technical Documentation For Time Series Analyst” for table designs)
160
3578
3579
3580
3581
3582
3583
3584
3585
3586
3587
3588
3589
3590
3591
3592
3593
3594
3595
3596
3597
3598
3599
3600
3601
3602
3603
3604
3605
3606
3607
3608
3609
3610
3611
3612
3613
3614
3615
3616
3617
3618
3619
3620
3621
3622
3623
3. Data
The Water Quantity Model requires the following input data:
- Drainages Shapefile
- TopNet Input Directory
- Land Cover Summary Database
- Water Management Database
The drainage shapefile used should be bsnwria1_v7.shp. Only the drainage identifier
(BSNWRIA1A) and drainage name (DRAIN_NAME) are used from this shapefile. Other inputs
have been created using the drainage identifiers in this shapefile. Use of another shapefile would
result in incorrect names being associated with drainage identifiers. The WRIA-1 drainages
shapefile is installed at the following location by default:
C:\Program Files\WRIA-1_DSS\DSS_Data\GIS_Data\Shapefiles\Watershed\bsnwria1_v7.shp
The TopNet input directory is the folder comprising input files required to run the water quantity
model. Three such folders are provided, one each for historic, existing and full build out
conditions. When the model is run this entire set of files is copied to the specified output
working directory. The model is then run in the output working directory which serves as a
record of the inputs and outputs for a specific model run scenario. The TopNet Input Directories
are installed at the following locations by default:
C:\Program Files\WRIA-1_DSS\Water Quantity TopNet Files\ModelInputFilesHistoric
C:\Program Files\WRIA-1_DSS\Water Quantity TopNet Files\ModelInputFilesExisting
C:\Program Files\WRIA-1_DSS\Water Quantity TopNet Files\ModelInputFilesFBO
The land cover summary database contains the area of each land cover type summarized for each
drainage. This is created by the land cover summarizer tool. The initial land cover summary
database provided includes land covers for each scenario:
- Scenario 1 = Historic conditions
- Scenario 2 = Existing conditions
- Scenario 3 = Full build out conditions
The Land Cover Summary Database is installed at the following location by default:
C:\Program Files\WRIA-1_DSS\DSS_Data\Model Manager
Databases\LandCoverSummary.mdb
The water management database is a Microsoft Access database contains the information needed
to populate the water quantity model water management input files. This database is changed
when water management options are edited. Three initial water management databases are
provided, one for each scenario. The Water Management Databases are installed at the
following locations by default:
C:\Program Files\WRIA-1_DSS\DSS_Data\Model Manager
Databases\HistoricWaterManagement.mdb
161
3624
3625
3626
3627
3628
3629
3630
3631
3632
3633
3634
3635
3636
3637
3638
3639
3640
3641
3642
3643
3644
3645
3646
3647
3648
3649
3650
3651
3652
3653
3654
3655
3656
3657
3658
3659
3660
3661
3662
3663
3664
3665
3666
3667
3668
C:\Program Files\WRIA-1_DSS\DSS_Data\Model Manager
Databases\ExistingWaterManagement.mdb
C:\Program Files\WRIA-1_DSS\DSS_Data\Model Manager
Databases\FBOWaterManagement.mdb
The Water Quantity Model produces a large number of text output files. These are saved in a
folder created each time the model is run. By default these folders are created in:
C:\Program Files\WRIA-1_DSS\Model Runs.
The formats of these output files are described in the electronic appendix to the Task 4.1 report
"Surface Water Quantity Model Development and Calibration". The modeled Streamflow from
this model output, from the file FlowAtStreamNodes_cms.txt is added to the
WaterQuantityStreamflow database designated in the output tag of the Water Quantity Model
Interface. This database is in the format used by the Time Series Analyst Component and
documented in the Technical Documentation for Time Series Analyst. The Water Quantity
Interface model adds data to the WQData table and a new Parameter record identifying the
scenario simulated to the Parameter_CodeDescriptions table. All other tables are left
unchanged.
Three output databases are provided at the following locations by default:
C:\Program Files\WRIA-1_DSS\MSDEDATABASES\WaterQuantityStreamFlow.mdf
C:\Program Files\WRIA-1_DSS\MSDEDATABASES\WaterQuantityStreamFlowSimRef.mdf
C:\Program Files\WRIA-1_DSS\DSS_Data\Model Manager
Databases\WaterQuantityStreamflow.mdb
The first and third of these databases have no streamflow data in them, but are pre-loaded with
the station information corresponding to the nodes at which streamflow is simulated. The second
of these WaterQuantityStreamflowSimRef.mdf contains four reference simulations (Historic,
Existing without water management, Existing and Full Build out) that USU conducted for the 45
year period of record (10/1/1959 to 12/31/2005).
The following GIS files are provided with the DSS to facilitate interpretation of the Surface
Water Quantity Model output:
• points_of_interest_v8.shp
• Nodes.shp
• Nooknet.shp
points_of_interest_v8.shp identifies the points where streamflow is simulated by the TOPNET
model, including names and station identifiers used by WRIA. Nodes.shp provides a cross
reference between the sequential node numbering that TOPNET uses internally and the node
numbering on points_of_interest_v8.shp. See the Task 4.1 report "Surface Water Quantity
Model Development and Calibration" for the node numbering schema definitions. Nooknet.shp
is the stream network shapefile representing stream reaches derived during the process of setting
162
3669
3670
3671
3672
3673
up the Water Quantity Model and depicting the connectivity between nodes used in the
simulation. By default these shapefiles are installed in:
3674
3675
3676
3677
3678
3679
3680
3681
3682
3683
3684
3685
3686
3687
3688
4. Dependencies
3689
3690
3691
3692
3693
3694
3695
5. Setup
3696
3697
3698
3699
3700
3701
6. Building
C:\program files\WRIA-1_DSS\DSS_Data\GIS_Data\Shapefiles\Watershed
The Water Quantity Model Interface requires the following software to be installed:
Software:
MapWindow 3.1
DSS Model Manager
Integrated Development Environment (IDE):
Visual Studio .NET 2003 Complete Install
The Water Quantity Model requires the data output by the following DSS elements:
Land Cover Summary Tool
The Water Quantity Model Fortran Executable is provided as a standalone executable without
any dependencies.
Water Quantity Model Interface
The WRIA-1_DSS Installation installs the Water Quantity Model in the MapWindow Plugins
folder.
(This is usually located at C:\Program Files\MapWindow\Plugins\ModelManager\Elements”).
To compile the Water Quantity Model Interface Management Practices Tool, add the files below
to a Microsoft Visual Studio .NET 2003 Visual Basic .NET Library Project.
mwWaterQuantityModel project files:
File Name
AssemblyInfo.vb
BasinParsFile.vb
DBClient.vb
DirectoryPicker.vb
Purpose
Contains information relating to the DLL assembly.
Generated by VB.NET.
Contains the routines used to write an updated
basinpars.txt file for the TopNet model input.
Contains the routines used to connect to a database.
Custom component that allows a user to select a directory
from the computer’s file system.
163
EditMonthlyDemandData.vb
EditReservoirData.vb
EditReturnFlowData.vb
EditRightsData.vb
EditSeasonsDefinitionsData.vb
EditSourceData.vb
EditUserData.vb
EditWatershedInfo.vb
FlowWriter.vb
Folder.ico
frmArtificialDrainages.vb
frmConfiguration.vb
frmEditExistingItem.vb
frmEditImperviousArea.vb
frmEditNewItem.vb
frmEditSourceMixing.vb
frmEditSourceMixingPeriods.vb
frmImperviousAreas.vb
frmInputs.vb
frmProgress.vb
frmSelectLayer.vb
frmSelectModelDirectory.vb
frmSelectScenario.vb
164
Custom component allowing users to edit monthly demand
data for water management purposes.
Custom component allowing users to edit reservoir data for
water management purposes.
Custom component allowing users to edit return flow data
for water management purposes.
Custom component allowing users to edit water rights data
for water management purposes.
Custom component allowing users to edit seasons
definition data for water management purposes.
Custom component allowing users to edit source data for
water management purposes.
Custom component allowing users to edit user data for
water management purposes.
Custom component allowing users to view watershed
information for water management purposes.
Contains the routines used to write flow data output by the
TopNet model to a simulated streamflow database.
An icon used in frmWaterRights to represent a group of
users within a WRIA-1 Drainage.
Allows the user to view/edit the artificial drainage (a.k.a.
agricultural drainage) values for a WRIA-1 Drainage.
Contains the routines used to select a database.
Allows the user to select an existing water management
item to edit.
Allows the user to edit impervious area data for a WRIA-1
drainage.
Allows the user to select a new water management time to
edit.
Allows the user to select the source mixing for a water
user’s souces.
Allows the user to edit a source mixing period.
Allows the user to edit the impervious area data for a
WRIA-1 drainage.
Allows the user to select the data locations for the model
inputs and outputs.
A form containing a progress bar to show the progress of
an activity.
Contains the routines used to select a layer from
MapWindow’s view.
A form containing a DirectoryPicker component which
allows the user to select a directory from the file system, or
a directory to be created by the Water Quantity Model in
the current DSS Scenario Run.
Allows the user to select a previously run DSS scenario by
id.
frmSelectSources.vb
frmWaterRights.vb
ImperviousAreas.xml
ImperviousXMLFile.vb
LUParsFIle.vb
NewWaterRightsItem.vb
OpenFolder.ico
Reservoir.ico
Source.ico
TopInpFile.vb
WaterMgmtControlFile.vb
WaterQuantityModel.vb
WaterRights.xml
WaterRightsWriter.vb
WaterUser.ico
WaterUserClosedFolder.ico
WaterUserOpenFolder.ico
3702
3703
3704
3705
3706
3707
3708
3709
3710
3711
3712
Allows the user to select water sources for a water user.
Allows the user to edit water management for the Water
Quantity Model.
Contains the default impervious areas and artificial
drainage values. Written to disk next to
mwWaterQuantityModel.dll if it doesn’t exist.
Contains the methods used to manage the impervious area
data xml file.
Contains the methods used to read default basin parameters
from the file lupars.csv.
Allows the user to create a new water rights item.
An icon used in frmWaterRights to represent a group of
users within a WRIA-1 Drainage which is currently
displayed.
An icon used in frmWaterRights to represent a reservoir.
An icon used in frmWaterRights to represent a water
source.
Contains the routines used to write an updated topinp.dat
file for the TopNet model input.
Contains the routines used to write an updated
WatermgmtControl.txt file for the TopNet model input.
Implements MapWindow Plugin and DSS Interface
routines, allowing the Lake Whatcom Model to act as a
MapWindow Plugin and a DSS element.
Contains lists of water management types used in
frmWaterRights. Written to disk next to
mwWaterQuantityModel.dll if it doesn’t exist.
Contains the methods to manage the water management
files for the Water Quantity Model.
An icon used in frmWaterRights to represent the root water
user node.
An icon used in frmWaterRights to represent a water user
that is not currently selected.
An icon used in frmWaterRights to represent a water user
that is currently selected.
Add the following references to the project:
DssIntfcLib.dll
ICSharpCode.SharpZipLib.dll
MapWinGIS.ocx
MapWinInterfaces.dll
System.dll
System.Data.dll
System.Drawing.dll
System.Windows.Forms.dll
System.Xml.dll
165
3713
3714
3715
3716
3717
3718
3719
3720
3721
3722
3723
3724
3725
3726
3727
3728
3729
3730
3731
3732
3733
3734
3735
3736
3737
3738
3739
3740
3741
3742
3743
3744
You are now ready to compile the project by clicking the Build Solution menu option under the
menu Build.
Water Quantity Model Fortran Executable
The executable topnet.exe is included in each input folder and replicated in each output folder.
Topnet.exe is compiled using the Compaq Visual Fortran version 6.6 compiler from the
following files.
Source Code
AllocateWaterToUsers.f90
Append_To_Output_Tables.f90
AssignDrainageFlows.f90
AssignPriorityOrder.f90
BalanceFlowsAtReservoirs.f90
BalanceFlowsAtStreamNodes.f90
BuildDrainageOrder.f90
BuildLinkStructure.f90
BuildNodeStructure.f90
CalculateDemand.f90
calv46sn_v7.f
Data_Read.f90
et_v7_fromdave.f
find.f90
hydatasn_v7.f
ImposeMeasuredFlows.f90
indepth1_v7.f
Initialise_Output_Tables.f90
kinwav_v7.f
Luns.inc
maxvariables.inc
mddata_v10_7.f
MIC.FOR
modules.f90
newt.for
Nlfit.inc
PropagateWaterViaUser.f90
PTRATE.FOR
read_inputs.f90
read_struct_from_text.f90
snowdgtv22.f
SnowLSub.f
SnowWrap.f
snowxv22.f
Tdims_v7.inc
toplim_v7.f
topmoddgt_v7.f
top_main_v7.f
types.f90
watermgmt.f90
Write_Output_line.f90
Write_Output_Tables.f90
Compaq Visual Fortran Project Files
topnet.dsw
topnet.ncb
topnet.opt
compilable\compilable.dsp
compilable\compilable.plg
These source code and project files are provided in the electronic appendix to the Task 4.1 report
"Surface Water Quantity Model Development and Calibration"
The Water Quantity Model is installed in all versions of the WRIA-1 DSS installation.
166
3745
3746
3747
Technical Documentation:
Temperature and DO Flags Model
3748
3749
3750
3751
3752
3753
3754
3755
3756
3757
3758
3759
3760
3761
3762
3763
3764
3765
3766
3767
3768
3769
3770
3771
3772
3773
3774
3775
3776
3777
3778
3779
3780
3781
3782
3783
3784
3785
Table of Contents
1. Stream Response Model Output Folder Data Needs
2. Watershed Loading Model Output Text File Data Needs
3. Input Model Nodes Shapefile Data Needs
¾ Type/Location of Data
¾ Tags on Layers
¾ Necessary Fields
¾ Selecting Nodes for Modeling
4. Output Temperature and DO Database Table Design
¾ Table Descriptions and Notes
¾ Schema, Keys, Indexes and Structure
¾ Table Relationship Diagrams
5. Output Temperature Flags and Warnings Shapefile Data Needs
¾ Type/Location of Data
¾ Necessary Fields
6. Output DO Flags and Warnings Shapefile Data Needs
¾ Type/Location of Data
¾ Necessary Fields
7. Dependencies
¾ Software
¾ Modules and Components
¾ Integrated Development Environment (IDE)
8. Setup
¾ Setup
9. Code Compiling
¾ Project Files
¾ Reference Settings
167
1. Stream Response Model Output Folder Data Needs
3786
3787
3788
3789
3790
This is the folder containing the output text files from the Waterbody Response Model.
The files in this folder must be named in the following way:
3791
3792
3793
3794
3795
3796
3797
3798
3799
3800
3801
3802
3803
3804
3805
3806
3807
3808
3809
3810
3811
3812
3813
3814
3815
3816
3817
3818
3819
3820
3821
3822
3823
3824
3825
3826
3827
3828
3829
NodeTS###.txt
Where ### represents the three digit node number for that file. If the files in this folder
are not named in this way and are not the Waterbody Response Model output files, the
Temperature and DO Flags Model will not run.
2. Watershed Loading Model Output Text File Data Needs
This text file is the output from the Watershed Loading Model. It must be a text file. It
can have any name.
3. Input Model Nodes Shapefile Data Needs
There are two types of data required for the Input Model Nodes Shapefile: a point
shapefile path, and a Node ID shapefile field.
• Point Shapefile – this shapefile needs to be in the same project as the other
shapefiles in your project. It contains the point locations of each of the Model
Nodes. Connection Name – this is the name of the Time Series Analyst
Connection.
• Station Shapefile Field – this field is a String field that contains the Node ID for
each of the Model Nodes. It corresponds with the Station Field in the Stations
table and with the Station Field in the WQData table for the Output Temperature
DO Database.
NOTE: If the Node ID in the shapefile is not found in either of the Input
Databases, then the model will not run,and there will be an entry in the log
explaining why.
In order to specify the Nodes to model, the Model Nodes Shapefile must be selected and
added to the project. Then you can either select the which Nodes to model by specifying
the Node ID’s or by going to map and selecting with the Map Window Selection tools.
4. Output Temperature and DO Database Table Design
Following is a list of tables that must be included with the Output Temperature and DO
Database. Other tables and information may exist, and not all the tables listed are used
by the Temperature and DO Flags Model. However, these tables must follow the
described naming conventions, spelling and cases, and types for each table and its
parameters.
168
3830
3831
Table: Agency_Code Descriptions
Description: This table is not used by the Temperature and DO Flags Model.
Field
Type
Size
Key Field
Primary Key Comments
Agency_ID
Number
Long
Integer
No
No
Agency_Code
Text
50
Yes (No Duplicates)
Yes
Agency_Descriptio
Text
n
255
No
No
Contact
50
No
No
3832
3833
3834
3835
3836
Text
Table: Comment_Code Descriptions
Description: This table is not used by the Temperature and DO Flags Model and is
blank.
Field
Type
Size
Key Field
Primary Key
Comment_Code
Text
50
Yes (No Duplicates)
Yes
Description
Text
200
No
No
3837
3838
3839
3840
3841
Comments
Table: Data_Code Descriptions
Description: This table is not used by the Temperature and DO Flags Model and is
blank.
Field
Type
Size
Key Field
Data_Code
Text
50
Yes (No Duplicates) Yes
Description
Text
255
No
3842
3843
3844
3845
3846
Primary Key Comments
No
Table: GroupNames
Description: This table is not used by the Temperature and DO Flags Model and is
blank.
Field
Type
Size
Group_ID
Number
Long Integer Yes (Duplicates OK) No
Group_Name Text
50
Key Field
No
Primary Key Comments
No
3847
3848
169
3849
Table: GroupStations
Type
Key
AutoNumb Long
er
Integer
Yes
(Duplicate No
s Ok)
Key Field
Group_ID
Number
Long
Integer
Yes
(Duplicate No
s OK)
Station
Text
50
No
3850
3851
3852
The ID for the Group. It
corresponds
with
the
Group_ID Field in the
GroupNames table.
No
Table: Parameter_Code Descriptions
Field
3853
3854
3855
3856
3857
Size
Primary
Comments
Key
Field
Type
Size
Key Field
Primar
Comments
y Key
Long Integer
Yes
Parameter_Code Number (Automatic decimal (No
places)
Duplicates)
Yes
Parameter_Name Text
255
No
No
Class
Text
50
No
No
Common_Name
Text
50
No
No
A unique ID for each
Parameter.
Table: QAQC_Code Descriptions
Description: This table is not used by the Temperature and DO Flags Model and is
blank.
Primary
Field
Type Size
Key Field
Comments
Key
QAQC_Code Text 50
Yes (No Duplicates) Yes
Description
No
3858
3859
3860
Text 150
No
Table: Source_Database Descriptions
Field
Type Size Key Field
Source_Database
Text
50
Description
Text
255 No
No
Source_Contact
Text
50
No
3861
170
Primary Key Comments
Yes (No Duplicates) Yes
No
3862
3863
Table: Stations
Description: This table contains Station data for all Stations available to model.
Primary
Field
Type Size
Key Field
Comments
Key
Yes
Duplicates)
Station
Text
50
Shapefile
Number Long Integer No
(No
Yes
No
USU_Subbasin Text
50
No
No
Station_Name Text
100
No
No
Location
Text
200
No
No
State
Text
50
No
No
County
Text
50
No
No
Latitude
Number
Double
(#.#####)
No
No
Longitude
Number
Double
(#.#####)
No
No
UTMX
Number Double (#.##) No
No
UTMY
Number Double( #.##) No
No
River_Mile
Number Double
No
No
Station_Type
Text
75
No
No
NHDID
Text
50
Yes
OK)
Wb_Name
Text
50
No
No
WRIA1_Shed Text
50
No
No
Primar
Comments
y Key
3864
3865
3866
(Duplicates
No
Table: WQData
Field
Type
Size
Key Field
Station
Text
255
Yes
(Duplicates No
OK)
This corresponds with the Station
Field in the Stations Table
Yes
(Duplicates No
OK)
This
corresponds
with
the
Agency_Code
Field
in
the
Agency_Code Descriptions Table
Agency_Code
Text
255
Date
Date/
Tme
mm/dd/
No
yyyy
No
171
hh:nn
AM/P
M
Depth
Number Double No
No
Yes
Long
Parameter_Code Number
(Duplicates No
Integer
OK)
Value
Number Double No
No
This
corresponds
with
the
Comment_Code Field in the
Comment_Code
Descriptions
Table
Comment_Code Text
255
Yes
(Duplicates No
OK)
QAQC_Code
255
Yes
(Duplicates No
OK)
This
corresponds
with
the
QAQC_Code
Field
in
the
QAQC_Code Descriptions Table
255
Yes
(Duplicates No
OK)
This
corresponds
with
the
Data_Code Field in the Data_Code
Descriptions Table
255
Yes
(Duplicates No
OK)
This
corresponds
with
the
Source_Database Field in the
Source_Database
Descriptions
Table
Data_Code
Text
Text
Source_Database Text
3867
3868
3869
3870
3871
This
corresponds
with
the
Parameter_Code Field in the
Parameter_Code
Descriptions
Table
Table: WQ_Criteria
Description: This table is not used by the Temperature and DO Flags Model and is
blank.
Primary
Field
Type
Size
Key Field
Comments
Key
Parameter_Code
Number
Long
Integer
Yes (Duplicates Ok) No
Parameter_Name
Text
50
No
No
Primary_Criterion
Number Double
No
No
Secondary_Criterion Number Double
No
No
Criterion_Test
No
No
3872
3873
3874
3875
172
Text
50
3876
3877
3878
3879
173
3880
3881
3882
3883
3884
3885
3886
3887
3888
3889
3890
3891
3892
3893
3894
3895
3896
3897
3898
3899
3900
3901
3902
3903
3904
3905
5. Output Temperature Flags and Warnings Shapefile Data Needs
3906
3907
3908
3909
3910
3911
3912
3913
3914
3915
3916
3917
3918
3919
3920
3921
3922
6. Output DO Flags and Warnings Shapefile Data Needs
The Temperature Flags and Warnings Shapefile must be the shapefile named
Temp_Flags_Warnings.shp. Data is written to this shapefile whenever the Temperature and
DO Flags Model is run. Any existing data is erased from the database and the new model
data is written. This shapefile must contain the following fields:
• Shape – All data in this shapefile are Points
• Station – This field contains the Station name for each Node. This Field
corresponds with the Station Shapefile Field in the Input Model Nodes Shapefile
and the Station Field in the Stations table and with the Station Field in the
WQData table for the Output Temperature DO Database
• Station_na – This fields contains the Drainage information for each Node.
• UTMX- This is the X value for the UTM coordinates for each Node.
• UTMY- This is the Y value for the UTM coordinates for each Node.
• Site_type- This specifies the node type, for example, if the node is a USU
Intensive site or a Mixing Node, etc.
• Num_flags- This field contains the number of Temperature Flags at each Node.
• Num_warn- This field contains the number of Temperature Warnings at each
Node.
• Color- If the Num_flags Field has a value greater than zero, the color is Red. If
the Num_flags Field has a value of zero and the Num_warn Field has a value
greater than zero, the color is Yellow. If both Num_flags and Num_warn Fields
contain a value of zero AND the Station_na Field does not say “No WQ Data”,
the color is Green. If the Station_na Field says “No WQ Data”, the color is
Black.
The DO Flags and Warnings Shapefile must be the shapefile named
DO_Flags_Warnings.shp. Data is written to this shapefile whenever the Temperature and
DO Flags Model is run. Any existing data is erased from the database and the new model
data is written. This shapefile must contain the following fields:
• Shape – All data in this shapefile are Points
• Station – This field contains the Station name for each Node. This Field
corresponds with the Station Shapefile Field in the Input Model Nodes Shapefile
and the Station Field in the Stations table and with the Station Field in the
WQData table for the Output Temperature DO Database
• Station_na – This fields contains the Drainage information for each Node.
• UTMX- This is the X value for the UTM coordinates for each Node.
• UTMY- This is the Y value for the UTM coordinates for each Node.
• Site_type- This specifies the node type, for example, if the node is a USU
Intensive site or a Mixing Node, etc.
• Num_flags- This field contains the number of DO Flags at each Node.
174
•
•
3923
3924
3925
3926
3927
3928
3929
3930
3931
3932
3933
3934
3935
3936
3937
3938
3939
3940
3941
3942
3943
3944
3945
3946
3947
3948
3949
3950
3951
3952
3953
3954
3955
3956
3957
3958
3959
3960
3961
3962
3963
3964
3965
Num_warn- This field contains the number of DO Warnings at each Node.
Color- If the Num_flags Field has a value greater than zero, the color is Red. If
the Num_flags Field has a value of zero and the Num_warn Field has a value
greater than zero, the color is Yellow. If both Num_flags and Num_warn Fields
contain a value of zero AND the Station_na Field does not say “No WQ Data”,
the color is Green. If the Station_na Field says “No WQ Data”, the color is
Black.
7. Dependencies
The Time Series Analyst plug-in requires the following software components and modules to
be installed:
Software:
MapWindow 3.1
Visual Studio .NET 2003
Modules and Components:
DSS Interface Definitions
MapWindow Interfaces
MapWinGIS Components
Integrated Development Environment (IDE)
Visual Studio .NET 2003
8. Setup
To begin using the Temperature and DO Flags Model, you must first load the Scenario
Builder/DSS Plug-in into Map Window. Once it is loaded, click on the DSS Menu located
on the Map Window Menu bar and select either Scenario Builder, or the name of the
Scenario that you want to run. Once the Scenario Builder is and the Temperature and DO
Flags Model is added to the current Scenario, Run the Scenario. If all the input and output
parameters have been correctly set and they are all accessible, then the Temperature and DO
Flags Model will run for the selected data. After it is finished the user may view the run log
if they desire. If any errors occur during the run, an error log will appear explaining the
error.
If the input and output data associations have not been properly set, then double click on the
Temperature and DO Flags Model scenario node, and a Parameters Form will appear
allowing you to edit the input and output data. Then, after the parameters have been properly
associated, Run the Scenario and after it is finished, the user may view the run log if they
desire or if any errors occurred, then an error log will appear explaining the error.
175
3966
3967
3968
3969
3970
3971
3972
3973
3974
3975
3976
3977
See the User’s Manual for more information and details on setting the parameters for the
Temperature and DO Flags Model.
9. Code Compiling
Compiling the Temperature and DO Flags Model is a fairly straightforward task. After
ensuring that all of the required components discussed in Section 7: Dependencies are
present, load the project into Visual Studio .Net 2003. This DSS Model was created using
Visual Basic (VB).
The project needs to include the following files:
Purpose
File Name
AssemblyInfo.vb
clsMainPhabTS.vb
frmConfiguration.vb,
frmConfiguration.resx
frmParameters.vb,
frmParameters.resx
frmSelectLayer.vb,
frmSelectLayer.resx
frmSelectNodes.vb,
frmSelectNodes.resx
modDatabase.vb
modGlobals.vb
176
Contains information relating to the DLL assembly. Generated by
VB.NET.
Contains a class that implements the Map Window plug-in interface
and the DSS Model Interface and other functions for editing the
parameters for and running the Temperature and DO Flags Model.
A Database Configuration form. This form is shown when the user
edits an Input or Output Database. It allows the user to specify the
Path for an Access Database. The connection for the specified
values can then be tested to make sure a valid database is specified.
To save the selected settings, click on the Save Changes button; to
cancel the changed settings, close the form with the Red X button at
the top of the form. This form will only be shown if the user
decides to edit any of the Input or Output databases already
associated with the Temperature and DO Flags model.
A form that allows the user to view and edit the set the Input and
Output Parameters for the Temperature and DO Flags Model.
A form to select the Input Model Nodes point shapefile for the
Temperature and DO Flags Model. It allows the user to either select
a shapefile already loaded into Map Window, or to select one from
disk. This form will only be shown if the user decides to edit the
shapefile already associated with the Temperature and DO Flags
Model.
A form that allows the user to select the nodes to model, either from
the Map Window Map or from the list of available nodes. This form
will only be shown if the user decides to edit the selected nodes
already associated with the Temperature and DO Flags Model.
Contains functions for access and writing to the Input and Output
database, and the variable definitions for the Output Database type.
Contains the definitions for variables used throughout the project,
such as MapWindow variables, model variables, parameter
variables, error variables, and others.
modParameters.vb
modShapefile.vb
modUtils.vb
3978
3979
3980
3981
3982
3983
3984
3985
3986
3987
3988
3989
3990
3991
3992
3993
3994
3995
3996
3997
3998
3999
4000
4001
4002
4003
4004
4005
4006
4007
4008
4009
4010
4011
4012
4013
4014
4015
4016
4017
4018
Contains the variable definitions for the Input Parameter Names.
Contains the variable definitions and functions for accessing data on
the associated Model Nodes Shapefile.
Contains functions used throughout the project for reporting errors,
accessing files, and other functionality.
Now that the files and resources are there and the project is loaded into Microsoft Visual
Studio .NET 2003, please double check a couple of settings. These settings are all related
to the references associated with the project (see Section 7: Dependencies ).
Reference Settings:
ADODB
DssIntfcLib
MapWinGIS
MapWinInterfaces
stdole
System
System.Data
System.Drawing
System.Windows.Forms
System.XML
CopyLocal = False
CopyLocal= True
CopyLocal = False
CopyLocal = False
CopyLocal = False
CopyLocal = False
CopyLocal = False
CopyLocal = False
CopyLocal = False
CopyLocal = False
Now that these settings have been set correctly, click the Build icon, or select Build from
the menu. The mwTempDOflags.dll has now been created with Microsoft Visual Studio
.NET 2003. It is created in the mwTimeSeries subdirectory in the
\Plugins\ModelManager\Elements\mwTempDOFlags\
folder. Next time that MapWindow is run, if the mwTempDOflags.dll was built to the
correct folder, the updated changes to the Temperature and DO Flags Model will be
available.
177
4019
Technical Documentation: Time Series Analyst
4020
4021
Last Revision: 06/15/06
Table of Contents
4022
4023
4024
4025
4026
4027
4028
4029
4030
4031
4032
4033
4034
4035
4036
4037
4038
4039
4040
4041
4042
4043
4044
1. Table Design
¾ Table Descriptions and Notes
¾ Schema, Keys, Indexes and Structure
¾ Table Relationship Diagrams
2. Data Needs
¾ Type/Location of Data
¾ Tags on Layers
3. Dependencies
¾ Software
¾ Modules and Components
¾ Integrated Development Environment (IDE)
4. Setup
¾ Setup
5. Code Compiling
¾ Project Files
¾ Reference Settings
178
4045
4046
4047
4048
4049
4050
4051
4052
4053
4054
4055
4056
4057
4058
1. Table Design
Following is a list of tables that must be included with the Time Series Analyst Database.
Other tables and information may exist, but these tables must follow the described naming
conventions, spelling and cases, and types for each table and its parameters.
Table: Agency_Code Descriptions
Field Name
Data Type
Size
Agency_ID
Agency_Code
Agency_Description
Contact
LocallyModified
Long Integer
Text
Text
Text
Boolean
100
255
100
Table: Comment_Code Descriptions
Data
Field Name
Size
Type
Comment_Code Text
100
Description
Text
400
LocallyModified Boolean
Primary
Key
No
No
No
No
No
Key
Field
No
No
No
Primary
Key
No
No
No
Key
Field
No
Primary
Key
No
No
No
No
No
Description
Indicates that data was
locally modified or
locally created.
Description
Indicates that data was locally
modified or locally created.
Table: GroupNames
Field Name
Data Type
Long
Integer
Group_Name
Text
LocallyModified Boolean
Size
Group_ID
4059
4060
4061
Key
Field
No
No
No
No
No
Table: GroupStations
Field Name
Data Type
[Key]
Long
Integer
Group_ID
Long
Integer
Station
Text
LocallyModified Boolean
100
Size
100
Description
Indicates that data was locally
modified or locally created.
Key Field
Yes
Primary Key
Yes
No
No
No
No
No
No
Description
Indicates that data was
179
locally modified or
locally created.
4062
4063
4064
4065
4066
4067
Table: Parameter_Code Descriptions
Data
Field Name
Size
Type
Parameter_Code Long
Integer
Parameter_Name Text
100
Class
Text
100
Common_Name Text
100
LocallyModified Boolean
Data Type
QAQC_Code
Text
Description
Text
LocallyModified Boolean
No
No
No
No
No
No
No
No
Description
Indicates that data was
locally modified or
locally created.
Size
100
300
Key
Field
No
No
No
Primary Key
No
No
No
Description
Indicates that data was
locally modified or locally
created.
Table: Source_Database Descriptions
Field Name
Source_Database
Description
Source_Contact
LocallyModified
4071
4072
4073
Primary
Key
No
Table: QAQC_Code Descriptions
Field Name
4068
4069
4070
Key
Field
No
Data Type
Size
Text
Text
Text
Boolean
100
100
100
Key
Field
No
No
No
No
No
No
No
No
Key
Field
No
No
No
No
No
No
Primary
Key
No
No
No
No
No
No
Primary Key
Description
Indicates that data was
locally modified or locally
created.
Table: Stations
Field Name
Station
Shapefile
USU_Subbasin
Station_Name
Location
State
180
Data Type
Text
Long Integer
Text
Text
Text
Text
Size
50
50
50
100
100
Description
County
Latitude
Longitude
UTMX
UTMY
River_Mile
Station_Type
NHDID
Wb_Name
WRIA1_Shed
LocallyModified
4074
4075
4076
100
No
No
No
No
No
No
No
No
No
No
No
No
No
No
No
No
No
No
No
No
No
No
Long Integer
Text
100
Double
Key
Field
No
No
No
Primary
Key
No
No
No
Double
No
No
No
No
No
No
100
100
100
100
Indicates that data was locally
modified or locally created.
Table: WQ_Criteria
Field Name
Parameter_Code
Parameter_Name
Primary_Criterio
n
Secondary_Crite
rion
Criterion_Test
LocallyModified
4077
4078
4079
Text
Double
Double
Double
Double
Double
Text
Text
Text
Text
Boolean
Data Type
Text
Boolean
Size
100
Description
Indicates that data was locally
modified or locally created.
Table: WQData
Field Name
Data Type
Size
Station
Agency_Code
Date
Depth
Parameter_Code
Value
Comment_Code
QAQC_Code
Data_Code
Source_Database
LocallyModified
Text
Text
Date/Time
Double
Long Integer
Double
Text
Text
Text
Text
Boolean
255
255
255
255
255
255
Key
Field
No
No
No
No
No
No
No
No
No
No
No
Primary
Key
No
No
No
No
No
No
No
No
No
No
No
Description
Indicates that data was
locally modified or locally
created.
181
GroupNames
Group_ID
Group_Name
GroupStations
Key
Group_ID
Station
Notes
tblStations
NoteID
Station
Notes
Station
Station_Name
Agency Code Descriptions
Agency_ID
Agency_Code
Agency_Description
Parameter Code Descriptions
Parameter_Code
Parameter_Name
4080
182
WQData
Station
Agency_Code
Date
Parameter_Code
Value
4081
4082
4083
4084
4085
4086
4087
4088
4089
4090
4091
4092
4093
4094
4095
4096
4097
4098
4099
4100
4101
4102
4103
4104
4105
4106
4107
4108
4109
4110
4111
4112
4113
4114
4115
4116
4117
4118
4119
4120
4121
4122
4123
4124
4125
2. Data Needs
There are three types of data required for the Time Series Analyst: a connection name, a
database type, and a database. There are also two Optional types of data that can be
specified: a point shapefile, and a custom Icon.
Required:
• Connection Name – this is the name of the Time Series Analyst Connection.
• Database Type – this is the type of database that you are connecting to. IE:
Access, or SQL Server.
• Database – this is the database of Time Series Data. This database needs to be
organized as described in Section 1. Table Design.
Optional:
• Point Shapefile – this shapefile needs to be in the same projection as the other
shapefiles in your project. It contains the point locations of where each of the
Stations are located. There needs to be a field containing the Station ID in this
shapefile. This file will have a tag that will be associated with it by the plugin:“WQGAGES|FieldID|ConnectionName” where FieldID is the Field Number
for the StationID Field in the Shapefile, and ConnectionName is the Connection
Name described above.
• Custom Icon – this is the icon that you want to be associated with the specified
Point Shapefile. Because there can be multiple connections to the Time Series
Analyst, you can specify this Icon to be different for each connection created.
This can only be specified if you associate a Point Shapefile with a connection.
As stated above, the point shapefile requires one field to be found in the data table.
Following is the description of the required Field in the shapefile (an example field name,
the field type, a description of the data that gets entered into this field, and how the field
data is associated with the data in the database.
Optional Point Shapefile field:
a. Station ID – String – The ID for the Station at this location. It
corresponds with the Station field in the Stations table found in the
database. Each value that is found in this field (in the shapefile) also
needs to be found in the database.
3. Dependencies
The Time Series Analyst plug-in requires the following software components and
modules to be installed:
Software:
Gigasoft’s ProEssentials Graphing Tools Version 4
MapWindow 3.1
Visual Studio .NET 2003
183
4126
4127
4128
4129
4130
4131
4132
4133
4134
4135
4136
4137
4138
4139
4140
4141
4142
4143
4144
4145
4146
4147
4148
4149
4150
4151
4152
4153
4154
4155
4156
4157
4158
4159
4160
4161
4162
4163
4164
Modules and Components:
Gigasoft ProEssentials Graph v4
Gigasoft ProEssentials Sci-Graph v4
MapWindow Interfaces
MapWinGIS Components
Microsoft FlexGrid Control 6.0 (SP3)
Integrated Development Environment (IDE)
Visual Studio .NET 2003
4. Setup
To begin using the Time Series Analyst, it must first be loaded into MapWindow. Once it is
loaded, click on the Time Series Analyst icon, , located on the Map Window toolbar If the
required connection name(s), database type, and database associations, and, if desired,
optional shapefile and icon associations (as described in Section 2: Data Needs) have been
configured properly and the database for the selected connection is accessible, then the Time
Series Analyst will appear allowing the user to select and view the data for available stations.
If the data associations have not been properly set, then a Connection Form will appear
allowing you to create or edit connections. When you create or edit a connection, a form
appears that allows you to specify the required data (the connection name, the database type,
and the database), and the optional data (the point shapefile and the custom icon). Then, after
the required and optional data have been properly associated, select the Time Series Analyst
icon, , from the Map Window toolbar and either the viewer or a form allowing the user to
select which connection to view will appear, then the user can select and view the available
data.
See the User’s Manual for more information and details on associating the data with the Time
Series Analyst.
5. Code Compiling
Compiling the Time Series Analyst is a fairly straightforward task. After ensuring that all of
the required components discussed in Section 3: Dependencies are present, load the project
into Visual Studio .Net 2003. This Plugin was created using Visual Basic (VB).
The project needs to include the following files:
File Name
AssemblyInfo.vb
clsLine.vb
184
Purpose
Contains information relating to the DLL assembly.
Generated by VB.NET.
Contains a class that defines a Line Object.
CommonFunc.vb
DBInfoLayer.vb
dock.ico
frmAbout.vb,
frmAbout.resx
frmAddCriteria.vb,
frmAddCriteria.resx
frmAddMTSStations.vb,
frmAddMTSStations.resx
frmAddStations.vb,
frmAddStations.resx
frmBoxPlot.vb,
frmBoxPlot.resx
frmConfiguration.vb,
frmConfiguration.resx
frmControlLine.vb,
frmControlLine.resx
frmControlLineValues.vb,
frmControlLineValues.resx
frmCriteria.vb,
frmCriteria.resx
frmCrossPlot.vb,
frmCrossPlot.resx
frmCustomQuery.vb
frmCustomQuery.resx
frmDataBaseConnections.vb,
frmDataBaseConnections.resx
frmDBConnection.vb,
frmDBConnection.resx
Contains variables, classes, enumerations, structs, and
functions used in multiple forms and classes throughout the
project.
Contains classes for accessing and storing Time Series
Analyst connections and their associated settings.
Icon used on several forms to indicate that an Options/Plot
Info panel is docked.
NOTE: this file needs to be an embedded resource
An About Form for the Time Series Analyst.
A form that allows the user to Add or Edit Criteria.
A form that allows the user to add or remove Stations or
Parameters, depending on the type of plot (Multiple Station,1
Parameter or 1 Station, Multiple Parameter) selected, for the
Multiple Time Series plot.
A form that allows the user to add or remove Stations to a
Group.
A form that explains the Box Plot symbols, shading, and
shape.
An SQL Server Configuration form. This form is shown
when the user browses for a Database whose type = SQL. It
allows the user to set the Server Address, User ID and
Password, and Database Name. The connection for the
specified values can then be tested to make sure a valid
database is specified.
A form that allows the user to add or remove Control Lines
for the selected plot.
A form that allows the user to specify or edit the Label,
Value, and Color of a selected Control Line.
A form that displays the created Criteria and their results.
A form that plots a Correlation and Time Series Plot for two
Station, Parameter pairs.
A form that allows the user to find the Stations in a selected
Time Series Connection that meet certain criteria. The user
can search for Stations either by defining Spatial boundaries
using the Map, or by defining Database Criteria that must be
met.
A form that allows the user to Add, Edit, or Remove Time
Series Analyst Connections. It displays the Connection
Name, Database, and Custom Icon (if set) for the created
Connections.
The Connection form that allows the user to associate or edit
the required data (the connection name, the database type,
and the database) and the optional data (the point shapefile,
185
Station ID field, and the custom Icon) for a Time Series
Analyst Connection.
frmGroup.vb,
frmGroup.resx
frmHotSpot.vb,
frmHotSpot.resx
frmListOfCriterias.vb,
frmListOfCriterias.resx
frmMDBAddMTSStations.vb
frmMDBAddMTSStations.resx
frmMDBCrossPlot.vb,
frmMDBCrossPlot.resx
frmMDBMultipleTS.vb,
frmMDBMultipleTS.resx
frmMultipleTS.vb,
frmMultipleTS.resx
frmNormalizeOptions.vb,
frmNormalizeOptions.resx
frmParameterList.vb,
frmParameterList.resx
frmPluginKey.vb,
frmPluginKey.resx
frmSelectLayer.vb,
frmSelectLayer.resx
frmSummaryTable.vb,
frmSummaryTable.resx
frmWaterQuality.vb
frmWaterQuality.resx
186
The form to create a new Group. It allows the user to
specify the new group’s Name and ID.
The form that displays the data for a specific point from any
of the plots.
A form that displays the list of created Criteria and their
settings, and allows the user to add and edit the Criteria.
A form that allows the user to add or remove Locations or
Parameters, depending on the type of plot (Multiple
Locations, 1 Parameter or 1 Location, Multiple Parameters,
where a location consists of a Database Connection and
Station pair) selected, for the Multiple Database, Multiple
Time Series plot.
A form that plots a Correlation and Time Series Plot for two
Location, Parameter pairs where a Location consists of a
Database Connection and Station pair.
A form that plots a Multiple Database, Multiple Time Series
Plot for the selected plot type (Multiple Locations, 1
Parameter or 1 Location, Multiple Parameters where a
Location consists of a Database Connection and Station
pair).
A form that plots a Multiple Time Series Plot for the selected
plot type (Multiple Stations, 1 Parameter or 1 Station,
Multiple Parameters).
A form that allows the user to specify settings for
Normalizing a plot’s values.
A form that allows the user to specify which parameters to
view on the Parameter Summary plots or table, or to use to
create a summary report by parameter for all stations.
A form to enter a Plug-in Key so that the user can specify or
edit Database Connections.
NOTE: This form is no longer being shown, but is being left
in the project.
Displays the form to select the optional point shapefile
associated with a Database Connection to the Time Series
Analyst plug-in. It allows the user to either select a shapefile
already loaded into Map Window, or to select one from disk.
This form will only be shown if the user decides to associate
a shapefile with a Database Connection.
A form that displays a summary of the data in the database
by Parameter for a selected Station.
Displays the Time Series Analyst form for a selected
Database Connection. This form contains the different plots,
tables, and summaries for available stations. You show this
frmWQStations.vb,
frmWQStations.resx
hide.ico
ImageConverter.vb
Main.vb
PluginInfo.vb
Statistics.vb
TS1.bmp
TS1.ico
4165
4166
4167
4168
4169
4170
4171
4172
4173
4174
4175
4176
form by selecting the Time Series Analyst icon,
, from the
Map Window toolbar and then selecting which Database
Connection you want to view, or by selecting one or more
points on an associated shapefile.
A form that displays plots (a Number Distribution plot and a
Time Distribution plot) of the parameter summary for a
selected Station.
Icon used on several forms to indicate that an Options/Plot
Info panel is hidden.
NOTE: this file needs to be an embedded resource
Contains a class that implements functions that allows you to
convert images to and from an IPictureDisp object. This is
needed so that the VBCompatibility.dll does not need to be
referenced. This class allows the Time Series Analyst
image,
, to be associated with the points on the optional
shapefile if it is associated.
Contains a class that implements the MapWindow plugin
interface.
Contains a class that implements an interface to access (read
from and write to) the Project File.
Contains a class and an enumeration to access, store, and
calculate statistics, averaged values, and censored data for
the plots in the Time Series Analyst.
Bitmap version of the TS1.ico. It is used as the default
custom image for the optional point shapefile, when it is
associated with a Database Connection in the Time Series
Analyst plug-in.
NOTE: this file needs to be an embedded resource
Icon that is used as the Map Window Legend picture when
using the default image for the optional point shapefile when
it is associated with a Database Connection in the Time
Series Analyst. It also is the icon on the Map Window
Toolbar for the Time Series Analyst plug-in.
NOTE: this file needs to be an embedded resource
Now that the files and resources are there and the project is loaded into Microsoft Visual
Studio .NET 2003, please double check a couple of settings. These settings are all related
to the references associated with the project (see Section 3: Dependencies ).
Reference Settings:
ADODB
CopyLocal = False
AxMSFlexGridLib
CopyLocal = True
AxPEGO32BLib
CopyLocal = True
AxPESGO32BLib
CopyLocal = True
MapWinGIS
CopyLocal = False
MapWinInterfaces
CopyLocal = False
187
MSFlexGridLib
PEGO32BLib
PESGO32BLib
stdole
System
System.Data
System.Drawing
System.Windows.Forms
System.XML
4177
4178
4179
4180
4181
4182
4183
4184
4185
4186
4187
4188
4189
4190
4191
4192
4193
4194
4195
4196
4197
4198
4199
4200
4201
4202
4203
4204
4205
4206
4207
4208
4209
4210
4211
4212
4213
4214
4215
4216
4217
4218
4219
4220
4221
4222
CopyLocal = True
CopyLocal = True
CopyLocal = True
CopyLocal = False
CopyLocal = False
CopyLocal = False
CopyLocal = False
CopyLocal = False
CopyLocal = False
Now that these settings have been set correctly, click the Build icon, or select Build from
the menu. The mwTimeSeries.dll has now been created with Microsoft Visual Studio
.NET 2003. It is created in the mwTimeSeries subdirectory in the \Plugins folder. Next
time that MapWindow is run, if the mwTimeSeries.dll was built to the correct folder, the
updated changes to the Time Series Analyst will be available.
188
4223
4224
4225
4226
4227
4228
4229
4230
4231
4232
4233
4234
4235
4236
4237
4238
4239
4240
4241
4242
4243
4244
4245
4246
4247
4248
4249
4250
4251
4252
4253
4254
4255
4256
4257
4258
4259
4260
4261
4262
4263
Technical Documentation:
Watershed Characterization Report Generator
Last Revision: 06/25/08
Table of Contents
1. Table Designs
¾ Schema, Keys, Indexes and Structure
¾ Table Descriptions and Notes
¾ Table Relationship Diagrams
2. GIS Data Needs
¾ Location of GIS Data
¾ Tags on Layers
3. Dependencies
¾ Software
¾ Module and Components
¾ Integrated Development Environment (IDE)
4. Setup
¾ Setup
¾ Customizations
5. Building
¾ Code Compiling
¾ Installations
189
4264
1. Table Designs
4265
4266
4267
4268
4269
4270
Database: WRIAReportData
Table: 303d
Description: Contains data regarding 303(d) listed waterbodies. Data is selected by
either wcrsNumber, wbid, or wgclNumber, depending on whether it’s a waterbody,
watercourse, or water grid cell.
Key
Primary
Field
Type
Size
Comments
Field
Key
LocallyModified Boolean
4271
4272
4273
4274
4275
No
No
wcrsNumber
Text
50
No
No
Parameter
Text
50
No
No
Medium
Text
50
No
No
303d
Text
50
No
No
FirstListedYear Text
50
No
No
Basis
Text
2048 No
No
Remarks
Text
2048 No
No
ActionNeeded
Text
50
No
No
wbid
Text
50
No
No
wgclNumber
Text
50
No
No
Indicates that data was Locally
modified or created.
Table: CensusData-CompleteState
Description: Contains census data for the complete state. Data is selected by ‘town or
city name’ field.
Key Primary
Field
Type
Size
Comments
Field Key
town or city name
Text
255 Yes
No
Type
Text
255 No
No
Index
Numeric 8
Place (FIPS)
Numeric
Internal Point (Latitude)
No
No
No
No
Numeric 8
No
No
Internal Point (Longitude)
Numeric 8
No
No
Total population: Total
Numeric 8
No
No
Occupied housing units: Average
8
Numeric
household size; Total
No
No
190
8
Federal
Information
Processing Standard
Occupied housing units: Total
Numeric 8
No
No
Households:
Median
income in 1999 ; Total
Numeric
No
No
Numeric 8
No
No
Total population: Male; Under 1 year Numeric 8
No
No
Total population: Male; 1 year
Numeric 8
No
No
Total population: Male; 2 years
Numeric 8
No
No
Total population: Male; 3 years
Numeric 8
No
No
Total population: Male; 4 years
Numeric 8
No
No
Total population: Male; 5 years
Numeric 8
No
No
Total population: Male; 6 years
Numeric 8
No
No
Total population: Male; 7 years
Numeric 8
No
No
Total population: Male; 8 years
Numeric 8
No
No
Total population: Male; 9 years
Numeric 8
No
No
Total population: Male; 10 years
Numeric 8
No
No
Total population: Male; 11 years
Numeric 8
No
No
Total population: Male; 12 years
Numeric 8
No
No
Total population: Male; 13 years
Numeric 8
No
No
Total population: Male; 14 years
Numeric 8
No
No
Total population: Male; 15 years
Numeric 8
No
No
Total population: Male; 16 years
Numeric 8
No
No
Total population: Male; 17 years
Numeric 8
No
No
Total population: Male; 18 years
Numeric 8
No
No
Total population: Male; 19 years
Numeric 8
No
No
Total population: Male; 20 years
Numeric 8
No
No
Total population: Male; 21 years
Numeric 8
No
No
Total population: Male; 22 to 24
8
Numeric
years
No
No
Total population: Male; 25 to 29
8
Numeric
years
No
No
Total population: Male; 30 to 34
8
Numeric
years
No
No
Total population: Male; 35 to 39
8
Numeric
years
No
No
Total population: Male; 40 to 44
8
Numeric
years
No
No
household
Total population: Male
8
191
Total population: Male; 45 to 49
8
Numeric
years
No
No
Total population: Male; 50 to 54
8
Numeric
years
No
No
Total population: Male; 55 to 59
8
Numeric
years
No
No
Total population: Male; 60 and 61
8
Numeric
years
No
No
Total population: Male; 62 to 64
8
Numeric
years
No
No
Total population: Male; 65 and 66
8
Numeric
years
No
No
Total population: Male; 67 to 69
8
Numeric
years
No
No
Total population: Male; 70 to 74
8
Numeric
years
No
No
Total population: Male; 75 to 79
8
Numeric
years
No
No
Total population: Male; 80 to 84
8
Numeric
years
No
No
Total population: Male; 85 years and
8
Numeric
over
No
No
Total population: Female
Numeric 8
No
No
Total population: Female; Under 1
8
Numeric
year
No
No
Total population: Female; 1 year
Numeric 8
No
No
Total population: Female; 2 years
Numeric 8
No
No
Total population: Female; 3 years
Numeric 8
No
No
Total population: Female; 4 years
Numeric 8
No
No
Total population: Female; 5 years
Numeric 8
No
No
Total population: Female; 6 years
Numeric 8
No
No
Total population: Female; 7 years
Numeric 8
No
No
Total population: Female; 8 years
Numeric 8
No
No
Total population: Female; 9 years
Numeric 8
No
No
Total population: Female; 10 years
Numeric 8
No
No
Total population: Female; 11 years
Numeric 8
No
No
Total population: Female; 12 years
Numeric 8
No
No
Total population: Female; 13 years
Numeric 8
No
No
192
Total population: Female; 14 years
Numeric 8
No
No
Total population: Female; 15 years
Numeric 8
No
No
Total population: Female; 16 years
Numeric 8
No
No
Total population: Female; 17 years
Numeric 8
No
No
Total population: Female; 18 years
Numeric 8
No
No
Total population: Female; 19 years
Numeric 8
No
No
Total population: Female; 20 years
Numeric 8
No
No
Total population: Female; 21 years
Numeric 8
No
No
Total population: Female; 22 to 24
8
Numeric
years
No
No
Total population: Female; 25 to 29
8
Numeric
years
No
No
Total population: Female; 30 to 34
8
Numeric
years
No
No
Total population: Female; 35 to 39
8
Numeric
years
No
No
Total population: Female; 40 to 44
8
Numeric
years
No
No
Total population: Female; 45 to 49
8
Numeric
years
No
No
Total population: Female; 50 to 54
8
Numeric
years
No
No
Total population: Female; 55 to 59
8
Numeric
years
No
No
Total population: Female; 60 and 61
8
Numeric
years
No
No
Total population: Female; 62 to 64
8
Numeric
years
No
No
Total population: Female; 65 and 66
8
Numeric
years
No
No
Total population: Female; 67 to 69
8
Numeric
years
No
No
Total population: Female; 70 to 74
8
Numeric
years
No
No
Total population: Female; 75 to 79
8
Numeric
years
No
No
Total population: Female; 80 to 84
8
Numeric
years
No
No
Total population: Female; 85 years Numeric 8
No
No
193
and over
Employed civilian population 16
8
Numeric
years and over: Total
No
No
Employed civilian population 16
8
Numeric
years and over: Male
No
No
Employed civilian population 16
8
Numeric
years and over: Male; Agricultur
No
No
Employed civilian population 16
8
Numeric
years and over: Male; Agricultu1
No
No
Employed civilian population 16
8
Numeric
years and over: Male; Mining
No
No
Employed civilian population 16
8
Numeric
years and over: Male; Constructi
No
No
Employed civilian population 16
8
Numeric
years and over: Male; Manufactur
No
No
Employed civilian population 16
8
Numeric
years and over: Male; Wholesale
No
No
Employed civilian population 16
8
Numeric
years and over: Male; Retail tra
No
No
Employed civilian population 16
8
Numeric
years and over: Male; Transporta
No
No
Employed civilian population 16
8
Numeric
years and over: Male; Transport1
No
No
Employed civilian population 16
8
Numeric
years and over: Male; Utilities
No
No
Employed civilian population 16
8
Numeric
years and over: Male; Informatio
No
No
Employed civilian population 16
8
Numeric
years and over: Male; Finance; i
No
No
Employed civilian population 16
8
Numeric
years and over: Male; Finance an
No
No
Employed civilian population 16
8
Numeric
years and over: Male; Real estat
No
No
Employed civilian population 16
8
Numeric
years and over: Male; Profession
No
No
Employed civilian population 16
8
Numeric
years and over: Male; Professio1
No
No
Employed civilian population 16
8
Numeric
years and over: Male; Management
No
No
Employed civilian population 16 Numeric 8
No
No
194
years and over: Male; Administra
Employed civilian population 16
8
Numeric
years and over: Male; Educationa
No
No
Employed civilian population 16
8
Numeric
years and over: Male; Education1
No
No
Employed civilian population 16
8
Numeric
years and over: Male; Health car
No
No
Employed civilian population 16
8
Numeric
years and over: Male; Arts; ente
No
No
Employed civilian population 16
8
Numeric
years and over: Male; Arts; ent1
No
No
Employed civilian population 16
8
Numeric
years and over: Male; Accommodat
No
No
Employed civilian population 16
8
Numeric
years and over: Male; Other serv
No
No
Employed civilian population 16
8
Numeric
years and over: Male; Public adm
No
No
Employed civilian population 16
8
Numeric
years and over: Female
No
No
Employed civilian population 16
8
Numeric
years and over: Female; Agricult
No
No
Employed civilian population 16
8
Numeric
years and over: Female; Agricul1
No
No
Employed civilian population 16
8
Numeric
years and over: Female; Mining
No
No
Employed civilian population 16
8
Numeric
years and over: Female; Construc
No
No
Employed civilian population 16
8
Numeric
years and over: Female; Manufact
No
No
Employed civilian population 16
8
Numeric
years and over: Female; Wholesal
No
No
Employed civilian population 16
8
Numeric
years and over: Female; Retail t
No
No
Employed civilian population 16
8
Numeric
years and over: Female; Transpor
No
No
Employed civilian population 16
8
Numeric
years and over: Female; Transpo1
No
No
Employed civilian population 16
8
Numeric
years and over: Female; Utilitie
No
No
Employed civilian population 16 Numeric 8
No
No
195
years and over: Female; Informat
Employed civilian population 16
8
Numeric
years and over: Female; Finance;
No
No
Employed civilian population 16
8
Numeric
years and over: Female; Finance
No
No
Employed civilian population 16
8
Numeric
years and over: Female; Real est
No
No
Employed civilian population 16
8
Numeric
years and over: Female; Professi
No
No
Employed civilian population 16
8
Numeric
years and over: Female; Profess1
No
No
Employed civilian population 16
8
Numeric
years and over: Female; Manageme
No
No
Employed civilian population 16
8
Numeric
years and over: Female; Administ
No
No
Employed civilian population 16
8
Numeric
years and over: Female; Educatio
No
No
Employed civilian population 16
8
Numeric
years and over: Female; Educati1
No
No
Employed civilian population 16
8
Numeric
years and over: Female; Health c
No
No
Employed civilian population 16
8
Numeric
years and over: Female; Arts; en
No
No
Employed civilian population 16
8
Numeric
years and over: Female; Arts; e1
No
No
Employed civilian population 16
8
Numeric
years and over: Female; Accommod
No
No
Employed civilian population 16
8
Numeric
years and over: Female; Other se
No
No
Employed civilian population 16
Numeric 8
years and over: Female; Public a
No
No
year
Text
No
No
annualPopGrowth
Numeric 8
No
No
recordnumber
Numeric 4
Yes
Yes
LocallyModified
Boolean 1
No
No
4276
4277
4278
196
50
Locally modified
created.
or
4279
4280
4281
4282
4283
4284
4285
4286
4287
4288
4289
Table: CensusData-wshed
Description: This table is a way to link the CensusData-completeState table above with
drainages in the watershed. PlaceName indicates the place in CensusData-completeState
that falls geographically in the drainage specified by DrainName.
Field
Type Size Key Field Primary Key
Comments
PlaceName
Text
50
Yes
No
DrainName
Text
50
Yes
No
PlaceIndex
Numeric 8
No
No
LocallyModified
Boolean 1
No
No
Table: DataSources
Description: sectionName is the name of the heading as shown in the report. DataSource
is the datasource text field displayed below the heading. sectionLink corresponds to the
sectionLink number in the Crystal Reports themselves; sectionLink is used to link this
table to the reports.
Field
4290
4291
4292
4293
4294
4295
4296
4297
4298
4299
Locally modified or created.
Size Key Field Primary Key
Type
sectionName
Text
150 No
No
DataSource
Text
150 No
No
sectionLink
Numeric 75
Yes
No
recordnumber
Numeric 4
Yes
Yes
LocallyModified
Boolean 1
No
No
Comments
Locally modified or created.
Table: Disclaimer
Description: Contains the USU Disclaimer text displayed near the front of the report.
Table contains only one row of data.
Key
Field
Type
Size
Primary Key
Comments
Field
Disclaimer
Text
2147483647
No
No
LocallyModified
Boolean
1
No
No
Local mod or create
Table: Discussion
Description: Legacy Table for adding watershed specific ‘discussion’ comments. Not
used by the existing watershed characterization program.
Field
Type Size Key Field Primary Key
Comments
Watershed
Text
50
Yes
No
Watershed Name
197
Discussion
Text
16
LocallyModified Boolean 1
4300
4301
4302
4303
4304
4305
No
No
New Discussion
No
No
Data locally modified or created.
Table: Drainages
Description: Contains data regarding drainages within the watershed. All data in the
report is selected from drainage name, making it a very important field and a candidate
key.
Field
Type Size Key Field Primary Key
Comments
Area
Numeric 8
No
No
Area (m^2)
BSNSWRIA1_ID
Numeric 8
No
No
WRIA 1 Unique ID
WtrUse_ID
Numeric 8
No
No
DrainName
Text
Acres
Numeric 8
SqMiles
Numeric 8
Description
Text
ID
Numeric 8
Yes
Yes
LocallyModified
Boolean 1
No
No
hasCoastline
Boolean 1
No
No
4306
4307
4308
4309
4310
4311
4312
255 Yes
No
Drainage Name
No
No
Acreage
No
No
255 No
No
Locally modified or created.
Table: FishDist
Description: Contains fish distribution data by species. For each of the species names
given by the field names, the value is 0, 1 or 2. 0 indicates no distribution, 1 indicates
distribution, and 2 indicates critical distribution. Drain_name is the drainage in which
distribution is concerning.
Comments
Field
Type Size Key Field Primary Key
CHIN
Numeric 8
No
No
CHUM
Numeric 8
No
No
PINK
Numeric 8
No
No
COHO
Numeric 8
No
No
SOCK
Numeric 8
No
No
STHD
Numeric 8
No
No
CUTT
Numeric 8
No
No
CHAR
Numeric 8
No
No
KOK
Numeric 8
No
No
RBT
Numeric 8
No
No
EBT
Numeric 8
No
No
198
4313
4314
4315
4316
4317
4318
FACHIN
Numeric 8
No
No
SPCHIN
Numeric 8
No
No
SUSTHD
Numeric 8
No
No
WSTHD
Numeric 8
No
No
DRAIN_NAME
Text
recordnumber
Numeric 4
Yes
Yes
LocallyModified
Boolean 1
No
No
255 Yes
No
Drainage Name
Locally modified or created.
Table: FishPeriodicityKC
Description: Fish Periodicity/Presence data for each month, where 0 is no presence, 1 is
present, and 2 is critical presence. Data in this table is specifically for the species in the
Known Current dataset.
Field
Type Size Key Field Primary Key
Comments
Drainage
Text
75
Yes
No
Species
Text
50
Yes
No
Lifestage
Text
50
Yes
No
PresenceJAN
Numeric 2
No
No
PresenceFEB
Numeric 2
No
No
PresenceMAR
Numeric 2
No
No
PresenceAPR
Numeric 2
No
No
PresenceMAY
Numeric 2
No
No
PresenceJUN
Numeric 2
No
No
PresenceJUL
Numeric 2
No
No
PresenceAUG
Numeric 2
No
No
PresenceSEP
Numeric 2
No
No
PresenceOCT
Numeric 2
No
No
PresenceNOV
Numeric 2
No
No
PresenceDEC
Numeric 2
No
No
LocallyModified
Boolean 1
No
No
Recordnumber
Numeric 4
No
No
presentInDrainage
Boolean 1
No
No
segment
Text
Yes
No
50
Drainage Name
Locally modified or created.
4319
4320
4321
199
4322
4323
4324
4325
Table: FishPeriodicityKH
Description: Fish Periodicity/Presence data for each month, where 0 is no presence, 1 is
present, and 2 is critical presence. Data in this table is specifically for the species in the
Known Historic dataset.
Field
Type Size Key Field Primary Key
Comments
Drainage
Text
75
Yes
No
Species
Text
50
Yes
No
Lifestage
Text
50
Yes
No
PresenceJAN
Numeric 2
No
No
PresenceFEB
Numeric 2
No
No
PresenceMAR
Numeric 2
No
No
PresenceAPR
Numeric 2
No
No
PresenceMAY
Numeric 2
No
No
PresenceJUN
Numeric 2
No
No
PresenceJUL
Numeric 2
No
No
PresenceAUG
Numeric 2
No
No
PresenceSEP
Numeric 2
No
No
PresenceOCT
Numeric 2
No
No
PresenceNOV
Numeric 2
No
No
PresenceDEC
Numeric 2
No
No
LocallyModified
Boolean 1
No
No
Recordnumber
Numeric 4
No
No
presentInDrainage
Boolean 1
No
No
segment
Text
Yes
No
4326
4327
4328
4329
4330
4331
50
Locally modified or created.
Table: FishPeriodicityPC
Description: Fish Periodicity/Presence data for each month, where 0 is no presence, 1 is
present, and 2 is critical presence. Data in this table is specifically for the species in the
Presumed Current dataset.
Field
Type Size Key Field Primary Key
Comments
Drainage
Text
75
Yes
No
Species
Text
50
Yes
No
Lifestage
Text
50
Yes
No
PresenceJAN
Numeric 2
No
No
PresenceFEB
Numeric 2
No
No
PresenceMAR
Numeric 2
No
No
200
4332
4333
4334
4335
4336
4337
PresenceAPR
Numeric 2
No
No
PresenceMAY
Numeric 2
No
No
PresenceJUN
Numeric 2
No
No
PresenceJUL
Numeric 2
No
No
PresenceAUG
Numeric 2
No
No
PresenceSEP
Numeric 2
No
No
PresenceOCT
Numeric 2
No
No
PresenceNOV
Numeric 2
No
No
PresenceDEC
Numeric 2
No
No
LocallyModified
Boolean 1
No
No
Recordnumber
Numeric 4
No
No
presentInDrainage
Boolean 1
No
No
segment
Text
Yes
No
50
Locally modified or created.
Table: FishPeriodicityPH
Description: Fish Periodicity/Presence data for each month, where 0 is no presence, 1 is
present, and 2 is critical presence. Data in this table is specifically for the species in the
Presumed Historic dataset.
Field
Type Size Key Field Primary Key
Comments
Drainage
Text
75
Yes
No
Species
Text
50
Yes
No
Lifestage
Text
50
Yes
No
PresenceJAN
Numeric 2
No
No
PresenceFEB
Numeric 2
No
No
PresenceMAR
Numeric 2
No
No
PresenceAPR
Numeric 2
No
No
PresenceMAY
Numeric 2
No
No
PresenceJUN
Numeric 2
No
No
PresenceJUL
Numeric 2
No
No
PresenceAUG
Numeric 2
No
No
PresenceSEP
Numeric 2
No
No
PresenceOCT
Numeric 2
No
No
PresenceNOV
Numeric 2
No
No
PresenceDEC
Numeric 2
No
No
LocallyModified
Boolean 1
No
No
Locally modified or created.
201
Recordnumber
Numeric 4
No
No
presentInDrainage
Boolean 1
No
No
segment
Text
Yes
No
4338
4339
4340
4341
4342
50
Table: FishUtilizationRestoration
Description: Text blocks of data for each drainage, describing fish utilization and any
fish restoration priorities within that drainage.
Key
Primary
Field
Type Size
Comments
Field
Key
UtilizationRestorationPriorities Text
2048 No
No
Drainage
Text
75
Yes
No
Recordnumber
Numeric 4
Yes
Yes
LocallyModified
Boolean 1
No
No
4343
4344
4345
4346
4347
4348
Locally modified or
created.
Table: Glossary
Description: This is the glossary appearing at the end of the report; for each term, a
definition is provided. The contents of this table are listed in alphabetic order in the
glossary.
Field
Type Size Key Field Primary Key
Comments
Term
Text
75
Yes
No
Definition
Text
350 Yes
No
LocallyModified
Boolean 1
No
No
recordnumber
Numeric 4
Yes
Yes
4349
4350
4351
4352
4353
Locally modified or created.
Table: InstreamFlow
Description: Contains legally established and proposed Instream Flow requirements for
the given stream segment, which lies in the given drainage.
Field
Type
Size Key Field Primary Key
Comments
Drainage
Text
75
Yes
No
StreamSegment
Text
75
Yes
No
LegallyEstablished Boolean
1
No
No
Proposed
Boolean
1
No
No
DateLegal
Date/Time 8
No
No
DateProposed
Date/Time 8
No
No
LocallyModified
Boolean
No
No
202
1
Locally modified or created.
recordnumber
Numeric
4
Yes
Yes
LegalJan
Numeric
8
No
No
LegalFeb
Numeric
8
No
No
LegalMar
Numeric
8
No
No
LegalApr
Numeric
8
No
No
LegalMay
Numeric
8
No
No
LegalJune
Numeric
8
No
No
LegalJuly
Numeric
8
No
No
LegalAug
Numeric
8
No
No
LegalSep
Numeric
8
No
No
LegalOct
Numeric
8
No
No
LegalNov
Numeric
8
No
No
LegalDec
Numeric
8
No
No
ProposedJan
Numeric
8
No
No
ProposedFeb
Numeric
8
No
No
ProposedMar
Numeric
8
No
No
ProposedApr
Numeric
8
No
No
ProposedMay
Numeric
8
No
No
ProposedJun
Numeric
8
No
No
ProposedJul
Numeric
8
No
No
ProposedAug
Numeric
8
No
No
ProposedSep
Numeric
8
No
No
ProposedOct
Numeric
8
No
No
ProposedNov
Numeric
8
No
No
ProposedDec
Numeric
8
No
No
4354
4355
4356
4357
4358
4359
4360
Table: LayerData-DataTags
Description: Contains the layer tags from the project file for those layers which are used
to extract data; the DataLayer field contains a textual description such as “Water Quality
Sampling Sites” that the plug-in is looking for. TAG is the project file tag of the
corresponding layer.
Field
Type Size Key Field Primary Key
Comments
DataLayer
Text
50
Yes
Yes
TAG
Text
50
No
No
LocallyModified
Boolean 1
No
No
Locally modified or created.
4361
203
4362
4363
4364
4365
Table: LayerData-MapTags
Description: Contains the project file tags for the layers going into each map, as well as
the order that the layer appears in inside that map.
Field
Type
Size Key Field Primary Key
Comments
MapName
Text
50
Yes
No
Name of the map being
generated; Plug-in looks for this.
TAG
Text
70
Yes
No
Project file tag of the layer going
into the map.
OrderInMap
Numeric 4
No
No
Order that the layer will appear
in the map.
recordnumber
Numeric 4
Yes
Yes
No
No
LocallyModified Boolean 1
4366
4367
4368
4369
4370
Locally modified or created.
Table: MonthName
Description: Contains the number of each month and the textual name, for lookup from
reports.
Field
Type Size Key Field Primary Key
Comments
MonthNum
Numeric 4
No
No
MonthName
Text
No
No
No
No
50
LocallyModified Boolean 1
4371
4372
4373
4374
4375
Locally modified or created.
Table: Overview
Description: Contains the “Report Overview” text that appears near the front of the
report. This table contains only one row of data.
Field
Type
Size
Key Field Primary Key
Comments
Overview
Text
2147483647 No
LocallyModified Boolean 1
4376
4377
4378
4379
4380
4381
No
No
No
Locally modified or
created.
Table: PredefinedAggregations
Description: Contains the name of the drainage and the shapeindex of that drainage in
the Watershed Delineation shapefile, along with the name of the aggregation that the
drainage belongs to.
Key Primary
Field
Type Size
Comments
Field
Key
recordnum
204
Numeric 4
Yes
Yes
4382
4383
4384
4385
4386
4387
4388
4389
4390
4391
4392
AggregationName Text
50
Yes
No
DrainageName
Text
50
Yes
No
ShapeIndex
Numeric 8
No
No
LocallyModified Boolean 1
No
No
[Note duplication of data violating normal
form; not worth overhead to have a
separate (“aggregations”) table.]
Locally modified or created.
Table: Recreation
Description: Contains information regarding recreational activities for each drainage; the
location in question, the activities available at that location, whether the activities include
contact and noncontact activities, and the drainage the location falls within.
Field
Type Size Key Field Primary Key
Comments
inDrainage
Text
75
Yes
No
Location
Text
75
Yes
No
Activities
Text
250 No
Contact
Boolean 1
No
No
Noncontact
Boolean 1
No
No
LocallyModified Boolean 1
No
No
Used to link to Drainages table.
No
Locally modified or created.
Table: ReportFirstPage
Description: Contains the data to be placed on the first page of the report. This table has
only one row of data, and thus needs no primary key or other keys.
Primary
Field
Type Size Key Field
Comments
Key
FirstLine
Text
255 No
No
The two smaller lines above
SecondLine
Text
255 No
No
The main (bigger font) label.
MainTitleSubnote Text
255 No
No
Note to display below “Watershed
Characterization Report”
FootnoteLine1
Text
255 No
No
The four lines of the footnote.
FootnoteLine2
Text
255 No
No
These may be left blank if they
FootnoteLine3
Text
255 No
No
are not needed.
FootnoteLine4
Text
255 No
No
LocallyModified
Boolean 1
No
No
Locally modified or created.
4393
4394
205
4395
4396
4397
Table: SectionCommentary
Description: Table to hold report section comments.
Field
Type
Size Key Field Primary Key
SectionLink
Number 4
No
No
Commentary
Ntext
No
No
No
No
16
LocallyModified Boolean 1
4398
4399
4400
4401
4402
4403
4404
Comments
Locally modified or created.
Table: SectionVisibility
Description: This table controls the visibility of individual report sections. When the
report is generated, all sections are hidden – only those sections listed in this table are
made visible again. This allows customization of the report (to hide sections) by editing
this table.
Key Primary
Field
Type Size
Comments
Field
Key
sectionLink
Numeric 4
No
No
Corresponds to the sectionLink
number in the crystal reports; also
to the sectionLink in DataSources.
One sectionLink generally exists
for each report “section”.
True/false whether section is to be
displayed. If no corresponding
record is found in this table, false
is assumed.
isDisplayed
Boolean 1
No
No
recordnumber
Numeric
No
Yes
inSubreport
Text
No
No
Name of the Crystal report that
this section appears in.
No
Crystal section numbers of
sections in report that need to be
shown for this sectionLink (ie, this
section). If all sections in the
report file are to be displayed,
place -1 here.
sectionsOfSubreport
Text
75
10
No
requiredHeadingSectionNo Numeric 4
No
No
Section number of any required
heading; e.g. if section 1.1 is
displayed, then section 1.1 requires
the section that has the 1.0 label.
(May be null if desired)
requiredHeadingSubreport Text
No
No
Crystal Report name of the report
where the required heading section
occurs.
206
75
(May be null if desired)
LocallyModified
4405
4406
4407
4408
4409
Boolean 1
4416
4417
4418
4419
4420
4421
4422
No
Locally modified or created.
Table: ShellFishbyDrainage
Description: Contains a text block of data regarding shellfish harvesting activities for a
given drainage.
Field
Type Size Key Field Primary Key
Comments
DrainName
Text
255 Yes
No
ShellFish
Text
255 No
No
recordnumber
Numeric 4
LocallyModified Boolean 1
4410
4411
4412
4413
4414
4415
No
Yes
Yes
No
No
Locally modified or created.
Table: StreamClosures
Description: Contains closure status and closure period information for a given source
and tributary. Includes a “LocatedInDrainage” field that’s used to select this data from
the report.
Field
Type Size Key Field Primary Key
Comments
SourceName
Text
255 No
No
TributaryTo
Text
255 No
No
FormerAdministrativeStatus
Text
255 No
No
StatusUnderRegulation
Text
255 No
No
PeriodofClosure
Text
255 No
No
recordnumber
Numeric 4
Yes
Yes
LocatedInDrainage
Text
No
No
LocallyModified
Boolean 1
No
No
50
Locally modified or
created.
Table: tmp_FishDistComplete
Description: All tmp_ tables are used for internal processing in the report, and have their
contents deleted at the beginning of each report run. This table contains the Fish
Distribution data from the FishDist table, but formatted in such a way that the report may
easily read it.
Field
Type Size Key Field Primary Key
Comments
DrainageName
Text
50
No
No
Species
Text
50
No
No
Known
Text
6
No
No
207
Presumed
Text
6
No
No
Potential
Text
6
No
No
Artificial
Text
6
No
No
LocallyModified Boolean 1
No
No
4423
4424
4425
4426
4427
4428
4429
4430
Locally modified or created.
Table: tmp_Report303d
Description: All tmp_ tables are used for internal processing in the report, and have their
contents deleted at the beginning of each report run. This table holds data regarding listed
water bodies, copied from the 303d table. This table contains only the 303(d) data that
falls within the boundaries of the drainages being reported on, where the 303d table
contains *all* 303(d) data.
Field
Type Size Key Field Primary Key
Comments
wType
No
No
LocallyModified Boolean 1
No
No
wcrsNumber
Text
50
No
No
Parameter
Text
50
No
No
Medium
Text
75
No
No
303d
Text
50
No
No
FirstListedYear
Text
50
No
No
Basis
Text
1024 No
No
Remarks
Text
1024 No
No
ActionNeeded
Text
50
No
No
wbid
Text
50
No
No
wgclNumber
Text
50
No
No
4431
4432
4433
4434
4435
Text
50
Locally modified or created.
Table: tmp_ReportClimate
Description: Table to hold summary information on climate data to report monthly
average values of climate data used in the scenario simulation.
Field
Type Size Key Field Primary Key
Comments
JANavgval
Float
8
No
No
January Average Value
Febavgval
Float
8
No
No
February Average Value
MARavgval
Float
8
No
No
March Average Value
APRavgval
Float
8
No
No
April Average Value
MAYavgval
Float
8
No
No
May Average Value
JUNavgval
Float
8
No
No
June Average Value
JULavgval
Float
8
No
No
July Average Value
208
SEPavgval
Float
8
No
No
September Average Value
OCTavgval
Float
8
No
No
October Average Value
NOVavgval
Float
8
No
No
November Average Value
DECavgval
Float
8
No
No
December Average Value
station
Text
75
Yes
No
Station ID
parameter
Number 4
No
No
Climate Variable
numobservations Number 8
No
No
Number of Observations
period
Text
75
No
No
Time period
AUGavgval
Float
8
No
No
August
4436
4437
4438
4439
4440
4441
4442
Table: tmp_ReportColiform
Description: All tmp_ tables are used for internal processing in the report, and have their
contents deleted at the beginning of each report run. This table holds the number of
samples and average sample value for fecal coliforms at each sampling site, taken from
the WaterQuality database.
Field
Type Size Key Field Primary Key
Comments
numColSamp
Numeric 8
No
No
AveColSamp
Numeric 8
No
No
stationname
Text
No
No
No
No
75
LocallyModified Boolean 1
4443
4444
4445
4446
4447
4448
4449
4450
4451
4452
4453
4454
Locally modified or created.
Table: tmp_ReportDataSources
Description: All tmp_ tables are used for internal processing in the report, and have their
contents deleted at the beginning of each report run. This table has one data row only; it’s
got a field for each possible sectionLink value. When the report reads the DataSource
information, it needs to be from a table having only one record for the links to work
properly; so, this table is the data from DataSources, reformatted. The numeric field
names correspond to the DataSource values for the sectionLink value of the field name.
The fields that are numeric but beginning with A are the section heading labels for the
sectionLink of the field’s name. Numbers 100+ are the major section headings. No keys
or indexes are necessary, as there is only one row.
Field
Type Size Key Field Primary Key
Comments
1
Text
255 No
No
11
Text
255 No
No
12
Text
255 No
No
13
Text
255 No
No
14
Text
255 No
No
209
15
Text
255 No
No
16
Text
255 No
No
17
Text
255 No
No
18
Text
255 No
No
19
Text
255 No
No
20
Text
255 No
No
2
Text
255 No
No
3
Text
255 No
No
4
Text
255 No
No
5
Text
255 No
No
6
Text
255 No
No
7
Text
255 No
No
8
Text
255 No
No
9
Text
255 No
No
10
Text
255 No
No
21
Text
255 No
No
22
Text
255 No
No
23
Text
255 No
No
24
Text
255 No
No
25
Text
255 No
No
26
Text
255 No
No
27
Text
255 No
No
28
Text
255 No
No
29
Text
255 No
No
30
Text
255 No
No
31
Text
255 No
No
32
Text
255 No
No
33
Text
255 No
No
34
Text
255 No
No
35
Text
255 No
No
36
Text
255 No
No
37
Text
255 No
No
38
Text
255 No
No
39
Text
255 No
No
40
Text
255 No
No
210
41
Text
255 No
No
42
Text
255 No
No
43
Text
255 No
No
44
Text
255 No
No
45
Text
255 No
No
46
Text
255 No
No
47
Text
255 No
No
48
Text
255 No
No
49
Text
255 No
No
50
Text
255 No
No
51
Text
255 No
No
52
Text
255 No
No
53
Text
255 No
No
A1
Text
255 No
No
A2
Text
255 No
No
A3
Text
255 No
No
A4
Text
255 No
No
A5
Text
255 No
No
A6
Text
255 No
No
A7
Text
255 No
No
A8
Text
255 No
No
A9
Text
255 No
No
A10
Text
255 No
No
A11
Text
255 No
No
A12
Text
255 No
No
A13
Text
255 No
No
A14
Text
255 No
No
A15
Text
255 No
No
A16
Text
255 No
No
A17
Text
255 No
No
A18
Text
255 No
No
A19
Text
255 No
No
A20
Text
255 No
No
A21
Text
255 No
No
A22
Text
255 No
No
211
A23
Text
255 No
No
A24
Text
255 No
No
A25
Text
255 No
No
A26
Text
255 No
No
A27
Text
255 No
No
A28
Text
255 No
No
A29
Text
255 No
No
A30
Text
255 No
No
A31
Text
255 No
No
A32
Text
255 No
No
A33
Text
255 No
No
A34
Text
255 No
No
A35
Text
255 No
No
A36
Text
255 No
No
A37
Text
255 No
No
A38
Text
255 No
No
A39
Text
255 No
No
A40
Text
255 No
No
A41
Text
255 No
No
A42
Text
255 No
No
A43
Text
255 No
No
A44
Text
255 No
No
A45
Text
255 No
No
A46
Text
255 No
No
A47
Text
255 No
No
A48
Text
255 No
No
A49
Text
255 No
No
A50
Text
255 No
No
A51
Text
255 No
No
A52
Text
255 No
No
A53
Text
255 No
No
100
Text
255 No
No
101
Text
255 No
No
102
Text
255 No
No
103
Text
255 No
No
212
104
Text
255 No
No
105
Text
255 No
No
106
Text
255 No
No
107
Text
255 No
No
108
Text
255 No
No
109
Text
255 No
No
110
Text
255 No
No
111
Text
255 No
No
112
Text
255 No
No
113
Text
255 No
No
114
Text
255 No
No
115
Text
255 No
No
116
Text
255 No
No
117
Text
255 No
No
118
Text
255 No
No
119
Text
255 No
No
120
Text
255 No
No
LocallyModified Boolean 1
4455
4456
4457
4458
4459
4460
4461
No
No
Locally modified or created.
Table: tmp_ReportFishPeriodicity
Description: All tmp_ tables are used for internal processing in the report, and have their
contents deleted at the beginning of each report run. This table stores an image with the
Lifestage Periodicity information, for each species, stream segment, and drainage. The
image is generated by the FishPeriodicityPlotter control.
Field
Type
Size
Key Field Primary Key
Comments
drainage
Text
75
No
No
segment
Text
75
No
No
species
Text
75
No
No
2147483647 No
No
PeriodicityImage Binary
LocallyModified Boolean 1
No
No
recordnumber
No
No
Numeric 4
Locally modified or
created.
4462
4463
213
4464
4465
4466
4467
4468
4469
Table: tmp_ReportFlowData
Description: All tmp_ tables are used for internal processing in the report, and have their
contents deleted at the beginning of each report run. This table holds the stream flow data
summarized from the FlowData database, but only the data that falls within the bounds of
the drainages being reported on. The Streamflow Sampling Sites shapefile is used to
determine which station numbers are in the bounds of the drainages.
Field
Type Size Key Field Primary Key
Comments
Station
Text
50
No
No
Agency_Code
Text
50
No
No
Date
Date/Time 4
No
No
Flow
Numeric
8
No
No
Comments
Text
50
No
No
RecordNum
Numeric
4
Yes
Yes
Station Name
Text
255 No
No
Location
Text
255 No
No
Latitude
Numeric
8
No
No
Longitude
Numeric
8
No
No
Elevation
Numeric
4
No
No
HUC
Numeric
4
No
No
Base Flow
Numeric
8
No
No
Drainage Area
Numeric
8
No
No
Period
Text
50
No
No
Years of Reference Text
50
No
No
DrainName
Text
50
No
No
StreamName
Text
50
No
No
LocallyModified
Boolean
1
No
No
4470
4471
4472
4473
4474
4475
4476
Locally modified or created.
Table: tmp_ReportFlowStationInfo
Description: All tmp_ tables are used for internal processing in the report, and have their
contents deleted at the beginning of each report run. This table holds information
regarding the flow data stations in the bounds of the reporting drainages, summarized
from the FlowData database.
Key
Primary
Field
Type Size
Comments
Field
Key
Drainage
Text
50
No
No
Streamname
Text
50
No
No
Station
Text
50
No
No
214
StationName
Text
50
LocallyModified Boolean 1
4477
4478
4479
4480
4481
4482
4483
No
No
No
Locally modified or created.
Table: tmp_ReportingDrainages
Description: All tmp_ tables are used for internal processing in the report, and have their
contents deleted at the beginning of each report run. This table stores a list of the
drainage names that are being reported on; used by the report to link to the tables which
use Drainage or DrainName as a selector.
Key
Primary
Field
Type Size
Comments
Field
Key
Drainage
Text
50
LocallyModified Boolean 1
4484
4485
4486
4487
4488
4489
4490
4491
4492
4493
4494
4495
4496
4497
No
No
No
No
No
Locally modified or created.
Table: tmp_ReportLandCover
Description: All tmp_ tables are used for internal processing in the report, and have their
contents deleted at the beginning of each report run. This table contains each of the Land
Cover types (from National Land Cover Dataset Classification System), along with the
percentage of the selected drainages they cover and the total area reporting on.
Field
Type Size Key Field Primary Key
Comments
totalarea
Numeric 4
No
No
Level
Text
No
No
percent
Numeric 8
No
No
LocallyModified Boolean 1
No
No
50
This field is repeating
information, but it makes the
report calculations much easier to
perform keeping it in this unnormalized form.
Locally modified or created.
Table: tmp_ReportNutrients
Description: All tmp_ tables are used for internal processing in the report, and have their
contents deleted at the beginning of each report run. This table holds the number of
samples and average sample value for each nutrient at each sampling site, taken from the
WaterQuality database.
Field
Type Size Key Field Primary Key
Comments
stationname
Text
75
No
No
nutrient
Text
75
No
No
meanvalue
Numeric 8
No
No
numsamples
Numeric 8
No
No
215
LocallyModified Boolean 1
4498
4499
4500
4501
4502
4503
4504
4505
No
No
Locally modified or created.
Table: tmp_ReportPassData
Description: All tmp_ tables are used for internal processing in the report, and have their
contents deleted at the beginning of each report run. This table has only one row of data,
similar to ReportFirstPage. Stores miscellaneous data, such as report generator version,
which periodicity dataset is in use, what units are selected, et cetera. As the table has one
row, no keys are necessary.
Field
Type Size Key Field Primary Key
Comments
ReportGenVersion Text
50
No
No
LocallyModified
Boolean 1
No
No
PeriodicityDataset
Text
25
No
No
FlowUnits
Text
25
No
No
VolumeUnits
Text
25
No
No
YearDisplay
Text
25
No
No
No
No
DisplayCoastalData Boolean 1
4506
4507
4508
4509
4510
4511
Locally modified or created.
Locally modified or created.
Table: tmp_ReportSectionCommentary
Description: Gathers the section commentary data from the SecionCommentary table
and formats them into the one-row setup required for the report, placing that row into
tmp_ReportSectionCommentary.
Field
Type Size Key Field Primary Key
Comments
LocallyModified Boolean 1
No
No
100
Text
1024 No
No
101
Text
1024 No
No
102
Text
1024 No
No
103
Text
1024 No
No
104
Text
1024 No
No
105
Text
1024 No
No
106
Text
1024 No
No
107
Text
1024 No
No
108
Text
1024 No
No
109
Text
1024 No
No
110
Text
1024 No
No
111
Text
1024 No
No
112
Text
1024 No
No
216
Locally modified or created.
113
Text
1024 No
No
114
Text
1024 No
No
115
Text
1024 No
No
116
Text
1024 No
No
117
Text
1024 No
No
118
Text
1024 No
No
119
Text
1024 No
No
120
Text
1024 No
No
4512
4513
4514
4515
4516
4517
Table: tmp_ReportSocioeconomicData
Description: All tmp_ tables are used for internal processing in the report, and have their
contents deleted at the beginning of each report run. Stores the number of employed
population for each socioeconomic category.
Field
Type Size Key Field Primary Key
Comments
category
Text
value
Numeric 4
No
No
LocallyModified Boolean 1
No
No
recordnumber
No
No
4518
4519
4520
4521
4522
4523
4524
4525
250 No
Numeric 4
No
Locally modified or created.
Table: tmp_ReportSwapImages
Description: All tmp_ tables are used for internal processing in the report, and have their
contents deleted at the beginning of each report run. This table contains the map images
used throughout the report; reportSwappedFor indicates the subreport for which this
image was stored. The addtnlData fields are used in the Stream Flow report, and tell the
report what stream segment, drainage, etc. the flow graph was stored for.
Field
Type
Size
Key Field Primary Key
Comments
picturedata
Binary
2147483647 No
No
size
Numeric 4
No
No
filename
Text
50
No
No
reportSwappedFor Text
50
No
No
addtnlData
Text
50
No
No
addtnldata2
Text
50
No
No
LocallyModified
Boolean 1
No
No
addtnldata3
Text
50
No
No
addtnldata4
Text
50
No
No
Locally modified or
created.
217
4526
4527
4528
4529
4530
4531
4532
Table: tmp_ReportSwapImages2
Description: All tmp_ tables are used for internal processing in the report, and have their
contents deleted at the beginning of each report run. This table contains the map images
used throughout the report; reportSwappedFor indicates the subreport for which this
image was stored. This table is used rather than tmp_ReportSwapImages in the case that
more than one image is needed in the same subreport.
Field
Type
Size
Key Field Primary Key
picturedata
Binary
2147483647 No
size
Numeric 4
No
No
filename
Text
50
No
No
reportSwappedFor Text
50
No
No
No
LocallyModified
Boolean 1
No
No
addtnlData
Text
50
No
No
addtnlData2
Text
50
No
No
addtnlData3
Text
50
No
No
addtnlData4
Text
50
No
No
4533
4534
4535
4536
4537
4538
4539
4540
4541
Comments
Locally modified or
created.
Table: tmp_ReportSwapImages3
Description: All tmp_ tables are used for internal processing in the report, and have their
contents deleted at the beginning of each report run. This table contains the map images
used throughout the report; reportSwappedFor indicates the subreport for which this
image was stored. This table is used rather than tmp_ReportSwapImages or
tmp_ReportSwapImage2 in the case that more than one image is needed in the same
subreport.
Field
Type
Size
Key Field Primary Key
Comments
picturedata
Binary
2147483647 No
No
size
Numeric 4
No
No
filename
Text
50
No
No
reportSwappedFor Text
50
No
No
LocallyModified
Boolean 1
No
No
addtnlData
Text
50
No
No
addtnlData2
Text
50
No
No
addtnlData3
Text
50
No
No
addtnlData4
Text
50
No
No
4542
4543
218
Locally modified or
created.
4544
4545
4546
4547
4548
4549
4550
Table: tmp_ReportSwapNASBLG
Description: All tmp_ tables are used for internal processing in the report, and have their
contents deleted at the beginning of each report run. This table contains map-related
images – scale bar, legend. The name comes from NorthArrowScaleBarLeGend, before
North Arrow was a static image on the report. reportSwappedFor indicates the subreport
the images have been saved for.
Field
4551
4552
4553
4554
4555
4556
4557
4558
Type
Size
Key Field Primary Key
scalebar
Binary
2147483647 No
No
filename
Text
50
No
No
reportSwappedFor Text
50
No
No
scalebar_size
Numeric 16
No
No
legendLeft
Binary
2147483647 No
No
legendRight
Binary
2147483647 No
No
legendLeftSize
Numeric 16
No
No
legendRightSize
Numeric 16
No
No
LocallyModified
Boolean 1
No
No
Comments
Locally modified or
created.
Table: tmp_ReportSwapNASBLG2
Description: All tmp_ tables are used for internal processing in the report, and have their
contents deleted at the beginning of each report run. This table contains map-related
images such as scale bar and legends. reportSwappedFor indicates the subreport the
images have been saved for. This is used rather than tmp_ReportSwapNASBLG in the
case that more than one map appears in the same report.
Key
Primary
Field
Type
Size
Comments
Field
Key
scalebar
Binary
2147483647 No
No
filename
Text
50
No
No
reportSwappedFor Text
50
No
No
No
No
scalebar_size
Numeric 4
legendLeft
Binary
2147483647 No
No
legendRight
Binary
2147483647 No
No
legendLeftSize
Numeric 16
No
No
legendRightSize
Numeric 16
No
No
LocallyModified
Boolean 1
No
No
Locally modified or
created.
4559
4560
219
4561
4562
4563
4564
4565
Table: tmp_ReportTableOfContents
Description: All tmp_ tables are used for internal processing in the report, and have their
contents deleted at the beginning of each report run. This holds the table of contents data
after it’s been generated. Group is the section name, pagenumber is the page where the
first page of the section appears, and inOrd is an ordering indicator.
Field
Type Size Key Field Primary Key
Comments
Group
Text
100 No
No
PageNumber
Text
50
No
No
inOrd
Numeric 4
No
No
LocallyModified
Boolean 1
No
No
4566
4567
4568
4569
4570
4571
4572
Locally modified or created.
Table: tmp_ReportTemperature
Description: All tmp_ tables are used for internal processing in the report, and have their
contents deleted at the beginning of each report run. This table holds the number of
samples and average sample value for temperature at each sampling site, taken from the
WaterQuality database.
Key
Primary
Field
Type Size
Comments
Field
Key
numTempSamp Numeric 8
No
No
Number of Temperature Samples
AveTempSamp Numeric 8
No
No
Average sample value for
temperature
stationname
No
No
Station Name
No
No
Locally modified or created.
Text
75
LocallyModified Boolean 1
4573
4574
4575
4576
4577
Table: tmp_ReportWaterRights
Description: Temporary database table used to store flow data for each drainage during
a scenario simulation.
Field
Type Size Key Field Primary Key
Comments
inDrainage
Text
75
No
No
KEY_SOURCE
Text
75
Yes
No
PRIORITY_D
Text
50
No
No
DOCUMENT_T
Text
50
No
No
KEY_MAIN
Text
75
Yes
No
SOURCE
Text
50
No
No
PURPOSE_LI
Text
50
No
No
LAST_NAME
Text
75
No
No
Last Name
FIRST_NAME
Text
75
No
No
First Name
220
Priority Date
Source
4578
4579
4580
4581
4582
4583
4584
4585
4586
4587
4588
4589
4590
4591
BUSINESS_N
Text
75
No
No
Business Name
CFS
Float
8
No
No
Cubic feet per second
GPM
Float
8
No
No
Gallons per minute
ACRE_FEET
Float
8
No
No
Acre feet
ACRES_IRR
Float
8
No
No
Acres irrigated
RELATED_DO
Text
75
No
No
Locally_Modified
Boolean 1
No
No
Locally modified or created.
Table: tmp_ReportWaterUse
Description: All tmp_ tables are used for internal processing in the report, and have their
contents deleted at the beginning of each report run. This table holds the water use
information for all of the reporting drainages, combined and summarized from the
WaterUse-* tables.
Comments
Field
Type Size Key Field Primary Key
Flow
Numeric 8
No
No
Flow
Precip
Numeric 8
No
No
Precipitation
IndUse
Numeric 8
No
No
Landuse
Evap
Numeric 8
No
No
Evapotranspiration
AgUse
Numeric 8
No
No
Agricultural Use
DomMun Numeric 8
No
No
Domestic Municipal Use
month
No
No
Month of year
Numeric 4
Table: tmp_reportZoning
Description: All tmp_ tables are used for internal processing in the report, and have their
contents deleted at the beginning of each report run. This table stores the area of each
zone in the selected drainages, and the name of that zone. Total area of the drainages for
which zoning data is known is also stored.
Key Primary
Field
Type Size
Comments
Field
Key
area
Numeric 8
zoneName Text
totalarea
50
Numeric 8
No
No
No
No
No
No
This is repeating data, but storing it makes report
calculations much easier despite its deviance
from normal forms.
4592
4593
221
4594
4595
4596
Table: WaterSupplySystems
Description: Stores the name, info, and contact info for each water supply system, along
with the drainage where the supply system lives.
Field
Type Size Key Field Primary Key
Comments
SystemName
Text
PopulationServed
No
No
Water Supply System
Numeric 8
No
No
Number of People served
NumberConnections Numeric 4
No
No
Number of connections
ContactName
Text
20
No
No
Water Supply Contact
ContactAddr
Text
30
No
No
Water Supply Address
ContactCityStateZip Text
30
No
No
City State Zip
ContactPhone
Text
13
No
No
Phone number
Drainage
Text
75
No
No
Drainage Name
recordnumber
Numeric 4
No
No
Record number
LocallyModified
Boolean 1
No
No
Locally modified or created.
4597
4598
4599
4600
50
Table: WaterUse-Agricultural
Description: Stores the water use for agricultural purposes, by month and by drainage.
Field
Type Size Key Field Primary Key
Comments
AgUse
Numeric 8
No
No
Agricultural Use
month
Numeric 4
No
No
Month of year
recordnumber
Numeric 4
No
No
Record number
LocallyModified Boolean 1
No
No
Locally modified or created.
Drainage
No
No
Drainage Name
4601
4602
4603
4604
4605
Text
75
Table: WaterUse-DomesticMunicipal
Description: Stores the water use for domestic and municipal purposes, by month and by
drainage.
Field
Type Size Key Field Primary Key
Comments
DomMun
Numeric 8
No
No
Domestic Municapal Use
month
Numeric 4
No
No
Month of year
recordnumber
Numeric 4
No
No
Record Number
LocallyModified Boolean 1
No
No
Locally modified or created.
Drainage
No
No
Drainage Name
4606
4607
222
Text
75
4608
4609
Table: WaterUse-Evapotranspiration
Description: Stores the water loss to evapotranspiration, by month and by drainage.
Field
Type Size Key Field Primary Key
Comments
Evap
Numeric 8
No
No
Evapotranspiration
month
Numeric 4
No
No
Month of year
recordnumber
Numeric 4
No
No
Record Number
LocallyModified
Boolean 1
No
No
Locally modified or created.
Drainage
Text
No
No
Drainage Name
4610
4611
4612
4613
Table: WaterUse-Industrial
Description: Stores the water use for industrial purposes, by month and by drainage.
Field
Type Size Key Field Primary Key
Comments
IndUse
Numeric 8
No
No
Industrial Use
month
Numeric 4
No
No
Month of year
recordnumber
Numeric 4
No
No
Record Number
LocallyModified
Boolean 1
No
No
Locally modified or created.
Drainage
Text
No
No
Drainage Name
4614
4615
4616
4617
4618
4619
4620
4621
75
75
Table: WaterUse-Precipitation
Description: Stores the water gain from precipitation, by month and by drainage.
Field
Type Size Key Field Primary Key
Comments
Precip
Numeric 8
No
No
Precipitation
month
Numeric 4
No
No
Month of year
recordnumber
Numeric 4
No
No
Record Number
LocallyModified
Boolean 1
No
No
Locally modified or created.
Drainage
Text
No
No
Drainage Name
75
Table: WellsbyDrainage
Description: Contains a count of wells and a well-related comment for each drainage.
Field
Type Size Key Field Primary Key
Comments
DrainName
Text
255 No
No
Drainage Name
WellsComment
Text
100 No
No
Well-related comment
NumWells
Numeric 4
No
No
Number of wells in drainage
recordnumber
Numeric 4
No
No
Record Number
LocallyModified
Boolean 1
No
No
Locally modified or created.
223
4622
4623
4624
Table: ZoningAbbreviations
Description: Stores the zoning abbreviations used in the Zoning shapefiles; abbreviation
is the shorthand notation, and fullname is the full name to be printed in the report.
Field
Type Size Key Field Primary Key
Comments
Abbreviation
Text
50
No
No
Zoning Abbreviation
FullName
Text
50
No
No
Zoning Description
RecordNumber
Numeric 4
Yes
Yes
Record Number
LocallyModified
Boolean 1
No
No
Locally modified or created.
4625
4626
4627
4628
4629
Table: zwatbalcfs
Description: Legacy summary water balance data (cfs). Not used by the existing
watershed characterization program.
Key
Primary
Field
Type Size
Comments
Field
Key
AREA
Float
8
No
No
Area
PERIMTER
Float
8
No
No
Perimeter
BSNSWRIA1_
Float
8
Yes
No
WRIA unique ID
POLY_
Float
8
No
No
GIS ID
SUBCLASS
Text
255 No
No
SUBCLASS_
Float
8
No
No
RINGS_OK
Float
8
No
No
GIS topology check
RINGS_NOK
Float
8
No
No
GIS topology check
DRAIN3_
Float
8
No
No
DRAIN3_ID
Float
8
No
No
NAME
Text
255 No
No
DRAINAGE
Float
8
No
No
WSHED
Float
8
No
No
SUBWSHED
Float
8
No
No
REGION
Text
255 No
No
SUBBASIN
Text
255 No
No
GROUP_NAME Text
255 No
No
ACRES
Float
8
No
No
DRAINS_TO
Text
255 No
No
DRAIN_TYPE
Text
255 No
No
JAN_NCU
Float
8
No
No
FEB_NCU
Float
8
No
No
224
Area expressed as Acres
MAR_NCU
Float
8
No
No
ARP_NCU
Float
8
No
No
MAY_NCU
Float
8
No
No
JUN_NCU
Float
8
No
No
JUL_NCU
Float
8
No
No
AUG_NCU
Float
8
No
No
SEP_NCU
Float
8
No
No
OCT_NCU
Float
8
No
No
NOV_NCU
Float
8
No
No
DEC_NCU
Float
8
No
No
TOT_NCU
Float
8
No
No
ET_JAN
Float
8
No
No
Evapotranspiration January
ET_FEB
Float
8
No
No
Evapotranspiration February
ET_MAR
Float
8
No
No
Evapotranspiration March
ET_APR
Float
8
No
No
Evapotranspiration April
ET_MAY
Float
8
No
No
Evapotranspiration May
ET_JUNE
Float
8
No
No
Evapotranspiration June
ET_JULY
Float
8
No
No
Evapotranspiration July
ET_AUG
Float
8
No
No
Evapotranspiration August
ET_SEPT
Float
8
No
No
Evapotranspiration September
ET_OCT
Float
8
No
No
Evapotranspiration October
ET_NOV
Float
8
No
No
Evapotranspiration November
ET_DEC
Float
8
No
No
Evapotranspiration December
ET_ANN
Float
8
No
No
Annual Evapotranspiration
JANQN
Float
8
No
No
January
FEBQN
Float
8
No
No
February
MARQN
Float
8
No
No
March
APRQN
Float
8
No
No
April
MAYQN
Float
8
No
No
May
JUNQN
Float
8
No
No
June
JULQN
Float
8
No
No
July
AUGQN
Float
8
No
No
August
SEPQN
Float
8
No
No
September
OCTQN
Float
8
No
No
October
NOVQN
Float
8
No
No
November
225
DECQN
Float
8
No
No
December
ANNQN
Float
8
No
No
Annual
STDERR
Float
8
No
No
Standard Error
JANQNCFS
Float
8
No
No
January
FEBQNCFS
Float
8
No
No
February
MARQNCFS
Float
8
No
No
March
APRQNCFS
Float
8
No
No
April
MAYQNCFS
Float
8
No
No
May
JUNQNCFS
Float
8
No
No
June
JULQNCFS
Float
8
No
No
July
AUGQNCFS
Float
8
No
No
August
SEPQNCFS
Float
8
No
No
September
OCTQNCFS
Float
8
No
No
October
NOVQNCFS
Float
8
No
No
November
DECQNCFS
Float
8
No
No
December
ANNQNCFS
Float
8
No
No
Annual
JANQP
Float
8
No
No
January
FEBQP
Float
8
No
No
February
MARQP
Float
8
No
No
March
APRQP
Float
8
No
No
April
MAYQP
Float
8
No
No
May
JUNQP
Float
8
No
No
June
JULQP
Float
8
No
No
July
AUGQP
Float
8
No
No
August
SEPQP
Float
8
No
No
September
OCTQP
Float
8
No
No
October
NOVQP
Float
8
No
No
November
DECQP
Float
8
No
No
December
ANNQP
Float
8
No
No
Annual
JANQPCFS
Float
8
No
No
January
FEBQPCFS
Float
8
No
No
February
MARQPCFS
Float
8
No
No
March
APRQPCFS
Float
8
No
No
April
MAYQPCFS
Float
8
No
No
May
JUNQPCFS
Float
8
No
No
June
226
JULQPCFS
Float
8
No
No
July
AUGQPCFS
Float
8
No
No
August
SEPQPCFS
Float
8
No
No
September
OCTQPCFS
Float
8
No
No
October
NOVQPCFS
Float
8
No
No
November
DECQPCFS
Float
8
No
No
December
ANNQPCFS
Float
8
No
No
Annual
PCP_JAN
Float
8
No
No
January
PCP_FEB
Float
8
No
No
February
PCP_MAR
Float
8
No
No
March
PCP_APR
Float
8
No
No
April
PCP_MAY
Float
8
No
No
May
PCP_JUN
Float
8
No
No
June
PCP_JUL
Float
8
No
No
July
PCP_AUG
Float
8
No
No
August
PCP_SEP
Float
8
No
No
September
PCP_OCT
Float
8
No
No
October
PCP_NOV
Float
8
No
No
November
PCP_DEC
Float
8
No
No
December
PCP_ANN
Float
8
No
No
Annual
JANWBERR
Float
8
No
No
January Water Balance Error
FEBWBERR
Float
8
No
No
February Water Balance Error
MARWBERR
Float
8
No
No
March Water Balance Error
APRWBERR
Float
8
No
No
April Water Balance Error
MAYWBERR
Float
8
No
No
May Water Balance Error
JUNWBERR
Float
8
No
No
June Water Balance Error
JULWBERR
Float
8
No
No
July Water Balance Error
AUGWBERR
Float
8
No
No
August Water Balance Error
SEPWBERR
Float
8
No
No
September Water Balance Error
OCTWBERR
Float
8
No
No
October Water Balance Error
NOVWBERR
Float
8
No
No
November Water Balance Error
DECWBERR
Float
8
No
No
December Water Balance Error
WBERR
Float
8
No
No
Water Balance Error
WBERRPERC
Float
8
No
No
Water Balance Error (pct)
SWTOT
Float
8
No
No
Surface Water Total
227
GWTOT
Float
8
No
No
Groundwater Total
SWRES
Float
8
No
No
Surface Water Residential
GWRES
Float
8
No
No
Ground Water Residential
Float
8
No
No
Surface Water Commercial
Industrial
GWCI
Float
8
No
No
Groundwater Commercial Industrial
SWAG
Float
8
No
No
Surface Water Agriculture
GWAG
Float
8
No
No
Groundwater Agriculture
SWPWS
Float
8
No
No
GWPWS
Float
8
No
No
JANQDEFCFS Float
8
No
No
January
FEBQDEFCFS Float
8
No
No
February
MARQDEFCFS Float
8
No
No
March
APRQDEFCFS Float
8
No
No
April
MAYQDEFCFS Float
8
No
No
May
JUNQDEFCFS Float
8
No
No
June
JULQDEFCFS
Float
8
No
No
July
AUGQDCFS
Float
8
No
No
August
SEPQDEFCFS
Float
8
No
No
September
OCTQDEFCFS Float
8
No
No
October
NOVQDEFCFS Float
8
No
No
November
DECQDEFCFS Float
8
No
No
December
ANNQDEFCFS Float
8
No
No
Annual
LocallyModified Boolean 1
No
No
Locally modified or created.
SWCI
4630
4631
4632
4633
Table: Parameter_Code Descriptions
Description: Describes type of sample, e.g. temperature, fecal coliform, etc.
Field
Type Size Key Field Primary Key
Comments
Parameter_Code
Numeric
No
No
Parameter_Name
Text
255 No
No
Class
Text
50
No
No
Common_Name
Text
50
No
No
LocallyModified
Boolean 1
No
No
4634
4635
228
Locally modified or created.
4636
4637
4638
Table: QAQC_Code Descriptions
Description: Quality Assurance/Quality Check Methods used to collect data, by QAQC
code. [Not used by WRIA Report Generator.]
Field
Type Size Key Field Primary Key
Comments
QAQC_Code
Text
50
No
No
Description
Text
150 No
No
LocallyModified
Boolean 1
4639
4640
4641
4642
4643
No
No
Locally modified or created.
Table: Source_Database Descriptions
Description: Full data source descriptions for each source database. [Not used by WRIA
Report Generator.]
Field
Type Size Key Field Primary Key
Comments
Source_Database
Text
50
No
No
Description
Text
255 No
No
Source_Contact
Text
50
No
No
LocallyModified
Boolean 1
No
No
4644
4645
4646
4647
4648
Locally modified or created.
Table: Stations
Description: Station information, e.g. location, lat, long, subbasin, etc. for each station
number.
Field
Type Size Key Field Primary Key
Comments
Station
Text
50
Yes
Yes
Shapefile
Numeric
No
No
USU_Subbasin
Text
50
No
No
Station_Name
Text
100 No
No
Location
Text
200 No
No
State
Text
50
No
No
County
Text
50
No
No
Latitude
Numeric
No
No
Longitude
Numeric
No
No
UTMX
Numeric
No
No
UTMY
Numeric
No
No
River_Mile
Numeric
No
No
Station_Type
Text
75
No
No
NHDID
Text
50
No
No
Wb_Name
Text
50
No
No
229
WRIA1_Shed
Text
LocallyModified
Boolean 1
4649
4650
4651
4652
4653
4654
4655
4656
4657
4658
4659
4660
4661
4662
4663
4664
4665
4666
4667
4668
4669
4670
4671
4672
4673
4674
4675
50
No
No
No
No
Locally modified or created.
Table: WQData
Description: Actual Water Quality sampling data. Contains values sampled, with
Parameter_Code as most useful field to look up what the value sampled is. Comments,
QAQC, Data, Source all look up to appropriate tables.
Field
Type
Size Key Field Primary Key
Comments
Station
Text
255 Yes
No
Agency_Code
Text
255 No
No
Date
Date/Time
No
No
Depth
Numeric
No
No
Parameter_Code
Numeric
Yes
No
Value
Numeric
No
No
Comment_Code
Text
255 No
No
QAQC_Code
Text
255 No
No
Data_Code
Text
255 No
No
Source_Database Text
255 No
No
LocallyModified
1
No
Boolean
No
Locally modified or created.
2. GIS Data Needs
MapWindow must be running with the WRIA-1 DSS project loaded. Inside this project,
layers must have tags associated with them (through the project file). The names of the
tags that need to be included in the project are defined in the database tables LayerDataDataTags and LayerData-MapTags.
The layers whose tags are listed in LayerData-MapTags are used only for producing
maps, and do not have data extracted from them. These layers may be added and
removed freely, as long as the LayerData-MapTags table is kept in sync with what’s in
the project file.
The layers whose tags are listed in LayerData-DataTags are those layers from which data
will be extracted. The report needs to be able to find a layer for each of these data items;
there must be a layer for each of these. The tag which corresponds to each of these is
defined in the LayerData-DataTags table. Please see this table for a definitive list; a
partial list is given below.
230
4676
4677
4678
4679
4680
4681
4682
4683
4684
4685
4686
4687
4688
4689
4690
4691
4692
4693
4694
4695
4696
4697
4698
4699
4700
4701
4702
4703
4704
4705
4706
4707
4708
4709
4710
4711
4712
4713
4714
4715
4716
4717
4718
4719
4720
4721
Required data layers and fields used from each:
1. Watershed (Shapefile)
a. DRAIN_NAME – Name of drainage.
2. Zoning Data (Shapefile)
a. WCPLAN – Zone Type, e.g. City, Rural, etc.
3. Streamflow Gages (Shapefile)
a. SITEID – Sampling Site ID
b. STR_NAME – Stream Name
4. Land Cover Data (Grid - Grid Value Used)
5. Main Roads (Shapefile - No Fields Used, but must be present)
6. Water Quality Stations
a. STATION – Station ID Number
b. STATION_NA – Station Name
7. Cities (Shapefile – No Fields Used, but must be present)
8. Railroads (Shapefile – No Fields Used, but must be present)
9. 303(d) Water Bodies (Shapefile)
a. WTRBDY_NR – Waterbody Number
10. 303(d) Listed Streams (Shapefile)
a. WTRCRS_NR – Watercourse Number
11. 303(d) Listed Grids (Shapefile)
a. WGRD_CL_NR – Watergrid Cell Number
12. Counties (No Fields Used, but must be present)
3. Dependencies
The Watershed Characterization plug-in requires the following software components and
modules to be installed:
Software:
MapWindow 3.1
Visual Studio .NET 2003 Complete Install
--Be sure to select Crystal Reports.Net for installation---Crystal Reports 9.0 may be used instead.-GigaSoft ProEssentials 3.0 Charting Components
Microsoft SQL Server 2000 (optional)
--This will provide administration tools which make management of the
databases much easier.-InstallShield Express 3.5 with Service Pack 4
Components:
Microsoft Common Controls 6.0
Microsoft Common Controls-2 6.0
Microsoft Common Controls-3 6.0
Microsoft FlexGrid Control 6.0
Fish Periodicity Lifestage Plotter Control (USU)
Microsoft SQL-DMO Data Object
231
4722
4723
4724
4725
4726
4727
4728
4729
4730
4731
4732
4733
4734
4735
4736
4737
4738
4739
4740
4. Setup
Setup
The LaunchPad utility, also referred to as the DBMS utility, may be used to prepare a
computer to run the Watershed Characterization report. This tool is described in the
DBMS Technical Documentation.
The report generator also requires that the WRIA-1 DSS project file is loaded in
MapWindow. Details on this project file are given under section 3 above.
To launch the report generator, click the Graph icon on the toolbar. If the database is
accessible and configured properly, the Launch Report screen will appear where you may
specify report options and begin generation.
If the database could not be found or was not configured, a window will appear asking
for the location of the database. This could be a Microsoft SQL Server, MSDE, or access
databases. The database needs are as follows:
Database Description
Report Generator
database, as described
above
Stream Flow database, as
described above
Water Quality database,
as described above
4741
4742
4743
4744
4745
4746
4747
4748
4749
4750
4751
4752
4753
4754
4755
4756
4757
SQL Server DB Name
WRIAReportGenerator
Access Name
(databases may share physical files,
e.g. FlowDataWaterQuality.mdb)
<may be any .mdb file>
FlowData
<may be any .mdb file>
WaterQuality
<may be any .mdb file>
Customizations
Customizations may be made to the report itself very easily; most text sections may be
edited via the DBMS utility. Those tables which are not exposed through the DBMS may
be edited via Microsoft SQL Server Enterprise Manager (a tool included with SQL
Server 2000), or via any ODBC-compatible data access utility.
Adding a report section can be done in Visual Studio by following these instructions:
a. Create a new blank report. Save it with the desired filename. This filename
will be used as the “reportSwappedFor” string below.
b. If the section has a map, place the “reportSwappedFor” string in the
NoDataValidation routine inside DataGeneration.vb to ensure that a map
image is always placed in the table at runtime.
c. Ensure that the sectionLink number is unique. This number is also used for the
section headings. Place a line for this unique number in the DataSources table
232
4758
4759
4760
4761
4762
4763
4764
4765
4766
4767
4768
4769
4770
4771
4772
4773
4774
4775
4776
4777
4778
4779
4780
4781
4782
4783
4784
4785
4786
4787
4788
4789
4790
4791
4792
4793
4794
4795
4796
4797
4798
d.
e.
f.
g.
with the section heading and name. The naming convention is that any
number less than 100 is a subsection heading, and anything 100 or over is a
main heading.
Place the sectionLink number in the SectionVisibility table along with the
report section numbers that this report portion will use. Failure to do this will
result in the section never appearing.
Place any data items in the report. DO NOT use visual linking; any selection
formulas must be put by hand in the selection formula editor or selection
formula assistant. If the report has a map, select from the data tables based on
reportSwappedFor.
Open rpt_FullReport.rpt, and insert a new section where desired. Insert the
new report here.
Add code to the DataGeneration.vb and/or ReportMain.vb source files to
create a new map if necessary, and to generate or prepare any data needed.
Similary, removing a report section permanently can be done in Visual Studio by doing
the reverse of the instructions above:
a. Make note of the sectionLink number(s) in the report. Delete the report.
b. Remove this subreport from rpt_FullReport.rpt.
c. Delete any code from DataGeneration.vb and/or ReportMain.vb that was used
to prepare maps and data for this report.
d. Remove the records from SectionVisibility and DataSources where the
sectionLink is equal to the number noted in step 1.
5. Building
Compiling the Watershed Characterization Report Generator is a fairly straightforward
task. After ensuring that all of the required components discussed in item 3 above are
present, load the project into Visual Studio and click the Build icon, or select Build from
the menu. There are two projects which are a part of this solution. First, the Watershed
Characterization MapWindow Plugin is the component loaded into MapWindow which
generates all needed data. At the end of the report generation sequence, the plugin will
then automatically start ReportViewer.exe, which is the second project in the solution.
The report viewer will continue the process, loading crystal reports and preparing the
final report. The Crystal Reports portion of the report must be done in a separate
executable, because Crystal Reports will not load properly if it’s loaded in the same
process image as MapWindow, for unknown reasons. The solution needs to include the
following files:
mwWatershedChar project:
Purpose
File Name
AssemblyInfo.vb
Contains information relating to the DLL assembly.
Generated by VB.NET.
233
Camera.ico
Camera icon representing snapshots.
Datageneration.vb
Datapuzzle.avi
Contains data generation routines and routines to aggregate
data from multiple locations. Also contains calls to generate
Streamflow charts and fish periodicity charts.
Contains generation routines for Streamflow box charts.
Mostly copied from StreamFlow Analyst, but modified
slightly to fit in this plug-in.
Contains a class to keep track of data layers within maps by
tag or by layer handle.
File puzzle animation used on the progress meter screen.
Drip16.bmp
Drip icon for stream sampling locations on maps.
Emptylegend.bmp
An empty (white) bitmap, properly sized to be inserted in
place of a legend should a spacer be needed.
Flask icon used for water quality sampling sites on maps.
Screen with database connection information, used to specify
the location of the SQL or Access databases being used.
Displays a progress meter and animation, along with a brief
text description of what’s happening.
Displays the list of aggregations and allows the user to
specify options for the report. The report is launched from
here.
dataGenerationStreamFlowBoxPlots.vb
DataLayerManager.vb
Flask16.bmp
frmConfiguration.vb
frmDataGenProgress.vb
frmLauncher.vb
frmMapGen.vb
frmPeriodicityPlotter.vb
frmReportGraphGenerator.vb
frmSectionVisibility.vb
Globals.vb
Graph.ico
ImageConverter.vb
LabelClass.vb
Main.vb
Nodata-*.bmp
North_arrow2.gif
234
Contains a MapWinGIS Map control. The maps for the
reports are generated on this map using this class.
Contains a Fish Periodicity Plotter control; this is used by the
dataGeneration class to produce images.
Contains Gigasoft graphing components.
Allows the user to change which report sections are going to
be included in the report.
This module holds some commonly used functions such as
ComputeSimpleArea.
This is the graph icon used on the toolbar.
Performs conversions between old-style IPictureDispatch
objects and newer system.drawing.bitmap objects.
This class is used to place labels on the maps as they are
generated. This was originally copied form MapWindow, but
has been extensively modified.
Contains the implementation of the MapWindow Interface.
Also contains shared data elements and shared functions.
These files contain empty images, with the text “No data
available”. These are inserted into the report when data is
unavailable, so that the report sees data and can link
everything together.
This is the north arrow placed on the corner of maps.
ReportMain.vb
This contains all of the preparation the reports themselves.
Maps are generated in this module as well.
Copied from MapWindow, this module contains conversion
routines and factors (ie, inch to millimeter, etc). This also
contains routines to generate accurate scale bars.
ScaleBarUtils.vb
4799
4800
4801
ReportViewer.exe Project:
frmReportView.vb
rpt_FullReport.rpt
rpt_Shellfish-NoData.rpt
rpt_TOCGenerator.rpt
Rpt_*
4802
4803
4804
4805
4806
4807
4808
4809
4810
4811
4812
4813
4814
4815
4816
4817
4818
4819
4820
4821
4822
4823
4824
Contains a CrystalReportViewer object, used to examine the
report if it’s generated to screen rather than to a file.
This contains page numbering formulas, report header
information, and ties together all of the other reports (by pulling
them in as subreports). Sections are hidden and made visible
automatically from this report.
This report is shown in place of rpt_Shellfish-1 and rpt_Shellfish2 when no shoreline is present in the selected drainages.
This report summarizes all Table of Contents related data gathered
during the first report execution. This data is written in a manner
that may be easily parsed, so it may be read by the generator
before the final execution.
Any rpt_*.rpt file not described above contains data used in the
report. Section contents are described in the DataSources and
SectionVisibility database tables.
The Watershed Characterization installer has been created with Microsoft Visual Studio,
and it creates a “merge module”, which is a single-file module which can then be inserted
into other installations easily. This is the “mwWatershedChar” subdirectory in the
Watershed Characterization installer directory.
To update the components in this merge module, copy the newly built
mwWatershedChar.dll and related files into the Source directory in the Watershed
Characterization installer directory. Open the mwWatershedChar Visual Studio project
and rebuild the installer. Next, copy the merge module from the Release folder into
“c:\Program Files\InstallShield\Express\Objects”.
Another installation, this one created with InstallShield Express, is also located in the
Watershed Characterization installer directory. This is a “wrapper” around the merge
module described above; it installs no new files, only that merge module. To rebuild this,
open the WatershedChar.ise file and click the “Build” button or select “Build” from the
menu. When the process has completed, the new installer will be in the WatershedChar
subdirectory.
This installer may then be burned onto a CD, copied to a ZIP disk, or otherwise
distributed.
235
4825
Technical Documentation: Well Log Data Viewer
4826
4827
Last Revision: 06/15/06
Table of Contents
4828
4829
4830
4831
4832
4833
4834
4835
4836
4837
4838
4839
4840
4841
4842
4843
4844
4845
4846
4847
4848
4849
1. Table Design For Database Store Well Logs
¾ Table Descriptions and Notes
¾ Schema, Keys, Indexes and Structure
¾ Table Relationship Diagrams
2. Data Needs
¾ Type/Location of Data
¾ Tags on Layers
3. Dependencies
¾ Software
¾ Modules and Components
¾ Integrated Development Environment (IDE)
4. Setup
¾ Setup
5. Code Compiling
236
4850
4851
4852
4853
4854
4855
4856
4857
4858
4859
4860
4861
4862
1. Table Design for Database Stored Well Logs
Following is a list of tables that must be included with the Well Log Viewer Database.
Other tables and information may exist, but these tables must follow the described
naming conventions, spelling and cases, and types for each table and its parameters. This
database is only necessary if you are using/associating Database Stored Well Logs.
Table: Material_Codes
Description: Contains the ID, Name, and an Order for each of the valid Materials. It is
important that it contains the complete set of valid Materials allowed for displaying the
Well Logs because this table is linked to as a Lookup field from the Well_Material_Data
table.
Key
Primary
Field
Type
Size
Comments
Field Key
CodeMaterial Numeric
Material
order
4863
4864
4865
4866
4867
4868
4869
4870
Text
Text
Long
Yes
Integer
50
50
No
No
Yes
A unique ID for each Well Material. It
does not need to be in a strict numerical
order. No Duplicates may be used.
For Example: 1, 2, 3, … , 20, etc.
No
The name of the Material. This value is
what is viewed in the Legend of the
Viewer.
No
An alphabetic value that is used to
indicate an ordering for selecting or
viewing the valid Materials. For Example:
a, b ,c,…, y, z ,etc.
Table: Material_Colors
Description: Contains the associated material code, an RGB-value, and a description for
each color. This table needs to have a 1:1 correlation with the Material_Codes table so
that there is an assigned color for each valid material. These colors are used to display
the Database Stored Well Logs in the Well Log Data Viewer.
Primary
Comments
Field
Type
Size Key Field
Key
CodeMaterial
Yes
Long
Numeric
(No
No
Integer
Duplicates)
A unique ID for each Well Material.
It
corresponds
with
the
CodeMaterial
Field
in
the
Material_Codes table. There needs
to be one entry in this table for
every entry in the Material_Codes
table (a 1:1 correlation).
237
RGB_Value
Text
Color_Description Text
4871
4872
4873
4874
4875
4876
4877
4878
4879
4880
50
50
No
No
No
This is the RGB value (stored as
R,G,B) for the color for the
associated material. Each R,G, and
B value ranges from 0 – 255.
For Example: RGB_Value = 0,0,0
No
This is the name of the color, or
some other description of what
color is represented by the value in
the RGB_Value Field.
For Example: Color_Description =
Black
Table: Well_Material_Data
Description: Contains the WellID, three associated material codes, a depth from, and a
depth to value for each soil section in the Well Log. A soil section is defined as a
grouping of soil with the same materials. Each soil section in the sampled Well Log
needs to have a unique entry in this Table. The second and/or third material code can be
left empty if there is not a value attributed for them. The first material code must have a
value for all entries. Each material code is picked from the list available that is populated
by the values in the Material_Codes table.
Primary
Field
Type
Size
Key Field
Comments
Key
WellID
Numeric
Yes
Long
(Duplicates No
Integer
OK)
A unique ID for each Well. This value
is displayed for the user to select which
Well Logs(s) to view.
It also
corresponds with the values for the
Well_ID field in the associated point
shapefile.
Material1
Number
Yes
Long
(Duplicates No
Integer
OK)
This is the main soil type, or the soil
type with the highest concentration, that
is found in the current soil section.
This field is of type Number and
corresponds to the CodeMaterial field
values from the Material_Codes table.
This is a lookup field. The user will see
the material descriptions, not the actual
material codes when selecting/inputting
values into this field if it is set up
correctly. See below for a definition of
the Lookup Values.
Material2
Number
Yes
Long
(Duplicates No
Integer
OK)
This is the soil type with the second
highest concentration of all of the
materials in the current soil section.
238
This field is just like Material1. It is of
type Number and corresponds to the
CodeMaterial field values from the
Material_Codes table. If there is not a
valid value for this field, it may be left
empty. This is a lookup field. The user
will see the material descriptions, not
the actual material codes when
selecting/inputting values into this field
if it is set up correctly. See below for a
definition of the Lookup Values.
Material3
Number
Yes
Long
(Duplicates No
Integer
OK)
MaterialFrom Number Double No
MaterialTo
Number Double No
This is the soil type with the third
highest concentration of all of the
materials in the current soil section.
This field is just like Material1 and
Material 2. It is of type Number, and
corresponds to the CodeMaterial field
values from the Material_Codes table.
If there is not a valid value for this
field, it may be left empty. This is a
lookup field. The user will see the
material descriptions, not the actual
material codes when selecting/inputting
values into this field, if it is set up
correctly. See below for a definition of
the Lookup Values.
No
This value is the starting depth of the
This value
current soil section.
signifies the beginning depth. This
value is stored in Feet (ft).
For Example: If you were entering the
first soil section for your WellID,
MaterialFrom = 0.
No
This value is the ending depth of the
current soil section.
This value
signifies the ending depth. This value
stored in Feet (ft).
For Example:
If the current soil
section started at 50ft and was 34ft
deep, MaterialTo = 84.
4881
4882
239
Material_Colors
Material_Codes
CodeMaterial
Material
order
CodeMaterial
RGB_Value
Color_Description
Well_Material_Data
WellID
Material1
Material2
Material3
DepthFrom
DepthTo
4883
4884
240
4885
4886
4887
4888
4889
4890
4891
4892
4893
4894
4895
4896
4897
4898
4899
4900
4901
4902
4903
4904
4905
4906
4907
4908
4909
4910
4911
4912
4913
4914
4915
4916
4917
4918
4919
4920
4921
4922
4923
4924
4925
4926
4927
4928
4929
2. Data Needs
Scanned Well Log Images
There are two types of data needed for the Scanned Well Log Images: a point shapefile,
and a Folder Location.
• Point Shapefile – this needs to be in the same projection as the other shapefiles in
your project. It contains the point locations of where each of the nodes are
located. This file will have a tag that will be associated with it by the plug-in:
“WellLogViewer-Scan”. There are two fields that need to be found in this
shapefile: WELL_LOG_I, and LOG_IMG_NM.
• Folder Location – this is the location of all of the scanned Well Log images that
will be viewed using the Well Log Data Viewer.
The layer corresponding with the point shapefile stated above is marked with the tag
“WellLogViewer-Scan”. If the user removes the layer associated with this tag without
first closing the Well Log Data Viewer plug-in, then the settings for the Scanned Data
will be reset, and if the Project is then saved, then the settings for the Scanned Data in the
project file will also be over-written.
As stated above, the shapefile requires two fields to be found in the data table. Below are
the exact field names, field types, and description of the data that gets entered into these
fields.
Required data layer fields:
a. WELL_LOG_I – Integer – The Well ID for the Well at this location.
b. LOG_IMG_NM – String – The filename for the Scanned Well Log
image that goes with this Well.
Database Data
There are three types of data needed for the Database Data: a point shapefile, a database
type, and a database.
• Point Shapefile – this needs to be in the same projection as the other shapefiles in
your project. It contains the point locations of where each of the Well Logs were
sampled. This file will have a tag that will be associated with it by the plug-in:
“WellLogViewer-DB”. There is one field that needs to be found in this shapefile:
WELL_ID.
• Database Type – this is the type of database that you are connecting to. IE:
Access, SQL Server.
• Database – this is the database of Well Log data and needs to be organized as
described in Section 1. Table Design For Database Stored Well Logs.
The layer corresponding with the point shapefile stated above is marked with the tag
“WellLogViewer-DB”. If the user removes the layer associated with this tag without first
closing the Well Log Data Viewer plug-in, then the settings for the Database Data will be
reset, and if the Project is then saved, then the settings for the Database Data in the
project file will also be over-written.
241
4930
4931
4932
4933
4934
4935
4936
4937
4938
4939
4940
4941
As stated above, the shapefile requires one field to be found in the data table. Below are
the exact field name, field type, description of the data that gets entered into this field,
and how it is associated with the database.
Required data layer field:
a. WELL_ID – Integer – The Well ID for the Well at this location. It
corresponds with the WellID field in the database. Each value that is
found in this field (in the shapefile) also needs to be found in the
database.
3. Dependencies
4942
4943
4944
4945
4946
4947
4948
4949
4950
4951
4952
4953
4954
4955
4956
4957
4958
4959
4960
4961
4962
4963
4964
4965
4966
4967
4968
4969
4970
4971
4972
4973
The Well Log Data Viewer plug-in requires the following software components and
modules to be installed:
Software:
Gigasoft’s ProEssentials Graphing Tools Version 3
MapWindow 3.1
Visual Studio .NET 2002
Modules and Components:
Graph Component from ProEssentials (pegoa control).
MapWindow Interfaces
MapWinGIS Map Control
Scientific Graph Component from ProEssentials (pesgoa control).
Integrated Development Environment (IDE)
Visual Studio .NET 2002
4. Setup
To begin using the Well Log Data Viewer, it must first be loaded into MapWindow.
Once it is loaded, select one of your data layers from the Legend. If you only have one
type of data associated, select the data layer that goes with this data. Now, click the Well
icon, , on the MapWindow toolbar. If the data associations (as described in Section 2:
Data Needs) have been properly set, then the Well Viewer will appear for the selected
type of data, and will be fully functional.
If the data associations have not been set, then a Connection Form will appear allowing
you to set the shapefile, database, and photo location folder. Then, after the data
associations have been formed, select the appropriate data layer (as described above), and
when the toolbar button is clicked, the viewer will show for the selected type of data, and
can be used.
242
4974
4975
4976
4977
4978
4979
4980
4981
4982
4983
See the User’s Manual for more information and details on associating the data with the
Well Log Data Viewer.
5. Code Compiling
Compiling the Well Log Data Viewer is a fairly straightforward task. After ensuring that
all of the required components discussed in Section 3: Dependencies are present, load the
project into Visual Studio .Net 2002. This Plug-in was created using Visual Basic (VB).
The project needs to include the following files:
Purpose
File Name
AssemblyInfo.vb
Contains information relating to the DLL assembly. Generated by
VB.NET.
clsMainMWI.vb
Contains a class that implements the MapWindow plugin
interface.
Contains a class to access global functions for Folder Functions,
Database Functions, and Other Functions.
Displays the Connection form for the SQL database type. This
form is only displayed when adding Database Data and
connecting to an SQL database. It allows the user to set the
Server Address, User information, and Database Name.
Displays the Connection form that allows the user to associate the
data with the Well Log Data Viewer plug-in. There are two areas
on this form, one for each type of data that can be associated:
Scanned Data, and Database Data.
Displays the form to select the associated point shapefile with the
Photo Viewer plug-in. It allows the user to either select a
shapefile already loaded into Map Window, or to select one from
disk.
Displays the Well Log Data Viewer form for the selected type of
data. You select the type of data to view by selecting the
appropriate data layer in the MapWindow Legend.
This module holds the definition of data Structs used throughout
the Well Log Data Viewer.
This module holds the variables used throughout the forms, such
as the form declaration variables, MapWindow variables, and
others.
Contains a class that implements functions that allows you to
convert images to and from an IPictureDisp object. This is
needed so that the VBCompatibility.dll does not need to be
referenced. This class allows the Well Logs – Database
image, , or the Well Logs – Scanned image, , to be associated
with the points on the associated shapefile(s).
FolderUtils.vb
frmConfiguration.vb,
frmConfiguration.resx
frmDBConnection.vb,
frmDBConnection.resx
frmSelectLayer.vb,
frmSelectLayer.resx
frmWellViewer.vb,
frmWellViewer.resx
globalStructs.vb
globalVariables.vb
ImageConverter.vb
243
PluginInfo.vb
Well.ico
WellLog2.bmp
WellLog2.ico
WellReport2.bmp
WellReport2.ico
4984
4985
4986
4987
4988
4989
4990
4991
4992
4993
4994
4995
4996
4997
4998
4999
5000
5001
5002
5003
5004
5005
5006
5007
5008
5009
Contains a class that has functions used to open and save Project
File settings for the Well Log Data Viewer plugin.
Well Log icon that is used in the MapWindow Toolbar and on all
of the forms.
NOTE: this file needs to be an embedded resource
Bitmap version of the WellLog2.ico. It is used as a custom image
for the point shapefile associated with the Database Data.
NOTE: this file needs to be an embedded resource
It is used as the MapWindow Legend picture when using a
custom image for the point shapefile associated with the Database
Data.
NOTE: this file needs to be an embedded resource
Bitmap version of the WellReport2.ico. It is used as a custom
image for the point shapefile associated with the Scanned Data.
NOTE: this file needs to be an embedded resource
It is used as the MapWindow Legend picture when using a
custom image for the point shapefile associated with the Scanned
Data.
NOTE: this file needs to be an embedded resource
Now that the files and resources are there and the project is loaded into Microsoft Visual
Studio .NET 2002, please double check a couple of settings. These settings are all related
to the references associated with the project (see Section 3: Dependencies ).
Reference Settings:
AxPEGOALib
CopyLocal = True
AxPESGOALib
CopyLocal = True
MapWinGIS
CopyLocal = False
MapWinInterfaces
CopyLocal = False
PEGOALib
CopyLocal = True
PESGOALib
CopyLocal = True
stdole
CopyLocal = False
System
CopyLocal = False
System.Data
CopyLocal = False
System.Design
CopyLocal = False
System.Drawing
CopyLocal = False
System.Windows.Forms
CopyLocal = False
System.XML
CopyLocal = False
Now that these settings have been set correctly, click the Build icon, or select Build from
the menu. The mwWellViewer.dll has now been created with Microsoft Visual Studio
.NET 2002. It is created in the mwWellViewer subdirectory in the /Plugins folder. Next
time that MapWindow is run, if the mwWellViewer.dll was built to the correct folder, the
updated changes to the Well Log Data Viewer will be available.
244
5010
5011
5012
5013
5014
5015
5016
5017
5018
5019
5020
5021
5022
5023
5024
5025
5026
5027
5028
5029
5030
5031
Technical Documentation:
Course Resolution Water Quality Model
Last Revision: Dec 28, 2007
Table of Contents
1. Table Designs
¾ Table Descriptions and Notes
¾ Table Relationship Diagrams
2. Dependencies
¾ Software
¾ Module and Components
¾ Integrated Development Environment (IDE)
3. Setup
¾ Setup
¾ Customizations
4. Building
¾ Code Compiling
¾ Installations
245
5032
5033
5034
5035
5036
5037
5038
5039
5040
5041
5042
5043
5044
5045
5046
5047
5048
5049
1. Table Designs
Land Cover Database: LandCoverSummary.mdb
(See “Technical Documentation For Land Cover Summarizer” for table designs)
Best Management Practices Database: BestManagementPractices.mdb
(See “Technical Documentation For Best Management Practices Tool” for table designs)
WRIA-Wide Water Quality Parameters Database: WRIA-WideWQParameters.mdb
Table: Catchments
Field Name
CatchmentID
Data Type
Long Integer
DrainageID
Long Integer
Description
The catchment id associated with the catchmentdrainage pair
The WRIA 1 Drainage ID associated with the
catchment-drainage pair
Table: EMCs
Field Name
DrainageID
Land_Cover_Code
EMC_TN
Data Type
Long Integer
Long Integer
Text
EMC_NH3
EMC_N03
EMC_TP
EMC_FC
EMC_BOD
Text
Text
Text
Text
Text
Description
WRIA 1 Drainage ID
The associated land cover class id
Expected mean concentration (EMC) for total
nitrogen (mg/L)
EMC for ammonia (mg/L)
EMC for nitrate (mg/L)
EMC for total phosphorus (mg/L)
EMC for fecal coliform (mg/L)
EMC for BOD (mg/L)
Table: Input Air Temperatures
Field Name
Date
AvgTemperature
Data Type
Date / Time
Double
AirTempFlag
Text
5050
5051
246
Description
The date the temperature data was recorded
Average daily temperature at Abbotsford Canada in
degrees C
Flag for average daily air temperatures from
Abbotsford data
5052
Table: Parameters
Field Name
DrainageID
DrainageName
DOPercentSat
Data Type
Long Integer
Text
Double
AirWaterSlope
Double
AirWaterInt
Double
QbTemp
Cb_TN
Double
Double
Cb_NH3
Cb_NO3
Cb_TP
Double
Double
Double
Cb_BOD
Cb_FC
Double
Double
Description
WRIA 1 Drainage ID
Name of the WRIA 1 Drainage
DO Percent Saturation Parameter (Calibration
Parameter)
Slope of Air Temperature Surface Soil
Temperature Relationship (Calibration
Parameter)
Intercept of Air Temperature Surface Soil
Temperature Relationship (Calibration
Parameter)
Simulation Base Flow Temperature Deg. C
Base Flow Total Nitrogen Concentration
(mg/L)
Base Flow Ammonia Concentration (mg/L)
Base Flow Nitrate Concentration (mg/L)
Base Flow Total Phosphorus Concentration
(mg/L)
Base Flow BOD Concentration (mg/L)
Base Flow Fecal Coliform Bacteria
Concentration (#/100 mL)
5053
5054
5055
5056
5057
5058
5059
5060
5061
5062
5063
5064
5065
5066
5067
5068
5069
5070
5071
5072
2. Dependencies
The Course Resolution Water Quality Model requires the following software to be installed:
Software:
MapWindow 3.1
DSS Model Manager
Integrated Development Environment (IDE):
Visual Studio .NET 2003 Complete Install
The Course Resolution Water Quality Model requires the data output by the following DSS
elements:
Land Cover Summary Tool
Best Management Practices Tool
3. Setup
The WRIA-1_DSS Installation installs the Course Resolution Water Quality Model in the
MapWindow Plugins folder.
(This is usually located at C:\Program Files\MapWindow\Plugins\ModelManager\Elements”).
247
5073
5074
5075
5076
5077
5078
4. Building
To compile the Best Management Practices Tool, add the files below to a Microsoft Visual
Studio .NET 2003 Visual Basic .NET Library Project.
mwCourseResolutionWQModel project files:
File Name
AssemblyInfo.vb
clsWRIAWideWQModel.vb
DBClient.vb
DirectoryPicker.vb
frmConfiguration.vb
frmInputs.vb
frmSelectModelDirectory.vb
frmSelectScenario.vb
WRIAWideWaterQualityModel.vb
5079
5080
5081
5082
5083
5084
5085
5086
5087
5088
5089
5090
5091
5092
Purpose
Contains information relating to the DLL
assembly. Generated by VB.NET.
Runs the course resolution water quality model
given the settings provided.
Contains the routines used to connect to a
database.
Custom component which allows a user to
select a directory from the computer’s file
system.
Contains the routines used to select a database.
Allows the user to select the location of input
and output data for the model.
A form containing a DirectoryPicker
component which allows the user to select a
directory from the file system, or a directory to
be created by the Water Quantity Model in the
current DSS Scenario Run.
Allows the user to select a DSS Scenario Run
Id from a list of previously run DSS Scenarios.
Implements MapWindow Plugin and DSS
Interface routines, allowing the Course
Resolution Model to act as a MapWindow
Plugin and a DSS element.
Add the following references to the project:
DssIntfcLib.dll
MapWinInterfaces.dll
mwBestManagementPractice.dll
System.dll
System.Data.dll
System.Drawing.dll
System.Windows.Forms.dll
System.Xml.dll
You are now ready to compile the project by clicking the Build Solution menu option under the
menu Build.
248
5093
5094
WRIA-wide Coarse Waterbody Response Model (WWCM) project files
File Name
rqn.f95
rqn.bat
Purpose
WRIA-wide Coarse Waterbody Response
Model Fortran 95 source file
Fortran compiler script for creating
WWCM executable – executable is r.exe
lf95 rqn.f95 src\apifunctions.obj
-exe "r.exe" -ml lf95
"wqlibs_c.imp"
apifunctions.f95
am.bat
See below
qsetup_n.f95
setscn_n.f95
nrmodules.f95
reachstructures.f95
condensedll.f95
stringfunctions.f95
datesubmod.f95
utils.f95
wqlibs_c.dll
cnd.exe
cnodestots.f95
cnd.bat
Library of file management routines
through Windows API
Conversion of LWWLM output to binary
format for Fortran model use
Fortran compiler script for creating
WWCM executable
Manager of model execution for a single
time step
Scenario setup routine – executed for each
time step
set of numerical routines
coordinates watershed structure definition
set of string manipulation routines
set of date substitution routines
set of miscellaneous file access routines
Dynamic link library holding all of the
above routines
Converts NodeResultsvwxyz.txt files to
NodeTSzzz.txt
Source code for cnd.exe
Fortran compiler script for creating cnd.exe
lf95 cnodestots.f95
src\apifunctions.obj
src\nrmodules.obj
src\reachstructures.obj
src\utils.obj src\datesubmod.obj
-exe cnd.exe
5095
5096
5097
5098
5099
The rp.exe file is built using the Lahey Professional Fortran compiler version 5.6. It has no
additional dependencies.
249
5100
5101
5102
5103
5104
5105
5106
5107
5108
5109
5110
5111
5112
5113
5114
5115
5116
5117
5118
5119
5120
5121
5122
5123
5124
5125
5126
5127
5128
5129
5130
5131
5132
5133
5134
5135
5136
5137
5138
5139
5140
5141
5142
5143
5144
5145
5146
5147
5148
5149
5150
5151
5152
5153
5154
5155
5156
5157
5158
5159
5160
The Course Resolution Water Quality Model is installed in all versions of the WRIA-1 DSS
installation.
Automake.fig – Lahey compiler script for WWCM
NOQUITONERROR
DEBUG
FILES=.\src\apifunctions.f95
COMPILE=@lf95 %fi -C -O1 -LST -DLL -W -g -trace -nvsw -ml lf95 -ml bc -O %SD%SF%OE MOD %mo -TPP
OBJDIR=.\src\
OBJEXT=obj
MODULE=.\src
AND
FILES=.\src\utils.f95
COMPILE=@lf95 %fi -C -o1 -LST -DLL -W -g -trace -ml lf95 -nvsw -O %SD%SF%OE -MOD %mo
-TPP
OBJDIR=.\src\
OBJEXT=obj
MODULE=.\src
AND
FILES=.\src\setscn_n.f95
COMPILE=@lf95 %fi -C -o1 -LST -DLL -W -g -trace -ml lf95 -nvsw -O %SD%SF%OE -MOD %mo
-TPP
OBJDIR=.\src\
OBJEXT=obj
MODULE=.\src
AND
FILES=.\src\qsetup_n.f95
COMPILE=@lf95 %fi -C -o1 -LST -DLL -W -g -trace -ml lf95 -nvsw -O %SD%SF%OE -MOD %mo
-TPP
OBJDIR=.\src\
OBJEXT=obj
MODULE=.\src
AND
FILES=.\src\nrmodules.f95
COMPILE=@lf95 %fi -C -o1 -LST -DLL -W -g -trace -ml lf95 -nvsw -O %SD%SF%OE -MOD %mo
OBJDIR=.\src\
OBJEXT=obj
MODULE=.\src
AND
FILES=.\src\reachstructures.f95
COMPILE=@lf95 %fi -C -o1 -LST -DLL -W -g -trace -ml lf95 -nvsw -O %SD%SF%OE -MOD %mo
-TPP
OBJDIR=.\src\
OBJEXT=obj
MODULE=.\src
AND
250
5161
5162
5163
5164
5165
5166
5167
5168
5169
5170
5171
5172
5173
5174
5175
5176
5177
5178
5179
5180
5181
5182
5183
5184
5185
5186
5187
5188
5189
5190
5191
5192
5193
5194
5195
5196
5197
5198
5199
5200
5201
5202
5203
5204
5205
5206
5207
5208
5209
5210
5211
5212
5213
5214
FILES=.\src\condensedll.f95
COMPILE=@lf95 %fi -C -o1 -LST -DLL -W -g -trace -ml lf95 -nvsw -O %SD%SF%OE -MOD %mo
-TPP
OBJDIR=.\src\
OBJEXT=obj
MODULE=.\src
AND
FILES=.\src\StringFunctions.f95
COMPILE=@lf95 %fi -C -o1 -LST -DLL -W -g -trace -ml lf95 -nvsw -O %SD%SF%OE -MOD %mo
-TPP
OBJDIR=.\src\
OBJEXT=obj
MODULE=.\src
AND
FILES=.\src\DateSubMod.f95
COMPILE=@lf95 %fi -C -o1 -LST -DLL -W -g -trace -ml lf95 -nvsw -O %SD%SF%OE -MOD %mo
-TPP
OBJDIR=.\src\
OBJEXT=obj
MODULE=.\src
LINK=@lf95 @\nooksackmodel\wqlink_c5n.rsp -lst -o1 -exe %ex
Qual2EU_lf95.imp
TARGET=c:\NooksackModel\WQLibs_c.dll
-nvsw -dll -ml lf95
251