1
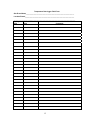
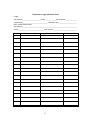
Field Manual
Okanogan Monitoring and Evaluation Program
WATER QUALITY SAMPLING PROTOCOLS
November 23, 2005
Prepared by
The Colville Confederated Tribes
John Arterburn
Keith Kistler
Michael Rayton
TABLE OF CONTENTS
Introduction......................................................................................3
Methods............................................................................................3
Temperature Data loggers.................................................... 4
Water Quality Sampling Parameters................................... 6
Nutrient Sampling............................................................... 9
Data Management............................................................... 10
QA/QC........................................................................................... 10
Literature Cited............................................................................. 12
Appendix A....................................................................................14
Appendix B....................................................................................16
2
INTRODUCTION
This Field Manual was developed by the Colville Confederated Tribes’ Okanogan Basin
Monitoring and Evaluation Program (OBMEP) to provide specific guidance for
evaluating and monitoring water quality in the Okanogan subbasin. OBMEP is a long
term, status and trend monitoring program that is subject to future modification,
therefore, this Field Manual should be considered to be a "living document" with the
following protocol potentially subject to some level of change over time as new
information becomes available.
The protocols contained within this Manual are a conglomeration of methods employed
by the Colville Confederated Tribes, the United States Geological Survey (USGS) and
the Washington State Department of Ecology (WSDOE) water monitoring program.
The Colville Confederated Tribes will be collecting data at established EMAP sites and
selected USGS and WDOE gauging stations throughout the Okanogan Basin. We will
also be compiling data collected by the USGS, the WSDOE and Environment Canada.
METHODS
Water Quality information will be collected at all EMAP sites located on tributary
streams of the Okanogan River as identified in the CCT physical habitat protocol.
Selected locations on the Okanogan and Similkameen Rivers will also be surveyed.
Temperature will be monitored with Onset® temperature data loggers in the tributaries
and downloaded from USGS and WDOE gauging stations from the mainstem sites.
Water quality variables will be collected with a Eureka Manta® water quality probe and
recorded in the field on a Eureka Amphibian® field recorder. Samples will be collected
up to three times a month at annual and rotating panel sites.
A schedule will be created by the fisheries biologist and a water quality technician for the
contract year. Each site will be described in detail including: the most efficient access to
the site, the GPS location that the sample will be taken and the method needed to access
the site.
A temperature logger metadata sheet for recording pertinent location information and
logger settings is provided in Appendix A.
3
I. Temperature Data loggers
We will be using Onset®, optical stowaway temperature data loggers. Each data logger
will need to be activated in the office using Boxcar Pro software. (See Boxcar Pro
software®)
Data logger calibration
Ensure the data logger has a fresh battery.
Connect the logger to your computer and set it to begin storing data according to the
manufacturer’s instructions. Be sure to set the measurement interval to one minute, set
the measurement units to degrees C, set the start time and date to the day you are
launching and to the nearest hour you are at time of launching. Be sure the clocks in the
computer, in the logger, and on the clock used for instantaneous measurements are
consistent.
It is most efficient to calibrate a number of loggers at the same time. Prepare two water
baths in a temperature controlled environment, the first containing ice water in a large
cooler or other covered and insulated container. The second bath should be held at room
temperature. Verify that each bath is of uniform temperature; mixing may be required.
Place the launched loggers in one of the baths for approximately 15 minutes, or long
enough to equilibrate to the temperature of the bath.
After the equilibration period, measure and record instantaneous water bath temperatures
as close to the time the logger is recording a measurement value as possible. Use a
laboratory thermometer certified accurate at a minimum of every 10 C by the National
Institute of Standards and Technology (NIST) for the instantaneous measurements.
Concurrently, record date and time of each quality assurance measurement. Once the
instantaneous water bath temperature measurements have been recorded, place the
loggers in the second bath and repeat the process. An example of a logger calibration
form is provided in Appendix B.
Once the logger has been exposed to the range of temperatures anticipated in the field
and the measurements recorded, remove the loggers from the water bath, then download
and display the data. Compare the logger data to the instantaneous thermometer data.
Loggers are acceptable for deployment only if their accuracy is within ± 0.7C of the
instantaneous measurements.
New loggers that exceed the 0.7C tolerance limit should be returned to the manufacturer
for adjustment or replacement.
4
Launching & Deployment
Once the data logger has been calibrated it is ready for field deployment. Open Boxcar
Pro from the desktop of the computer. Plug the logger into the optic base station. Click
logger on the toolbar and then click launch. Name the logger using the following
convention: stream name, the site number and the year to be sampled (i.e.
Bonaparte_366_2006). Set the interval to one hour sampling. Do not use the one minute
time interval as described in the data logger calibration section described above. Click
delayed launch, click on the calendar and choose today, the day you are launching and
then choose 1700 as the hour to begin recording. Once this has been completed for all
the data loggers to launch that day, you can head to the field for deployment.
Deployment in tributary streams of the Okanogan River will be put at the center point (X
point) of the EMAP site. Each data logger will be placed in the thalweg of the stream, or
in an area of the stream where there is adequate, year round flow and water coverage.
Where possible, use a duckbill® anchor pounded into the thalweg of the stream with a
hammer and applicator. The anchor will be inserted as far as possible into the stream
bed, or up to eighteen inches. If the duckbill anchor cannot be driven at least six inches
into the streambed, find an alternate location within the thalweg to drive the anchor. If a
suitable anchor point cannot be established in the thalweg, place the into the stream bank
in line with the center point.
The temperature probe will be held and protected by an aluminum sleeve, connected to
the anchor with 1/8’ steel cable. The cable will be long enough to retrieve the
temperature monitor in high flow conditions if necessary. Keep in mind that each site
presents a unique set of circumstances that will be needed to be assessed and dealt with in
the field.
Data loggers will be deployed at all annual and panel tributary sites using the water year
of October to October for analysis, rather than the standard calendar year. Annual sites
will be monitored continuously throughout the study. Data will be downloaded in the
field using an optic shuttle every October and the data logger then left in the field to
begin collecting data for the next year. Panel site data loggers will be deployed in the
October prior to habitat sampling, then retrieved the following October for download and
redeployment to the next panel site.
Onset© suggests the battery in each logger be replaced after 60 months (5 years) of
continuous deployment. The loggers will need to be monitored for battery power, and
when appropriate, returned to Onset© for new batteries.
In addition to this temperature data, the Colville Tribes will compile temperature data
collected by the Washington State Department of Ecology (WSDOE), the United States
Geological Survey (USGS) and the Okanogan Conservation District (OCD) from
tributary streams in the Okanogan basin. For the Similkameen and mainstem Okanogan
5
Rivers we will compile data collected by the USGS and WSDOE for that contract year
and any historical data available.
II. Water Quality Sampling Parameters
Streamside measurements will be made using a Eureka® Manta Multiprobe and recorded
on a Eureka® Amphibian Field Data Recorder. Measured parameters include:
conductivity, dissolved oxygen (DO), pH, turbidity and temperature.
Conductivity
Specific conductance (or conductivity) is a measure of the water’s ability to pass an
electrical current. This ability is dependant upon the presence of ions, their total
concentration, mobility, valence and on the ambient temperature. Solutions of most
inorganic compounds are relatively good conductors while solutions of organic
compounds that do not easily dissociate in water conduct electricity very poorly.
Conductance, G, is defined as the reciprocal of resistance, R: G=1/R. Most conductivity
meters do not display the actual solution conductance, G, or resistance, R; rather, they
generally have a dial that permits the user to adjust the internal cell constant to match the
conductivity, Ks, of a standard. Once the cell constant has been determined, or set, the
conductivity of an unknown solution will be displayed by the meter. Ku= CGu.
Most problems in obtaining good data with conductivity monitoring equipment can be
attributed to fouled electrodes and improper sampling technique. Make sure the
equipment is serviced regularly and that the sample is well circulated while obtaining a
measurement.
Dissolved Oxygen
In natural waters, oxygen is essential for the survival of most aquatic organisms.
Measures of DO are used to assess water quality and the potential for healthy aerobic
organism populations. Dissolved oxygen levels depend on the physical, chemical and
biochemical activity in the water body.
A dissolved oxygen (DO) reading is a measurement of oxygen dissolved in an aqueous
solution. Oxygen concentration levels vary in response to changes in atmospheric
pressure and water temperature. The higher the atmospheric pressure, the higher the
oxygen solubility in water and the higher the DO concentration. The opposite is true with
temperature, the higher the temperature the lower the solubility and saturation
concentration of oxygen in water. DO is one of the major factors determining the type of
biological communities inhabiting aquatic systems. The addition of organic or inorganic
material creates a biological oxygen demand (BOD) through respiration and
6
biodegradation of biological organisms. Waterbodies with a high BOD have lower DO
concentrations. This process can facilitate the growth of nuisance organisms and change
ecosystem structure and function.
We will be employing the membrane electrode method as defined in Clesceri, Greenberg
and Eaton, 1998. The sensing element of a membrane-covered electrode system is
protected from impurities by an oxygen-permeable plastic membrane. The membrane
electrodes are completely submersible, portable, easy to operate and maintain. Because
membrane electrodes offer the advantage of analysis in situ, they eliminate errors caused
by sample handling and storage. Membrane electrodes provide an excellent method for
DO analysis (Clesceri et al.)
pH
pH is defined as the negative logarithm of the hydrogen ion concentration. pH values
range from 0, which is highly acidic, to 14, which is highly alkaline. A measurement of 7
is considered neutral. Each pH unit represents a tenfold change in the hydrogen ion
concentration. Natural waters usually fall within a range of 4 to 9. pH levels slightly
higher than neutral are slightly basic and can be attributed to the presence of bicarbonates
and carbonates of the alkali and alkaline earth metals. Washington waters typically range
from 6.5 to 8.5.
Measurement of pH is one of the most important and frequently used tests in water
chemistry. The basic principle of electrometric pH measurement is determination of the
activity of the hydrogen ions by potentiometric measurement using a standard hydrogen
electrode and a reference electrode. The hydrogen electrode consists of a platinum
electrode across which hydrogen gas is bubbled at a pressure of 101 kPa. In our case we
will be using a glass electrode, which eliminates the potential for poisoning the hydrogen
electrode. The electromotive force (emf) produced in the glass electrode system varies
linearly with pH. This linear relationship is described by plotting the measured emf
against the pH of different buffers. A pH sample is determined by extrapolation. Make
sure the glass electrode is clean and relatively free from interference from color,
turbidity, colloidal matter, oxidants or reductants. pH measurements will be taken in
flowing areas of the stream. Use a thermometer to take a stream temperature reading as
pH will be reported with the corresponding temperature. The pH meter has a resolution
of .01 units which is beyond the recommended accuracy (Clesceri et al.)
Turbidity
Turbidity measures the ability of water to scatter or absorb light. Turbidity represents a
decrease in water clarity caused by suspended and colloidal matter in the water column.
Substances such as clay, slit, finely divided organic and inorganic matter, plankton and
other microscopic organisms can lead to increased turbidity. Turbidity increases with the
concentration of suspended matter in the water and the light refracting or light absorbing
characteristics of the suspended material.
7
Turbidity is an expression of the optical property that causes light to be scattered and
absorbed rather than transmitted with no change in direction or flux level through the
sample. Most commercial turbidimeters designed for measuring low turbidities give
comparatively good indications of the intensity of light scattered in one particular
direction. Turbidimeters with scattered light detectors located at 90 degrees to the
incident beam are called nephelometers. The Nephelometric method for turbidity
determination measures the amount of light scattered at an angle perpendicular to the
light source. This method compares the light scattering ability of a water sample to
known standards. The results are expressed in NTU (Nephelometric Turbidity Units).
Nephelometers are specified as the standard instrument for measurement of low
turbidities. Instrument variation may be negligible if good measurement techniques are
used and the characteristics of the particles in the measured suspensions are similar.
Turbidity can be determined for any water sample that is free of debris and rapidly
settling coarse sediment. The recommended sensitivity is to be able to detect differences
of .02 NTU or less in the lowest range in waters having a turbidity of less than 1 NTU.
The sensitivity of the instrument we use will record to four digits. To calibrate the
turbidity meter we will be following the manufacturer’s instructions.
Table 1: Manta Probe, parameters, range, accuracy and resolution
Parameter
Temperature
Dissolved Oxygen
Specific Conductance
pH
Turbidity
Range
-5°C – 50°C
0 – 50 mg/L
0 – 100 mS/cm
2 – 12 units
0 – 3000 NTU
Accuracy
±0.2°C
±0.2 mg/L ≤20 mg/L
±0.6 mg/L > 20 mg/L
±0.5% reading ± 1 count
±0.2 units
<1% reading to 400 NTU
< 3% reading over 400 NTU
Resolution
0.01°C
0.01 mg/L
4 digits
0.01 units
4 digits
The Eureka Manta Probe
Before leaving the office, check to see that you have the Manta probe and the Amphibian
data logger. Plug the probe into the data logger and make sure that the internal battery in
the Amphibian is charged enough to collect data from the Manta. Drive to the established
EMAP and gauging station sites. Take your time and be careful when attaching the
weighted cup to the probe as not to break any of the sensors. Place the probe in the water
from the bank at the X-site (center point) of the EMAP sites, or at the gauging station
sites to be sampled. Find a suitable location nearby if the water is not flowing at the X
site. Exercise caution to not stir up stream sediment!! If, when walking into the stream or
on the bank sediment is stirred up, wait until the sediment settles before proceeding.
Attach the Manta to the Amphibian; open the Eureka program on the Amphibian, wait for
the Amphibian to acknowledge that the probe is attached and then press the (log) icon at
the bottom of the screen. Go to locations and create a new file with the established file
name and number corresponding to the appropriate site. Allow the probe to take readings
8
until each parameter value is changing very little. Verify that the readings are within the
acceptable parameters set by previous data readings for that particular site (unless there is
a noticeable explanation for a highly variable reading). Press the camera icon at the
bottom of the screen to take a snapshot of the readings. Disconnect the probe from the
data logger and move on to your next site. Upon returning to the office, plug the
Amphibian into the recharger to recharge the internal batteries.
Procedures for downloading data collected in the field to a PC
Download data from the Amphibian to a personal computer every day. Using Eureka PC
(Eureka program on your PC), start the Transfer Utility by selecting the Transfer tool bar
button or Transfer (File Menu). You may also start Transfer by selecting the Start Menu
button from your Windows task bar and selecting Programs, Eureka and Transfer.
Disconnect the probe from the Amphibian and attach the cable between your Amphibian
and desktop PC. The Transfer Utility will automatically connect to the Amphibian. Once
connected, the location folder structure contained on the Amphibian will be displayed. By
default, the contents of \My Flash Disk\Eureka folder will be displayed.
The same folder structure created on the Amphibian will be created on the desktop PC in
the data files folder selected during installation. (By default a folder named Eureka is
placed on your desktop during the initial installation.) Use the Overwrite Destination
buttons to select the action when site and location names already exist on your desktop
system. Select prompt to be prompted before overwriting data files, Always to overwrite
existing files or Never to skip transferring existing files. Select If changed to only transfer
files that have changed since last transfer. (File sizes are compared to determine if a file
has changed.)
Location data files can be automatically removed from the Amphibian after they have
been transferred to the desktop PC. If you wish to delete files after they are moved, check
the ‘Remove from Mobile Device after successful transfer’ checkbox. Removing files
from the Mobile PC will free up memory space on the device. Use the VIEW LOG
button to view a detailed log of files transferred, deleted and any errors that may have
occurred. Use the SET DESTINATION button to change the default location where
transferred files will be stored on your desktop PC.
Check your data and make sure that it appears in the right destination folder.
III. Nutrient Sampling Methods and Laboratory Analyses
Depending on funding, grab samples from each tributary site will be collected and
analyzed once a month for total phosphorus (TP), dissolved phosphates (orthophosphate
or OP), nitrate/nitrite (N-N), total persulfate nitrogen (TPN), and ammonia (NH3).
Samples are collected in pre-cleaned containers, stored on ice, and delivered by courier to
the contracted laboratory within eight hours of collection. Any necessary preservatives
are added by laboratory personnel upon arrival at the lab. Grab samples are collected by
holding the container by the base, plunging the container mouth down below the surface
of the water, and turning the container into the current upstream of the sampler. The date
and time of sample collection and site name are recorded. Weather conditions and
9
multiprobe readings of temperature, pH, specific conductivity, turbidity and dissolved
oxygen at the time of sample collection are also recorded. A summary of laboratory
measurements, methods, and reporting limits is presented in the following table.
Table 2. Summary of laboratory measurements, methods, and reporting limits
applied to water quality samples collected by the District for the ISEMP study.
Parameter
Method
Lower Detection Limit
Total Phosphorous
SM 4500 P/E
0.02 mg/L
Dissolved Phosphates
SM 4500 P/E
0.02 mg/L
Nitrate/Nitrite
SM 4500NO3-E
0.01 mg/L
Total Persulfate
SM 4500N-D
0.025 mg/L
Nitrogen
Ammonia
SM 4500NH3-N
0.01 mg/L
IV. Data Management Procedures
Field technicians and project biologists store and manage data collected using Microsoft
Excel. Data is kept in both tabular and graphic formats. Water quality probe data is
downloaded after every field visit. It is subsequently reviewed and added to the main
data file for each site and each tributary once a month. Water temperature data are
downloaded every October and stored in BoxCar Pro and Excel format. Laboratory
analysis data is entered on a monthly basis. Periodically back-up data files on the
OBMEP server to prevent data loss.
QA/QC
Temperature data loggers must be calibrated before field deployment. At a minimum of
one site, two thermographs will be launched simultaneously. The thermographs will be
placed as close to each other as possible, making sure they are in similar stream habitat
types, at the same depth, and that they will receive similar sunlight influences.
In an effort to estimate field sampling precision, replicate water nutrient samples are
collected at a rate of ≥20% during each monthly sampling run.
Eureka Manta Probes will be cleaned once every week, the probe and sensors should be
washed with a soft brush and warm, soapy water as described in the Eureka® Manta
user’s manual. The conductivity, dissolved oxygen, pH and turbidity meters are checked
before going to the field with standardized solutions, once every three months or more
often if readings being recorded are not in their correct range. The quality control check
sample solutions will be purchased from eureka environmental engineering.
General Procedures For Calibration of Water Quality Probes
1) Clean and perform routine maintenance if necessary.
10
2) Rinse sensors thoroughly (more than once may be required) with DI (deionized) water
between calibrations. Shake the transmitter vigorously to remove traces of old calibration
solutions – repeat if necessary.
3) Select a calibration standard whose value is near the representative field sample. For
example, if your pH is generally alkaline, choose pH 7 and pH 10.
4) Rinse the sensors twice with a small quantity of your calibration standard. Discard and
do not reuse calibration standard.
5) Secure your Manta with the sensors pointing up, and fill the calibration cup as required
to perform the calibration.
6) For best results, use fresh calibration solutions, and discard once they have been used.
Temperature
The sensor is factory calibrated and does not require calibration.
Dissolved Oxygen (% Saturation Method)
If you have replaced the membrane, it is best to wait 24 hours before calibration.
1) Fill your calibration cup up to the level of the DO membrane with tap water, DI water,
a conductivity standard, or a pH standard. Contrary to other manufacturers, Eureka
allows you to use high salinity standards during an air calibration.
2) With a paper towel, make certain the membrane is dry and free of any water droplets.
3) Place the black rubber cal cup cover upside down over the calibration cup.
4) Wait approximately two minutes for the air to become fully saturated and the
temperature to equilibrate. Make sure your circulator is turned off. Follow the calibration
procedures on your Amphibian or on the desktop software.
5) DO % saturation also calibrates DO mg/L.
6) If you used pH buffer or Conductivity standard, add more to your cal cup and proceed
to that calibration.
pH Calibration
pH is a two or three point calibration. Choose your calibration buffers to bracket the
likely pH of your sample waters.
1) Rinse with a pH buffer, and then fill the calibration cup with enough buffer to cover
both the pH glass bulb and reference.
2) Follow the instructions on your Amphibian or PC to perform the calibration.
3) Discard the buffer, rinse with second buffer. Add second buffer to cover pH glass and
reference. Calibrate with second buffer.
4) Repeat steps 2 & 3 if you are performing a three point calibration.
Note – the order of pH buffers is not important, and using pH 7 buffer is not required.
Conductivity Calibration
This procedure calibrates specific conductance and salinity.
1) Fill the calibration cup to cover the conductivity sensor. Tap gently on the cup to make
sure there aren’t bubbles trapped in the conductivity sensor.
2) Follow the instructions on the Amphibian or Manta PC software to calibrate the
sensors.
11
Wipered Turbidity Calibration
Because a turbidity probe is inherently an optical device, care must be taken during
calibration to ensure that external effects are kept to a minimum. This is best
implemented by placing calibration solutions in dark, leak-proof bottles with a nonreflective finish such as Nalgene® 2106 bottles in amber. These are available with wide
necks and a nominal capacity of 1,000ml.
Another important factor is cleanliness. Any debris or water that makes its way into the
calibration solutions will affect its value and adversely affect the proper calibration of an
instrument. It is therefore a good practice to have an ample supply of distilled de-ionized
water and a means of properly drying the probe end (clean, compressed air is ideal).
Probes should be flushed in two containers of distilled water with thorough drying in
between and before insertion into a calibration solution. Commence calibration at a low
value (usually zero) and work up in value to further minimize the effects of cross
contamination.
Analite turbidity probes are best calibrated using a clear, copolymer, microbead solution
as they are stable and safe. Other solutions, such as formazin, may be used. These other
solutions are normally not as stable as the copolymer microbead solutions and may
contain carcinogens and therefore must be treated with caution.
Calibration Procedures
Hold the probe a few degrees from the vertical and gently tap it on the calibration cup so
as to dislodge any air bubble on the optic face. If the probe is properly placed the value
indicated will not vary if the probe is gently moved a few millimeters in any direction.
Calibration – 2 point
A two-point calibration is normally all that is needed when the anticipated results are
centered about a common value (e.g. 80NTU). Under these circumstances it is best to
calibrate the second point near or just above the anticipated readings. In the above
example 100NTU would be a good second calibration point.
LITERATURE CITED
Chelan County Conservation District. 2005. DRAFT WATER QUALITY
CHARACTERIZATION METHODS for INTEGRATED STATUS & EFFECTIVENESS
MONITORING PROGRAM PROJECT #2003-017-00.
Clesceri, L. S., A. E. Greenberg, and A. D. Eaton, editors. 1998. Standard Methods for
the Examination of Water and Wastewater, 20th Edition. American Public Health
Association, American Water Works Association, and Water Environment Federation.
Washington, D.C.
Eureka Environmental Engineering. 2003. Eureka Amphibian User’s Guide.
12
Eureka Environmental Engineering. 2003. Eureka Manta User’s Guide.
Lazorchak, James M., D. J. Klemm, and D. V. Peck. 1988. ENVIRONMENTAL
MONITORING AND ASSESSMENT PROGRAM SURFACE WATERS: FIELD
OPERATIONS AND METHODS FOR MEASURING THE ECOLOGICAL CONDITION
OF WADEABLE STREAMS. U.S. Environmental Protection Agency Ecosystems
Research Branch Ecological Exposure Research Division National Exposure Research
Laboratory Cincinnati, OH and Regional Ecology Branch Western Ecology Division
National Health and Environmental Effects Research Laboratory Corvallis, OR.
Ward, William J. 2001. Stream Sampling Protocols for the Environmental Monitoring
and Trends Section. Publication No. 01-03-036. Washington State Department of
Ecology Environmental Assessment Program.
Zaroban, Donald W. 2000. PROTOCOL FOR PLACEMENT AND RETRIEVAL OF
TEMPERATURE DATA LOGGERS IN IDAHO STREAMS. Idaho Division of
Environmental Quality State Technical Services Office.
13
APPENDIX A
Temperature Data Logger Metadata Sheet
14
Temperature Data logger Field Form
Site ID and Name___________________________________________________________
Location Placed____________________________________________________________
___________________________________________________________________________
Deployment Retrieval/Download
Date
Date
Comments
15
APPENDIX B
Temperature Logger Calibration Form
16
Temperature Logger Calibration Form
Logger:
manufacturer______________________ model______________serial number______________
conducted by_______________________________ calibration date_______________________
NIST certified thermometer:
manufacturer___________________________________________________________________
model________________________________serial number_____________________________
Time
Bath Temperature (C)
Logger Temperature (C)
17
Discrepancy (C)
18