1
Chapter 7 Special Applications
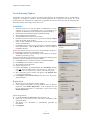
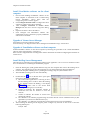
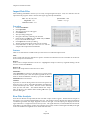
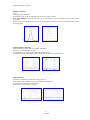
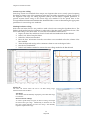
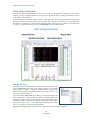
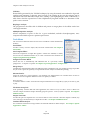
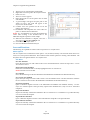
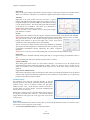
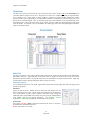
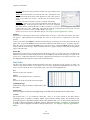
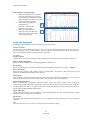
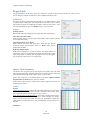
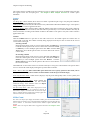
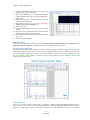
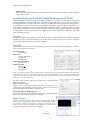
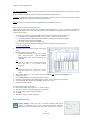
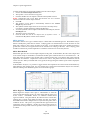
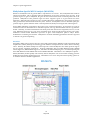
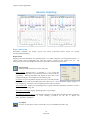
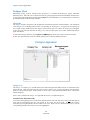
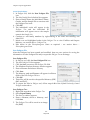
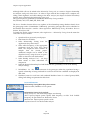
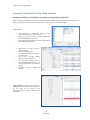
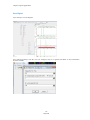
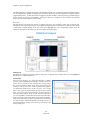
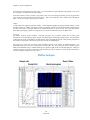
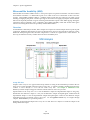
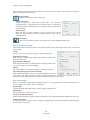
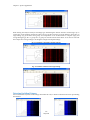
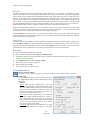
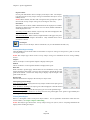
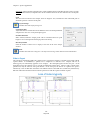
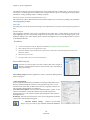
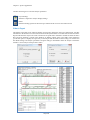
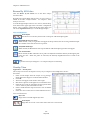
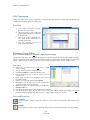
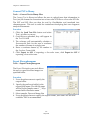
the Marker name and the individual’s electropherogram will appear in the Charts tab on the right. The suspect
Marker will appear red.
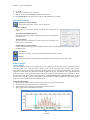
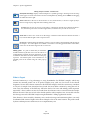
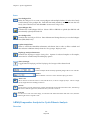
Show Inheritance Conflicts
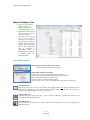
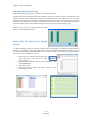
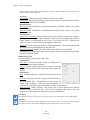
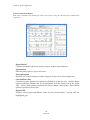
Samples List
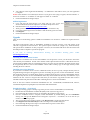
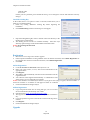
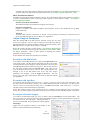
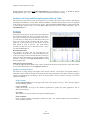
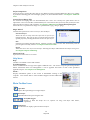
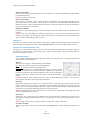
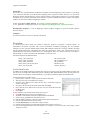
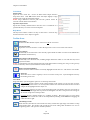
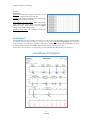
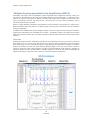
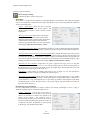
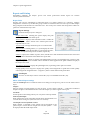
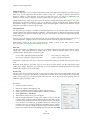
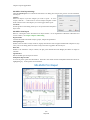
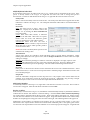
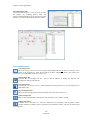
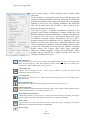
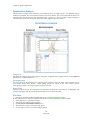
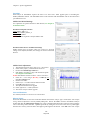
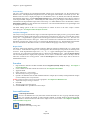
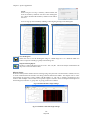
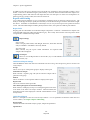
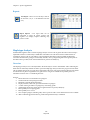
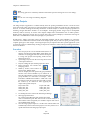
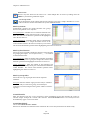
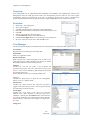
The Samples List displays the filename and individual ID for each sample in the current dataset. Drag and drop
samples from the Sample List to nodes in the Pedigree Tree to associate individuals with the family.
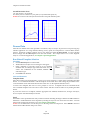
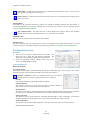
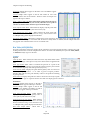
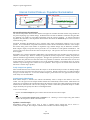
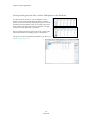
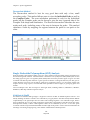
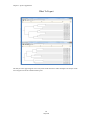
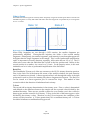
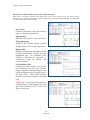
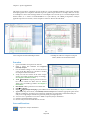
Electropherogram Charts
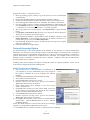
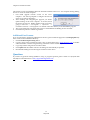
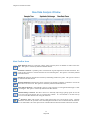
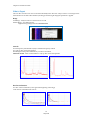
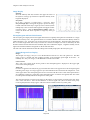
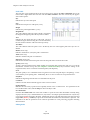
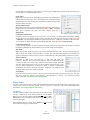
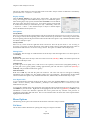
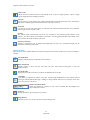
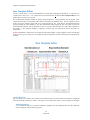
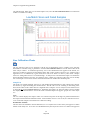
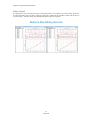
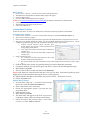
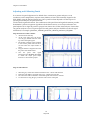
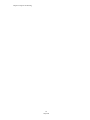
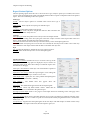
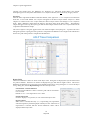
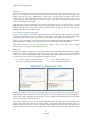
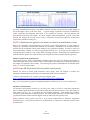
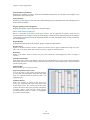
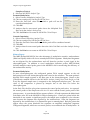
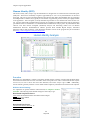
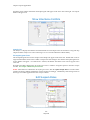
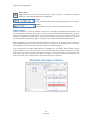
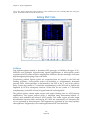
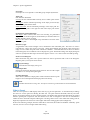
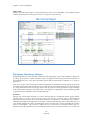
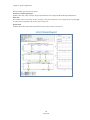
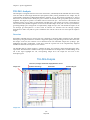
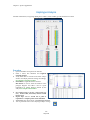
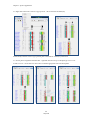
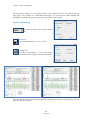
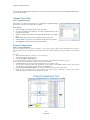
The electropherogram traces for the samples in the Sample List appear in the Charts tab. Double-click a node or
single-click the Marker name in the Conflict or Suspect list of the Pedigree Tree and the electropherogram trace
for the Marker will appear. If a Child node is selected, the Mother and Father traces will also appear in the
Charts tab.
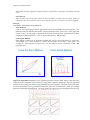
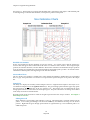
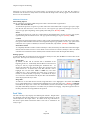
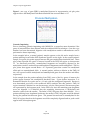
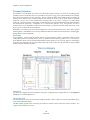
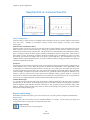
Navigation and allele editing in the Electropherogram Charts is similar to navigation options in the Main Analysis
window. See Chapter 3 Main Analysis Overview.
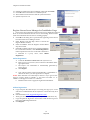
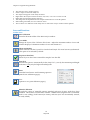
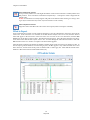
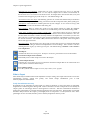
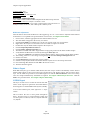
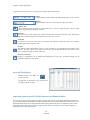
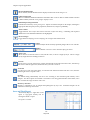
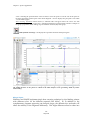
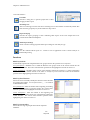
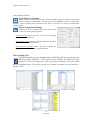
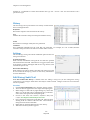
NOTE: After alleles are edited in the Electropherogram Charts, click the Update Sample Data icon in the toolbar.
Conflict and Suspect Marker identification will be adjusted accordingly. Additionally, allele changes made in
the Pedigree tool will be applied in the Main Analysis window.
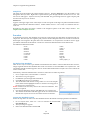
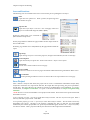
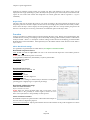
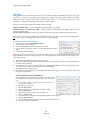
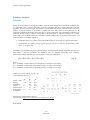
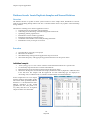
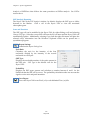
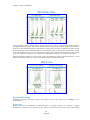
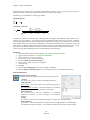
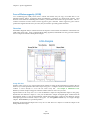
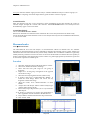
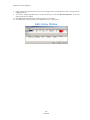
Edit Suspect Alleles
105
May 2012