1
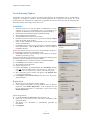
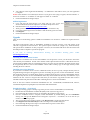
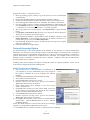
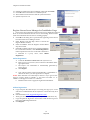
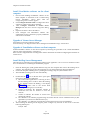
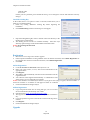
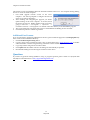
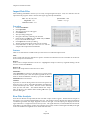
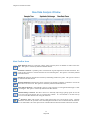
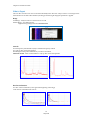
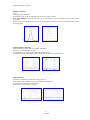
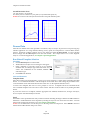
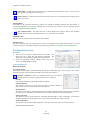
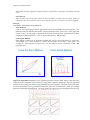
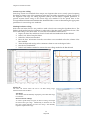
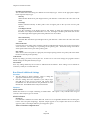
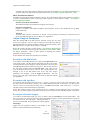
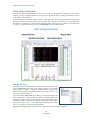
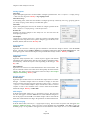
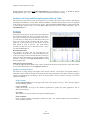
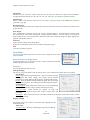
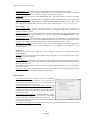
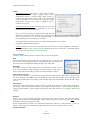
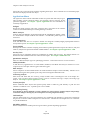
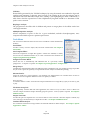
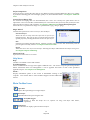
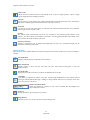
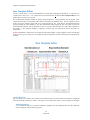
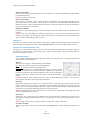
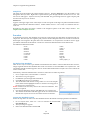
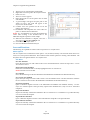
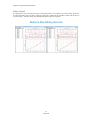
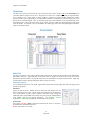
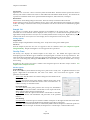
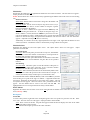
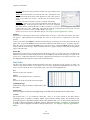
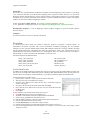
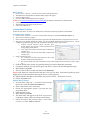
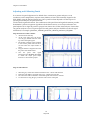
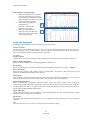
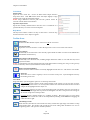
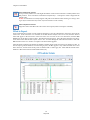
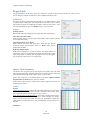
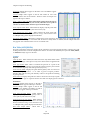
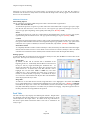
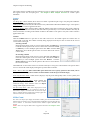
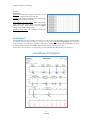
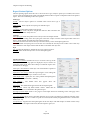
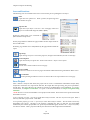
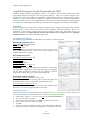
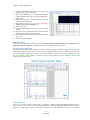
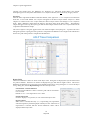
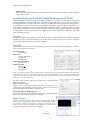
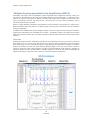
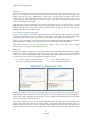
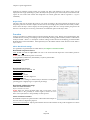
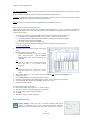
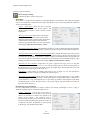
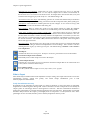
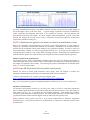
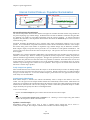
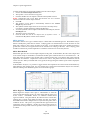
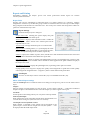
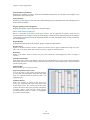
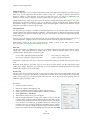
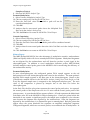
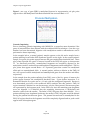
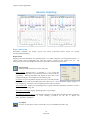
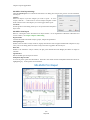
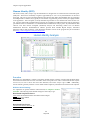
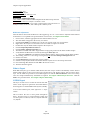
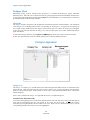
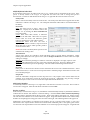
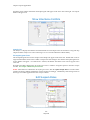
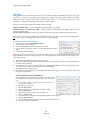
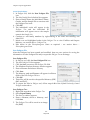
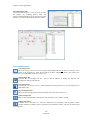
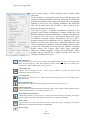
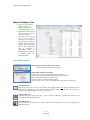
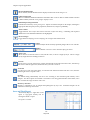
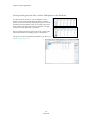
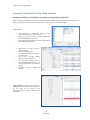
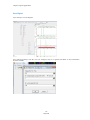
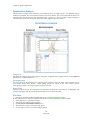
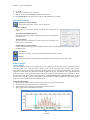
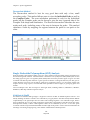
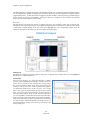
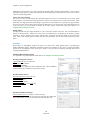
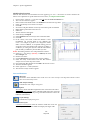
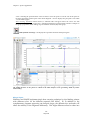
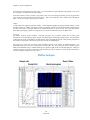
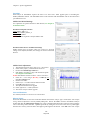
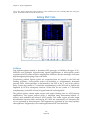
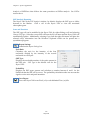
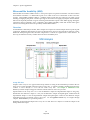
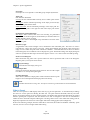
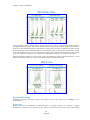
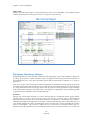
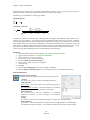
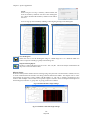
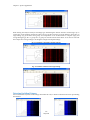
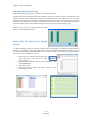
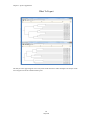
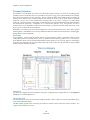
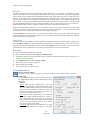
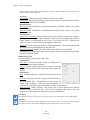
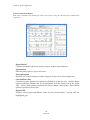
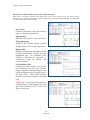
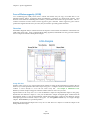
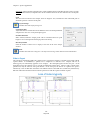
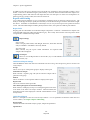
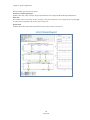
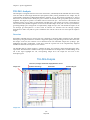
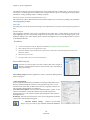
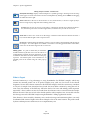
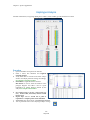
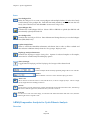
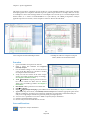
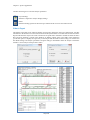
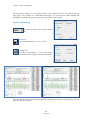
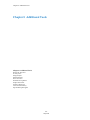
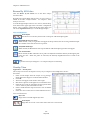
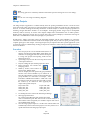
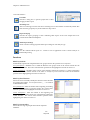
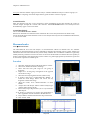
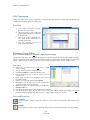
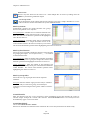
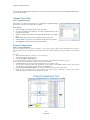
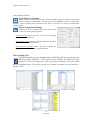
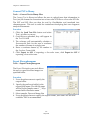
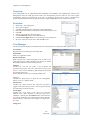
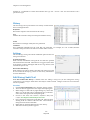
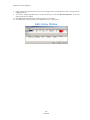
Chapter 8 Additional Tools Group Size: Enter the number of groups for the analysis. Standard MS-MLPA analysis would use 2 groups, an LOH analyses comparing one normal sample to three grades of tumor would use 4 groups. Control Identifier Enter the character from the Control Identification section (highlighted green) that describes the control or reference sample. Example: N = normal or R = reference. Select Case Sensitive if the Control Identifier needs to be identified by upper or lower case letters. Control Match Mode Choose either Whole Words or Include. Whole Words should be used if the characters entered into the Control Identifier field need to match exactly. Include should be selected if the characters in the Control Identifier field only need to be identified in the filename, i.e. not an exact match. Macromolecules Tools Macromolecules The Macromolecule Tool aids with analysis of macromolecules without an internal lanes size standard. Depending on the macromolecule size and configuration, migration rates through CE vary greatly. Internal size standards of the same macromolecule may not be readily available. This tool enables researchers to physically identify reference peaks known to have the same size and uses the information to calibrate from one capillary to another. Characteristics of the aligned data (such as relative size, peak height, peak area) can then be exported in an excel sheet or printed as an allele report. Procedure 1. 2. 3. Select File Import Data from the main analysis window Select Tools Macromolecules Settings Select Add and enter peak range for one group of fragments 4. Repeat for a second group of fragments at the opposite end of the size range 5. Select Ok and verify fragment selection (white boxed) 6. If needed, select Tools Macromolecules Range to launch the Peak Range Editor and correct for any fragments outside of the range 7. Align the results, Tools Macromolecules Show Results 8. Analyze data with Project Run Select Analysis type Animal Next Next OK 9. Review data, Export Report Table (.xls or .txt) or Print the Allele Report 10. If desired, a panel may be made in the Panel Editor to allow application of local max filter in the Run Wizard 11. Project Run Select Panel from the drop down menu 12. Next Next OK 171 May 2012