1
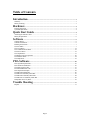
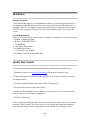
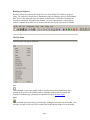
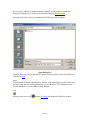
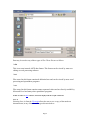
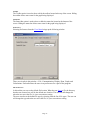
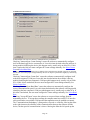
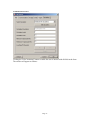
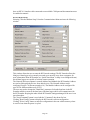
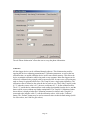
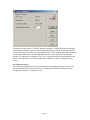
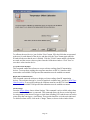
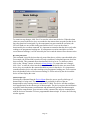
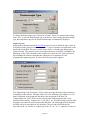
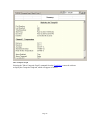
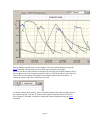
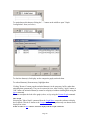
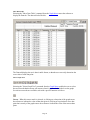
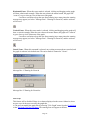
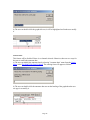
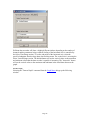
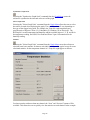
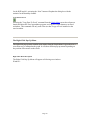
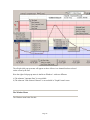
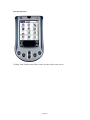
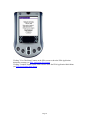
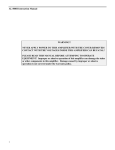
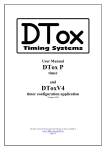
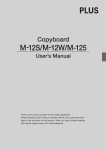
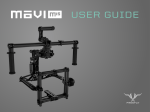
Data Logger and Software
Operating Manual
Version 2.00.51
P.O. Box 50
201 Route 103 West
Warner, NH 03278
Phone: (603) 456-2011
Fax: (603) 456-2012
Email: [email protected]
Web: http://www.madgetech.com
Page 1
Table of Contents
Introduction ................................................................................................................................. 3
Warranty..................................................................................................................................................... 3
Battery Warning ......................................................................................................................................... 3
Hardware ........................................................................................................................................ 4
Package Inspection ..................................................................................................................................... 4
System Requirements ................................................................................................................................. 4
Quick Start Guide ............................................................................................................... 4
Attaching the Interface cable ...................................................................................................................... 5
Battery Replacement .................................................................................................................................. 6
Software ............................................................................................................................................ 6
Getting Started............................................................................................................................................ 6
Software Installation................................................................................................................................... 6
Running the Software ................................................................................................................................. 7
The File Menu ............................................................................................................................................ 7
The View Menu........................................................................................................................................ 12
The Communications Menu ..................................................................................................................... 19
The Device Menu ..................................................................................................................................... 21
The Graph Menu....................................................................................................................................... 37
The Right Click Pop-Up Menu................................................................................................................. 50
The Window Menu................................................................................................................................... 54
The Help Menu......................................................................................................................................... 55
PDA Software .......................................................................................................................... 56
PDA System Requirements ...................................................................................................................... 56
PDA Software Installation........................................................................................................................ 56
The Data Transfer Cable........................................................................................................................... 57
Download PDA Data to PC ...................................................................................................................... 57
PDA Operation Example .......................................................................................................................... 58
The PDA Main Menu Bar ........................................................................................................................ 66
The PDA File Summary Menu Bar .......................................................................................................... 67
The PDA Data Summary Menu Bar ......................................................................................................... 68
The PDA Device Summary Menu Bar ..................................................................................................... 69
Manipulate Device by PDA...................................................................................................................... 70
Trouble Shooting ................................................................................................................ 77
Repairs...................................................................................................................................................... 77
Page 2
Introduction
Small, simple and affordable, MadgeTech data loggers can measure and record data at user
specified intervals ranging from once every 2 seconds to once every 12 hours. MadgeTech’s
Data Recording Software requires no programming skills, and enables the user to effortlessly
select reading rate, specify the user's user ID, and initiate the start of data collection. The user
will be using his/her data logger just moments after receiving it (see the Quick Start Guide).
In addition, all data can be saved in a format easily read by spreadsheet applications such as
"Microsoft Excel" or "Lotus 1-2-3".
It is our goal to bring the user accurate, low-cost, easy-to-use data loggers that integrate
easily into the user's working environment. To better understand the user's needs and to better
serve the user, we welcome and appreciate your feedback.
Thank you for choosing MadgeTech for your data logging requirements.
Warranty
Products manufactured by MadgeTech, Inc., are warranted against defective material and
workmanship for a period of one year, starting from the date of shipment. In the event that a
MadgeTech product is found to be defective, MadgeTech will repair or replace the product at
its sole discretion. Such repair or replacement shall be the sole remedy of this warranty.
This warranty extends only to the original purchasing customer and does not apply to any
unit, which in our sole judgment, has been subjected to:
a) Operating or environmental conditions in excess of our written specifications or
recommendations;
b) Damage, misuse or neglect;
c) Improper installation, repair or alteration.
This warranty excludes batteries.
Except as to title, this is our only warranty for the products. MadgeTech, Inc. expressly
disclaims all other warranties, guarantees or remedies—whether expressed or implied or
statutory—including any implied warranty of merchantability or fitness for a particular
purpose. We also disclaim any implied warranty arising out of trade usage or out of a course
dealing or course of performance. We do not guarantee the integrity of data or warranty that
the products will operate uninterrupted or error-free.
MadgeTech data loggers and their associated software have been thoroughly tested and the
documentation reviewed. However, MadgeTech does not warrant the performance of its
products, or that the products or their associated software will operate as described in this
manual.
Battery Warning
Most MadgeTech data loggers contain a lithium battery. Do not cut the battery open,
incinerate, or recharge. Do not heat lithium batteries above 85 ºC unless the battery is
specifically rated for higher temperatures. Dispose the battery in accordance with local
regulations.
Page 3
Hardware
Package Inspection
Verify that the data logger(s) was not damaged in transit by carefully unpacking all items in
the shipping carton and looking for obvious signs of physical damage. If the data logger is
damaged, repack it in its original container and contact MadgeTech Customer Service at 603456-2011. Any damage noted upon receipt must be documented to file a claim against the
carrier.
System Requirements
MadgeTech Data Recording software requires an IBM (or compatible) PC with the following:
• Pentium or higher processor
• Windows 95/98/2000/XP/NT
• 128 MB RAM
• Color 800 X 600 monitor
• 30 MB free disk space
• 3.5” disk drive or CD-ROM
• Available 9 pin male serial (COM) port
Quick Start Guide
To get started with the user's data logger right away, follow these six simple steps:
1) Install the software (see Software Installation if help needed with this step).
2) Attach the logger to the host computer using the IFC110 interface cable, as shown in
the diagram below.
3) From the Communication menu, select "Auto Configure port"
4) From the Device menu, select Start Device.
5) Select the "Reading Rate" the user wishes to use, from once every 2 seconds to once
every 12 hours. Leave all other settings alone.
6) Click on Start Device.
After a brief pause while the software communicates with the device, the user will see the
message "Device Started". The user's device is now running and taking measurements.
Place it where the user needs it to perform its measurements. Later, when the user is
Page 4
ready to view the measurements, simply connect it to the computer again, and select
"Read Device Data" from the Device menu.
Attaching the Interface cable
Plug the male jack connector of the IFC110 interface cable into the female receptacle of the
data logger. Plug the female DB 9-pin connector into the serial (COM) port in the host
computer as shown below.
Data Logger to Computer Connection
Page 5
Battery Replacement
Most MadgeTech miniature data loggers contain a user-replaceable 3.6 volt lithium battery.
Replacement batteries may be purchased from the factory along with installation instructions.
Before attempting to replace a battery, the user should refer to published specification sheets
or the quick start manual to make sure the device has a user-replaceable battery. If the device
does not have a user-replaceable battery, or the customer simply does not wish to replace the
battery themselves, the device may be returned to the factory for service. In this case, the
customer should contact MadgeTech for an RMA number and return the product as instructed
by customer service. MadgeTech will replace the battery and return the data logger within 5
working days.
Software
Getting Started
All MadgeTech data loggers operate similarly. Our data logging software automatically
configures itself specifically for each type of logger. It does this by reading the device type.
Each type of logger has a unique device type and identifies itself when queried by the host
computer. This has been done to minimize confusion and to eliminate the need to learn
different software packages. For that reason, only one software package and only one manual
is required for all MadgeTech Data Loggers. In certain instances where differences occur, an
attempt is made to bring clarification to the user, and avoid confusion. Most examples used in
this manual are for the Temp101, but are easily extended to all devices.
Software Installation
Installing from a floppy disk
Insert the disk labeled MadgeTech Data Recording Software into the disk drive. From the
Windows Start menu, choose the Run command and type a:\setup into the Open field and
click OK. If the user is using a disk drive other than the A drive, replace that drive letter in
the instructions above.
Installing from CD ROM
Insert the CD ROM labeled MadgeTech Data Recording Software into the host computer's
CD ROM drive. From the Windows Start menu, choose the Run command and type d:\setup
into the Open field and click OK. If the host computer's CD ROM drive is not the D: drive,
use the correct letter in the instructions above.
After installation, the software will be listed under the default MadgeTech software program
group and saved under the default “C:\Program Files\MadgeTech 2.00\” directory.
To get started right away, see the Quick Start Guide.
Page 6
Running the Software
Run the software by selecting the MadgeTech icon in the MadgeTech Software program
group. The software will open and is immediately ready for starting a device or downloading
data. The tool bar and menu items will appear as shown below. All toolbar commands are
also Menu commands. Throughout this manual, if a menu command has a corresponding
toolbar command, the toolbar icon is included with the description of the menu command.
The File Menu
The File menu will appear as follows:
New
This command creates a new graph window. It will not discard any information that is
already on the screen or in existing windows. Multiple windows may be created and
displayed simultaneously, and may be manipulated using the Window Menu
Open
This command opens previously saved data files, loading them into the current window. If no
windows are open, a new one will be created. Data in the current window is not discarded,
Page 7
the new data is added as an additional dataset. Multiple windows may be created and
displayed simultaneously, and may be manipulated using the Window Menu.
When the user selects the Open command, the following window appears:
Open Dialog Box
There are three types of files that may be opened with this software. These file formats are
described in Save.
Close
This command closes the currently active window. If the data displayed in the window has
not been saved, the user will be prompted to save it at this time. This command will not
discard data from or close any other existing windows.
Save
Selecting Save or Save All
from the File menu will display the following window:
Page 8
Data may be saved as any of three types of files. These files are as follows:
*.dat
This is our own internal ASCII data format. This format can be viewed by most text
editing or word processing software.
*.txt
Files stored in this format contain tab delimited text and can be viewed by most word
processing and spreadsheet programs.
*.csv
Files stored in this format contain comma separated values and are directly readable by
Microsoft Excel and many other spreadsheet programs.
NOTE: In order to Save a dataset, it must be displayed in the Graph or Data tab.
Save As
Selecting Save As from the File menu allows the user to save a copy of data under an
alternate name, in any of the three file types discussed above.
Page 9
Save All As
Selecting Save All As from the File menu allows the user to save all copies of datasets under
alternate name, in any of the three file types discussed above.
Export
Selecting Export from the File menu allows the user to export a copy of data in a format that
is designed for easy import into other programs, such as Excel. The three file types are the
same as those provided with the Save command, except that data which is specific to our
software, such as graph colors, is stripped out. Use Export when the user plans to open the
file in another program.
Example Data
Selecting the "Example Data" command from the File Menu causes the software to load and
display some sample data. Use this command if the user wants to experiment with the
program and the user doesn't have a data logger device handy.
Save Memory Dump
Selecting Save Memory Dump from the File menu will download the entire memory contents
of the attached device and save it in binary format. This command is useful to the factory for
troubleshooting problems in the field and recovering data from a malfunctioning device. The
user will typically not use this command unless directed to do so by our tech support
department.
Page Setup
Selecting Page Setup from the File menu brings up the following window:
Page 10
This window allows the user to select a printer, and set the options for the printer. The
options will vary according to the user's particular printer and network. Consult the user's
printer manufacturer for details about the user's printer's options.
Print Preview
Selecting Print Preview from the File menu puts a check mark next to it. When this menu
item is checked, the Print Graph and Print Data commands (described below) will display on
the screen, rather than on the user's printer. This allows the user to check what the user is
about to print, before committing it to paper. To uncheck this menu item, simply select Print
Preview again.
Print Summary
Selecting Print Summary from the File menu prints the statistics for currently selected device.
Printing the composite summary is not supported in this software.
Print Graph
Selecting Print Graph from the File menu prints the currently selected graph to the user's
printer. The single dataset file can be printed by viewing the Graph tab. Printing out several
dataset files can be achieved through the Composite Graph tab.
Page 11
Print Data
Selecting Print Data from the File menu prints the device data in table format. The amount of
data will vary depending upon the device and the number of data points.
Printing data for the composite graph is not supported in this software.
Selecting one of choices above (Print Summary, Print Graph, and Print Data) from the File
menu brings up the following window:
Exit
Selecting Exit from the File menu closes all open files and exits the program. The user will
be prompted to save all files that have been changed.
The View Menu
The View Menu will appear as follows:
Page 12
Toolbar
The Toolbar option is used to show or hide the toolbar located at the top of the screen. Hiding
the toolbar allows more room for the graph being displayed.
Status Bar
The Status Bar option is used to show or hide the status bar located at the bottom of the
screen. Hiding the status bar allows more room for the graph being displayed.
Preferences
Selecting Preferences from the View Menu brings up the following window:
There are six tabs in this window -- File, Communication, Display, Data, Graph, and
Calculations. Each tab allows the user to set preferences for a part of the program.
File Preferences
In this tab the user can set the default file location. When the user Saves a file, the directory
that the user chooses here will be the default save location. The user can still change this
when the user saves the file, it's just a convenience setting.
The user can also set the default file type by selecting from the list of file types. The user can
still change the type when the user saves the file, it's just a convenience setting.
Page 13
Communication Preferences
In this tab the user can set various Communications preferences.
Checking "Autoconfigure Comm Settings" causes the software to automatically configure
itself to the data logger device connected to it. Leave this item checked unless the software is
having trouble identifying the device (this happens rarely, usually only on older PCs). If this
item is unchecked, the user must configure the Comm settings manually. See Select Comm
Port and Select Baud Rate.
NOTE: Communications with the device are slightly slower with this item checked. If the user is confident
that the user can set the proper settings manually, the user can improve performance slightly by unchecking
this item.
Checking "Autoconfigure Comm Port" causes the software to automatically configure itself
to the host computer's COM port. Leave this item checked unless the software is having
trouble identifying the host computer's COM port (this happens rarely, usually only on older
PCs). If this item is unchecked, the user must configure the Comm settings manually. See
Select Comm Port.
Checking "Autoconfigure Baud Rate" causes the software to automatically configure the
correct communications speed. Leave this item checked unless the software is having trouble
identifying the host computer's COM port (this happens rarely, usually only on older PCs). If
this item is unchecked, the user must configure the Comm settings manually. See Select Baud
Rate.
Checking "Accept RF Input" causes the software to accept real time readings from RF
transmitting devices. To accept these readings the computer must have an RFC101 interface
cable connected to an available COM port and the transmitter must be enabled to transmit.
The "Communications Redundancy" setting trades off speed vs. reliability. Moving the slider
to the right increases the reliability of the communications between the software and the
device, but the speed of communication is slower. Moving the slider the left speeds up the
Page 14
communication, but is less reliable. For optimum performance, choose the smallest setting
that does not give errors when reading the user's device. A setting of 3 is good for most
situations.
The Communications Timeout" setting determines how long the software will wait for the
device to respond, before giving up and issuing an error. A setting of 3 is fine in most cases.
If the user is having problems with the software giving up too soon on a device that the user
knows is responding, increase this setting.
Display Preferences
In this tab the user can set the display to use the 12-hour or 24-hour time format. Check the
"Use 24 Hour Time Format" checkbox to use a 24-hour format, and leave it unchecked to use
a 12-hour format.
Data Preferences
In this tab the user can set various Data preferences.
The "Title Preferences" settings determine which items appear in the data display. The user
can select or unselect Device Type, Device Serial Number, Device ID, Download Date, and
Download Time. Checking the "Prompt for Title" box causes the software to prompt the user
for a title each time, rather than generating its own title.
The "Units Preferences" settings determine units are used for the various types of
measurements. Select the type of measurement in the first drop down list, and then select the
units the user wishes to use in the second drop down list.
Clicking "Clear Unit Preferences" will set all unit preferences to [No Preference] setting.
Checking "Automatically update units" causes preferences units to change when the user
changes the corresponding units on the screen.
Page 15
Checking "Apply units to all open data" causes the units to change for all datasets on the
screen.
Graph Preferences
Note: Checking "Animate Graph" option causes the blinking of maximum and minimum alarm setting lines
on the screen.
Page 16
Calculations Preferences
Clicking the "Edit Calculation" button to enable the user to interact with all fields in the form.
The window will appear as follows:
Page 17
In this tab the user can set various Graph preferences.
Clicking the "F0" button to display the settings for F0, a common unit of sterilization.
Clicking the "PU" button to display the settings for the Pasteurization units.
Clicking the "Example" button to show the user an example. The window will appear as
follows:
For more information about units Calculation go to "http://www.madgetech.com".
Page 18
The Communications Menu
The Communications Menu looks like this:
Auto Configure Port
Selecting "Auto Configure Port" from the Communications Menu provides the user with the
ability to automatically determine which COM port the device is attached to as well as what
baud rate the device uses to communicate. This command will only work if there is an
IFC110 cable connected to an available COM port and there is a functioning data logger
connected to the IFC110. If this command fails to find the device, then the device is not
functioning properly or the IFC110 cable is not properly connected. Once the software has
determined what COM port is being used and the proper baud rate, it will store this
information in the configuration file. Therefore this command only needs to be activated once.
If a different COM port is later used, or if a device with a different baud rate is used, then the
command should be selected again.
Select Comm Port
Selecting this command allows the user to tell the software which communication port the
data logger is connected to. The correct COM port must be selected, or the software will not
be able to communicate with the data logger. To automatically configure this option, refer to
Auto Configure Port.
Select Baud Rate
Selecting this command allows the user to tell the software what speed to use to
communicate with the data logger device. The correct baud rate must be selected, or the
software will not be able to communicate with the data logger. To automatically configure
this option, refer to Auto Configure Port.
Accept Palm Input
Selecting "Accept Palm Input" from the Communications Menu causes the software to
download data from a PDA. See PDA Software for more information.
Accept RF Input
Selecting "Accept RF Input" from the Communications Menu causes the software to accept
real time readings from RF transmitting devices. To accept these readings the computer must
Page 19
have an RFC101 interface cable connected to an available COM port and the transmitter must
be enabled to transmit.
Wireless Modem Setup
Selecting "Wireless Modem Setup" from the Communications Menu activates the following
window:
This window allows the user to enter the RF Extender settings (The RF Extender allows the
Madgetech data logger to be remotely accessed up to one mile away from a computer, for
more information about RF Extender see “Quick Start Menu” in http://www.Madgetech.com).
Not all data loggers are capable of wireless remote operation.
The Network (the host computer's network) Address and Module (the RF Extender) Address
are used to distinguish the devices from other devices. The Network Address can be
configured for up to 7 different networks (0-6). The Module Address can be configured for
up to 65536 different addresses (0-65535).
The user may need to change the "Baud Rate" parameter. Select the baud rate in the RF
Extender module as same as the baud rate of the data logger which will communicate with
the RF Extender. Keeping the other default RF Extender settings unchanged if the user is not
sure about them.
The "Send Command" button is used with the "Command" drop down list box.
Clicking "Read Config" button to display the RF Extender's current configuration.
Clicking "Write Config" button to store the configuration in the non-volatile memory where
it won't be lost when the power is cycled.
Page 20
Clicking "Send Config" button to store the configuration in the temporary buffer where it will
be lost when the power is cycled.
Modem Connection
Selecting "Modem Connection" from the Communications Menu brings up the following
window:
This window allows the user to enter the telephone number (required by the software) and
other modem settings (not required by the software) used by the software when reading data
from a remote device equipped for modem data transfer. Not all data loggers are capable of
remote operation.
Clicking "Connect" button to connect from remote station.
Clicking "Disconnect" button to disconnect from remote station.
The Device Menu
The Device Menu looks like this:
Page 21
Identify Device and Read Status
Selecting "Identify Device and Read Status" from the Device Menu causes the software to
communicate with the attached data logger device, and then displays a window similar to this
one:
Tab "Device Status" displays the device type, revision number, serial number, user ID, and
operating parameters of the particular device in the Device Status dialog box. The serial
number is set at the factory and cannot be changed by the software. The user can select a user
ID when starting the device. This command will also verify that the software is able to
communicate with the device and that the correct COM port has been selected. If the user's
device does not communicate, the user should verify the following:
Page 22
1. Are the COM port and baud rate correct?
2. Is there another device using the selected COM port, such as a modem or PDA?
3. Is the device’s battery dead?
4. Is the IFC110 cable connected to the correct COM port?
In addition, this command will read and indicate the current status and all pertinent
information of the device that is connected. This provides the user with a quick method for
determining the current state or status of a particular device.
Tab "Device Detail" displays the details of device which includes device type, revision
number, subtype, and channel information. Information about alarm setting, thermocouple
type, and engineering units may also be displayed if the device has those attributes.
Clicking "Alarm Setting" will display an alarm setting form that will allow the user to change
the alarm range. See Alarm Setting
Clicking "Thermocouple Type" will display a thermocouple type form that will allow the
user to specify which type of thermocouple is being used. see Thermocouple Type
Clicking "Engineering Units" will display an engineering units form that will allow the user
to define the type of units to be displayed on the graph. See Engineering Units
Clicking "Calibration" will display a calibration form that will allow the user to calibrate the
device. See Calibration
Read Device Data
To download the data from the device to the computer, select Read Device Data from the
Device Menu. This command automatically downloads all the stored data from the device
and displays it in both graphical and tabular form. The standard Temp101 will download data
Page 23
at approximately 120 readings per second. A progress bar located near the bottom of the
screen gives the user a visual indication of how long the download will take.
NOTE: Reading device data action will stop recording data.
Quick Start
Selecting this command from the Device Menu will start the device with out asking the user
for any settings. It will use the previously set user ID and reading rate. This is useful for
saving time, especially when handling more than one device.
Start Device
Selecting Start Device from the Device Menu will display the following window:
NOTE: Starting the device will erase all readings currently stored in its memory.
This window allows the start time and reading rate to be set. The "Start Method" setting may
be used, along with the "Start Now" radio button, to start the data logger immediately.
Alternatively, the user can select the "Delay Start" option to delay the start of data collection.
The start time may be delayed up to six months from the current time. The user can select the
"Pushbutton Start" option to start the data logger by pushing the push button of the device
(the push button of the device needs to be pushed down and held for at least 3 seconds).
For some types of data loggers, the following window may appear.
Page 24
The device start time may be delayed after the button of the data logger has been pushed.
This time will depend on the value of the delay start.
The reading rate can also be selected, allowing the user to change how often the device will
take a reading. When a reading rate is selected, the maximum recording time will be
calculated for the particular device, based on its internal memory capacity, and displayed.
Once the device has started, it will continue to record readings until its memory is full. When
its memory is full, the data recorder will stop recording any more readings and will put itself
into a low power state to maximize battery life. The data already stored in the data logger is
always preserved (even in the case of battery failure) unless the device is reset or started.
When the device is started again the old readings are then overwritten.
Lastly, the user may enter a User ID in the space provided. This may be any combination of
six letters and/or numbers. The User ID is written to the device and will appear in any graphs
or reports when the device is read later. Use it to help the user identify the device, or the
person who started the device, etc.
Stop Device
Selecting "Stop Device" from the Device Menu causes the software to communicate with the
data logger device, and stop it from taking any further measurements. The data logger will
enter a low power state to conserve battery life. The device will also stop and enter this mode
when the memory is full. This mode is transparent to the user, because the device will
immediately wake up when the host computer communicates with the logger. If the device is
not going to be used for a while, it is wise to stop the device from collecting more data to
conserve power. Stopping the device has no effect on the data in memory. The data is always
retained. It is not usually necessary to stop the device because it will stop automatically once
Page 25
it has filled its entire memory. This is just a convenient way for the user to help extend the
life of the battery.
Reset Device
Selecting "Reset Device" from the Device Menu causes the software to communicate with
the data logger device, and stop it from taking further measurements. It will also erase all
readings currently stored in memory. Resetting the device also causes the data logger to
enter a low power state to conserve battery life.
Real Time Chart Recording
This command provides the user with a graphical method for acquiring and viewing data in
real time. Selecting this command causes the menu items and toolbar to appear as shown
below:
The user can select the reading rate, setup real time recording parameters, and start and stop
the real time graphing. To use those features, a logger must be connected to the interface
cable.
Clicking the "Start Recording" button causes the software to take a reading from the logger
and update the screen at the selected reading rate.
Clicking the "Done Recording" button causes the software to discontinue recording from the
logger.
Here is an example of a real-time graph, using a Temp101 temperature logger:
Page 26
Note: The pink area is the warning area for high alarm setting of data logger, the light blue area is the
warning area for low alarm setting of data logger if it has alarm setting attribute.
When the data has been accumulated in real time it can be saved and viewed in the same
manner as data that has been downloaded from a device. The data can also be viewed in
tabular form while in the real time mode. The user can easily switch back and forth from
graphical to tabular form. While in the real time recording mode, access to most software
commands is restricted so that they will not interfere with data collection. Also, all windows
except for the current window are inactive during data collection.
To completely exit from the real time recording mode, click on the “Done Recording” button.
Real Time Recording Setup
Clicking "Recording Setup" button from the "Real Time Chart Recording" toolbar brings up
the following window:
Page 27
The tab "Recording Parameters" allows the user to set up the recording start and end time.
For start the real time recording the user can select "Start Now" to start recording
immediately or the user can delay the recording by setting the delay time.
For end the real time recording the user can select "Manual" to end recording by clicking
"Done Recording" button from the "real time toolbar" toolbar or setup the end time so the
recording can automatically be stopped at the time that the user chose.
The user can setup the real time recording rate by using "Reading Rate" drop down list box.
Clicking "Start Recording" button to start real time recording.
Page 28
The tab "Alarm Settings" allows the user to set up the alarm information.
There are three steps the user need to do for alarm settings:
1) Notification Types
• Check "Email Alarm" to receive an alarm warning message through email.
• Check "Phone Alarm" to receive an alarm warning message through phone.
• Check "Screen Alarm" to show the user about alarm information on the screen. The
window will appear as follows:
Page 29
2) Notification Settings
• Select "No Notification" option to disable alarm warning.
• Select "Notify every out of range reading" option to receive an alarm warning message by
every reading when the alarm range is out of the alarm setting.
• Select "Notify only on initial out-of-range reading" option to receive an alarm warning
message every time when the first time the alarm range is out of the alarm setting.
• The user can receive the alarm warning message in certain interval time when the alarm
range is out of the alarm setting. The use can use the last option in "Notification Settings" to
enter the interval time that they want.
3) Channel Settings
• Select the channel that the user wants to have alarm setting on it by clicking the drop down
list box
• Select the unit for a channel that has alarm setting on it by clicking the unit drop down list
box. It will affect the graph's unit on the screen but not the setting of preference unit .
• Check "Enable" option to enable the alarm warning setting. This feature allows the user to
setup alarm warning on multiple channels.
• Enter high setting value and low setting value for a particular channel.
Page 30
The tab "Email Information" allows the user to set up the email information.
Page 31
The tab "Phone Information" allows the user to set up the phone information.
Calibration
All data logger devices can be calibrated through software. This eliminates the need for
opening the device or adjusting potentiometers. Calibration parameters, as well as the last
calibration date, are stored within the device itself in non-volatile memory. This allows the
device to maintain calibration while being used on any computer. Most data loggers can be
effectively calibrated using a single point to correct an offset. In some cases, two points may
used to correct for gain and offset errors. The Temp101 uses a single point calibration. The
calibration offset is defined as the value the device reads at zero. Thus, if the Temp101 reads
0.5 ºC when the correct value is 0 ºC, the user would enter 0.5 ºC for the calibration offset.
The 0.5 ºC would then be subtracted from each reading downloaded from the device, and the
data would be correct without any further manipulation. The Temp101 Calibration window
shown below is displayed when the Calibration command is selected, and a Temp101 is
connected to the interface cable. To edit the calibration values, click on the “Calibrate”
button. The “Default” button may be used to return all values to their default settings (0.000
for offset values, and 1.000 for gain values.)
Page 32
For the user's convenience, a “Wizard” button is available. Clicking this button will display
the Calibration Wizard, a series of screens with fields the user can fill in about the behavior
of the uncalibrated (all values set to the default) device. The wizard performs the calculations
for the offset and/or gain values and puts them into the correct fields in the Calibration
window. To commit to any changes, click “Save” to store the calibration information in the
device. The calibration is then saved, and the new calibration values are displayed on the
screen.
The Calibration Wizard
The Calibration Wizard displays various information depending on the type of device the
user has attached. Here is how it looks for a Temperature Gain/Offset calibration on the
Temperature channel of a Temp101 device.
Page 33
To calibrate the user's device, just click the "Next" button, fill in the fields that are presented
to the user for each channel of the device, and then click the "Next" button again until the
Wizard tells the user that the user is finished. Click the "Finish" button and the calculations
are made, and the correct values are placed into the Calibration windows. Click "Save" to
save these values into the device.
Accept Real Time RF Input
This command enables the software to accept real time readings from RF transmitting
devices. To accept these readings the computer must have an RFC101 interface cable
connected to an available COM port and the transmitter must be enabled to transmit.
Display RF Transmission Data
This command causes the software to display real time readings from RF transmitting
devices. The real-time data can be viewed in graphical or tabular form, just like in Real Time
Chart Recording To accept RF readings the computer must have an RFC101 interface cable
connected to an available COM port and the transmitter must be enabled to transmit.
Alarm Settings
From the Device Menu, choose Alarm Settings. This command is only available when a data
recorder that has this feature is connected. This command allows the user to set the high and
low temperature points that will trigger a visual alarm (flashing LED) and the user can set the
a time delay that can trigger a visual alarm. These points should be set in the units indicated.
To edit these alarm values, click on the “Change” button, as shown in the window below:
Page 34
To commit to any changes, click “Save” to store the values into the device. When the alarm
values are stored in the device, they are rounded to the nearest alarm set point for that device.
Once the alarm has been tripped (e.g. the temperature has gone outside the set limits), the
LED will flash at a one second reading rate until the device is reset or the alarm is
deactivated by the set alarm command. It is important to remember that the device only takes
readings at its programmed reading rate. If a temperature excursion outside the set limits
occurs between readings, it will be missed by the device and the alarm will not become active.
Recording Threshold
This command is used for devices that only record data above or below some threshold value.
For example, the PrTrans1000 recorder will only record data if a threshold pressure level has
been exceeded. This command allows that threshold level to be set. To edit these values,
click on the “Change” button, as shown in Alarm Settings. To commit the user's changes,
click “Save” to store the values into the device. When the threshold values are stored in the
device, they are rounded to the nearest threshold set point for that device. It is important to
remember that the device only takes readings at its programmed reading rate. If an excursion
above the threshold value occurs between readings, it will be missed by the device and the
device will not display the event.
Thermocouple Type
Selecting this command from the Device Menu allows the user to specify which type of
thermocouple is being used. This command is only available for devices that use
thermocouples as the sensing element, such as the TC4000. The device will then configure
itself appropriately for the chosen type of thermocouple. The device requires this information
to properly make temperature measurements and automatically perform the thermocouple
cold junction compensation. Upon activation of this command, the software communicates
with the device to determine if it has a programmable thermocouple. If it does, the following
window appears:
Page 35
To change the thermocouple type, click on the “Change” button. To commit to the change,
click “Save” to store the thermocouple type in the device. After selecting the thermocouple
type, the temperature range for the chosen thermocouple is automatically displayed.
Engineering Units
Selecting this command from the Device Menu allows the user to define the type of units to
be displayed on the graph, as well as a Y = m*X + b type of equation to be performed on the
data being downloaded. This can be useful when a device is recording the analog output
signal of a meter. The equation can be stored within the device to simplify and enhance the
displaying of data. This command is only available for certain devices. Upon activation of
this command, the software communicates with the device to determine if it has
programmable engineering units. If it does, the following window appears:
The “Engineering Units Description” field is used to enter the full name of the parameter to
be displayed in the software. Examples of this are Volts, Milliamps, pH, Gallons, etc. This
name is displayed on the graph and data table as the description of the data. The
“Engineering Units Label” field is used to enter the label of the parameter that is to be
displayed in the software. Examples are V, mA, pH, G, etc. This abbreviation is used to label
the graph axes and for the units column in the data table. The total length of the description
and label can be no more than ten (10) characters. The gain and offset fields are the
equivalent of the “m” and the “b” respectively in the “Y = m * X + b” equation. X is the raw
Page 36
data from the device and Y is the data displayed by the software. The “Enable Engineering
Units” check box indicates whether the units programmed into the device should be
displayed when data is downloaded. The “Prompt for Units” check box allows the user to edit
the stored information each time the data is uploaded, in case the user needs more than tencharacter descriptions and labels.
Enter Engineering Units
This command is similar to the Engineering Units command, except that instead of storing
the units in the device, the units are immediately added to the conversion table.
The Graph Menu
The Graph Menu appears like this:
Show Summary
Selecting the "Show Summary" command from the Graph Menu causes the software to
display the Summary tab, which will appear as follows:
Page 37
Show Composite Graph
Selecting the "Show Composite Graph" command from the Graph Menu causes the software
to display the Composite Graph tab, which will appear as follows:
Page 38
This tab displays a graph of one or more datasets. The user can load datasets by using the
Open command. Once the dataset(s) are loaded, they are displayed as graphs.
The user can choose which datasets are displayed by selecting one from the dropdown list at
the top-right corner of the composite graph (see below). Click the checkbox next to the list to
select or deselect the dataset for display. Deselecting the dataset does not unload it -- it
remains in memory and can be reselected at any time.
To unload a dataset from memory, select it from the dropdown list at the top-right corner of
the composite graph. Click the "X" button on the right to unload the dataset (see below).
Once a dataset is unloaded, it cannot be redisplayed without reloading it using the Open
command.
Page 39
To manipulate multi-datasets clicking the "..." button on the middle to open "Graph
Configuration" form (see below)
To deselect dataset(s) for display on the composite graph, uncheck them.
To unload dataset(s) from memory, highlight them.
Clicking "Remove" button puts the unloaded dataset(s) in the temporary buffer, rather than
unloading them permanently. They can be restored or reset. After clicking "Apply" button or
"OK" button, the unloaded dataset(s) cannot be redisplayed without reloading them using the
Open command.
The user can adjust the look of the graph (colors, etc) by using the Format Graph command.
Show Graph
Selecting the "Show Graph" command from the Graph Menu causes the software to display
the Graph tab. This tab is similar to the Composite Graph except that only one dataset can be
displayed at a time.
NOTE: In order to Save a dataset, it must be displayed in the Graph or Data tab.
Page 40
Show Data Table
Selecting the "Show Data Table" command from the Graph Menu causes the software to
display the Data tab. The data tab looks like this:
The Data tab displays the user's data in table format, so that the user can easily determine the
exact value of each data point.
Select Graph Tool
Selecting the "Select Graph Tool" command from the Graph Menu enables the user to select
the cursor mode that the mouse will assume when it is pointed and clicked over the graph.
Several cursor modes are available, each with a specific function as follows:
Cursor - When this cursor mode is selected, a) clicking on a data point of the graph causes
the software to indicate the value of that data point. b) clicking on a point that is not a data
point but is nearby of the graph causes the software to indicate the value of the nearest data
point.
Page 41
- The user can change the data point selecting by navigating the cursor. a) Using
clicking method. b) clicking and dragging the mouse horizontally in the graph. c) Using the
functions (move left, move right) of the keyboard.
Time Cursor - When this cursor mode is selected, clicking and dragging the mouse
horizontally in the graph area or using the functions (move left, move right) of the keyboard
causes the software to indicate the time and value of each data point the cursor passes over.
Scroll - This cursor mode is used to scroll the graph in any direction, in order to view a
particular section. To scroll the graph, click and hold the mouse button, and drag the mouse
in the direction the user wants to scroll. A line with an arrow is drawn as the user drag, to
indicate the direction and amount of the scrolling operation. When the user releases the
mouse button, the graph is then scrolled in the direction and by the amount the user specified.
Zoom In - When this cursor mode is selected, clicking on the graph will “zoom in” to get a
close-up view of a particular area of the graph. Multiple zooms may be performed to get the
best view.
- In order to set limits to keep the user from zooming in too many times the warning
message may appear (see below "Message Box 1: Warning for Zoom In") and the software
will be reset.
Zoom Out - When this cursor mode is selected, clicking on the graph will “zoom out” to get
an overall view of a particular area of the graph. Multiple zooms may be performed to get the
best view.
- In order to set limits to keep the user from zooming out too many times the warning
message may appear (see below "Message Box 2: Warning for Zoom Out") and the software
will be reset.
Box Zoom - When this cursor mode is selected, clicking and dragging on the graph will draw
a rectangle. When the user releases the mouse button, the graph will “zoom in” to get a closeup view of that area of the graph.
- In order to set limits to keep the user from zooming in too many times the warning
message may appear (see below "Message Box 1: Warning for Zoom In") and the software
will be reset.
Page 42
Horizontal Zoom - When this cursor mode is selected, clicking and dragging on the graph
will draw a horizontal rectangle. When the user releases the mouse button, the graph will
“zoom in” to get a close-up view of that area of the graph.
- In order to set limits to keep the user from zooming in too many times the warning
message may appear (see below "Message Box 1: Warning for Zoom In") and the software
will be reset.
Vertical Zoom - When this cursor mode is selected, clicking and dragging on the graph will
draw a vertical rectangle. When the user releases the mouse button, the graph will “zoom in”
to get a close-up view of that area of the graph.
- In order to set limits to keep the user from zooming in too many times the warning
message may appear (see below "Message Box 1: Warning for Zoom In") and the software
will be reset.
Cancel Zoom - When this command is selected, any existing zoom modes are canceled, and
the graph is redrawn in its default state. The cursor mode is returned to "Cursor".
Message Box 1: Warning for Zoom In
Message Box 2: Warning for Zoom Out
Title Graph
This feature will be disabled if there is no dataset displayed on the screen. Otherwise, there
are two ways for the user to modify the graph title.
a) The user can modify the graph title by selecting "Title Graph" menu from the Graph Menu
or the The Right Click Pop-Up Menu. The entering form will appear as follows:
Page 43
b) The user can double click the graph title area, it will be highlighted and let the user modify
it.
Annotate Data
This feature will be disabled if there is no channel selected. Otherwise, there are two ways for
the user to modify the annotate data.
a) The user can modify the annotate data by selecting "Annotate data" menu from the Graph
Menu or the The Right Click Pop-Up Menu. The entering form will appear as follows:
b) The user can double click the annotate data area on the heading of the graph then the user
can type in to modify it.
Page 44
Set Graph Scale
Selecting the "Set Graph Scale" command from the Graph Menu allows the user to specify
the values of the vertical and horizontal axis. Here is an example of the dialog window (all 3
tabs):
Note: In order to enter the low value or the high value of the unit the user must select a unit from the
"Select Units" drop down list box first. There is no unit selected if the value of the "Select Units" drop
down list box is "No Units Selected".
Page 45
Different data recorders will show a slightly different window depending on the number of
channels and the parameters being recorded. Scaling of the horizontal axis is controlled by
the Select Time Range section. To set the end points of the horizontal axis, select the
specified endpoints from the drop down date and time menu. The vertical axis is set using the
Select Vertical Range section. The default button will set the vertical values to the maximum
and minimum values that the data recorder is capable of measuring. The "Autoscale" button
will set the vertical values to the maximum and minimum in the actual data shown on the
graph.
Format Graph
Selecting the "Format Graph" command from the Graph Menu brings up the following
window:
Page 46
The first tab of this window, "Format Graph", allows the user to set the background color for
the entire graph, as well as the color of the major and minor grid lines, and the number of
major and minor grid lines.
The second tab of this window, "Format Data", looks like this:
Page 47
This window allows the user to customize the look of the graphical data for each dataset.
First choose the dataset the user wishes to customize from the dropdown list. Select the
channel from the second dropdown list (not all devices have more than one channel). Then
select the thickness of the line, the line color, the symbol style, and the symbol color from the
remaining dropdown lists. Finally, select the symbol size and frequency (see Manipulate
Plotting Symbol), and whether the user wants the channel to be visible or not (see Hide
Selected Channel and Show Hidden Channels).
Manipulate Plotting Symbol - The "Select Symbol Size" slider and the "Select Symbol
Frequency" slider are used to manipulate the plotting symbols. The zero setting removes all
plotting symbols, and higher settings will approximately double the number of symbols on
the graph as the slider is moved up one notch.
Hide Selected Channel - Uncheck the "Channel Visible" option to hide the selected channel.
The user can also use The Right Click Pop-up Menu to hide the selected channel.
Show Hidden Channels - Check the "Channel Visible" option to show the hidden channel.
The user can also use The Right Click Pop-up Menu to show the hidden channel.
When the user clicks OK, the graph is immediately redrawn with the options the user has
chosen.
Autoscale Graph
Selecting the "Autoscale Graph" command from the Graph Menu causes the software to
optimize the vertical scale of the graph to match the minimum and maximum data points
shown on the graph. This provides maximum resolution for viewing the graph.
Page 48
Synchronize Graph Scale
Selecting the "Synchronize Graph Scale" command from the Graph Menu causes the
software to synchronize the time and value axes of the graph.
Select Graph Units
Selecting the "Select Graph Units" command from the Graph Menu allows the user to select
the units to be used when displaying the graph. The available units will vary depending on
the type of data logger being used. For example, the Temp101 reads temperature and
provides units of degrees Celsius (ºC), Fahrenheit (ºF), Rankine (ºR) or Kelvin (K). The
RHTemp101 records temperature and humidity and has available degrees C, F, R, and K for
the temperature reading, and %RH, Dew Point and Water Vapor Concentration for the
humidity reading.
Statistics
Selecting the "Select Graph Units" command from the Graph Menu causes the software to
calculate some basic statistics for data on each individual channel. A typical screen for some
calculated statistics for the temperature channel of a Temp101 might appear as follows:
For data recorders with more than one channel, the “Next” and “Previous” buttons will be
available. This allows the user to quickly view the statistics on each channel. In the example
Page 49
for the RHTemp101, activating the “Next” button will update the dialog box with the
statistics for the humidity channel.
Copy Data To Excel
Selecting the "Copy Data To Excel" command from the Graph Menu causes the software to
launch the Microsoft Excel spreadsheet program, and copy the current dataset to an Excel
worksheet. This command will only work if the user has a copy of Excel installed on the
user's machine.
The Right Click Pop-Up Menu
The right click pop-up menu contains some menus from the Graph Menu. It gives the user a
convenient way to manipulate the graph. It will show different pop-up menus depending on
the position of the mouse on the screen.
Right Click Menu Description
The Right Click Pop-Up Menu will appear as following two windows:
Window 1:
Page 50
The all right click pop-up menus will appear as above if there is a channel has been selected
on the screen by the user.
The details about the selected channel and the selected reading will be displayed on the
heading area of the graph.
Here are some submenus when the user uses the middle right click pop-up menu:
• Submenu A: Select Graph Tool
Page 51
Clicking "Title Graph" submenu to modify the graph title. See Title Graph
Clicking "Annotate Data" submenu to modify the Annotate Data. See Annotate Data
• Submenu B: Select Graph Units
• Submenu C: Graph Scale
Clicking "Set Time Scale" submenu will display a time scale setting form. See Set Graph
Scale
Clicking "Set vertical Scale" submenu will display a vertical scale setting form. See Set
Graph Scale
• Submenu D: Graph Format
Page 52
The submenu "Hide Selected Channel" is available if there is a channel has been selected on
the screen. The user can also use the Hide Selected Channel function which is in the Format
Graph menu to hide the selected channel.
Clicking "Format Graph" submenu will display a graphic format setting form. See Format
Graph
Clicking "Format Data" submenu will display a data format setting form. See Format Graph
Clicking "Show Hidden Channels" submenu causes all hidden channels showing up in the
graph. The user can also use the Show Hidden Channels function which is in the Format
Graph menu to show the hidden channel(s). This submenu is not available if there is no
channel hidden in the graph.
Window 2:
Page 53
The all right click pop-up menus will appear as above if there is no channel has been selected
on the screen by the user.
Here the right click pop-up menu is similar as Window 1 with two different:
a) The submenu "Annotate Data" is not available.
b) The submenu "Hide Selected Channel" is not available in "Graph Format" menu.
The Window Menu
The Window menu looks like this:
Page 54
Stack
Choosing "Stack" from the Window Menu resizes all the open graph windows so they each
take up the whole main window and are overlaid (stacked) on top of each other.
Cascade
Selecting "Cascade" from the Window Menu resizes all the open graph windows to a
medium size, and then positions them in a staggered fashion, one on top of the other, so that
all the title bars are visible.
Tile Horizontal
Selecting "Tile Horizontal" from the Window Menu rearranges the open graphs windows so
that they are all fully visible and are aligned horizontally next to each other with no overlaps.
Tile Vertical
Selecting "Tile Vertical" from the Window Menu rearranges the open graphs windows so that
they are all fully visible and are aligned vertically next to each other with no overlaps.
The Help Menu
The Help Menu looks like this:
Contents
Selecting "Contents" from the Help Menu brings up the Help window, and presents the user
with the Table of Contents for the online manual.
About
Selecting "About" from the Help Menu brings up the "About" window, and presents the user
with information about the company and the software version. This screen includes our
company address, phone number for technical information, e-mail address and web site. It
also includes the full revision number of the software and the date it was released.
Page 55
MadgeTech Website
Selecting "MadgeTech Website" from the Help Menu brings up the MadgeTech Website that
gives the user more helpful information.
PDA Software
Madgetech offers the user the MadgeTech PDA Data Recording software that can be used to
analyze data which downloaded from a PDA. The PDA contains data that are transferred
from the data logger(s). In order to transfer data properly the PDA must be connected with
MadgeTech data logger by using MadgeTech PDA101 cable (see PDA Data Transfer Cable).
The data from multiple data loggers can be transferred to the same PDA. The transfer
processing will be stopped if the PDA's memory is full.
PDA System Requirements
In order to run MadgeTech PDA Data Recording software properly there are some additional
requirements based on the requirements of the MadgeTech Data Recording software (System
Requirements).
• Windows 2000/XP
• Palm™ m125, m130, m500, m505, m515, Zire 71, or Tungsten series handhelds using
Palm™OS® 4.0 or higher
• Palm Desktop Software (4.0.1 or higher) with HotSync® Manager (4.0.1 or higher)
installed on your computer
• MadgeTech Data Recording Software version 2.00.49 or higher
PDA Software Installation
• Make sure the Palm™ Desktop software is installed on your computer
• Make sure the MadgeTech Data Recording Software is installed on your computer
(Software Installation)
• Attach the Palm™ download cradle to your computer, and place the handheld on the
cradle
• Insert the CD ROM labeled “MadgeTech Data Recording Software” into your CD
ROM drive. From the Windows Start menu, choose the Run command and type
D:\Palm\SetUp_Palm into the Open field and click OK. If your CD ROM drive is not the
D: drive, use the correct letter in the instructions above
• Follow the instructions to install Palm Software
Page 56
PDA Data Transfer Cable
In order to transfer the recorded data from data logger to the PDA, the data logger must be
attached to the PDA by using the MadgeTech PDA101 cable, as shown in the diagram below.
Data Logger Connects to the PDA by using the PDA101 Cable
Download PDA Data to PC
The user can download the PDA data to the host computer after the MadgeTech PDA
software is properly installed. The user should follow the following steps to download the
PDA data:
• Start the MadgeTech PDA Data Recording software
• Select “Accept Palm Input” (Accept Palm Input) from the Communication menu. A
pop-up message box will appear as follows:
• Click OK on the pop-up message box
• Activate HotSync on Palm Handheld with HotSync Manager running on the computer.
An example as shown below:
Page 57
• After a few seconds, a message box will appear as follows if there are recorded data
available on the Palm
• Click "Yes" button to download the recorded data, click "No" button to skip the
recorded data, and click "Cancel" button to stop data downloading
PDA Operation Example
The example here uses a temperature data logger, some functions here are not available if the
data logger is not temperature data logger.
Page 58
Start PDA Operation
Clicking "Start" button on the PDA to start it (see the yellow arrow above).
Page 59
Start PDA Application
Clicking the application on the PDA. The example here is "MadgeTech" (see the yellow
arrow above).
Page 60
Clicking "View Disclaimer" button on the PDA screen to show the PDA Application
disclaimer message (see PDA Application Disclaimer).
Clicking "Continue" button on the PDA screen to show the PDA Application Main Menu
(see PDA Application Main Menu).
Page 61
PDA Application Disclaimer
Page 62
PDA Application Main Menu
Clicking "Main" menu or a button (see the yellow arrow above) to show The PDA Main
Menu Bar.
Clicking the "Logger Communication" button to show the device detail screen and the user
can manipulate the device (see Manipulate Device by PDA).
Clicking a list in the "Records on Desk" list box to show the file summary of the selected file
(see PDA File Summary).
Page 63
PDA File Summary
Clicking the "Data Details" button to open the data summary screen (see PDA Data
Summary).
Clicking the "Device Info" button to open the device summary screen (see PDA Device
Summary).
Clicking "File Summary" menu or a button (see the yellow arrow above) to show The PDA
File Summary Menu Bar.
Page 64
PDA Data Summary
Clicking the "Device Info" to open the device summary screen (see PDA Device Summary).
Clicking "Data Summary" menu or a button (see the yellow arrow above) to show The PDA
Data Summary Menu Bar
Page 65
PDA Device Summary
Clicking the "Data Details" to open the data summary screen (see PDA Data Summary).
Clicking "Device Summary" menu or a button (see the yellow arrow above) to show The
PDA Device Summary Menu Bar
The PDA Main Menu Bar
See PDA Application Main Menu
• PDA View Menu
Page 66
Clicking "Device" menu to show the device detail screen and the user can manipulate the
device (see Manipulate Device by PDA).
• PDA Setup Menu
Clicking "COM Configuration" menu to Setup the PDA Baud Rate.
Clicking "Unit Preferences" menu to select the PDA Unit Preferences.
• PDA Help Menu
Clicking "About" menu to see PDA About.
The PDA File Summary Menu Bar
See PDA File Summary
• PDA View Menu
Page 67
Clicking the "Main" menu to back to the PDA Application Main Menu (see PDA Application
Main Menu).
Clicking the "Device Info" menu to open the device summary screen (see PDA Device
Summary).
Clicking the "Data Details" menu to open the data summary screen (see PDA Data Summary).
• PDA Setup Menu
Clicking "Unit Preferences" menu to select the PDA Unit Preferences.
• PDA File Menu
Clicking "Delete Record" menu from the "File" menu to delete a PDA file.
The PDA Data Summary Menu Bar
See PDA Data Summary
Page 68
• PDA View Menu
Clicking the "Summary" menu to open the file summary screen (see PDA File Summary).
Clicking the "Device Info" menu to open the device summary screen (see PDA Device
Summary).
• PDA Setup Menu
Clicking "Unit Preferences" menu to select the PDA Unit Preferences.
The PDA Device Summary Menu Bar
See PDA Device Summary
• PDA View Menu
Page 69
Clicking the "Summary" menu to open the file summary screen (see PDA File Summary).
Clicking the "Data Details" button to open the data summary screen (see PDA Data
Summary).
• PDA Setup Menu
See PDA Setup Menu.
Manipulate Device by PDA
This window allows the user to start (see Start Device by PDA), stop, and reset the data
logger. The PDA will not download the data from the data logger until the user click the
"Download" button (see Transfer Data to PDA).
Clicking the "Status" button to show the status of the device (see PDA Device Status)
Clicking "Device" menu or a button (see the yellow arrow above) to show The PDA Main
Menu Bar.
Page 70
Start Device by PDA
Page 71
PDA Device Status
Clicking the "Details" button to show more details.
Page 72
Transfer Data to PDA
Clicking "OK" button to start transfer data from the data logger to the PDA.
Page 73
After while the screen will be changed to the device status window (PDA Device Status).
Page 74
PDA Unit Preferences
Clicking the drop down list button to select the unit preferences.
See PDA Setup Menu in The PDA Main Menu Bar.
Page 75
PDA Baud Rate Setup
Clicking the drop down list button to select the baud rate (in order to transfer data from a data
logger properly, the PDA's baud rate must be matched the baud rate of that data logger).
See PDA Setup Menu in The PDA Main Menu Bar.
PDA File Delete
See PDA File Menu in The PDA File Summary Menu Bar.
Page 76
PDA About
Trouble Shooting
Our Data Loggers are pretty simple to operate, and there's not a lot that can go wrong. If the
user is having trouble, however, here are some things to check.
• Make sure the cable is properly attached to both the host computer, and the data logger.
See Attaching The Interface Cable.
• Make sure the host computer's COM port is correctly configured. See Auto Configure
Port.
• Is there another device using the selected COM port, such as a modem or PDA?
• Make sure the battery is good. If the user is not sure, see Battery Replacement
• Try Resetting the device. See Resetting The Device.
• If none of these things helps, feel free to call our technical support line at 603-4562011, or send an email to [email protected]
Repairs
MadgeTech products are designed and built to withstand the harshest environments. However,
due to circumstances beyond our control, units may sometimes require repair. All repairs are
Page 77
performed by our experienced, fully trained technicians and are covered by a Repair
Warranty.
MadgeTech offers diagnosis and repair of all returned products. Once repaired, they are load
tested and monitored for intermittent problems. We have replacement products and
engineering assistance if the user's repair is determined to be beyond economical repair. If the
user needs him/her product back ASAP, we offer an Expedited Repair Service for an
additional fee.
Page 78