1
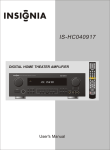
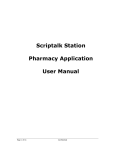
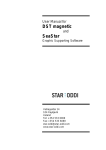
User Manual for DST nanoRF-T Telemetry temperature logger and Mercury & Gná Online user Software Skeidaras 12 210 Gardabaer Iceland Tel: +354 533 6060 [email protected] www.star-oddi.com User Manual ©Star-Oddi 2015. All Rights Reserved Gná Graphic Supporting Software Page 2 User Manual Gná Graphic Supporting Software Table of Contents 1. 2. Introduction ................................................................................................ 4 Mercury & Gná program installation ........................................................ 5 2.1 Install ........................................................................................................ 5 2.2 Uninstall .................................................................................................... 6 3. Preparation ................................................................................................. 7 3.1 Select Recorder Type ............................................................................... 7 3.2 Configuration of the Communication Port ................................................. 8 4. Communication Box ................................................................................ 11 4.1 Communication Box................................................................................ 11 4.2 Connection Point .................................................................................... 12 4.3 COM Connection .................................................................................... 12 4.4 Connection Wizard ................................................................................. 13 5 PAN ............................................................................................................... 14 5.1 Setup & running ...................................................................................... 14 5.2 Configuration of the Communication Port ............................................... 15 6. RF box and antenna ................................................................................. 18 6.1 Starting & running ................................................................................... 18 7. Working with groups and programming the logger .............................. 21 7.1 Creating a group ..................................................................................... 21 7.2 Connecting and programming the logger................................................ 22 7.3 Send group to Gná ................................................................................. 28 7.4 Downloading data in Mercury ................................................................. 31 8. On-line monitoring ................................................................................... 34 8.1 Buttons ................................................................................................... 34 8.2 Using the Mouse ..................................................................................... 37 8.3 View menu .............................................................................................. 38 9. Wizard and Help menu ............................................................................. 39 9.1 Launch Mercury Telemetry Wizard ......................................................... 39 9.2 Help menu .............................................................................................. 39 ©Star-Oddi 2015. All Rights Reserved Page 3 User Manual Gná Graphic Supporting Software 1. Introduction Figure 1.1 Telemetry system The DST nanoRF-T is based on Starnano-T technology and gives the users the benefit of both continuous logging and telemetry. The logger can be programmed to record temperature as often as once per minute. It will store those data points in its memory and transmit the data to the accompanying online user software, Gná, as often as required by the researcher. The DST nanoRF-T is implanted in the animal, preferably in the abdominal cavity. Prior to implantation, the loggers will need to be programmed using the communication box and the accompanying application software, Mercury, where the user defines groups, measurement start time and transmission frequency. Each cage will need a RF box and an antenna and there can be up to 10 subjects in each cage. The RF box is attached to the cage and the antenna is attached to the bottom of the cage using Velcro®. The antenna is very thin, only about 2-3mm. The RF box will receive the data from the DST nanoRF-T and transmit the data to the Personal Area Network (PAN) and all other measurements will be stored in memory. If you miss a transmission for any reason the logger will not resend the data but will store the data in memory, which can be retrieved at the end of the research. The PAN is connected to the computer using a serial cable and a USB converter. How far the PAN can be placed away from the RF box varies greatly on the configuration of the lab but in most cases it will transmit about 20-30 meters. The software takes care of minimizing cross talk and even if that does happen all transmissions have the individual logger attached. ©Star-Oddi 2015. All Rights Reserved Page 4 User Manual Gná Graphic Supporting Software 2. Mercury & Gná program installation Mercury & Gná is an online user software for the Star-Oddi telemetry system. Mercury & Gná can run under Windows 2000 or newer. The following chapters will take you step-by-step through the program installation, hardware connections and use of the Mercury & Gná Program. The installation of Mercury & Gná requires access to a PC computer with a standard RS-232C serial interface or USB. The users of Mercury & Gná will receive free updates of the software. Updates of Mercury & Gná will be available for free download at: http://www.star-oddi.com/Downloads/ The Star-Oddi telemetry logger is supported by the Mercury software and the Communication Box, which works as an interface between the logger and the computer. The logger is ready for recording after the user has set the start time and sampling interval in the Mercury software. The recorded data is transmitted to Gná where the results can be analyzed in graphic and tabular form. In Gná the user has the option to print out reports with information such as energy consumption of the RF boxes. This chapter describes how to install and uninstall the Mercury & Gná software on your PC computer. Please note that each software needs to be installed and uninstalled separately. 2.1 Install To download Mercury & Gná visit www.star-oddi.com/downloads. To install the program, follow the automatic InstallShield Wizard. Follow the instructions on the screen. You will be prompted for a directory name for your Mercury & Gná program. Type in your product key. Please keep the product key in a safe location as you may need it for future use. The product key works for multiple computers on the same network. ©Star-Oddi 2015. All Rights Reserved Page 5 User Manual Gná Graphic Supporting Software 2.2 Uninstall To uninstall the program, do the following: 1. 2. 3. 4. Click on the Start button in Windows. Go to Settings and Control Panel. Choose Add/Remove Programs. Choose Mercury & Gná ©Star-Oddi 2015. All Rights Reserved Page 6 User Manual Gná Graphic Supporting Software 3. Preparation This chapter describes preparations that should be carried out before connecting to the recorder. Start Mercury and the following window appears: Figure 3.1 Mercury Main Window If you are starting the software for the first time, you will be asked if you want the Connection Wizard to open automatically each time you start Mercury. If you change your mind you can always change the settings under Settings-Options-Startup. 3.1 Select Recorder Type Mercury is compatible with other Star-Oddi instruments. A recorder type must be selected before connecting to the recorder. The default setting in the software is set to DST micro as a recorder type. Change the recorder type to your type of DST by doing the following: 1. Choose the File menu and the New Recorder Type command. 2. Select the appropriate DST as a recorder type. ©Star-Oddi 2015. All Rights Reserved Page 7 User Manual Gná Graphic Supporting Software Figure 3.2 Select a new Recorder Type Before connecting to the recorder, it is important that the clock on the PC computer is correct. This is important since the recorder automatically downloads the PC clock settings. 3.2 Configuration of the Communication Port If you are using the USB serial converter you will need to download and install the driver from www.star-oddi.com/downloads. The easiest way is to use the Connection Wizard. When opening the software the following window appears: Figure 3.3 Connection Wizard Connect the USB cable and the selected port will appear in the wizard pop-up window (see figure 3.3). ©Star-Oddi 2015. All Rights Reserved Page 8 User Manual Gná Graphic Supporting Software The serial port can also be defined manually in the following way: 1. Choose the Communication command in the Settings menu. The Communication definition dialog box appears. 2. Select a serial port for communications. 3. Choose the OK button. Figure 3.4 Communication Port Configuration After you plug in the USB cable you will see a new communication port in your device manager, called Prolific USB-to-Serial Comm Port. Make sure that the port is enabled and select the appropriate port in Mercury. Figure 3.5 USB Communication Port in Device Manager ©Star-Oddi 2015. All Rights Reserved Page 9 User Manual Gná Graphic Supporting Software Using the Serial Port To check which communication ports are available on your computer, open your Device Manager. On Windows XP you can do it following way: Control panel > system > hardware > device manager. Under Ports you can view all available ports. Make sure that the port you are intending to use is enabled: right-click on the appropriate port and select properties. Under Device usage it should state use this device (enable). Figure 3.6 Enable Communication Port ©Star-Oddi 2015. All Rights Reserved Page 10 User Manual Gná Graphic Supporting Software 4. Communication Box This chapter provides details concerning the Communication Box and how to place recorder in the box prior to connection. 4.1 Communication Box The DST Communication Box is a PC-RS-232C compatible communication interface, specially designed to communicate with DST recorders wirelessly via RF (radio frequency). A USB converter plug is optionally available for the Communication Box. The Communication Box has three diodes: 1. Red shows that power is fed from the power supply to the Communication Box. 2. Yellow shows that Mercury has made connection with the box and that correct COM port has been selected. 3. Green shows that recorder is in correct position for seeking connection. Connect the serial cable between the serial port of the computer and the Communication Box. Plug the power supply connection to a power-socket. The voltage from the power supply should be set to 9V, although there is no damage to use up to 20V. Before inserting the power plug into the box, it is important to note that the polarity should be: (O+ (minus on the outside and the plus on the inside) The polarity is usually shown where the arrows meet on the power plug, and the power supply. After the power supply has been connected to the Communication Box, the red light should be on. After Mercury has been started, the yellow light should be on (if correct COM port is selected). The box will power the recorder while communicating with the PC. In case the battery is dead, the PC and interface are still able to connect to the recorder and retrieve data. ©Star-Oddi 2015. All Rights Reserved Page 11 User Manual Gná Graphic Supporting Software 4.2 Connection Point In order to get the green light, the red and the yellow light must be on. The recorder is inserted into the hole of the box as shown in the figure below: DST Communication Box Figure 4.1 Inserting Recorder into the Communication Box If the recorder is wet/damp, then please wipe it dry before inserting it into the box. The spherical end of the recorder faces down and flat end faces up. When the green light is on, communication can be established with the software. If the recorder fails to connect, please refer to the Troubleshooter. 4.3 COM Connection Figure 4.2 Communication Definition Choose Settings-Communication-Serial Ports to display available ports (see figure 4.2). Com ports up to COM255 can be selected. ©Star-Oddi 2015. All Rights Reserved Page 12 User Manual Gná Graphic Supporting Software 4.4 Connection Wizard Figure 4.3 Connection Wizard Choose Wizards- Connection Wizard. Connect the USB cable and the selected port will appear in the wizard pop-up window (see figure 4.3). ©Star-Oddi 2015. All Rights Reserved Page 13 User Manual Gná Graphic Supporting Software 5 PAN The Personal Area Network (PAN) controller is the receiving module which is connected to a computer and Gná software. The PAN is connected to the computer using a serial cable and a USB converter. It receives signals from the RF box via MiWi and can handle up to 64 RF boxes. At all times the PAN needs to be connected to power via the accompanied AC adapter. 5.1 Setup & running Before connecting the PAN open the Gná software. The following window appears: Figure 5.1 Gná Interface In the lower left corner of the Gná interface there is a box that indicates the status of the PAN: The box has a yellow blinking light when a PAN or a RF-box is registered (connects for the first time) or if there is unidentified data on the selected COM-port. It turns green when the PAN is connected and verified. It turns red when the PAN is not responding. This usually happens because the PAN is not connected to the selected COM-port or there is no power supply. ©Star-Oddi 2015. All Rights Reserved Page 14 User Manual Gná Graphic Supporting Software Figure 5.2 PAN receiver The PAN is connected to the computer using a serial cable and a USB converter. Plug the power supply connection to a power-socket. How far the PAN can be placed away from the RF box varies greatly on the configuration of the lab but in most cases it will transmit about 20-30 meters. The PAN has two lights, red and green: Blinking green light: PAN checks if it is able to connect to the PC. Green light on: PAN connected to PC/Gná software. Blinking red light: PAN looks for available channels. 5.2 Configuration of the Communication Port It is necessary to define which serial port on your PC computer you will use for connecting the PAN. This is done in the following way: 4. Choose the COM Port command in the PAN menu. The COM Port dialog box appears. 5. Select a serial port for communications. 6. Choose the OK button. ©Star-Oddi 2015. All Rights Reserved Page 15 User Manual Gná Graphic Supporting Software Figure 5.3 Communication Port Configuration The user can then either utilize the PAN Scan feature or select the right COM port from the menu. Please make sure no other COM devices are connected. A yellow blinking light will appear in the box in the lower left corner when a PAN or a RF-box is registered (connects for the first time) or if there is unidentified data on the selected COM-port. Once the PAN is connected the box in the lower left corner will turn green (see figure 5.4). Figure 5.4 PAN connected ©Star-Oddi 2015. All Rights Reserved Page 16 User Manual Gná Graphic Supporting Software Regulatory approval This equipment has been tested and found to comply with the limits for a Class B digital device, pursuant to part 15 of the FCC Rules. These limits are designed to provide reasonable protection against harmful interference in a residential installation. This equipment generates, uses and can radiate radio frequency energy, and if not installed and used in accordance with the instructions, may cause harmful interference to radio communications. However, there is no guarantee that interference will not occur in a particular installation. If this equipment does cause harmful interference to radio or television reception, which can be determined by turning the equipment off and on, the user is encouraged to try to correct the interference by one or more of the following measures: Reorient or relocate the receiving antenna. Increase the separation between the equipment and receiver. Connect the equipment into an outlet on a circuit different from that to which the receiver is connected. Consult the dealer or an experienced radio/TV technician for help. ©Star-Oddi 2015. All Rights Reserved Page 17 User Manual Gná Graphic Supporting Software 6. RF box and antenna The antenna receives signals from the logger and transmits them to the RF box. The RF box then transmits the data to the Personal Area Network (PAN). Each cage will need a set of antenna and RF box. The antenna is attached to the bottom of the cage using, for example, Velcro® and then connected to the RF box (see figure 6.1). The RF box can also be attached to the cage using Velcro® Figure 6.1 RF box and antenna The RF box can work on battery power alone, the box is charged using the power supply that comes with the box. 6.1 Starting & running Connect the antenna to the RF box and switch the box on. The green light will stay on for 5 seconds after the box has been switched on. Once the RF box has been connected it will appear on the RF box table on the left side of the interface. The table also shows how much battery is left in the RF box and when the battery status was last updated (see figure 6.2). The RF box table can be cleared by selecting View-Clear RF-Box Battery. ©Star-Oddi 2015. All Rights Reserved Page 18 User Manual Gná Graphic Supporting Software The RF box has three lights, yellow, red and green (see figure 6.2): Figure 6.2 RF box Yellow light on: The RF Box is fully charged Yellow light blinking: The RF Box is charging Red light blinks eight times: RF box is checking all the channels. Red light blinks once: Battery is running low. Red light blinks three times: Transmission failed. Green light on: The RF box is connected. The light will stay on for 5 seconds after the box has been switched on. Green light blinks once: RF box receives a signal from the logger and forwards it to the PAN. Once the RF box has been connected it will appear on the RF box table on the left side of the interface (see figure 6.3). serial number is shown in the RF-Box column. The Battery column shows how much battery energy (%) is left in the RF-box. It will turn red if battery energy is less than 14%, blue if less than 50% and green if 50% or more. The Updated column shows date-time of last transmission. The column will turn: Red if more than 70min have elapsed since last transmission Blue if more than 15min have elapsed since last transmission Green if less than 15min have elapsed since last transmission The Data OK/Fail column is updated each time data is received, with accumulated number of OK data and faulty data. Each time Gna receives data, the whole table is illuminated for 2 sec, green if the data was received OK and yellow if faulty. ©Star-Oddi 2015. All Rights Reserved Page 19 User Manual Gná Graphic Supporting Software The RF box table can be cleared by selecting Clear RF-Box Battery in the View menu or by right-clicking on the table and selecting Clear All. Figure 6.3 RF box battery level Regulatory approval This equipment has been tested and found to comply with the limits for a Class B digital device, pursuant to part 15 of the FCC Rules. These limits are designed to provide reasonable protection against harmful interference in a residential installation. This equipment generates, uses and can radiate radio frequency energy, and if not installed and used in accordance with the instructions, may cause harmful interference to radio communications. However, there is no guarantee that interference will not occur in a particular installation. If this equipment does cause harmful interference to radio or television reception, which can be determined by turning the equipment off and on, the user is encouraged to try to correct the interference by one or more of the following measures: Reorient or relocate the receiving antenna. Increase the separation between the equipment and receiver. Connect the equipment into an outlet on a circuit different from that to which the receiver is connected. Consult the dealer or an experienced radio/TV technician for help. ©Star-Oddi 2015. All Rights Reserved Page 20 User Manual Gná Graphic Supporting Software 7. Working with groups and programming the logger Creating a group is a way to gather multiple measurement sequences which are part of the same research project into one group. In a group the user can track when the logger was started, the data retrieved and the data converted/reconverted. Furthermore, groups can be transferred to PatternFinder for further data analysis. Before implanting the DST nanoRF-T logger, the user must create a group for the logger sequences, set a new measurement sequence and start the logger. 7.1 Creating a group Select Group-New Group to create a new group (see figure 7.1). Figure 7.1 Group menu Please note that it is also possible to create a new group by clicking the New Group button in the group view pane. The following window appears: Figure 7.2 New Group Name the group and enter a description. The group file will be saved under the directory: C:\Mercury\Groups. Each group has its own subfolder where data files from ©Star-Oddi 2015. All Rights Reserved Page 21 User Manual Gná Graphic Supporting Software each sequence in the group are stored, this way the data can be accessed from PatternFinder and Gná. Open Group Select Open Group to open the Group directory. It is also possible to open the directory by clicking the Open Group button in the group view pane. Once a group has been selected the group view pane appears: Figure 7.3 Group view 7.2 Connecting and programming the logger Connect the Communication Box as described in chapter 4. Insert the DST into the box, the selected com port will turn green in the Connection Wizard window. Figure 7.4 Connection Wizard ©Star-Oddi 2015. All Rights Reserved Page 22 User Manual Gná Graphic Supporting Software You can either click once on the selected port and select Next or double-click on the port. If you are not using the wizard choose the Recorder menu and the Connect command. The window in figure 7.5 appears. Figure 7.5 Connecting and Retrieving Once the connection has been established, a window appears with information on the 7.6). Figure 7.6 Connecting to the Recorder Press OK. The Recorder is now on-line, as indicated at the bottom of the Mercury window. ©Star-Oddi 2015. All Rights Reserved Page 23 User Manual Gná Graphic Supporting Software If you have selected to use the Connection Wizard, the following window appears: Figure 7.7 Recorder Wizard Mercury checks which version of firmware is in the recorder. If the software does not recognize the firmware the user will be asked to update Mercury as there might be a new functionality in the firmware which Mercury does not support. Set new measurement parameters Select Program and start recorder in the wizard or choose the Edit menu and the New Measurement Sequence Definition command. The following window appears: Figure 7.8 Set New Measurement Sequence ©Star-Oddi 2015. All Rights Reserved Page 24 User Manual Gná Graphic Supporting Software Select the start time of recordings (date-month-year, hours-minutes). The minimum measurement interval time for the DST nanoRF-T is one minute. Set the sampling interval (hours-minutes). It is possible to select primary/secondary parameters. When selecting Normal T +RF the logger records temperature and stores the data in its memory and transmits the data to Gná at the same intervals. When selecting Temperature as primary the user has the option of saving battery life by having the logger transmit data to Gná at fewer intervals. For example, if 3 is defined as secondary counter the logger will only transmit the data to Gná every third time when a measurement is recorded. Under RF Options there are two features. Use minutes shift, in cross talk reduction allows the user to reduce cross talk by shifting the start time by one minute. By selecting Blink with each transmission a blinking light will appear in the logger each time it transmits data. Under Estimated Meas. Period enter the number of days you estimate the measuring will take. If the user wants to program several recorders with the same sampling interval and start time, it is recommended to select Multi mode. By choosing Multi mode, the settings are fixed; giving each recorder connected to thereafter, the same settings. The recorders connected to, following the first recorder; automatically get the same settings as the first recorder. This saves time in the programming process. The multi mode can be deactivated by clicking Cancel when connecting to the recorder (see figure 7.9). Figure 7.9 Multi Start Mode The three buttons Use Template, Use Sequence, and Previous are not commonly used, but can be handy when wanting to use a previously programmed sequence. After the settings have been selected, press the OK button. ©Star-Oddi 2015. All Rights Reserved Page 25 User Manual Gná Graphic Supporting Software Start a new measurement sequence If you are using the wizard, the software will automatically start the new measurement sequence (start recording) and disconnect the logger. If you are not using the wizard choose the Recorder menu and Start New Measurement Sequence command. The window in figure 7.10 appears. Figure 7.10 Start New Measurement Sequence Once the new measurement sequence has been downloaded into the recorder, a window appears on the screen in order to verify the settings (see figure 7.11). Figure 7.11 Start New Measurement Sequence ©Star-Oddi 2015. All Rights Reserved Page 26 User Manual Gná Graphic Supporting Software When starting the new sequence the following window appears: Figure 7.12 Add Sequence to Group Set an alias for the sequence and enter a description. Click OK and the sequence will be added to the group previously created (see figure 7.13). If a group is open when starting up a logger the new measurement sequence will be automatically registered in the group. If no group is open the sequence will not be registered in any group. Figure 7.13 Group view pane Press OK and the recorder will be in Measurement Mode. ©Star-Oddi 2015. All Rights Reserved Page 27 User Manual Gná Graphic Supporting Software 7.3 Send group to Gná In order to monitor the online measurements after the loggers have been set up for measuring, the user needs to start up the Gná software and send the group from Mercury to Gná. Select Group-Send Group To-Send to Gná in Mercury to transfer a group to Gná. It is also possible to transfer a group by clicking the Send Group to button the group view pane. in Figure 7.14 Send Group The Gná software will open automatically: Figure 7.15 Group sent to Gná ©Star-Oddi 2015. All Rights Reserved Page 28 User Manual Gná Graphic Supporting Software In the green box on the left side of the interface the user can see how many loggers are online. The number in the red box represents how many loggers have not transmitted data to Gná recently (see figure 7.16). Figure 7.16 Online loggers To open a graph, right click on the group and select Display Graph (see figure 7.17). Figure 7.17 Display graph The group graph appears: Figure 7.18 Graph ©Star-Oddi 2015. All Rights Reserved Page 29 User Manual Gná Graphic Supporting Software The table in the graph window gives an overview of the loggers, measurement number, recording time, number of received measurements and temperature values (see figure 7.19). Figure 7.19 Table To open a specific logger graph double click on the logger you want to view in the table. Figure 7.20 logger graph Please see chapter 8 for more information on how to monitor the online measurements in Gná. ©Star-Oddi 2015. All Rights Reserved Page 30 User Manual Gná Graphic Supporting Software 7.4 Downloading data in Mercury Once the research has been conducted and the loggers retrieved from the subjects, the user can download data from the loggers in Mercury. When connecting to a logger after a measurement period, the following window appears: Figure 7.21 Retrieve recorder data Click Yes if you wish to retrieve the data, click No if you would like to retrieve it later. If you want the software to automatically retrieve data upon connection, check the Remember this setting option. Select Retrieve Recorder Data in the wizard. If you are not using the wizard choose the Recorder menu and the Retrieve Data command. The window in figure 7.22 appears. Figure 7.22 Retrieve Data from Recorder ©Star-Oddi 2015. All Rights Reserved Page 31 User Manual Gná Graphic Supporting Software The window in figure 7.22 shows the data retrieval progress in bytes, time elapsed and number of packs received. Data will be uploaded from the recorder and presented in graphical and tabular form. With default settings, Mercury automatically creates a sub-directory in the Mercury directory, named after the DST type. In the DST type directory, a directory named after nnnn is created; N is the letter for DST nano. All files related to the recorder are automatically saved in the serial number directory. The default data directory can be viewed in the Settings menu, and Directories. The user has the option to define a new data directory path if desired. The data is retrieved in a non-destructive manner. This means that you can repeatedly read the data without erasing it from the memory. Each time data is retrieved, a new file will automatically be created. The name of the data file consists of the measurement sequence number and the serial number of the recorder. The recorder cannot be loaded with new settings if it contains data that has not been retrieved. This is a safety feature which prevents data from being accidentally lost. New recordings overwrite previous recordings that have been retrieved. Once the data has been retrieved the following window appears: Figure 7.23 Recorder wizard If you wish to start a new measurement sequence you can either program the logger with a new measurement sequence by selecting Program and start recorder or Restart recorder with the same sampling interval. ©Star-Oddi 2015. All Rights Reserved Page 32 User Manual Gná Graphic Supporting Software Disconnect After the recorder has been set up for measuring, it should be removed from the Communication Box. If the recorder is not put in measurement mode, it will automatically go into sleep mode when removed from the box. If you simply remove the tag Mercury will still have the recorder in on-line mode in the r recorder or using certain options. Select Recorder > Disconnect to go into off-line mode. View Data If data is retrieved from the recorder, a new file will automatically be created and opened in graphical and tabular form. To open existing data files on the computer, choose the File menu, Select Recorder command, and then the Select Measurement command. When a data file has been opened, a new window appears with the data shown as a chart and a table. For more information, please see the Mercury user manual. ©Star-Oddi 2015. All Rights Reserved Page 33 User Manual Gná Graphic Supporting Software 8. On-line monitoring This chapter describes the options available in Gná for viewing the data. 8.1 Buttons When the chart is opened, buttons related to the chart are displayed. Figure 8.1 logger graph Print Chart Click the Print Chart button and the following window will appear: ©Star-Oddi 2015. All Rights Reserved Page 34 User Manual Gná Graphic Supporting Software Figure 8.2 Print Preview Orientation The chart can be printed in either portrait or landscape format. Margins -scaled. The margins can be varied by either changing the numbers given for the left, right, top and bottom margins, or by moving the margin lines with the mouse by pressing and holding the left button as the lines are dragged. Move When the cursor is located on the chart, a hand becomes visible. By clicking on the graph and holding down the left button of the mouse, the graph can be moved around the page to a desired position. Details The size of horizontal and vertical gridlines as well as the texts on the X and Y-axis can be re-scaled by using the scroll bar. The number of gridlines is increased when the bar is moved to the left. Export Data Export the data to other programs. Data will be exported in comma separated values (.CSV). ©Star-Oddi 2015. All Rights Reserved Page 35 User Manual Gná Graphic Supporting Software Scroll automatically to new data This button gives the option of viewing the most recent data. This feature is on by default. Data Point Marker This button gives the option of displaying/hiding data points in the chart. Adjust Axis This button adjusts the axis in order to display all data within the zoomed timeline. Active Series List This button can be useful when working with a multi-sensor recorder, in order to select which parameters to display in the chart. For example, when working with a chart displaying temperature recordings, the user can hide the temperature line in the graph. Click the button and the following window appears: Figure 8.3 Series list ©Star-Oddi 2015. All Rights Reserved Page 36 User Manual Gná Graphic Supporting Software By selecting Only show active table columns only the selected series will be displayed in the chart table. The table columns can also been changed manually by clicking on the table header (see figure 8.4). Figure 8.4 Table 8.2 Using the Mouse Zoom The chart can be zoomed in on by holding down the left button of the mouse, and using the cursor to create a box to the right, around the desired area to zoom in on. The user can also zoom both in and out by using the mouse wheel Scroll the Chart The chart can be scrolled upward, downwards and to the sides, by holding down the right button of the mouse and moving the cursor in the desired direction. Go back to initial View To go back to the initial view of the chart, simply hold down the left button of the mouse and make a box to the left with the cursor. The position of the box on the chart is irrelevant. ©Star-Oddi 2015. All Rights Reserved Page 37 User Manual Gná Graphic Supporting Software 8.3 View menu Temperature Select View-Temperature to define whether degrees Celsius, Fahrenheit or Kelvin are used as a unit for temperature measurements. The measurements can also be viewed as Raw Measurements (see figure 8.5). Figure 8.5 Temperature units ©Star-Oddi 2015. All Rights Reserved Page 38 User Manual Gná Graphic Supporting Software 9. Wizard and Help menu There is one wizard in Gná. 9.1 Launch Mercury Telemetry Wizard Open the Wizard menu and select Launch Mercury Telemetry Wizard. The Mercury software opens The wizard goes through all the necessary procedures for starting the DST nanoRF-T logger (see figure 9.1). Figure 9.1 RF-Wizard 9.2 Help menu Choose Help and the following window appears: Figure 9.2 Help menu ©Star-Oddi 2015. All Rights Reserved Page 39 User Manual Gná Graphic Supporting Software Manual Select Manual to open the SO Telemetry user manual, micro-RF to open the DST microRF-T user manual and nano-RF to open the DST nanoRF-T user manual. ©Star-Oddi 2015. All Rights Reserved Page 40